Introduction
Carbon-14 (14C) is a pure beta-emitting radionuclide with a half-life of 5730 ± 40 yr and an end-point energy of 156 keV (Godwin Reference Godwin1962). Its natural production occurs in the upper layers of the atmosphere due to the interaction of cosmic ray-induced neutrons with the nitrogen atoms at a rate of 1.54 × 10¹⁵ Bq yr– 1 (Libby Reference Libby1946; UNSCEAR 2017, 2000). This results in a long-term average 14C specific activity of 226 ± 1 Bq kg–1C in the atmospheric air and living matter. The natural inventory of 14C in the environment is estimated to be 1.4×10⁸ GBq (IAEA 2004). Atmospheric nuclear tests in the 1950s and 1960s, termed the “bomb effect” (Levin et al. Reference Levin, Kromer, Schoch-Fischer, Bruns, Münnich, Berdau, Vogel and Münnich1985), added approximately 2.2×10¹⁷ Bq of 14C into the atmosphere. Due to this, there was a significant increase in the atmospheric 14C specific activity, reaching about twice the natural activity in the Northern Hemisphere in 1963 (Levin et al. Reference Levin, Kromer, Schoch-Fischer, Bruns, Münnich, Berdau, Vogel and Münnich1985; UNSCEAR 1993, 2000). However, due to mixing with the biosphere, absorption in the oceans, and an increase in the 14C depleted carbon concentration in the atmosphere due to the burning of fossil fuels, the 14C specific activity decreased steadily (Levin and Hesshaimer Reference Levin and Hessheimer2000). As of today, the 14C specific activity in the clean air region (a region with minimal or no anthropogenic sources of 14C) is quantified to be 226 ± 1 Bq kg–1C (ASTM International 2022; Karunakara et al. Reference Karunakara, D’Souza, Nayak, Bharath, Krishnan, Dileep and Ravi2023; Krajcar Bronić et al. Reference Krajcar Bronić, Barešić, Sironić and Borković2020; Krishnan et al. Reference Krishnan, Bharath, Sharma, Kumar, Chopra, Reshmi, Sudheesh and Karunakara2023).
Discharges from nuclear facilities such as nuclear power plants (NPPs) and fuel processing facilities may increase local ambient background 14C-specific activity. In NPPs, the 14C is produced by the neutron activation of stable isotopes of carbon, nitrogen and oxygen present in the reactor’s moderator, fuel, coolant, cladding and structural materials. A fraction of this 14C inventory is discharged into the environment in oxidized form (14CO2) and reduced form (14CH4). In fuel processing facilities, the 14C is released to the environment mainly in oxide form at the dissolution stage. Data on the extent of release of 14C in different forms for different types of NPPs are tabulated in an IAEA publication (IAEA 2004). Long-term environmental surveillance programs in the public domain around NPP sites in France (Roussel-Debet et al. Reference Roussel-Debet, Gontier, Siclet and Fournier2006), Romania (Popoaca et al. Reference Popoaca, Bucur and Simionov2014) and the Czech Republic (Povinec et al. Reference Povinec, Šivo, Ješkovský, Svetlik, Richtáriková and Kaizer2015) showed that the dose to the population due to 14C release from power plants was up to 3 µSv yr– 1. Since carbon is an inevitable constituent of all living organisms, 14C is easily assimilated into the carbon cycle and follows biochemical processes as stable carbon isotopes. Therefore, monitoring of 14C in the environment of a nuclear facility is essential.
A review of the literature reveals that a large number of publications have reported measurements of the 14C specific activity in terrestrial biotas, such as tree growth rings, plants, moss, lichen, etc., in the vicinity of nuclear facilities; some of the important publications include the following: Baydoun et al. (Reference Baydoun, El Samad, Nsouli and Younes2015), Chuang et al. (Reference Chuang, Tsai, Guo and Chang2015), D’Souza et al. (Reference D’Souza, Nayak, Mohan, Bharath, Krishnan, Kamath, Diéguez, Agulló, Gómez-Martínez, Santos-Arévalo, García-Tenorio and Karunakara2021), Karunakara et al. (Reference Karunakara, D’Souza, Nayak, Bharath, Krishnan, Dileep and Ravi2023), Magnusson et al. (Reference Magnusson, Stenström, Skog, Adliene, Adlys, Hellborg, Olariu, Zakaria, Rääf and Mattsson2004), Mazeika et al. (Reference Mazeika, Petrosius and Pukiene2008), Sheppard et al. (Reference Sheppard, Amiro, Sheppard, Stephenson, Zach and Bird1994), Singleton et al. (Reference Singleton, Sanchez and Woods2002), Stenström et al. (Reference Stenström, Skog, Adliene, Adlys, Hellborg, Olariu, Zakaria, Rääf and Mattsson2004), and Wang et al. (Reference Wang, Xiang and Guo2012). Similarly, several publications have reported 14C specific activity in the atmospheric air in the vicinity of nuclear facilities, for example, Baburajan et al. (Reference Baburajan, Dalvi, Sudheendran, Varakhedkar, Saradhi, Ravi and Karunakara2020), Bharath et al. (Reference Bharath, Krishnan, D’Souza, Nayak, Ravi, Sharma, Kumar, Chopra and Karunakara2021), Joshi et al. (Reference Joshi, Ramamirtham and Soman1987), Krajcar Bronić et al. (Reference Krajcar Bronić, Horvatinčić, Barešić and Obelić2009), Nydal et al. (Reference Nydal and Lövseth1996), Otlet et al. (Reference Otlet, Fulker and Walker1992), and Povinec et al. (Reference Povinec, Šáro, Chudý and Šeliga1968).
However, studies examining the soil and sediment matrices are few despite these matrices being the most significant carbon reservoirs. The studies found in the literature are Atarashi et al. (Reference Atarashi-Andoh, Amano, Guo and Arakhatoon2003), Barisevičiūtė et al. (Reference Barisevičiūtė, Maceika, Ežerinskis, Šapolaitė, Butkus, Mažeika, Rakauskas, Juodis, Steponėnas, Druteikienė and Remeikis2020), Dias et al. (Reference Dias, Telles, Santos, Stenström, Nícoli, Correa and Skog2009), Eyrolle et al. (Reference Eyrolle, Lepage, Copard, Ducros, Claval, Saey, Cossonnet, Giner and Mourier2018), Magnusson et al. (Reference Magnusson, Stenström, Adliene, Adlys, Dias, Rääf, Skog, Zakaria and Mattsson2007), Mazeika et al. (Reference Mazeika, Petrosius and Pukiene2007), Milton et al. (Reference Milton, Kramer, Brown, Repta, King and Rao1995), and Ward et al. (Reference Ward, Snow, Olson, Ball and Adamic2018). According to Koarashi et al. (Reference Koarashi, Fujita, Watanabe and Sumiya2011), the 14C produced due to the atmospheric nuclear weapon testing is retained in the organic matter of surface soil layers and is still being released into the atmosphere through microbial decomposition and, therefore, the soil matrix could act as a potential secondary source of 14C emission to the atmosphere. The sediment is also a substantial carbon reservoir as the organic matter accumulates and is stored over time. Investigating the 14C specific activity in the soil and sediment matrix in the vicinity of NPPs is essential to evaluate the extent of accumulation of anthropogenic 14C and the possible impact on the environment.
Accelerator mass spectrometry (AMS) is the benchmark method for the determination of 14C specific activity in all types of samples (Barisevičiūtė et al. Reference Barisevičiūtė, Maceika, Ežerinskis, Šapolaitė, Butkus, Mažeika, Rakauskas, Juodis, Steponėnas, Druteikienė and Remeikis2020; Buzinny et al. Reference Buzinny2006; Dias et al. Reference Dias, Telles, Santos, Stenström, Nícoli, Correa and Skog2009; Eyrolle et al. Reference Eyrolle, Lepage, Copard, Ducros, Claval, Saey, Cossonnet, Giner and Mourier2018; Magnusson et al. Reference Magnusson, Stenström, Adliene, Adlys, Dias, Rääf, Skog, Zakaria and Mattsson2007; Mazeika et al. Reference Mazeika, Petrosius and Pukiene2008; Stenström et al. Reference Stenström1995; Ward et al. Reference Ward, Snow, Olson, Ball and Adamic2018). The other commonly applied methods are (i) benzene synthesis method: in which the sample is subjected to thermal oxidation at high temperatures, the CO2 produced (oxides 12C, 13C and 14C, after this, referred to as CO2 species) is converted into benzene, and the beta activity is determined in a liquid scintillation counting (LSC) system (Culp et al. Reference Culp, Cherkinsky and Prasad2014; Mazeika et al. Reference Mazeika, Petrosius and Pukiene2007; Singleton et al. Reference Singleton, Sanchez and Woods2002), and (ii) direct method: in which the CO2 species produced from the combustion of the sample is absorbed in a suitable absorber and the activity is measured using LSC (Atarashi et al. Reference Atarashi-Andoh, Amano, Guo and Arakhatoon2003; Blowers et al. Reference Blowers, Caborn, Dell, Gingell, Harms, Long, Sleep, Stewart, Walker and Warwick2011; Chuang et al. Reference Chuang, Tsai, Guo and Chang2015; Horvatinčić et al. Reference Horvatinčić, Barešić, Krajcar Bronić and Obelić2004; Krajcar Bronić et al. Reference Krajcar Bronić, Horvatinčić, Barešić and Obelić2009; Milton et al. Reference Milton, Kramer, Brown, Repta, King and Rao1995; Noakes et al. Reference Noakes, Norton, Culp, Nigam, Dvoracek, Chałupnik, Schönhofer and Noakes2006; Singleton et al. Reference Singleton, Sanchez and Woods2002; Vagner et al. Reference Vagner, Varlam, Faurescu, Bogdan and Faurescu2019; Woo et al. Reference Woo, Cho, Chun, Kim, Kang and Kim1999).
The majority of the studies found in the literature on 14C specific activity in soil and sediment were based on AMS measurements (Barisevičiūtė et al. Reference Barisevičiūtė, Maceika, Ežerinskis, Šapolaitė, Butkus, Mažeika, Rakauskas, Juodis, Steponėnas, Druteikienė and Remeikis2020; Dias et al. Reference Dias, Telles, Santos, Stenström, Nícoli, Correa and Skog2009; Eyrolle et al. Reference Eyrolle, Lepage, Copard, Ducros, Claval, Saey, Cossonnet, Giner and Mourier2018; Magnusson et al. Reference Magnusson, Stenström, Adliene, Adlys, Dias, Rääf, Skog, Zakaria and Mattsson2007; Ward et al. Reference Ward, Snow, Olson, Ball and Adamic2018). On the other hand, Mazeika et al. (Reference Mazeika, Petrosius and Pukiene2007) employed benzene synthesis and the LSC method, whereas Milton et al. (Reference Milton, Kramer, Brown, Repta, King and Rao1995) and Atrarashi et al. (Reference Atarashi-Andoh, Amano, Guo and Arakhatoon2003) used the direct methods. The relative merits and demerits of these methods were discussed in detail in our previous publications (Bharath et al. Reference Bharath, Krishnan, D’Souza, Nayak, Ravi, Sharma, Kumar, Chopra and Karunakara2021; D’Souza et al. Reference D’Souza, Nayak, Mohan, Bharath, Krishnan, Kamath, Diéguez, Agulló, Gómez-Martínez, Santos-Arévalo, García-Tenorio and Karunakara2021). In brief, the AMS method is exceptionally sensitive, precise and accurate. Nonetheless, due to the complex sample preparation processes, time-intensive procedures and associated high costs, the AMS method is not preferred for analyzing environmental samples under the routine environmental surveillance programmes of the nuclear facilities. Hence, for applications that involve analyzing many environmental samples with specific activity similar to the ambient background levels or above, batch methods such as tube combustion systems (e.g., pyrolizer) have advantages.
Milton et al. (Reference Milton, Kramer, Brown, Repta, King and Rao1995) performed 14C measurements in soil samples collected at the Pickering nuclear generating station (Canada) by combusting in a tube furnace. The CO2 species produced from the combustion were trapped in a 4M NaOH solution and re-released through chemical methods to absorb in the Carbo-Sorb E – PermaFluor (PerkinElmer, USA) mixture for LSC analysis. This combustion system consisted of a single quartz work-tube and was not a batch method. In another study, Atarashi et al. (Reference Atarashi-Andoh, Amano, Guo and Arakhatoon2003) employed an oxygen combustion bomb for combusting soil samples collected near the Tokai NPP (Japan) for the 14C determination.
The objective of the present study is to examine the suitability of a tube combustion system (Pyrolyser-Trio, Raddec International, UK) for batch thermal oxidation of the soil and sediments to prepare the sample for LSC for the determination of 14C specific activity and quantifying the excess specific activity in the proximity of NPPs. This system and the associated methodology suggested by the manufacturer for “online” trapping of CO2 species released from the thermal oxidation of the sample in a suitable amine-based absorber (such as carbon count, Meridian Biotechnologies LTD, UK or Carbo-Sorb E, PerkinElmer, USA) is primarily developed for determination of 14C specific activity well above the ambient background levels. In a previous study, we significantly improved the manufacturer-suggested method to accurately determine 14C specific activity well below the ambient background level (D’Souza et al. Reference D’Souza, Nayak, Mohan, Bharath, Krishnan, Kamath, Diéguez, Agulló, Gómez-Martínez, Santos-Arévalo, García-Tenorio and Karunakara2021). In the improved method, the CO2 species produced from the combustion (thermal oxidation) of the sample were isolated from the combustion products through cryogenic trapping and then absorbed in the absorber (Carbo-Sorb E) through an off-line transfer process. The advantages of the improved method and its application for 14C specific activity determination in environmental biota samples were demonstrated in previous publications (D’Souza et al. Reference D’Souza, Nayak, Mohan, Bharath, Krishnan, Kamath, Diéguez, Agulló, Gómez-Martínez, Santos-Arévalo, García-Tenorio and Karunakara2021; Karunakara et al. Reference Karunakara, D’Souza, Nayak, Bharath, Krishnan, Dileep and Ravi2023). However, its applications in analyses of environmental matrices with low carbon content, such as soil and sediment, have not been reported previously.
In this work, we have explored using a pyrolyzer tube combustion system to analyse soil and sediment samples. The combustion of soil and sediment matrices for 14C determination is challenging because (i) they have lower carbon contents when compared to biological samples and, therefore, a large mass of the sample should be efficiently combusted for obtaining adequate CO2 species to saturate the absorber, and (ii) the temperature profile to be maintained for the efficient combustion of these matrices for the oxidation of carbon species to CO2 species differ when compared to organic samples. Upon standardisation of the combustion processes, absorption of produced CO2 species in NaOH, and subsequent chemical treatments for preparing the sample for LSC, several soil and sediment samples collected at different locations in the public domain around the pressurized heavy water reactor (PHWR) NPP at Kaiga (Kaiga NPP), India, were analyzed to establish data on excess 14C specific activity. The validation of the method was performed through analysis of the samples using the AMS method. In previous studies, we have reported 14C specific activity in the atmospheric and terrestrial environmental matrices in the vicinity of the Kaiga NPP (Bharath et al. Reference Bharath, Krishnan, D’Souza, Nayak, Ravi, Sharma, Kumar, Chopra and Karunakara2021; D’Souza et al. Reference D’Souza, Nayak, Mohan, Bharath, Krishnan, Kamath, Diéguez, Agulló, Gómez-Martínez, Santos-Arévalo, García-Tenorio and Karunakara2021; Karunakara et al. Reference Karunakara, D’Souza, Nayak, Bharath, Krishnan, Dileep and Ravi2023). In addition, the atmospheric 14C release rates in oxide (14CO2) and reduced (14CH4) forms through the gaseous stacks of the Kaiga NPP were reported in another publication (Bharath et al. Reference Bharath, Krishnan, D’Souza, Nayak, Dileep, Ravi, Managavi, Salunke, Veerendra and Karunakara2022).
About Kaiga NPP site and environment
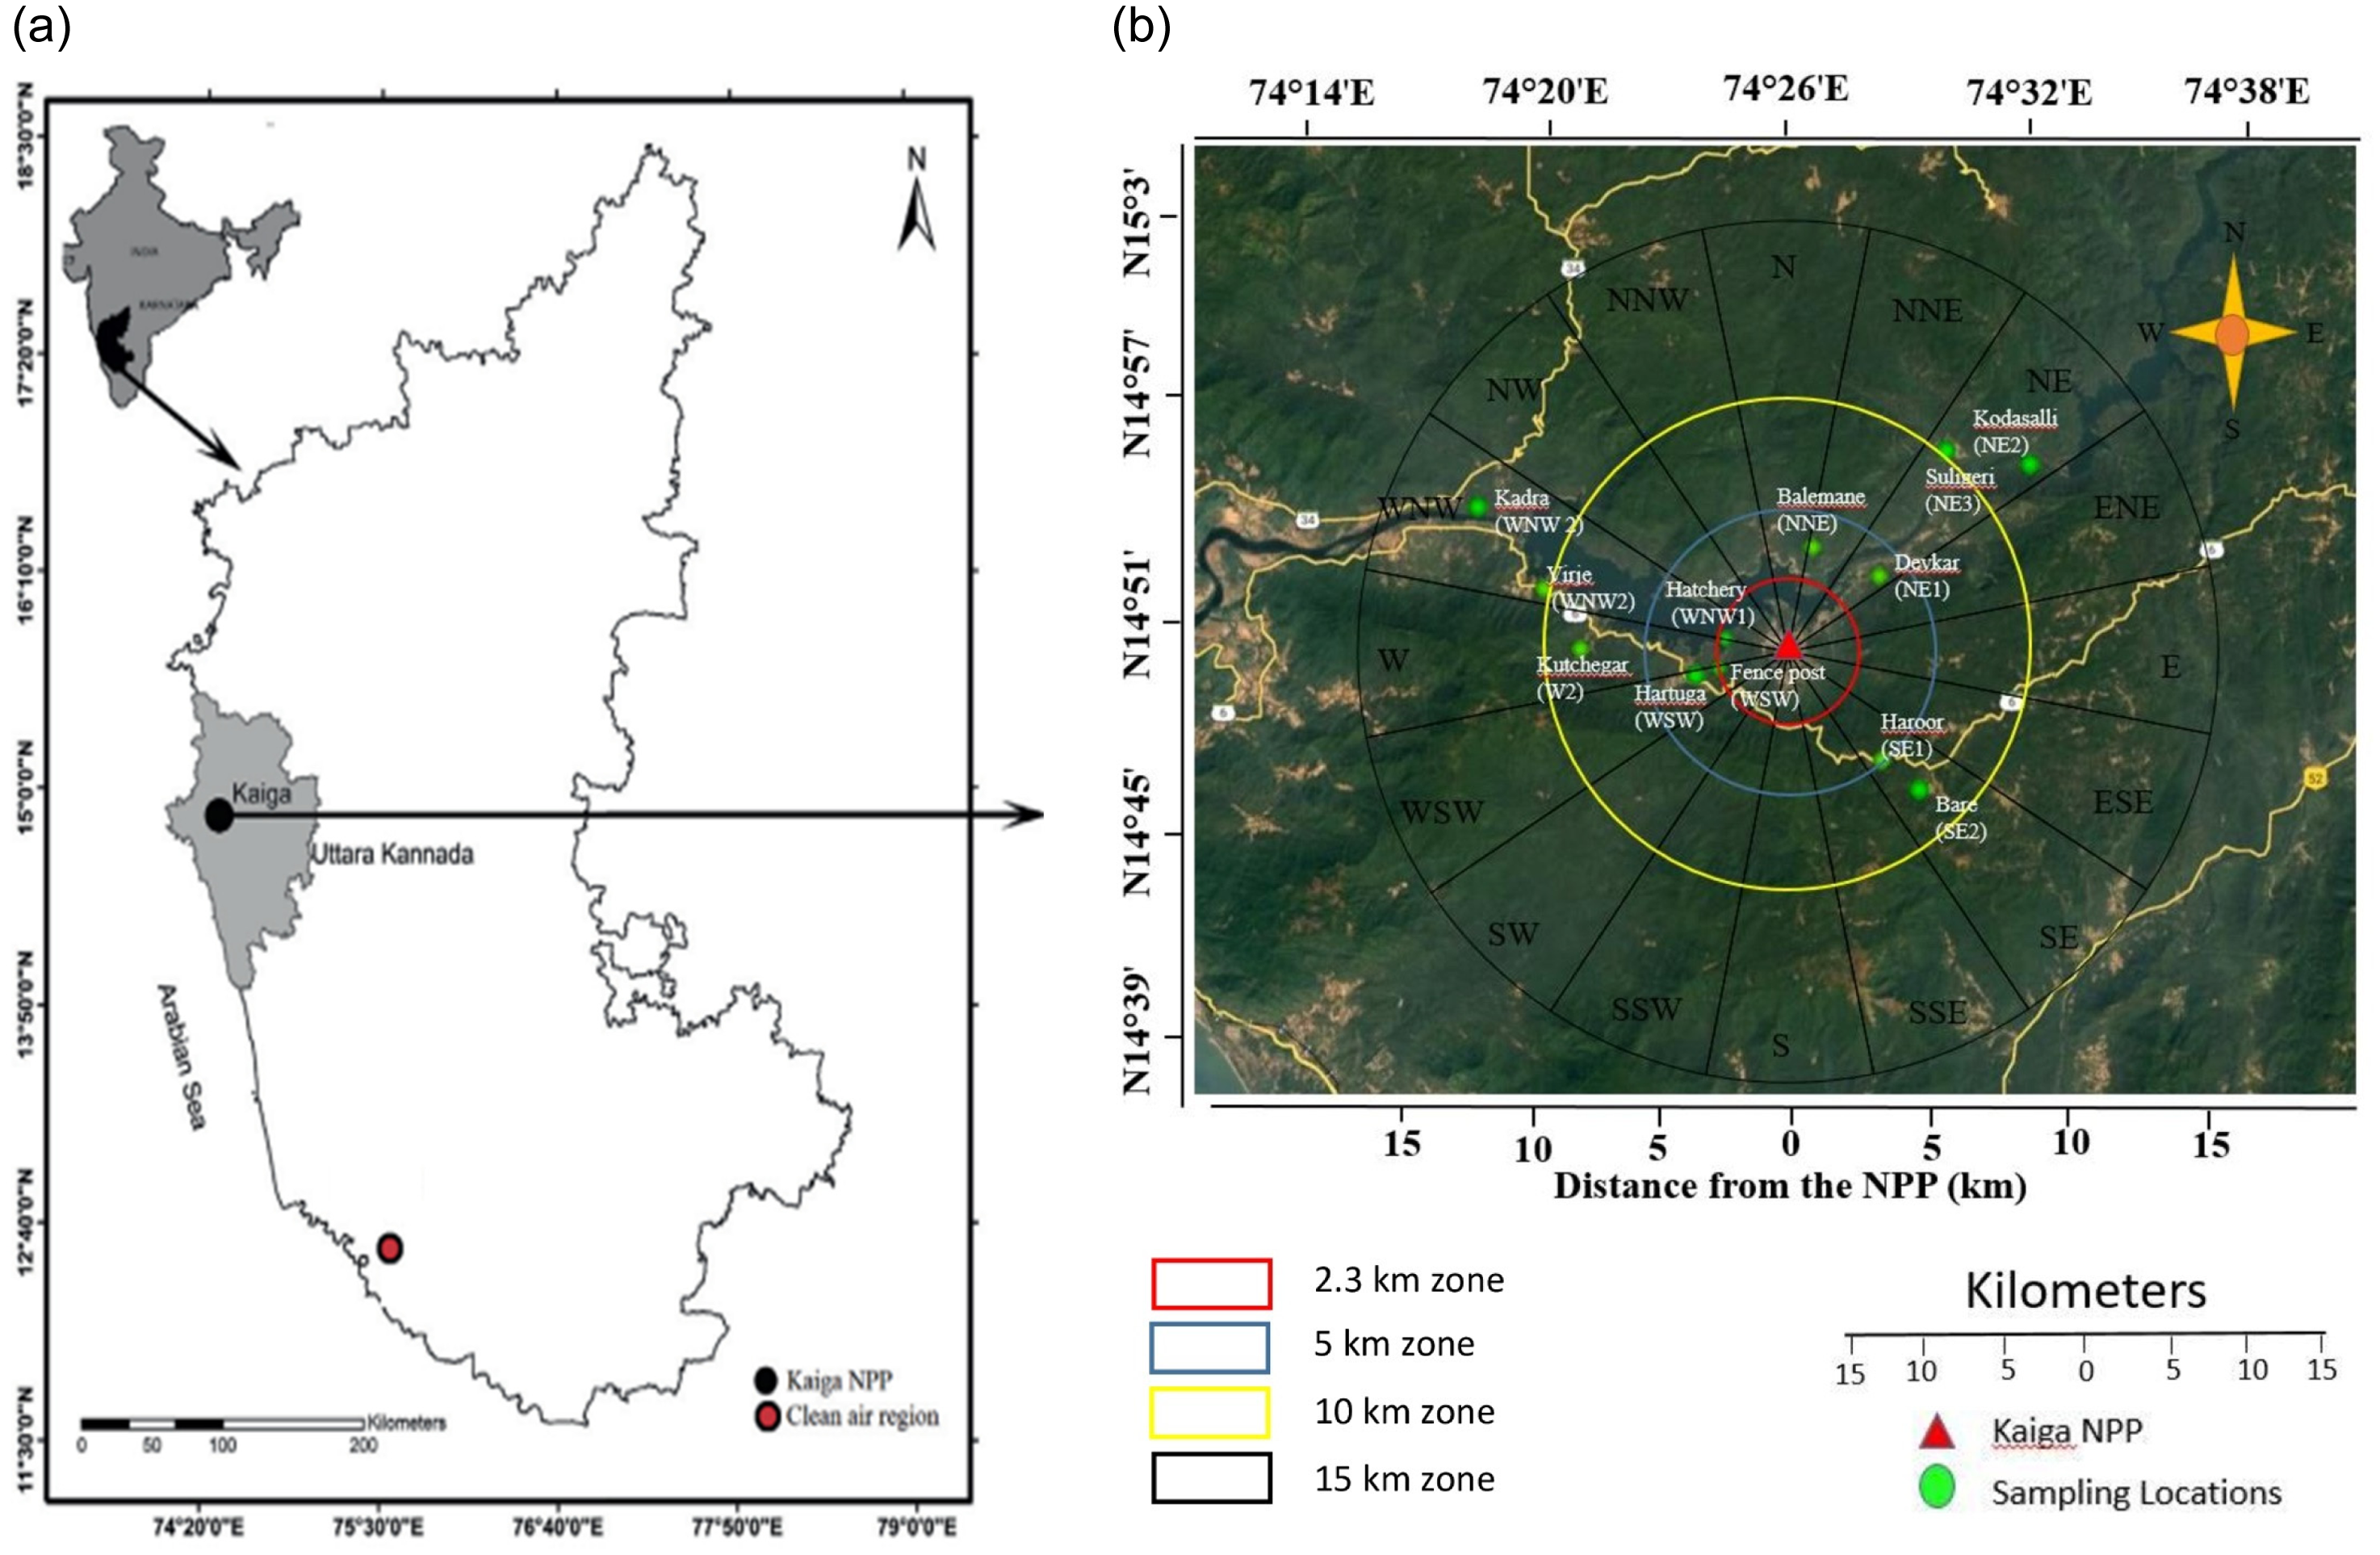
Kaiga NPP (latitude of 14.86° N and longitude of 74.44° E) is located in Kaiga village of Uttara Karnataka district of Karnataka, at a distance of 56 km from the west coast town of Karwar (Figure 1). This NPP is located on the left bank of the Kali River, a peninsular river originating in the Western Ghats that discharges its water in the Arabian Sea. Four PHWRs, each of 220 MWe, are operating at this site. Units 1 and 2 started power production in 1999, and units 3 and 4 in 2007 and 2011, respectively. Two additional units of 700 MWe each are being constructed to enhance its total electricity production capacity to 2.28 GWe. The PHWRs operating at this site use natural uranium as fuel and heavy water (D2O) as the neutron moderator, coolant, and reflector. Kadra dam, built on Kali River at 10 km on the downstream side, serves as the necessary water for the condenser cooling system of the reactor. The airborne release is through two stacks (stack 1 for units 1 and 2, stack 2 for units 3 and 4), each 100 m in height.
(a) Map showing the location of Kaiga PHWR NPP (left); (b) Enlarged map of the Kaiga region with monitoring stations identified for the study in different sectors around the Kaiga NPP (right).

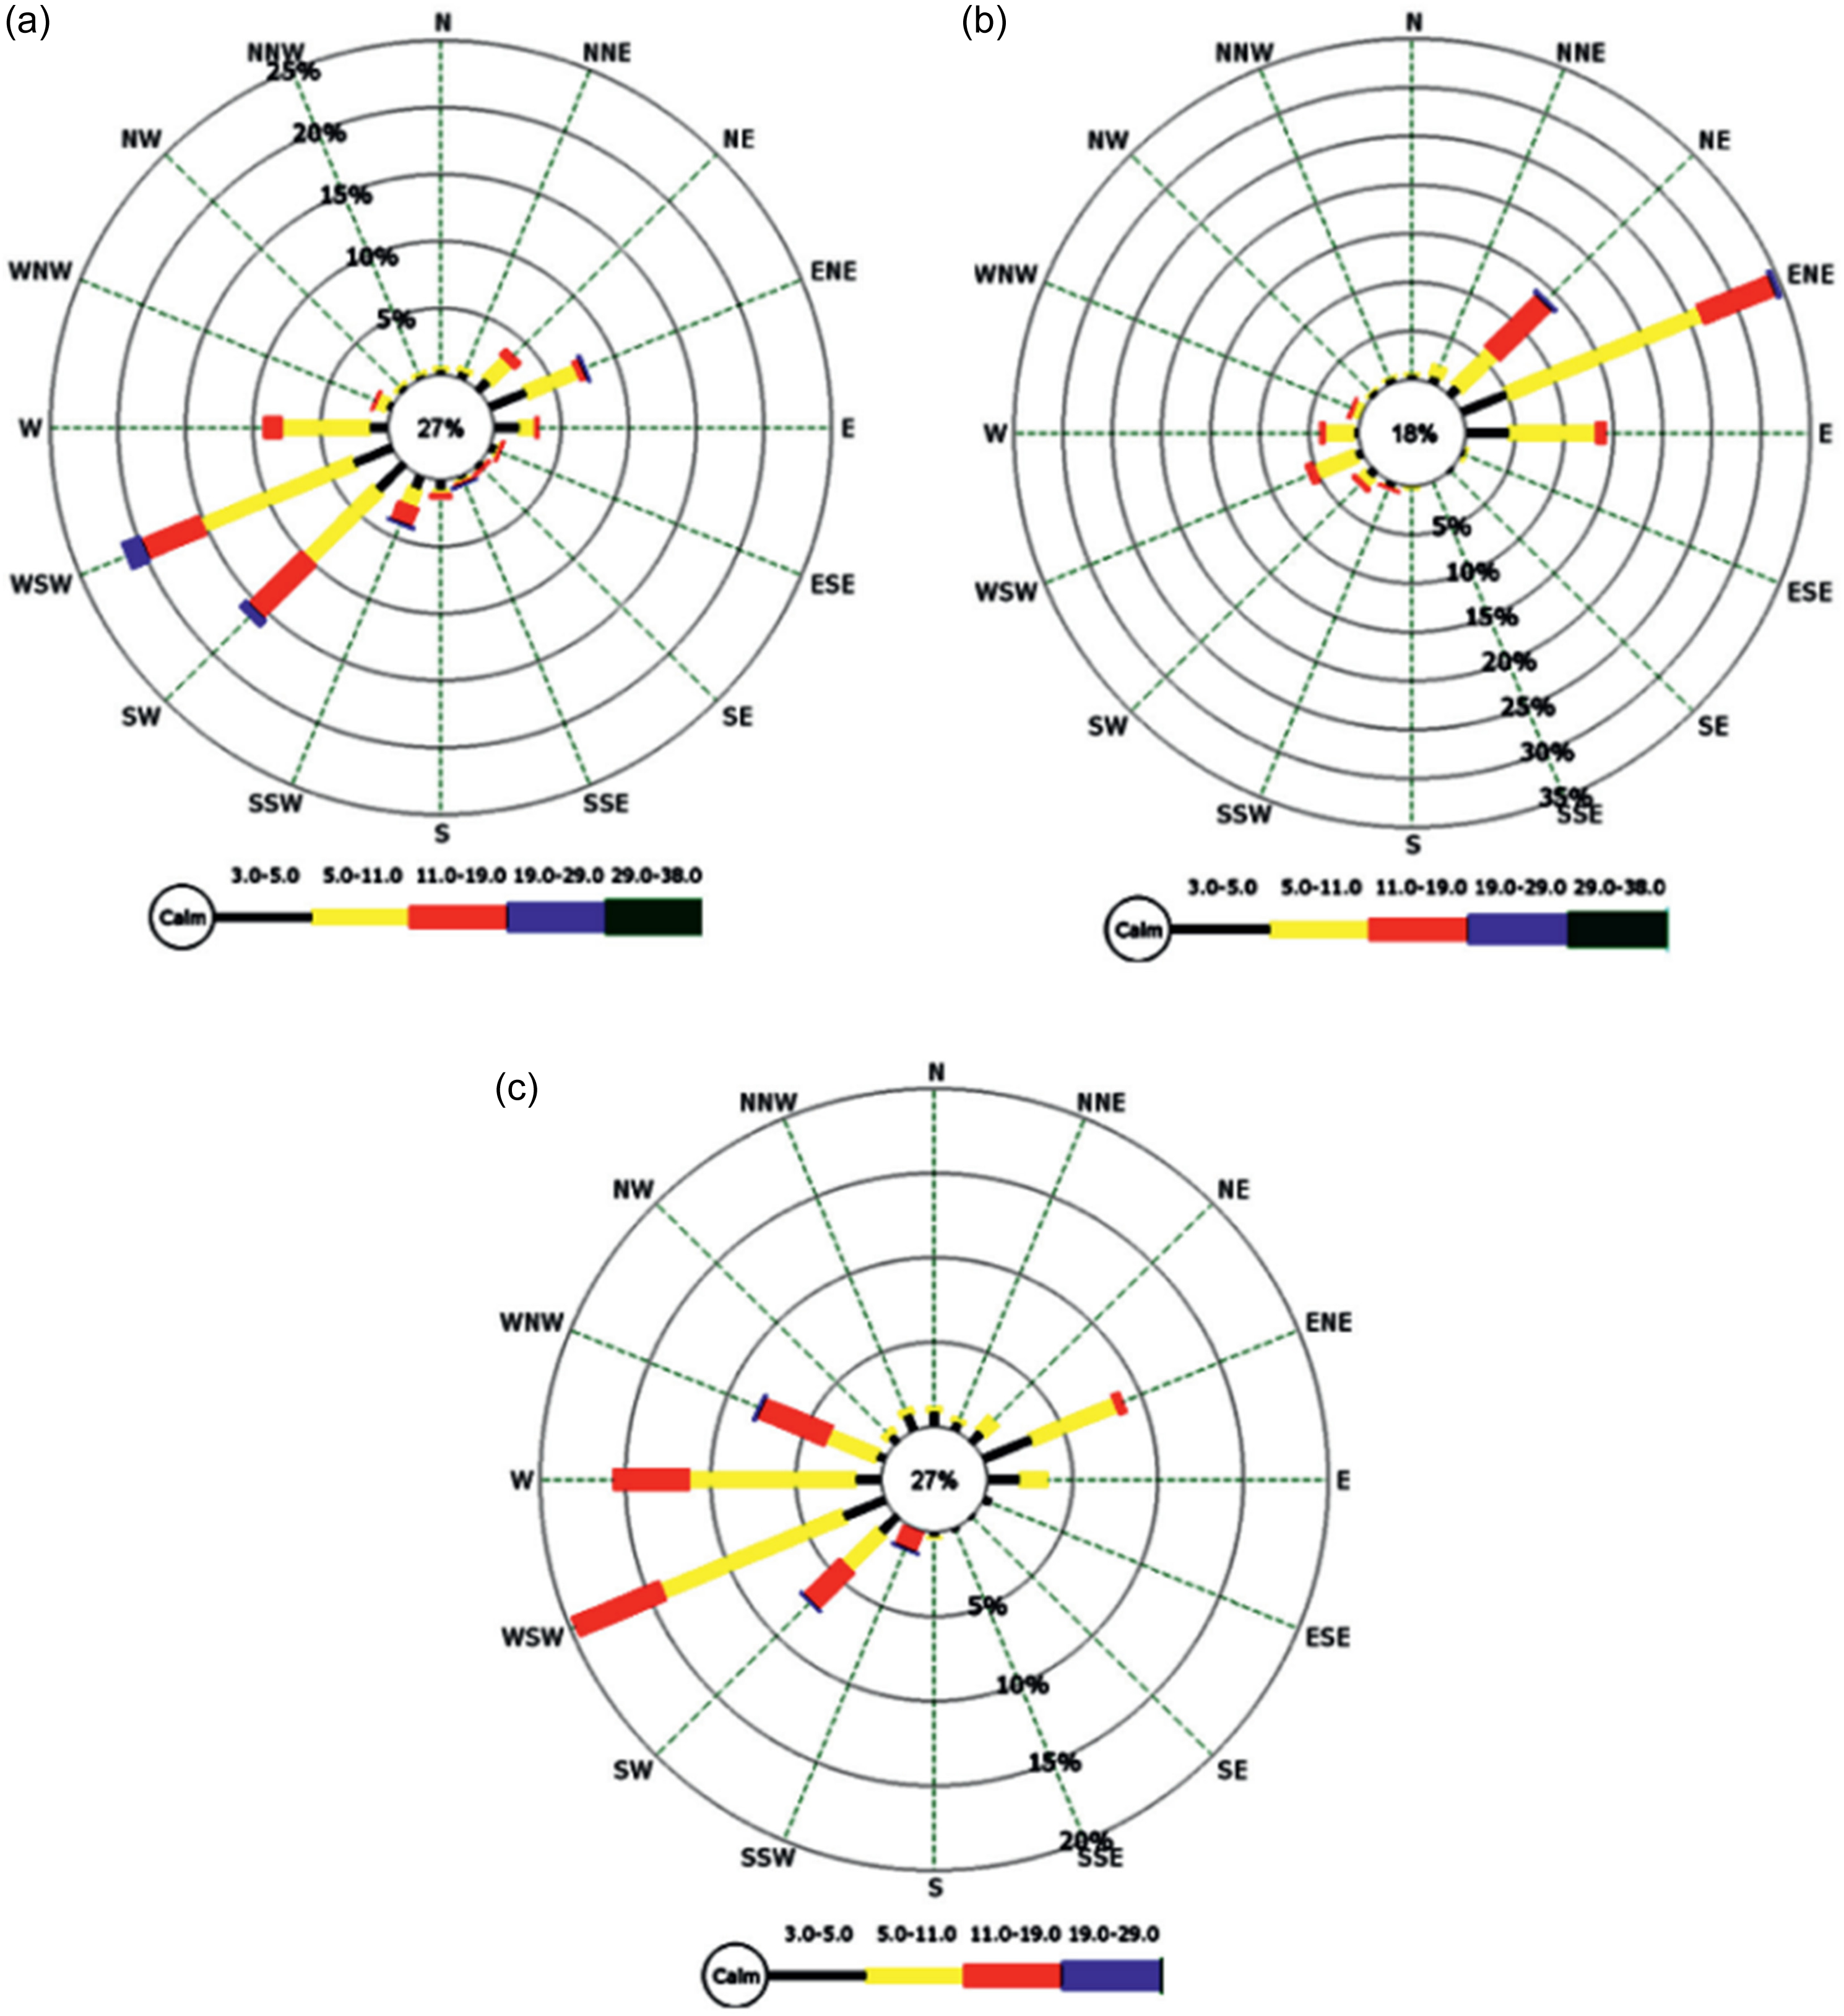
This NPP site is surrounded by hills with elevations varying from 300 m to 900 m and is known for its distinctive topographical characteristics, as explained in our previous publications (Bharath et al. Reference Bharath, Krishnan, D’Souza, Nayak, Dileep, Ravi, Managavi, Salunke, Veerendra and Karunakara2022; Karunakara et al. Reference Karunakara, D’Souza, Nayak, Bharath, Krishnan, Dileep and Ravi2013, Reference Karunakara, D’Souza, Nayak, Bharath, Krishnan, Dileep and Ravi2023; Nayak et al. Reference Nayak, D’Souza, Kamath, Mohan, Bharath, Ravi and Karunakara2020). The Kaiga valley is oriented in the northeast-southwest direction, with the valley mouth in the southwest direction. The dominant wind flow is westerly/south-westerly during the monsoon and summer seasons and easterly/north-easterly during winter. The windroses for all three seasons are shown in Figure 2. Kaiga receives high rainfall (the last 10-year average being ∼3500 mm yr–1), with the bulk of this precipitation through the southwest monsoon during June–September (Aravind et al. Reference Aravind, Srinivas, Shrivastava, Hegde, Seshadri and Mohapatra2022).
The windrose diagrams for the Kaiga NPP region for different seasons: (a) monsoon season (June to September); (b) winter season (October to February); (c) summer season (March to May).

Materials and methods
Details of sampling stations and sample collection
A map illustrating the locations of sample collection in the vicinity of the Kaiga NPP site is presented in Figure 1. The sample collection was performed in the 1.5–5 km, 5–10 km, and 10–15 km radius zones of the NPP. The area around the NPP is segmented into 16 sectors, each spanning 22°30ʼ (Figure 1). Due to the intricate terrain and steep hills enveloped by dense reserve forests surrounding the NPP, motorable roads are limited to areas where human habitation exists. Consequently, not all sectors around the NPP are accessible for sample collection. Therefore, a majority of the sample collection locations are situated along motorable roads on riverbanks. The sampling stations were chosen based on the windrose data for different seasons. Most of the sampling stations are located in the southwest and northeast sectors as they represent the upwind and downwind directions with respect to the Kaiga NPP (Figure 2).
23 soil and 7 sediment samples were collected for this study during 2019–2022. Soil samples were collected from the 2–5 cm profile at undisturbed areas using a clean stainless steel metal scoop after removing the litter layer, which was sampled separately. Similarly, sediment was sampled from the shallow waters of the dam and tributaries of the Kali River at seven different locations. The excess 14C specific activity in the samples collected in the vicinity of the NPP was quantified by comparing the specific activity value recorded in samples collected from clean air regions. For this, soil samples were collected from Karkala (13°11′60.0″N, 74°58′48.0″E) and in the neighborhood of the Centre for Advanced Research in Environmental Radioactivity (CARER), Mangalore University (12°49′2.94″N, 74°55′18.79″E), and sediment sampling was performed at Seraje (12°45′41.4″N, 75°5′20.4″E). These clean air locations are 200 km, 234 km, and 243 km from Kaiga NPP.
Sample processing
The soil and sediment samples (after removing stones and extraneous materials such as debris, twigs, etc.) were dried for 24 hr at 110°C in an electric oven to remove the water content completely. Each sample was homogenized thoroughly and passed through a 180 μm sieve to obtain uniform grain size. They were subjected to cleaning through acid-base-acid (A-B-A) treatment to remove any modern or fossil contaminants (Stuiver and Quay Reference Stuiver and Quay1981) and dried again. Litter samples were also dried, powdered in an electric crusher, packed in an air-tight polythene bag, and stored until taken for analysis. These samples were also subjected to A-B-A treatment in the same way.
Tube combustion system for combustion of samples
Pyrolyser-Trio tube combustion system
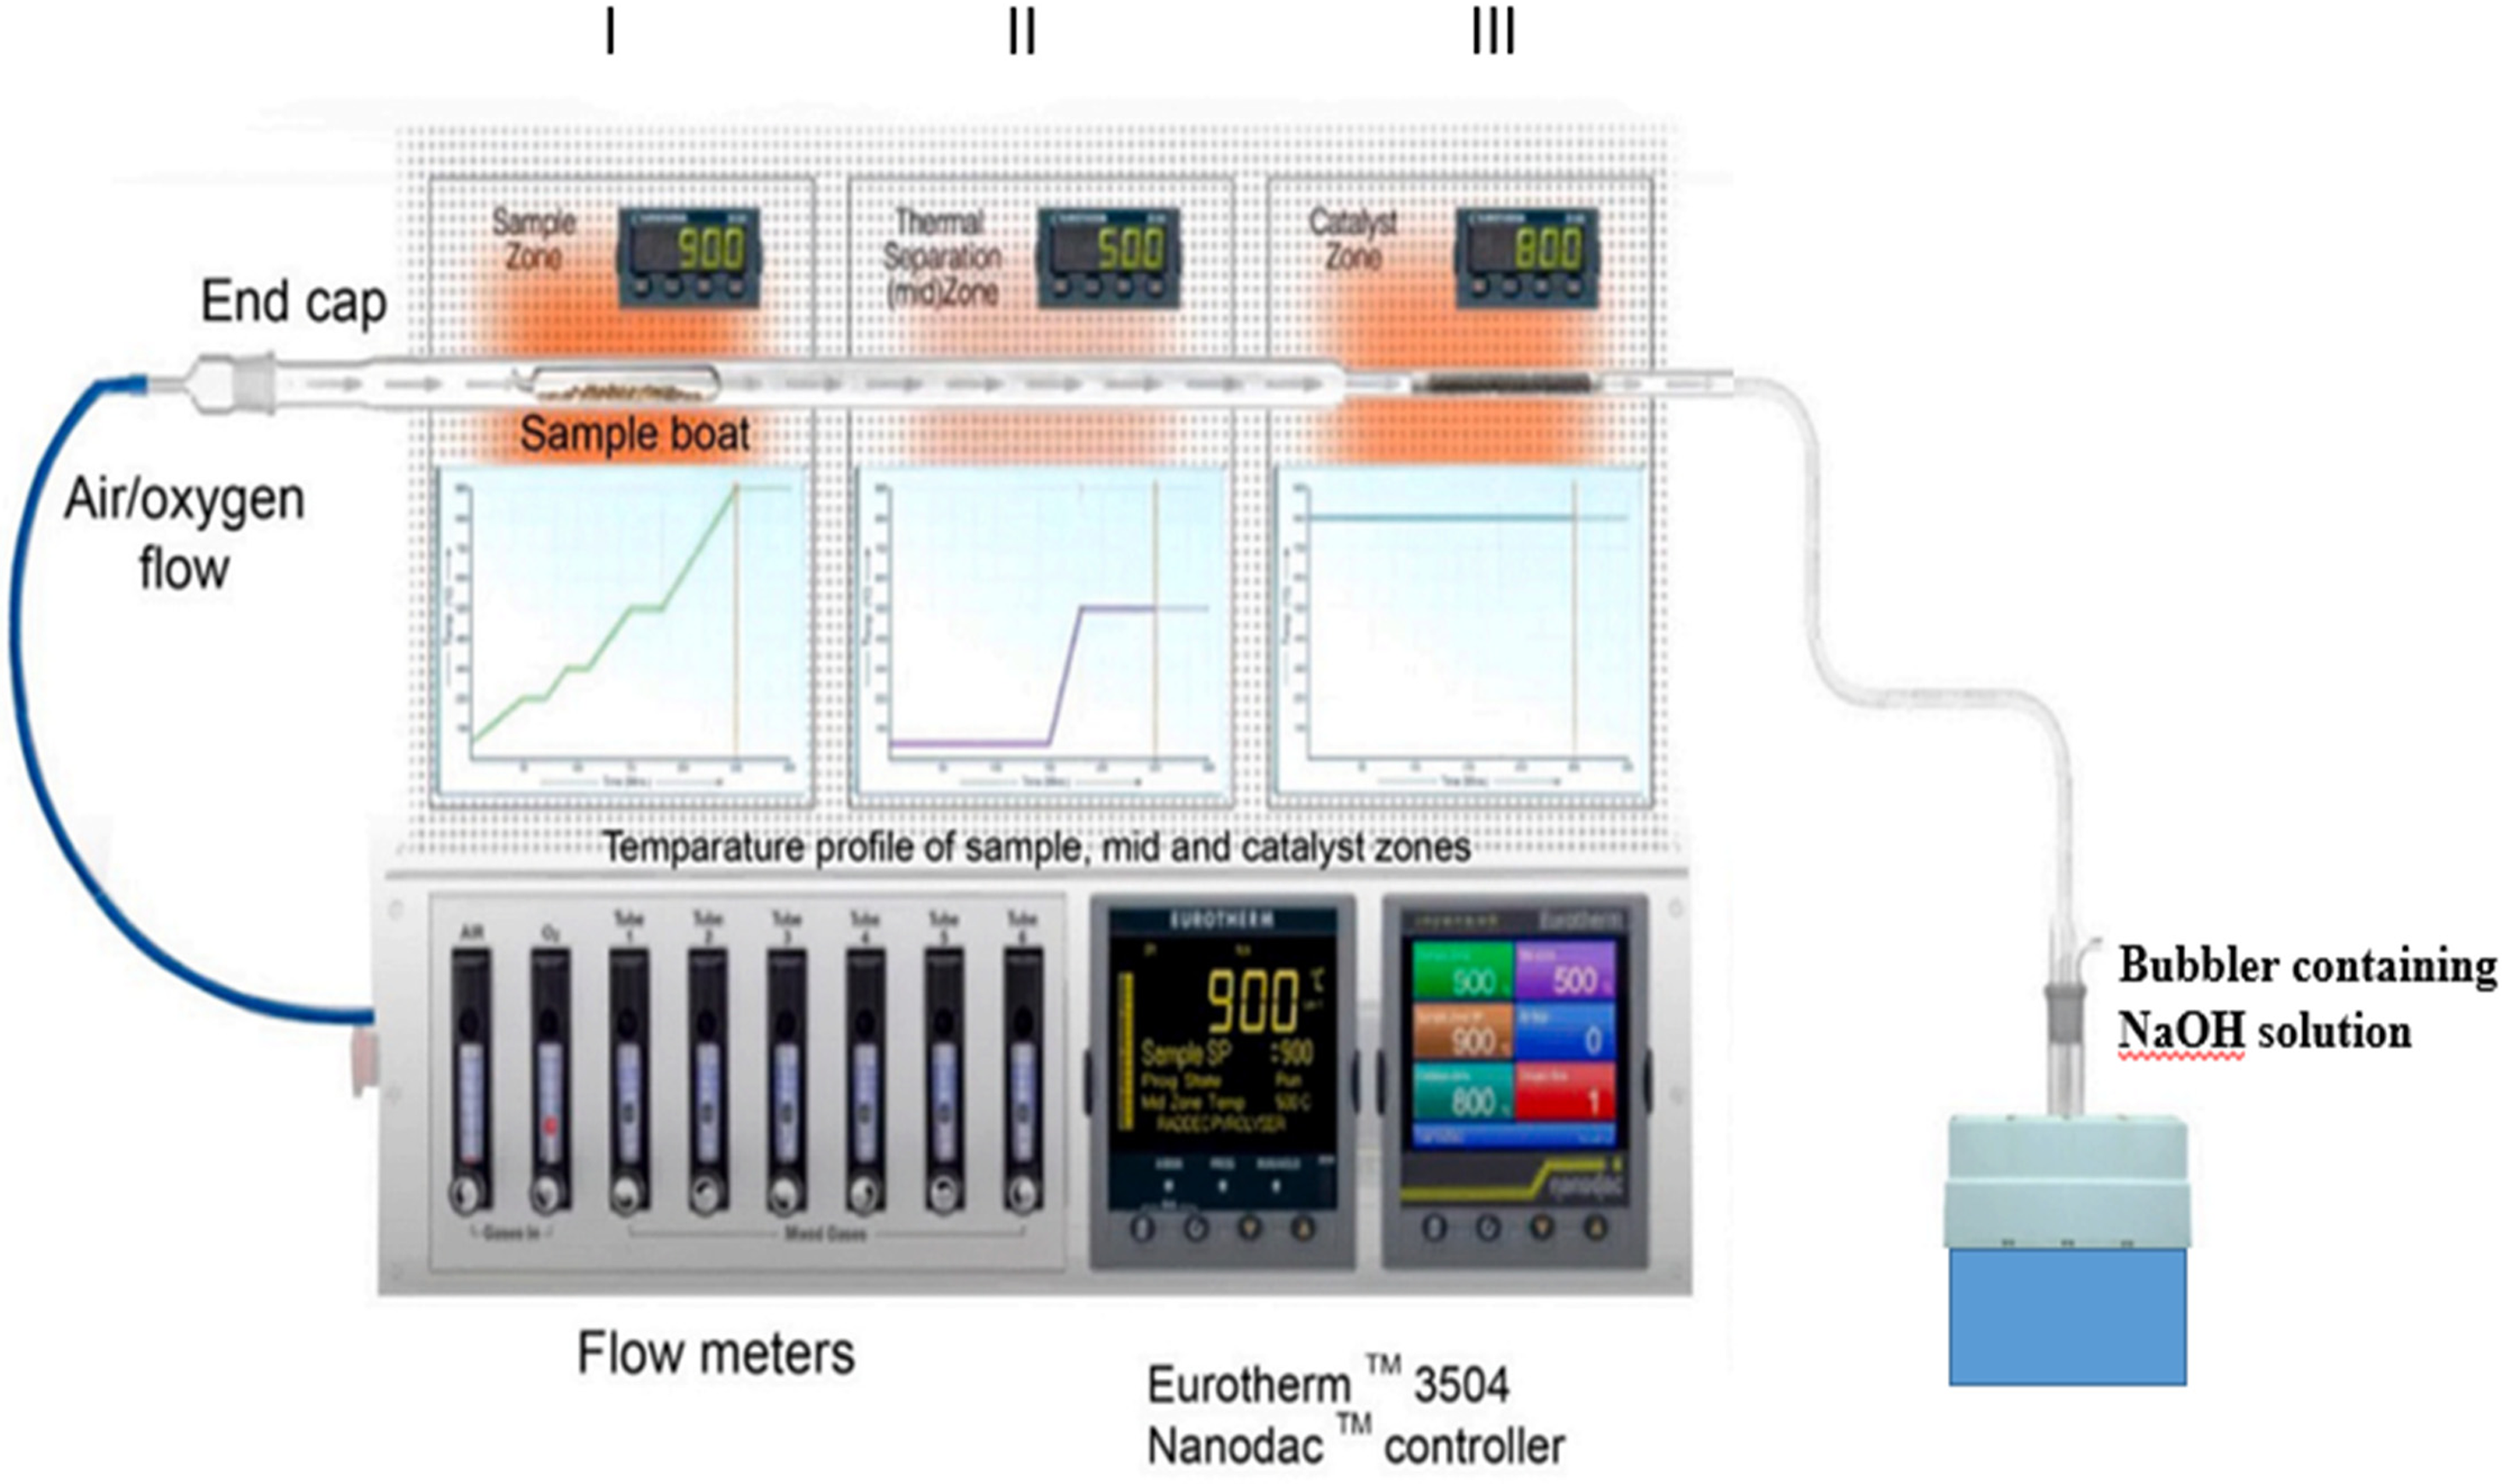
As mentioned, the Pyrolyser-Trio (Raddec International, UK) was used to combust the processed samples. The details of the combustion system were reported in our previous publications (D’Souza et al. Reference D’Souza, Nayak, Mohan, Bharath, Krishnan, Kamath, Diéguez, Agulló, Gómez-Martínez, Santos-Arévalo, García-Tenorio and Karunakara2021; Karunakara et al. Reference Karunakara, D’Souza, Nayak, Bharath, Krishnan, Dileep and Ravi2023). In brief, it consists of three zones: (i) sample zone, (ii) middle zone, and (iii) catalyst zone. The combustion system consists of six quartz work-tubes placed inside the quartz liner tubes, which pass through three interconnected zones. This system allows the user to combust six samples in a batch. The work-tubes are narrow at one end to accommodate platinum-alumina catalyst pellets, as shown in Figure 3. The system is designed to combust a variety of samples, such as vegetables, fruits, grains, fish, graphite, wet asbestos, soil, etc.
The flow diagram of Pyrolyser-Trio Furnace System (Raddec International, UK). Sample zone (I), mid-zone (II), and catalyst zone (III) are shown. The CO2 species liberated from the combustion is collected in 3N NaOH solution contained in the bubbling system. The schematic diagram shows only one work-tube, whereas the combustion system consists of six work-tubes for simultaneously combusting six samples.

Sample combustion, absorption of CO2 species, and 14C specific activity determination
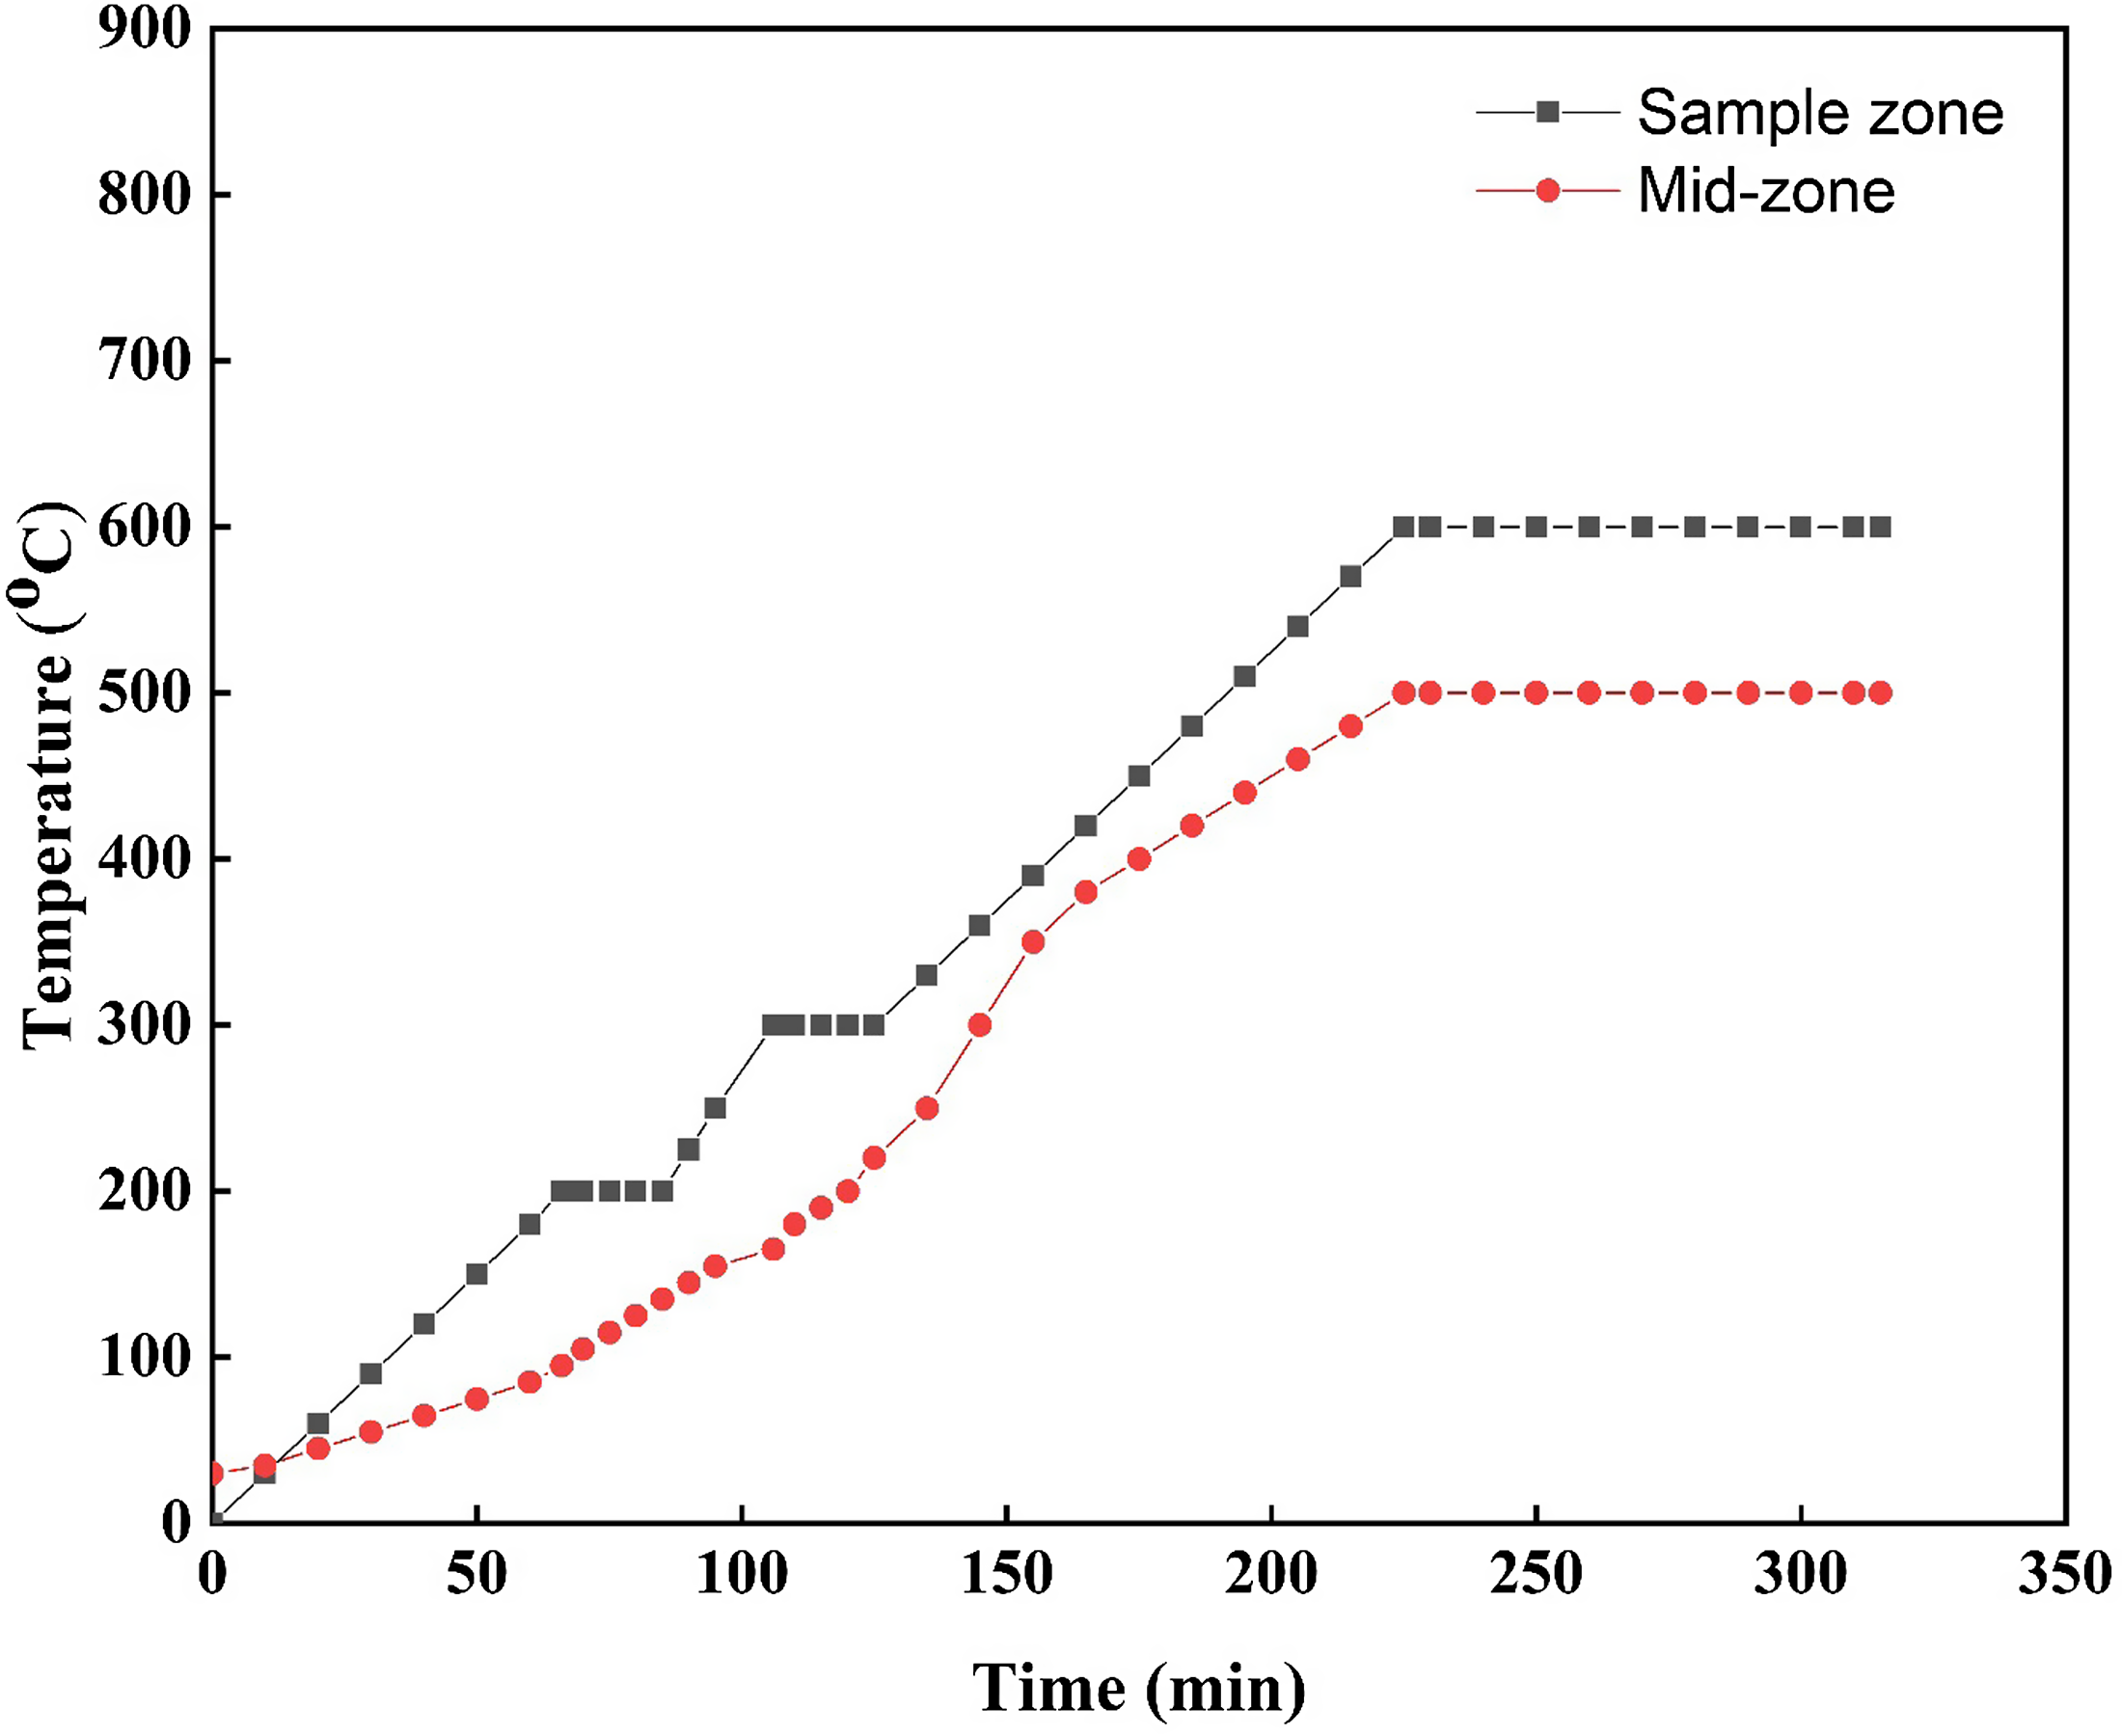
The Pyrolyser-Trio system has nine preloaded user-selectable programs for achieving the required temperature profiles in the furnace for the combustion of a variety of samples. They are ORGANIC, NORMAL, RAPID, FISH, WET ASBESTOS, DRY ASBESTOS, GRAPHITE, and BIOCONC (D’Souza et al. Reference D’Souza, Nayak, Mohan, Bharath, Krishnan, Kamath, Diéguez, Agulló, Gómez-Martínez, Santos-Arévalo, García-Tenorio and Karunakara2021; Warwick et al. Reference Warwick, Kim, Croudace and Oh2010). For the combustion of biota samples of plant origin (∼3 g of dried and powdered sample), the “ORGANIC” programme is generally used. In this program, the combustion of the samples is achieved at a maximum temperature of ∼500°C (D’Souza et al. Reference D’Souza, Nayak, Mohan, Bharath, Krishnan, Kamath, Diéguez, Agulló, Gómez-Martínez, Santos-Arévalo, García-Tenorio and Karunakara2021; Karunakara et al. Reference Karunakara, D’Souza, Nayak, Bharath, Krishnan, Dileep and Ravi2023). Since the carbon content in soil and sediment is lower when compared to terrestrial biota samples, the mass of the sample to be subjected to combustion is significantly higher to obtain the adequate mass of CO2 species for saturating the absorber for liquid scintillation analysis (Bharath et al. Reference Bharath, Krishnan, D’Souza, Nayak, Ravi, Sharma, Kumar, Chopra and Karunakara2021; D’Souza et al. Reference D’Souza, Nayak, Mohan, Bharath, Krishnan, Kamath, Diéguez, Agulló, Gómez-Martínez, Santos-Arévalo, García-Tenorio and Karunakara2021). Also, the oxidation of soil and sediment matrices requires higher temperatures than other terrestrial biota samples. Therefore, about 15 g of soil or sediment sample was spread evenly in a quartz boat and placed in the sample zone of the work-tube. The temperature profile maintained for the sample zone is shown in Figure 4 (preinstalled “NORMAL” program). The catalyst zone is held at a constant temperature of 800°C, while the mid-zone serves as isolation between the sample zone and catalyst zone, with temperatures reaching up to 500°C (Figure 4). Initially, the sample is heated in ambient air supplied by an air compressor at a flow rate of 0.05 L min–1. The sample-zone temperature was gradually increased to 200°C at 3°C min–1 and maintained at this temperature for 20 min. The temperature was then increased to 300°C at 5°C min–1 and maintained for 20 min. After this, the temperature of the sample zone was raised to 600°C at a rate of 3°C min–1 and maintained for 90 min for complete oxidation of the sample. During this period, pure oxygen was supplied at a rate of 0.05 L min–1 for about 1.5 hr to ensure efficient and complete oxidation of all the carbon species (12C, 13C, and 14C), and the heating cycles were programmed to ensure controlled and complete oxidation. These carbon species produced were completely oxidized to CO2 species by passing them through the catalyst zone packed with Platinum-Alumina catalyst pellets.
The temperature profile maintained in the sample zone and mid-zone of the furnace for the combustion of the soil and sediment samples (a preinstalled NORMAL program was used in the sample zone).

The CO2 species produced were trapped in a suitable absorber and subjected to LSC to determine the 14C specific activity. The methodology suggested by the manufacturer is the “online process” in which the CO2 species is absorbed in 10 mL of amine-based absorbers such as Carbo-Sorb E (Perkin Elmer, USA) or Carbon Count (Meridian Biotechnologies LTD, UK). But, the online trapping process is beset with difficulties, which were discussed in detail in D’Souza et al. (Reference D’Souza, Nayak, Mohan, Bharath, Krishnan, Kamath, Diéguez, Agulló, Gómez-Martínez, Santos-Arévalo, García-Tenorio and Karunakara2021). In brief, they are (i) loss of the absorber during the absorption process due to oxidation, (ii) difficulty in achieving a consistent trapping efficiency (or recovery) and loading of the CO2 species to the absorber, (iii) degradation of the absorber due to the presence of SO2, NO2, or O2 in the gas stream passing through it, (iv) pigmentation of the absorber resulting in significant variations in spectral quench parameter, SQP(E), of the absorber-scintillator mixture, and (v) evolving of the toxic fumes of degradation compounds from the absorber.
Therefore, an improved method was developed for the analysis of terrestrial biota samples (D’Souza et al. Reference D’Souza, Nayak, Mohan, Bharath, Krishnan, Kamath, Diéguez, Agulló, Gómez-Martínez, Santos-Arévalo, García-Tenorio and Karunakara2021), in which the CO2 species produced from the combustion of the sample were isolated from the combustion products through cryogenic trapping (using a cryo-cooler) and then absorbed in 10 mL of absorber (Carbo-Sorb E) + 10 mL of scintillator mixture (PermaFluorTM) through an off-line transfer process. However, due to the high temperature (600°C) maintained in the combustion system for the combustion of soil and sediment matrices, when compared to the terrestrial biota samples (500°C), the trapping efficiency of the cryo-cooler was reduced, leading to loss of CO2 species produced from the sample. Therefore, in this work, we have used an alternative method in which the CO2 species produced from the combustion were trapped in a freshly prepared 3N NaOH solution (100 mL) contained in a bubbler connected to the outlet of the quartz work-tube, as shown in Figure 3. Since the volume of the NaOH used for CO2 species trapping was significantly higher, the trapping efficiency of CO2 species was up to 68%, which could be increased to 80% by a series of two bubblers. Moreover, the necessity of operating a cryo-cooler along with the tube combustion system was eliminated.
The litter samples were subjected to combustion by choosing the ORGANIC program. The details of the temperature profile maintained and the methodology adopted are discussed in our previous publications (D’Souza et al. Reference D’Souza, Nayak, Mohan, Bharath, Krishnan, Kamath, Diéguez, Agulló, Gómez-Martínez, Santos-Arévalo, García-Tenorio and Karunakara2021; Nayak et al. Reference Nayak, D’Souza, Kamath, Mohan, Bharath, Dileep, Ravi and Karunakara2021). As in the case of soil and sediment, the CO2 species produced from the combustion of the sample were trapped in a 3N NaOH solution.
Immediately after the completion of the combustion process and trapping of CO2 species, BaCl2 was added to the NaOH solution to precipitate the dissolved CO2 species as BaCO3 and centrifuged. The BaCO3 precipitate was washed with 40 % alcohol in distilled water and dried to remove water completely. About 13 g of the BaCO3 precipitate was subjected to regeneration of CO2 species through acid hydrolysis in a specially designed set-up, discussed in our previous publication (Bharath et al. Reference Bharath, Krishnan, D’Souza, Nayak, Ravi, Sharma, Kumar, Chopra and Karunakara2021). The CO2 species regenerated from the acid hydrolysis were absorbed in a mixture of 10 mL of absorber (Carbo-Sorb E, PerkinElmer, USA) and 10 mL of liquid scintillator (PermaFluorTM, PerkinElmer, USA). After the saturation of the absorber-scintillator mixture with the CO2 species, the mass of the CO2 species absorbed was determined gravimetrically (Bharath et al. Reference Bharath, Krishnan, D’Souza, Nayak, Ravi, Sharma, Kumar, Chopra and Karunakara2021; D’Souza et al. Reference D’Souza, Nayak, Mohan, Bharath, Krishnan, Kamath, Diéguez, Agulló, Gómez-Martínez, Santos-Arévalo, García-Tenorio and Karunakara2021). The mass of CO2 species absorbed in the absorber-scintillator mixture varied in a very narrow range of 2.15–2.35 g/10 mL of absorber with an average value of 2.24 ± 0.09 g, as against the expected value of 2.11 g/10 mL of absorber quoted by the manufacturer (PerkinElmer, USA). This confirmed a consistent and complete saturation of the absorber for all the samples analyzed.
The sample was sonicated in an ultrasonic sonicator and loaded to the LSC system (Quantulus 1220, PerkinElmer, USA) to store in the dark for ∼12 hr to minimize chemiluminescence and then analyzed for the determination of 14C specific activity. Data acquisition was performed using WINQ software (version 1.3), and beta spectrum was processed using EASY VIEW software (version 1.2.0.16, PerkinElmer, USA). From the counts per minute (cpm) recorded for the sample, the 14C specific activity was calculated from the following expression (D’Souza et al. Reference D’Souza, Nayak, Mohan, Bharath, Krishnan, Kamath, Diéguez, Agulló, Gómez-Martínez, Santos-Arévalo, García-Tenorio and Karunakara2021; Bharath et al. Reference Bharath, Krishnan, D’Souza, Nayak, Ravi, Sharma, Kumar, Chopra and Karunakara2021):
 $${\rm{A}} = {{({\rm{C}}) \times 100 \times 44.01} \over {60 \times {\rm{E}} \times {\rm{W}} \times 12}} \pm {\rm{SD}}$$
where,
A is the specific activity of 14C (Bq kg–1C), C is the net cpm from the sample, and C =
 ${{\left( {{{\rm{C}}_{\rm{S}}}{\rm{ - }}{{\rm{C}}_{\rm{B}}}} \right)} \over {\rm{T}}}$
, CS is the gross counts, CB is the background counts, T is the counting time (min), W is the mass (kg) of the CO2 species absorbed in the absorber (varied in the range 2.15 to 2.35 g), E is the counting efficiency (%), the factor 44.01 corresponds to the molecular mass of CO2 species, and
SD is the standard deviation, computed as given in the IAEA document (IAEA 1989):
 $${\rm{SD}} = \left( {\sqrt {{{{{\rm{C}}_{\rm{S}}}} \over {{{\rm{T}}^{\rm{2}}}}}} \,\,{\rm{ + }}\,\sqrt {{{{{\rm{C}}_{\rm{B}}}} \over {{{\rm{T}}^{\rm{2}}}}}} } \right){\rm{ \times }}{{{\rm{100 \times 44}}{\rm{.01}}} \over {{\rm{60 \times E\times W\times 12}}}}$$
The counts under the region of interest with channel numbers from 163 to 359 of the beta spectrum, which yielded the highest figure of merit (FOM) value of 19,542, were considered for determining cpm (Bharath et al. Reference Bharath, Krishnan, D’Souza, Nayak, Ravi, Sharma, Kumar, Chopra and Karunakara2021; D’Souza et al. Reference D’Souza, Nayak, Mohan, Bharath, Krishnan, Kamath, Diéguez, Agulló, Gómez-Martínez, Santos-Arévalo, García-Tenorio and Karunakara2021; Karunakara et al. Reference Karunakara, D’Souza, Nayak, Bharath, Krishnan, Dileep and Ravi2023). The background count rate was determined by analyzing the CO2 species produced from the combustion of IAEA-C1 (marble) reference material with zero (0 ± 0.02 pMC) specific activity. The background count rate, thus determined, was 1.02 ± 0.10 cpm. The corresponding minimum detectable activity (MDA) was calculated using the following equation, given in IAEA (2009):
 $${\rm{MDA}} = \left( {{{{\rm{2}}{\rm{.75 \,+\, 4}}{\rm{.65}}\sqrt {{{\rm{C}}_{\rm{B}}}} } \over {{\rm{E \times W\times T}}}}{\rm{ \times }}{{{\rm{44}}{\rm{.01}}} \over {{\rm{12}}}}} \right)$$
where,
CB is the background counts, E is the fractional counting efficiency, W is the weight (kg) of the CO2 species loaded in the absorber, and T is the counting time (s).
The 14C specific activity is also expressed in terms of percent modern carbon (pMC) and fraction modern carbon (F14C), which are defined as:
 $${{\rm{a}}^{14}}{\rm{C}} = {{{{\rm{A}}_{{\rm{SN}}}}} \over {{{\rm{A}}_{{\rm{ON}}}}}}\; \times {\rm{100}}$$
 $${{\rm{F}}^{14}}{\rm{C}} = {{{{\rm{A}}_{{\rm{SN}}}}} \over {{{\rm{A}}_{{\rm{ON}}}}}}$$
where,
a14C is the relative specific activity expressed in pMC (with 100 pMC = 226 Bq kg–1C), ASN is the specific activity normalized for isotopic fractionation (δ13C) as explained by Stenström et al. (Reference Stenström, Erlandsson, Mattsson, Thornberg, Hellborg, Kiisk, Persson and Skog2000), and AON is the specific activity of modern carbon with 1950 as the reference year (AON = 226 Bq kg–1C) (Bharath et al. Reference Bharath, Krishnan, D’Souza, Nayak, Ravi, Sharma, Kumar, Chopra and Karunakara2021).
The excess activity in the samples collected from the vicinity of the NPP was quantified with respect to the 14C specific activity recorded for the samples collected from the clean air region corresponding to the year 2022.
Determination of isotopic fractionation
Isotopic fractionation of organic carbon in soil samples may occur during the sample pretreatment and the combustion process. Hence, the measured 14C specific activity should be corrected for isotopic fractionation, which is the relative deviation of the 13C/12C ratio of the sample in comparison with that for the standard material Vienna Pee Dee Belemnite, from South Carolina, USA (VPDB) (Krajcar Bronić et al. Reference Krajcar Bronić, Todorović, Nikolov and Barešić2012). This ratio is denoted as δ13C, in units of per-mil (‰). The δ13C value of the soil sample and the BaCO3 obtained from its combustion was determined by isotope ratio mass spectrometry (IRMS, Finnigan Deltaplus XP, Conflo III, Thermo Electron Incorporation, Germany) to evaluate the isotopic fractionation during the sample processing steps. The measured specific activity values (A, equation 1) were corrected for isotopic fractionation to obtain the specific activity values normalized to isotopic fractionation (ASN, equation 4), following the standard formula given in Mook et al. (Reference Mook and van der Plicht1999), van der Plicht and Hogg (Reference van der Plicht and Hogg2006), Stenström et al. (Reference Stenström, Erlandsson, Mattsson, Thornberg, Hellborg, Kiisk, Persson and Skog2000), and Krajcar Bronić et al. (Reference Krajcar Bronić, Todorović, Nikolov and Barešić2012).
AMS measurements
The results obtained from the thermal combustion method were validated by subjecting the soil samples to the 14C specific activity determination using the AMS facility at the Inter-University Accelerator Centre (IUAC), New Delhi. The sample preparation procedure for the AMS measurements is well established, as discussed by Stenström et al. (Reference Stenström1995), Sharma et al. (Reference Sharma, Umapathy, Kumar, Ojha, Gargari, Joshi, Chopra and Kanjilal2019), Hajdas (Reference Hajdas2008), and Němec et al. (Reference Němec, Wacker, Hajdas and Gäggeler2010). Samples in soil form, as well as BaCO3, which is obtained from the combustion of soil, were analyzed using the AMS. In brief, barium carbonate samples were acid hydrolyzed in a carbonate handling system (CHS) using H3PO4 and the produced CO2 was converted into graphite after reaction with H2 over iron powder as catalyst at 580oC in automated graphitisation equipment (AGE). On the other hand, the soil samples primarily underwent an A-B-A treatment to remove modern or fossil contaminants, if any. After the pretreatment, the soil samples were converted to graphite using AGE. Produced graphite was then pressed into cathode capsules and inserted into the cathode wheel of the ion source of the AMS system based on a 500 kV Pelletron accelerator (Sharma et al. Reference Sharma, Umapathy, Kumar, Ojha, Gargari, Joshi, Chopra and Kanjilal2019; Krishnan et al. Reference Krishnan, Bharath, Sharma, Kumar, Chopra, Reshmi, Sudheesh and Karunakara2023). The measured values of 14C/12C ratios were normalized with the oxalic acid standard (NIST, OX II, SRM-4990C), and AMS online δ13C values were utilized for fractionation correction.
Results and discussion
Stable isotope fractionation
The δ13C values of three soil samples and BaCO3 obtained from the CO2 species released from the combustion of the samples were determined by IRMS, as discussed in the previous section on isotopic fractionation measurement. This yielded a mean δ13C value of −27.3 ± 0.4 ‰ (triplicate analysis) for the soil samples, and the corresponding value for the BaCO3 obtained from the combustion of these samples was −26.4 ± 0.3 ‰. These values confirm negligible or no isotopic fractionation of carbon isotopes during the processing of the samples using the tube combustion system. The δ13C values recorded in the present study for the surface soil collected are similar to the values (−26.4 ‰ to −24.4 ‰) reported by Wang et al. (Reference Wang, Feng, Han, Zhou, Tan and Su2008).
Validation of the method, MDA, and uncertainty associated with the batch combustion and LSC method
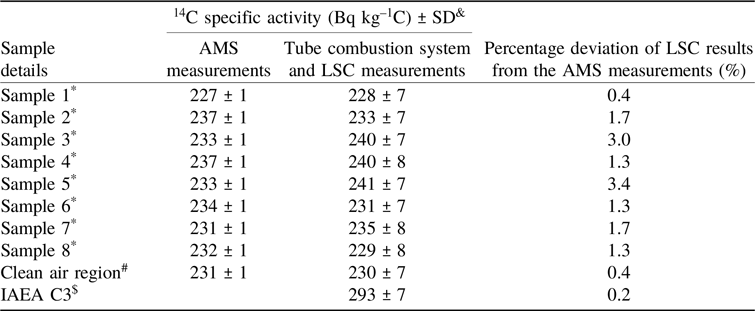
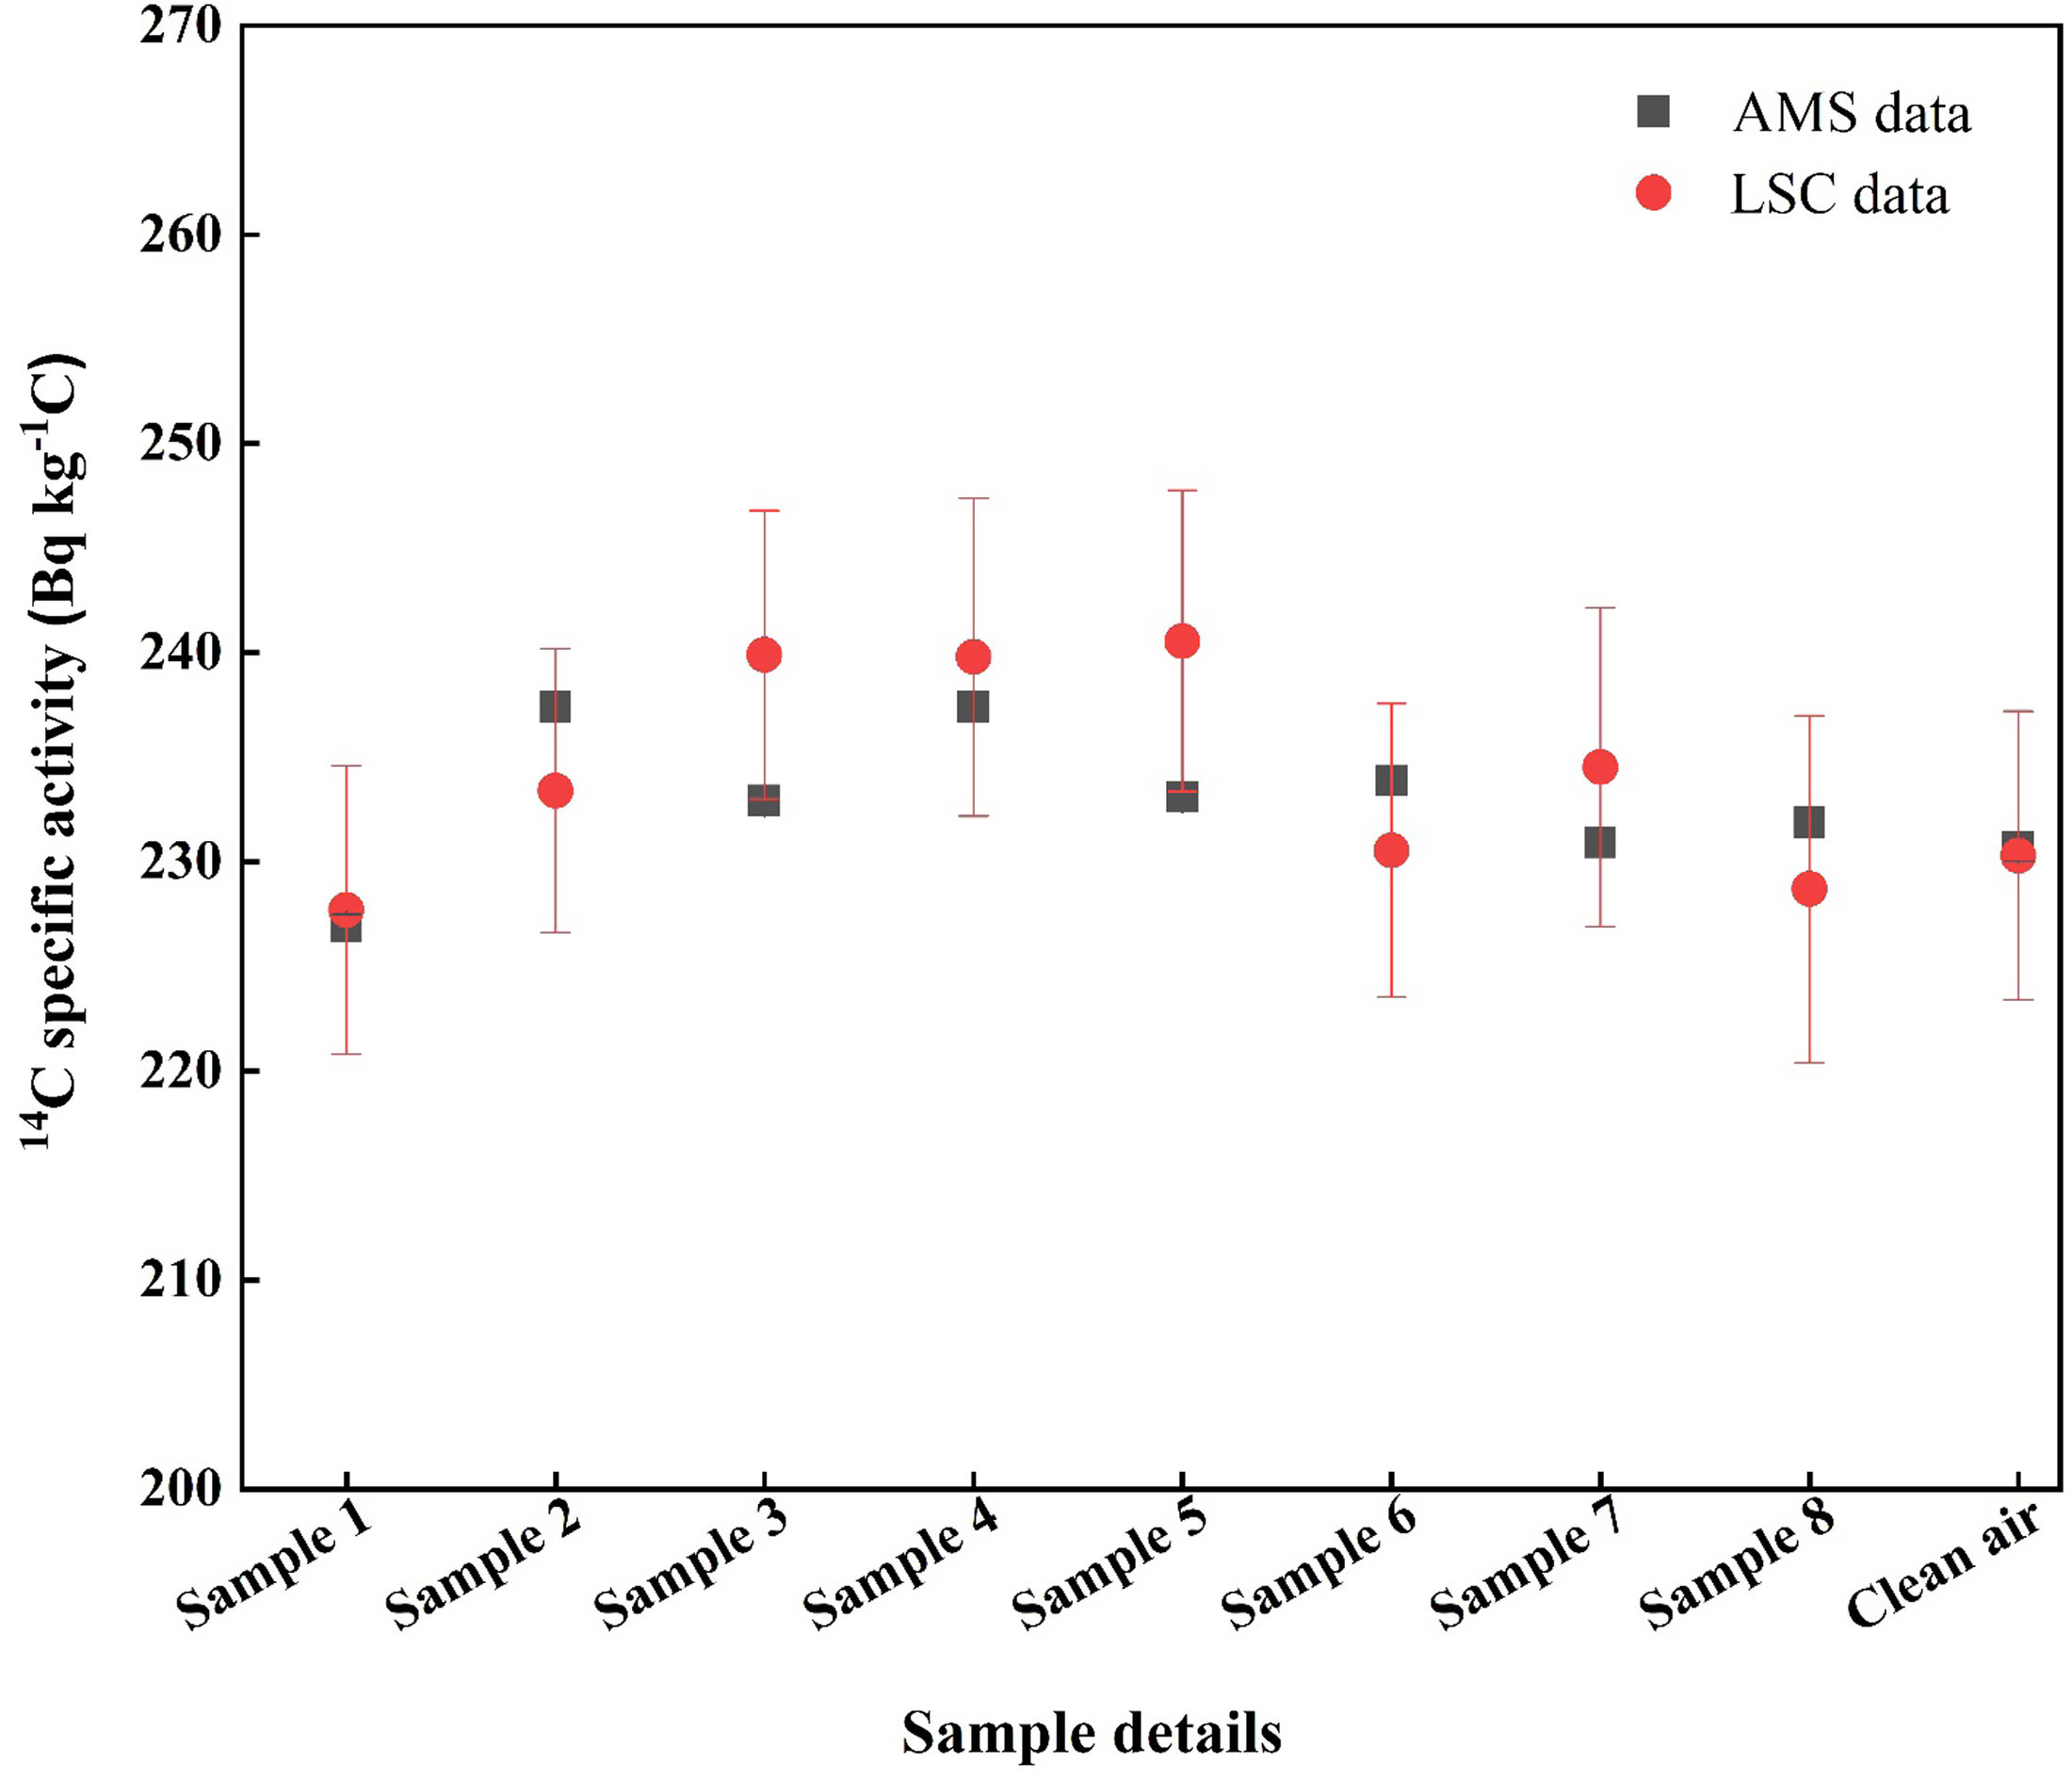
The thermal combustion and LSC method was validated by analyzing several soil samples using the AMS method. A comparison of results obtained from LSC and AMS methods is presented in Table 1 and Figure 5. The 14C specific activity results obtained from the LSC method were in good agreement with the AMS measurements with a deviation of < 3%. This confirms that the tube combustion and LSC method can yield precise and accurate results for the 14C specific activity in soil samples. In addition to this, IAEA-C3 (cellulose) reference material with 14C specific activity of 292.5 ± 0.1 Bq kg–1C (129.41 ± 0.06 pMC, δ13C= −24.724 ‰) was combusted, and CO2 species produced were subjected to the same sample treatment procedures and LSC measurements. While the combustion properties of IAEA-C3 reference material and soil are significantly different, the use of this material allowed us to validate the processes of absorption of CO2 species produced from the combustion in NaOH and subsequent procedures adopted for chemical treatments of the sample.
Validation of tube combustion and LSC measurements technique against the AMS method

* Samples from the vicinity of Kaiga NPP.
# Sample from the clean air region (unaffected by anthropogenic activities).
$ Certified value for IAEA C3 reference material is 292.5 ± 0.1 Bq kg–1C.
& Standard deviation associated with the mean value.
Comparison of the 14C specific activity values obtained by the LSC and the AMS methods for the soil samples. Samples were collected from the vicinity of Kaiga NPP (sample nos. 1–8) and the clean air region.

The data presented in Table 1 confirm that the method is useful for quantifying a small excess 14C specific activity in the samples. When compared to the specific activity recorded for the samples collected from the clean air region, the data for the soil samples collected in the vicinity of the Kaiga NPP reveals an excess 14C specific activity up to 7 Bq kg–1C. This conclusively demonstrates that the method standardized in the present study is suitable for quantifying small excess 14C specific activity in low carbon content samples. Since this is a batch combustion method, it is advantageous in routine environmental monitoring applications in the vicinity of a nuclear facility, which involves analyzing a large number of samples in a short time.
The MDA (at 2σ) for the method (equation 3), corresponding to the background count rate of 1.02 ± 0.10 cpm (determined by the analysis of IAEA-C1 reference material), was 7 Bq kg–1C for a counting time of 1000 min and 10 Bq kg–1C for 500 min. This is an improvement over previously reported MDA values of 20 Bq kg–1C (counting time = 500 min) by Atarashi et al. (Reference Atarashi-Andoh, Amano, Guo and Arakhatoon2003) for the method involving the combustion of soil samples in a fast bomb and LSC. The combined uncertainty associated with the method was computed at 1σ (IAEA 2004, 2017), and the value was 3.6 % of the specific activity of modern carbon (AON= 226 Bq kg–1C), which corresponds to 8.1 Bq kg–1C (3.6 pMC). The details of uncertainty calculations are presented in our previous publications (D’Souza et al. Reference D’Souza, Nayak, Mohan, Bharath, Krishnan, Kamath, Diéguez, Agulló, Gómez-Martínez, Santos-Arévalo, García-Tenorio and Karunakara2021).
Quantification of excess 14C specific activity in the soil in the vicinity of Kaiga NPP
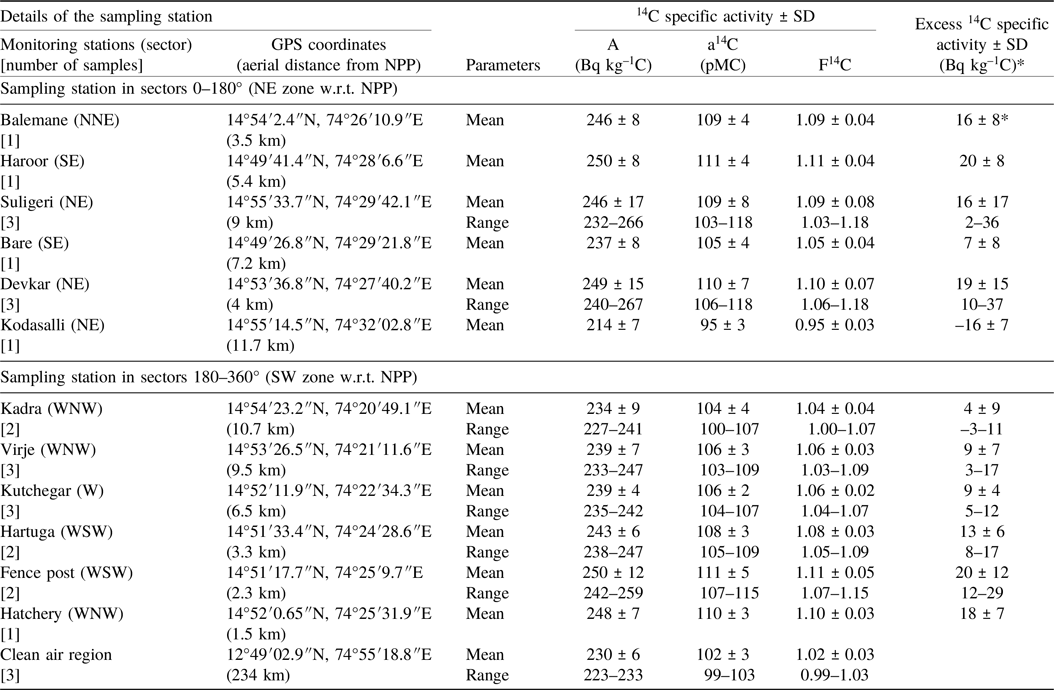
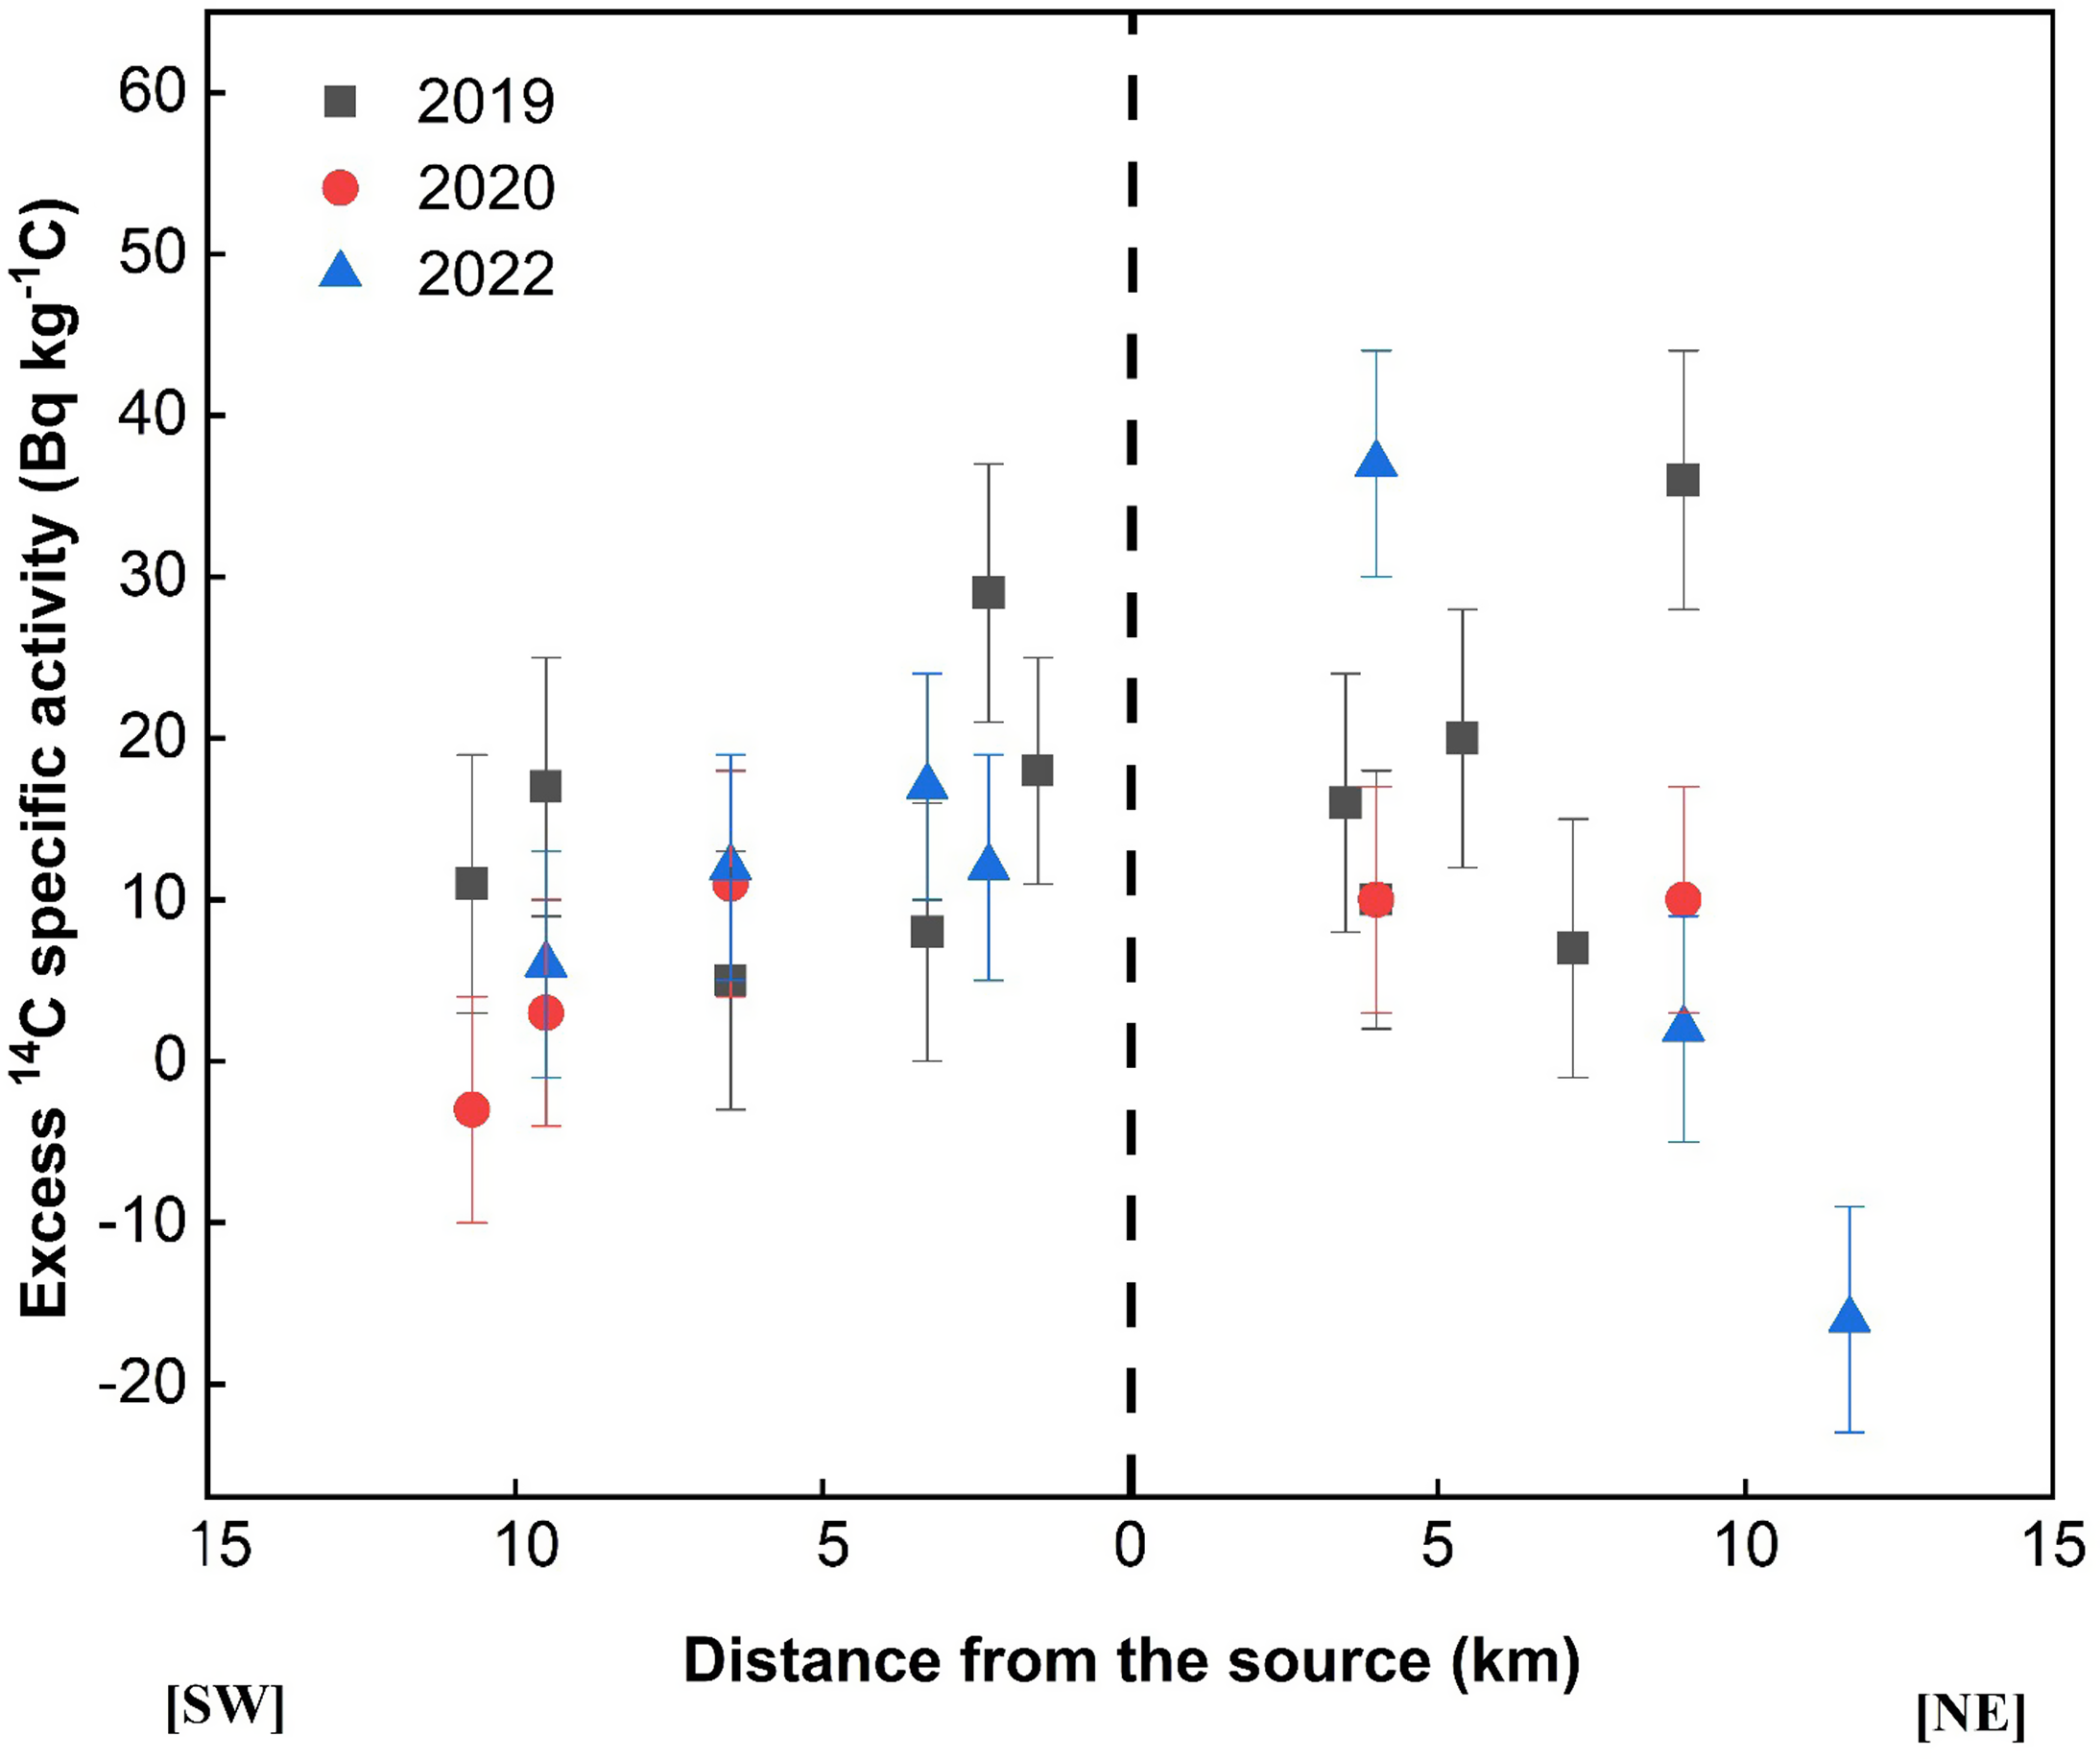
Upon confirming the suitability of the method, several soil samples from the 1.5 to 12 km region of the Kaiga NPP were analyzed. The results are presented in Table 2. The specific activity values are also presented in units of percent modern carbon (a14C) (equation 4) and F14C (equation 5) in columns 5 and 6 of Table 2, respectively. The excess 14C specific activity varied from –16 to 37 Bq kg–1C with reference to the value of 230 ± 6 Bq kg–1C recorded for the clean air region in 2022. The variation of excess 14C specific activity with the distance from either side of Kaiga NPP is depicted in Figure 6. In general, the excess activity decreased with the distance from the NPP.
14C specific activity and excess activity in soil samples collected at different aerial distances from Kaiga NPP during 2019–2022

* The excess activity was quantified based on the measured mean value of specific activity (230 Bq kg–1C) for the soil sample collected from the clean air region for the year 2022.
Variation of excess 14C specific activity in soil with the distance from the Kaiga NPP for the years 2019, 2020, and 2022. The excess 14C specific activity values along with the associated standard deviation for the samples collected at various monitoring stations in the 0°–180° (NE) and 180°–360° (SW) sectors are plotted on either side of the NPP. The dashed vertical line represents the location of the NPP.

The Gaussian plume model estimates for a plain terrain, the gaseous effluents released from a 100 m height stack the maximum activity at ground-level air should occur at a distance of ∼ 3 km (Gifford Reference Gifford1968). The highest excess specific activity (up to 29 Bq kg–1C) in the soil in the SE zone was recorded at 2.3 km, whereas in the NE zone (37 Bq kg–1C), the maximum was recorded at 4 km with respect to Kaiga NPP (Figure 6) for the sample collected in 2022. The excess activity values were recorded in the soil matrix at distances up to ∼12 km on either side from the NPP. Most of the studies from other NPPs of the world (Magnusson et al. Reference Magnusson, Stenström, Skog, Adliene, Adlys, Hellborg, Olariu, Zakaria, Rääf and Mattsson2004; Mazeika et al. Reference Mazeika, Petrosius and Pukiene2008; Roussel-Debet et al. Reference Roussel-Debet, Gontier, Siclet and Fournier2006) have shown negligible or no excess activity beyond ∼ 5 km distance in terrestrial plants. This confirms that the pollutants released through gaseous effluents from Kaiga NPP are transported farther than the Gaussian plume dispersion model predicted. Our previous studies have yielded similar observations on 14C specific activity in atmospheric air and terrestrial biota samples (Bharath et al. Reference Bharath, Krishnan, D’Souza, Nayak, Dileep, Ravi, Managavi, Salunke, Veerendra and Karunakara2022; Karunakara et al. Reference Karunakara, D’Souza, Nayak, Bharath, Krishnan, Dileep and Ravi2023) from the vicinity of this NPP site.
This observation is due to the distinct topography and wind regimes prevailing in the Kaiga Valley, which are discussed in detail by Karunakara et al. (Reference Karunakara, D’Souza, Nayak, Bharath, Krishnan, Dileep and Ravi2023). The pollutants from the gaseous plumes are transported along the axis of the Kaiga Valley to greater distances due to the wind flow channelling and the blocking effect by hills for the southwesterly wind regime (Karunakara et al. Reference Karunakara, D’Souza, Nayak, Bharath, Krishnan, Dileep and Ravi2023). The strong south-westerly wind would transport gaseous plumes to the east and northeast regions (NE zone) of Kaiga Valley, resulting in rapid dispersion (Aravind et al. Reference Aravind, Srinivas, Shrivastava, Hegde, Seshadri and Mohapatra2022; Karunakara et al. Reference Karunakara, D’Souza, Nayak, Bharath, Krishnan, Dileep and Ravi2023). On the other hand, the north-easterly flow during winter would transport the pollutant towards the sea most of the time. Along the axis of the valley is the preferred wind direction, even when the wind over the valleys has a different direction (Sakai et al. Reference Sakai, Fitzjarrald, Walcek, Czikowsky and Freedman2006). The soil sample collected at 11.7 km from the Kaiga NPP in the NE sector (14°55′14.5″N, 74°32′02.8″E) showed lower 14C specific activity when compared to that recorded for clean air region and contemporary ambient natural background value. This suggests the mixing of aged carbon with modern carbon through the mixing of soil strata or erosion processes (Ward et al. Reference Ward, Snow, Olson, Ball and Adamic2018).
A comparison of the 14C specific activity of the samples collected during three years (2019– 2022) is presented in Figure 6. The ANOVA test performed for the datasets for the three years confirmed that the mean values of the 14C specific activity were not significantly different (for α = 0.05, Fobs = 1.75, F0.05 [2, 22] = 3.44).
Comparison of the 14C specific activities in plant litter and soil
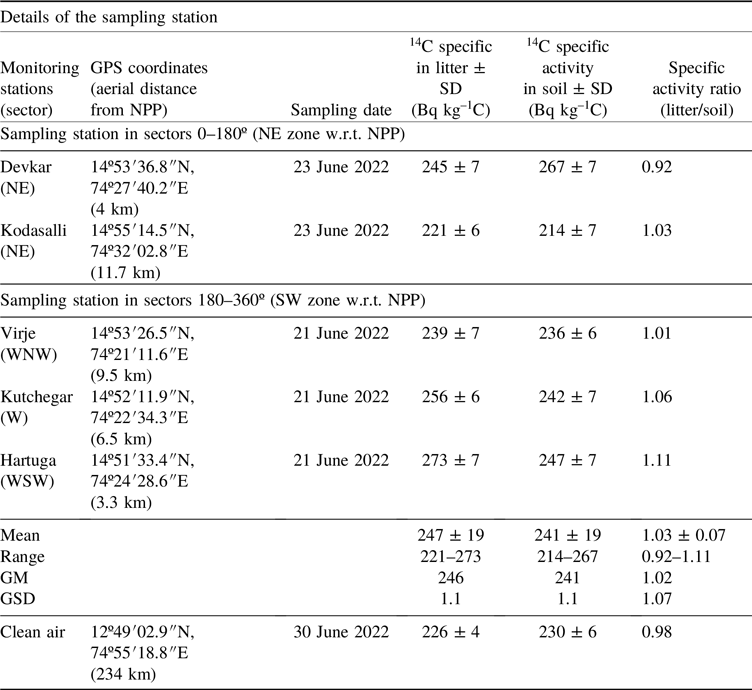
The primary source of carbon in the soil is the decayed plant material broken down by microorganisms. Bolin and Bischof (Reference Bolin and Bischof1970) discussed soil’s organic matter transformation rate through the 14C to 12C ratio to understand the rate of organic matter oxidation within the soil. The 14C specific activity of plant leaf litter and the corresponding soil (from the control site and the vicinity of the NPP) were measured in the present study to examine if the excess activity in terrestrial plants is transferred to the soil during the decomposition process. The results are presented in Table 3. The 14C specific activity in the litter samples from the vicinity of the NPP varied from 221 to 273 Bq kg–1C with a mean ± SD of 247 ± 19 Bq kg–1C. The mean value of 14C specific activity of the litter sample from the controlled site was 226 ± 4 Bq kg–1C. These results suggest the presence of excess 14C specific activity of up to 47 Bq kg–1C in the litter samples from the vicinity of the NPP.
14C specific activity ratio of plant litter (fallen leaf) and underlying soil in the vicinity of Kaiga NPP

The litter-to-soil specific activity ratios (column 6, Table 3) ranged from 0.92 to 1.11 with a mean ± SD ratio of 1.03 ± 0.07. Although the 14C specific activity in litter sampled from four out of the five sampling points was marginally higher when compared to the corresponding soil samples, this was not statistically significant at a 95% confidence level (as confirmed by the t-test, p = 0.33). However, a long-term study with a larger number of samples is desirable to delineate the correlation between the specific activities of litter and underlying soil. This is because the process of decomposition of plant debris and incorporation into soil organic matter through the activities of soil fauna and microbes often requires several months to years and follows several pathways depending on climatic conditions, soil type and fertility, and leaf type (age, morphology and species).
Another important observation from the results presented in Table 3 is the litter-to-soil 14C specific activity ratio for the clean air region for the year 2022. The mean value and associated standard deviation of the specific activity recorded for the leaf litter for the clean air region were 226 ± 4 Bq kg–1C (100 ± 2 pMC), whereas that for the corresponding soil was 230 ± 6 (102 ± 3 pMC), with litter to soil specific activity ratio being < 1. The specific activity recorded for recently deposited leaf litter matches well with (i) the value of 230 ± 6 Bq kg–1C (102 ± 3 pMC) for the fresh leaf samples collected and analyzed during 2016–2017 from different plant species from the same clean air region (Karunakara et al. Reference Karunakara, D’Souza, Nayak, Bharath, Krishnan, Dileep and Ravi2023), (ii) the mean value of 229 ± 3 Bq kg–1C (101 ± 1 pMC) for the 10 atmospheric air samples analyzed from the same region in the year 2019 (Bharath et al. Reference Bharath, Krishnan, D’Souza, Nayak, Ravi, Sharma, Kumar, Chopra and Karunakara2021) and (iii) with the ambient background activity values of 230 Bq kg–1C (102 pMC) corresponding to the year 2016 (Hammer et al. Reference Hammer, Friedrich, Kromer, Cherkinsky, Lehman, Meijer, Nakamura, Palonen, Reimer and Smith2017; Levin and Kromer Reference Levin and Kromer2004) and 228 Bq kg–1C (101 pMC) corresponding to the year 2019 (Hua et al. Reference Hua, Turnbull, Santos, Rakowski, Ancapichún, De Pol-Holz, Hammer, Lehman, Levin, Miller and Palmer2022) for the Northern Hemisphere. From these, we can infer that the marginally higher specific activity in soil samples in the clean air region could indicate the presence of 14C derived from weapon testing in the 1950s and 1960s. Similar findings were also reported by Dias et al. (Reference Dias, Telles, Santos, Stenström, Nícoli, Correa and Skog2009).
Comparison of the 14C specific activity in soil for different NPPs
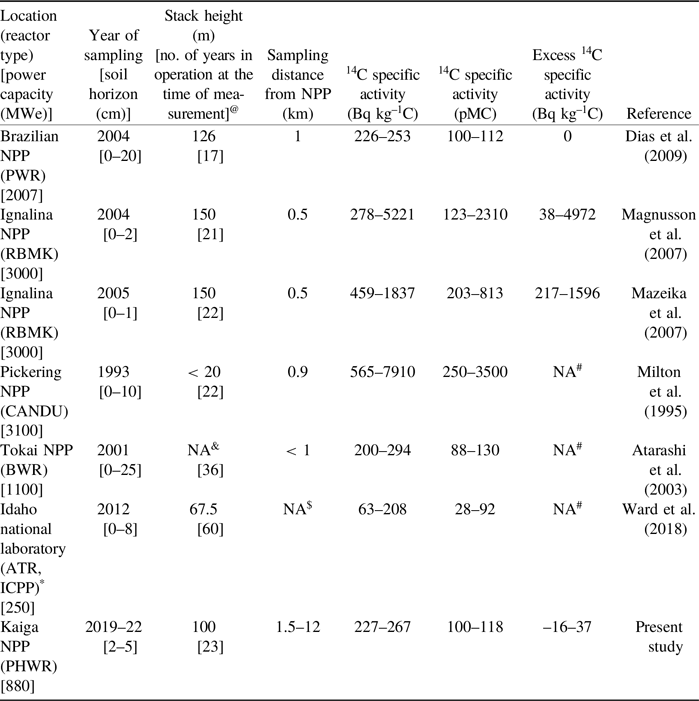
The 14C specific activity values reported by other investigators for the soil matrix in the vicinity of different NPPs and other nuclear facilities are listed in Table 4. Most of the values reported for other NPPs are for samples collected from proximity with distances < 1 km, whereas the closest sampling distance in the present study is 1.5 km from the Kaiga NPP. Very high 14C specific activity values (up to 3500 pMC) were reported in soil samples collected from the vicinity of Ignalina and Pickering NPPs. On the other hand, the 14C specific activity values recorded for the Kaiga NPP region are in the range of 100–118 pMC. Similar values have been reported for Brazilian NPP as well. The 14C specific activity values in the environmental matrices in the vicinity of a nuclear facility depend on reactor type, total power generation capacity, location of sampling station with respect to NPP, stack height, number of years of operation, prevailing wind regimes and topography, etc. The total power capacity of the Ignalina and Pickering NPPs is significantly higher when compared to the other reactors listed in Table 4, and the specific activity value reported for this facility corresponds to the samples collected from distances < 1 km. The release rates also depend on the type of reactor, the order being Canada Deuterium Uranium (CANDU) > Reaktor Bolshoy Moshchnosty Kanalny (RBMK) > Boiling Water Reactor (BWR) > Pressurised Water Reactor (PWR) (UNSCEAR 2000). Also, at the proximity of the NPP, the soil samples may have been influenced by diffuse leakages of the reactor, which are not observed at longer distances. The power capacity of the Kaiga NPP is lower when compared to the other NPPs listed in Table 4. Moreover, 14C activity in soil depends on whether the soil is virgin or disturbed. For example, very low 14C activity values have been reported for the samples collected at the Idaho national laboratory, and the reason attributed to this is the mixing of modern and aged carbon materials within the soil matrix (Ward et al. Reference Ward, Snow, Olson, Ball and Adamic2018). Owing to the dependency of excess 14C specific activity on different parameters, direct comparison and drawing inferences from the data presented in Table 4 is not possible.
A comparison of 14C specific activity and excess activity values reported for the soil matrix at different NPPs and nuclear sites of the world

# The specific activity values for the reference site (clean-air region) were unavailable to determine the excess specific activity.
& Information on the stack heights of Tokai NPP is not available.
$ Information on the distance of sample collection from the nuclear facility is unavailable.
@ The number of years in operation given in column 3 is calculated with respect to the year in which the sample is collected.
* ATR—Advanced Test Reactor; ICPP—Idaho Chemical Processing Plant.
14C specific activity of sediments in the vicinity of Kaiga NPP
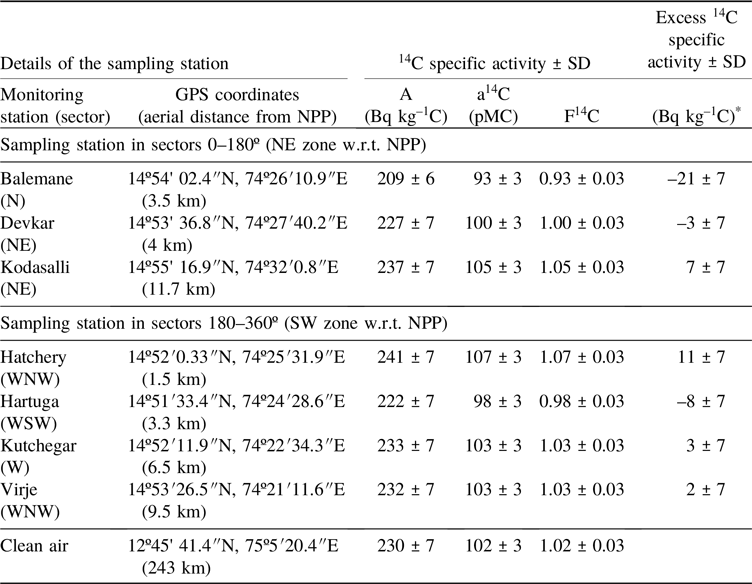
The 14C specific activity values for the sediment samples collected from the vicinity of Kaiga NPP are presented in column 3, and excess activity is presented in column 6 of Table 5. The majority of the sediment samples collected at different distances from Kaiga NPP showed 14C specific activity values similar to the ambient background levels, indicating negligible radio-ecological impact on sediments. Considering the uncertainty associated with the measurements, samples from only two stations exhibited specific activity above the ambient background activity for the clean air region (230 ± 7 Bq kg–1C, corresponding to 2022, data presented in the last row of Table 5). The box-whisker plot confirmed that there are no outliers in the dataset. The highest excess specific activity value (11 Bq kg–1C) was recorded for the sample collected at 1.5 km in the WNW sector (Table 5). On the other hand, the specific activity value recorded at a sampling site located at 3.5 km in the N sector was lower than the contemporary ambient background activity (negative excess activity), suggesting that this sediment may be derived from erosion of soil from deeper soil strata instead of topsoil horizon.
14C specific activity of sediment samples in the vicinity of Kaiga NPP and comparison with clean air region. The samples were collected during July 2022

* The excess activity was quantified based on the measured mean value of specific activity (230 Bq kg–1C) for the sediment sample collected from the clean air region for the year 2022.
Comparison of the 14C specific activity of sediment samples reported for different NPPs
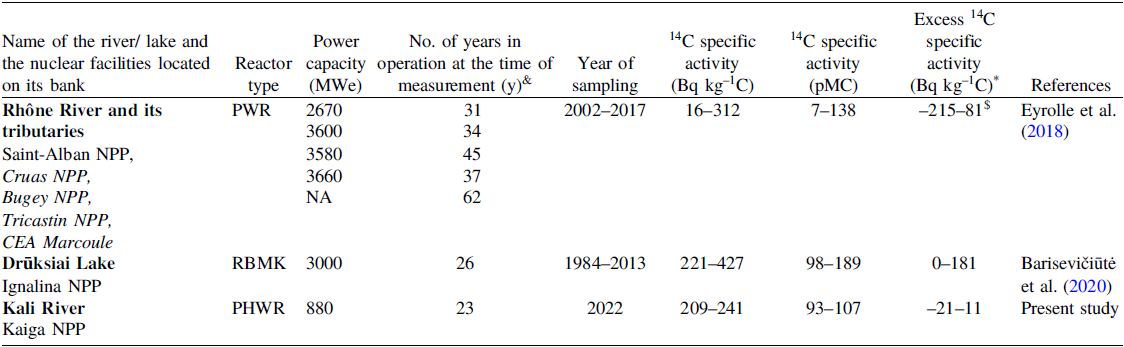
A literature review reveals that only a few studies have been published reporting the 14C specific activity in the sediment matrix. The data reported for sediment samples analyzed from the vicinity of different NPPs of the world are listed in Table 6 and compared with the values recorded for Kaiga NPP. The 14C specific activity values reported by Eyrolle et al. (Reference Eyrolle, Lepage, Copard, Ducros, Claval, Saey, Cossonnet, Giner and Mourier2018) for the different PWR NPPs located on the bank of River Rhône varied from 16 to 312 Bq kg–1C, and the sampling campaign was conducted from 2002 to 2017. Although the excess activity values were not reported in this publication, we calculated the value based on the specific activity of 231 Bq kg–1C reported by the authors for the atmospheric air samples from the control site. The excess 14C specific activity thus calculated varied from –215 to 81 Bq kg–1C. The 14C specific activity reported for the sediment samples collected from Drūksiai Lake during the years 1984–2013 in the vicinity of Ignalina NPP varied between 221 to 427 Bq kg–1C with the corresponding maximum excess activity of 181 Bq kg–1C (Barisevičiūtė et al. Reference Barisevičiūtė, Maceika, Ežerinskis, Šapolaitė, Butkus, Mažeika, Rakauskas, Juodis, Steponėnas, Druteikienė and Remeikis2020). The higher values (up to 312 Bq kg–1C) of specific activity reported for surface sediments collected from River Rhône were due to the release of 14C through the liquid effluents, whereas the lower values (below ambient background activity) were attributed to the dilution of the sedimentary particles with aged biospheric organic matter (Eyrolle et al. Reference Eyrolle, Lepage, Copard, Ducros, Claval, Saey, Cossonnet, Giner and Mourier2018).
A comparison of 14C specific activity and excess activity values reported for sediment matrix at different NPPs and nuclear sites worldwide

* The excess 14C specific activity for the Kaiga region was quantified based on the measured mean value of specific activity (230 Bq kg–1C) for the sediment samples collected from the clean air region for the year 2022. For other NPPs, the values reported for excess specific activity by the respective authors are tabulated.
& The number of years in operation given in column 4 is calculated with respect to the year in which the sample is collected.
$ The excess 14C specific activity was calculated with respect to the specific activity of 231 Bq kg–1C for the atmospheric air sample collected at the reference site (Eyrolle et al. Reference Eyrolle, Lepage, Copard, Ducros, Claval, Saey, Cossonnet, Giner and Mourier2018).
As discussed in the previous section, the release rate from the NPPs depends on the total installed power capacity, reactor type, and the operating conditions of the reactor. The IAEA (2004) has complied data on the releases of 14C through liquid effluents from various reactors, and the release from light water reactors such as PWR is higher than other reactor types. The cumulative power capacity of different PWR NPPs located on the bank of River Rhône is ∼13,510 MWe, whereas it is ∼3000 MWe for RBMK NPP at Ignalina NPP. The reason for the higher excess activity observed in the sediment samples from the vicinity of Ignalina NPP, when compared to the NPPs on the bank of Rhône River, is the elevated discharge of 14C incorporated water-soluble organic compounds used in the technological processes adopted for the operation, maintenance and decommissioning (Barisevičiūtė et al. Reference Barisevičiūtė, Maceika, Ežerinskis, Šapolaitė, Butkus, Mažeika, Rakauskas, Juodis, Steponėnas, Druteikienė and Remeikis2020). On the other hand, the lower excess 14C specific activity values were recorded (varied in the range –21 to 11 Bq kg–1C) for the sediments collected in the vicinity of Kaiga NPP. The total installed power capacity of PHWR reactors at Kaiga NPP is 880 MWe; therefore, lower excess specific activity is expected in the vicinity of this NPP when compared to the PWR reactors located on the bank of River Rhône and the RBMK reactors at Ignalina NPP. Furthermore, the clean-up system associated with HWRs, as in the case of Kaiga NPP, primarily employs once-through ion-exchange techniques to recycle heavy water, resulting in the minimal generation of liquid concentrates (Bajaj and Gore Reference Bajaj and Gore2006; Efremenkov Reference Efremenkov1989).
Conclusions
An improved method for measuring 14C specific activity in poor carbon matrices, such as soil and sediment, has been optimized, and its application to quantify the excess 14C specific activity in the vicinity of an NPP is demonstrated. The pyrolyzer tube furnace system for batch combustion of up to six samples was efficiently used for the thermal oxidation of up to 20 g of samples and determination of the 14C specific activity by LSC. The method was validated through AMS measurements. The MDA for the method was 10 Bq kg–1C for a counting time of 500 min and 7 Bq kg–1C for 1000 min counting, at 2σ confidence level. Analysis of soil and sediment samples from the vicinity of the Kaiga NPP proved that a small increment in 14C specific activity in these matrices can be quantified. Hence, this method is beneficial for impact assessments under environmental surveillance programs.
The maximum excess 14C specific activity values recorded for soil and sediment matrices from the vicinity of the Kaiga NPP were 37 ± 7 Bq kg–1C and 11 ± 7 Bq kg–1C, respectively. The 14C specific activity ratio for the recently fallen leaf litter and the soil underneath at most of the sampling points in the vicinity of the NPP had a mean value of 1.03 with an associated standard deviation of 0.07. Statistical tests confirm that the mean values of the data set of 14C specific activity of leaf litter and underlying soil are not significantly different. When compared to the terrestrial plants and atmospheric air, the marginally higher specific activity in soil samples in the clean air region indicates the presence of 14C derived from weapon testing in the 1950s and 1960s. The excess 14C specific activity recorded for soil and sediment samples in the vicinity of Kaiga NPP (1.5 km to 12 km region) is negligibly small, which confirms the negligible radioecological impact of the operation of the NPP on the environment.
Acknowledgments
The authors would like to thank the officials and scientists of Kaiga Generating Station, Kaiga, for extending logistical support for this study. The technical and logistic support from Dr. B. N. Dileep, Officer-in-charge, Environmental Survey Laboratory, Kaiga NPP, is gratefully acknowledged.