Implications
This study evaluated the expression stability of a set of well-known reference genes in porcine intramuscular stromal-vascular cells (MSVCs), whose adipogenic differentiation is critical for intramuscular fat deposition and pork quality. ACTB, ALDOA and RPS18 were identified to be most stably expressed throughout adipogenic differentiation, and suitable to be used for normalization in quantitative real-time PCR assay, whereas GAPDH was the last choice. This study has provided a valuable data for our further work to explore the molecular mechanism underlying porcine MSVCs adipogenic differentiation and intramuscular fat deposition.
Introduction
Marbling, or intramuscular fat (IMF) content, is a determinant factor affecting meat quality (Wood et al., Reference Wood, Enser, Fisher, Nute, Sheard, Richardson, Hughes and Whittington2008). The sensory quality and eating quality can be improved by increasing the IMF content (Hocquette et al., Reference Hocquette, Gondret, Baéza, Médale, Jurie and Pethick2010). Intramuscular stromal-vascular cells (MSVCs) (kind of pre-adipocytes) in skeletal muscle are endowed with distinct adipogenic potential (Hausman and Poulos, Reference Hausman and Poulos2004), transcriptome (Jiang et al., Reference Jiang, Wei, Song, Yang, Peng and Jiang2013) and microRNAome (Guo et al., Reference Guo, Mo, Zhang, Zhang, Cong, Xiao, He, Liu and Chen2012) compared with their counterparts in subcutaneous adipose tissue. Although many genetic and nutritional factors are documented to influence IMF content, the exact molecular mechanisms of MSVCs differentiation remain largely unclear.
Quantitative real-time PCR (qPCR) is usually considered as the gold standard for accurate, sensitive and fast estimates of gene expression, although it is subject to errors during the steps from RNA extraction to messenger RNA (mRNA) quantitative analysis (Garibyan and Avashia, Reference Garibyan and Avashia2013). Internal control genes (ICGs), sometimes referred to as housekeeping genes (Guénin et al., Reference Guénin, Mauriat, Pelloux, Van Wuytswinkel, Bellini and Gutierrez2009) must be used to normalize qPCR data. In theory, ICGs expression should not vary in the cells under investigation, or in response to stimuli. In fact, commonly used ICGs can considerably vary between species, tissue types and experimental conditions (Li and Shen, Reference Li and Shen2013). Furthermore, the conventional use of a single ICG to normalize the target mRNA transcripts may produce unreliable data (Ji et al., Reference Ji, Li, Lin and Lin2015).
Recently, more and more researchers have realized the importance of appropriate ICGs in qPCR assay, and induced two or more traditional ICGs (ACTB, GAPDH, TBP, etc.) when analyzing the relative quantities of genes of interest related with IMF deposition (Ayuso et al., Reference Ayuso, Óvilo, Rodríguez-Bertos, Rey, Daza, Fenández, González-Bulnes, López-Bote and Isabel2015; Liang et al., Reference Liang, Yang, Gu, Tao, Zhong, Gong, Chen and Lv2015). However, a thorough evaluation of ICGs expression stability in qPCR assay about genes related with intramuscular adipogenic differentiation has not yet been reported. Here, more than 30 candidate ICGs were tested for their expression stability in a time-course adipogenic differentiation in porcine MSVCs, with three publicly available tools of reference gene selection.
Material and methods
Ethics statement
Pigs used in our study were supplied by the Experimental Farm of Northwest A&F University. Animal handling and sample collection were conducted in compliance with the guidelines of the Animal Ethics Committee of Northwest A&F University.
Porcine MSVCs isolation and culture
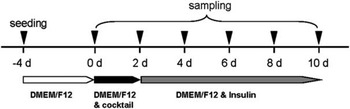
Porcine MSVCs were obtained as previously reported (Wang et al., Reference Wang, Zhu, Ma, Chen, Gao, Yu, Yang and Pang2015). Briefly, 3-day-old crossbred neonatal piglets were sacrificed by intraperitoneal injection of pentobarbital sodium (50 mg/kg BW) followed by exsanguination, and 4 to 6 g of longissimus dorsi muscle were aseptically collected without all visible connective tissues and blood vessels, and finely minced in phosphate-buffered saline containing 30 mg/ml kanamycin. The minced tissues were digested by 0.2% type-II collagenase (Sigma, Santa Clara, CA, USA) at 37°C for 2 h in a shaking water bath. Digesta were passed through sterile 200 and 100 μm steel mesh filters to isolate single cells. The cells collected were rinsed with serum-free DMEM/F12 (Gibco, Grand Island, NY, USA) for three times and resuspended in DMEM/F12 with 10% fetal bovine serum (FBS) (Invitrogen, Carlsbad, CA, USA). Cells were seeded at 6×10⁵/60 mm dishes (Corning, NY, USA). Cells were passaged into six-well plates when close to 70% to 80% confluence. Cells were switched into differentiation medium (DMEM/F12 with 10% FBS and IBMX-DEX-insulin cocktail) when reaching 100% confluence, and 2 days later, the medium was changed to DMEM/F12 with 10% FBS and 5 ng/ml insulin for another 8 days. Differentiating and differentiated cells were harvested every another day (Figure 1).
Experimental procedure for sampling during the adipogenic differentiation of porcine intramuscular stromal-vascular cells.

RNA purification and complementary DNA (cDNA) synthesis
Total RNA was extracted using Trizol (TaKaRa Bio, Inc., Dalian, China) according to the manufacturer’s instructions and was then treated with DNase I (TaKaRa Bio, Inc., Dalian, China) to remove genomic DNA contamination before RT reaction. The RNA concentration and purity were estimated NanoDrop 2000 (Thermo, Boston, MA, USA). The absorption ratios (260/280 nm) for all preparations were between 1.8 and 2.0. Aliquots of 2 μg RNA were subjected to electrophoresis using a 2% agarose gel to verify their integrity. Samples with a 28S/18S ribosomal RNA (rRNA) ratio between 1.5 and 2.0 without smears were used for the following experiment. cDNA was synthesized using a PrimeScriptTM RT reagent Kit (TaKaRa Bio, Inc., Dalian, China) according to the manufacturer’s instructions. The final volume of each RT reaction was 20 μl, which included 500 ng of total RNA.
qPCR
qPCR was conducted using three biological replicates and technical triplicates of each cDNA sample with the Multicolor Real-Time PCR detection system (iQ5, Bio-Rad Laboratories, Inc., Hercules, CA, USA) according to the manufacturer’s protocol. Each PCR reaction (with a total volume of 20 μl) consisted of 2 μl RT product, 0.8 μl each of the 10 μM forward and reverse primers, 10 μl SYBRH Premix Ex TaqTM II and 6.4 μl RNase-free water. Cycling conditions consisted of a denaturation step at 95°C for 30 s, followed by 40 PCR cycles of 95°C for 5 s, 60 °C for 20 s and 72°C for 20 s. Melting curve analysis was performed at the end of each PCR program to monitor non-specific product formation.
Totally, 31 well-known ICGs were tested in our study (listed in Supplementary Table S1). Primer sequences for BANF1, DAK, DPH3, GTF2H3, NSUN5, NUBP1, PRR3, SSU72, TIMM17B, VPS4A, COL1A1 and DBI were collected from a previous report (Monaco et al., Reference Monaco, Bionaz, de Lima, Hurley, Loor and Wheeler2010). GAPDH, ACTB, TBP, PPLA, TOP2B, ALDOA, B2M, HPRT1, PGK1, POLR2G, RPL4, RPS18, SDHA and YWHAZ were from another previous report (Park et al., Reference Park, Kwon, Hwang, Park, Kim and Kim2015). RPL13A was based on a documented work (Erkens et al., Reference Erkens, Van Poucke, Vandesompele, Goossens, Van Zeveren and Peelman2006). 18S rRNA were from another reported work (Pu et al., Reference Pu, Guo, Liu, Xiong, Wang and Du2015). UXT, TUBA, EIF3K, CLN3 and RPLP0 were designed by Primer3.0. The sequences for each set of primers were listed in Supplementary Table S2. The efficiency (E) of each pair of primer was determined across a range of standard dilutions (using a minimum 5log range) and calculated according to the formula E=10−1/slope. Only cycle threshold (Ct) values of <40 were used to calculate the correlation coefficients (r 2 values). All primer pairs used in this study had an amplification efficiency ranging from 95% to 105%.
Statistical analyses
The Ct was accessed from the iQ5 Optical System Software v2.0 software with auto thresholds and baselines in all experiments. The relative quantity of each gene was calculated based on the standard curve. The expression stability of candidate ICGs across the various experimental treatments was analyzed using three different mathematical algorithms: geNormPLUS (http://medgen.ugent.be/~jvdesomp/genorm/) (Vandesompele et al., Reference Vandesompele, De Preter, Pattyn, Poppe, Van Roy, De Paepe and Speleman2002), NormFinder (http://www.mdl.dk/publicationsnormfinder.htm) (Andersen et al., Reference Andersen, Jensen and Ørntoft2004) and BestKeeper (http://genequantification.com/bestkeeper.html) (Pfaffl et al., Reference Pfaffl, Tichopad, Prgomet and Neuvians2004). All three software packages were used according to the manufacturer’s instructions with default setting.
Results
Gene expression profile analysis
All of the ICGs detected in our study were expressed throughout the whole adipogenic process. The amplification specificity was confirmed using curve analysis and agarose gel electrophoresis, which showed a single peak for each unique amplicon of expected size for each gene. The primer efficiencies were in the recommended range (95% to 105%). Altogether, these results confirmed that the selected primers accurately amplify candidate ICGs.
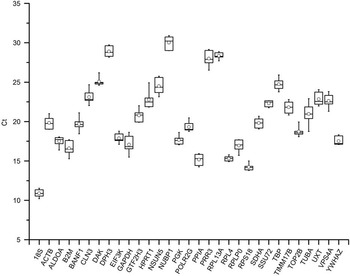
The calculated mean Ct values for all the ICGs in all the cDNA samples ranged from 10.22 to 30.92. Of the tested candidates, the transcript abundance was highest for 18S and lowest for NUBP1 (Figure 2). A great Ct dispersion was observed for TUBA, suggesting TUBA is not suitable for normalizing gene expression in terms of its mRNA expression pattern throughout adipogenic differentiation.
Range of cycle threshold values for the candidate reference genes obtained from all complementary DNA samples. Each box corresponds to candidate internal control genes. Whiskers represent the maximum and minimum values. The median is depicted as a line across the box and the mean is depicted as an empty circle.

Gene expression stability analyses
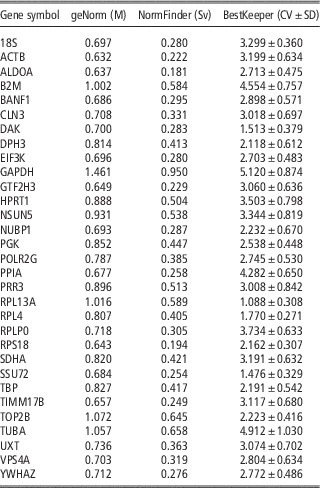
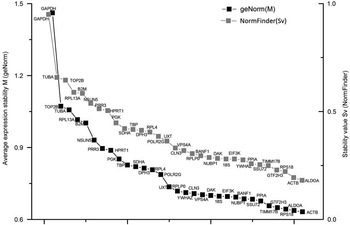
In geNorm analysis, M value was measured as the average pair-wise variation of a particular gene with all other ICGs, and the gene with the lowest M value has the most stable expression, and vice versa (Vandesompele et al., Reference Vandesompele, De Preter, Pattyn, Poppe, Van Roy, De Paepe and Speleman2002). The M value of all candidate ICGs in our study was <1.5, indicating that these candidate genes were suitable for use as endogenous control genes due to their stable expression, according to the geNorm analysis. GeNorm uncovered ACTB, ALDOA and RPS18 as genes with the most stable expression ratio (i.e. lowest M). Similarly, GAPDH was found to be the least stable gene with the highest M value (Table 1).
Gene stability values provided by geNorm (M), NormFinder (stability value (Sv)), CV and SD calculated by BestKeeper

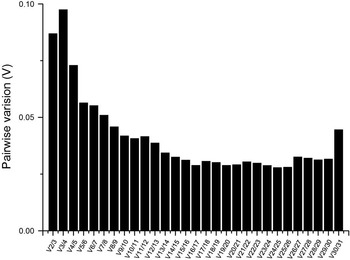
In addition, geNorm was used to calculate the number of optimal ICGs for normalization in qPCR assay. In our study, geNorm revealed 25 ICGs as the optimal number to be used with normalization factor (NF) calculation (with the lowest pair-wise variation (V)=0.028). However, the final number of ICGs to be used to calculate the NF often is a tradeoff between practical considerations and accuracy. As a routine, 0.15 was proposed as the cut-off value for V value (Vandesompele et al., Reference Vandesompele, De Preter, Pattyn, Poppe, Van Roy, De Paepe and Speleman2002), below which the inclusion of an additional control gene is not required. Sometimes, a strict cut-off of 0.10 was used (Bionaz and Loor, Reference Bionaz and Loor2007). In our study, all of the V n/n+1 were less than 0.10 (Figure 3), indicating increasing number of genes does not significantly change the value of the normalization analyses. However, simply using the three best ICGs is a valid normalization strategy in most cases and results in much more accurate and reliable normalization compared with the use of only one single non-validated reference gene (Vandesompele et al., Reference Vandesompele, De Preter, Pattyn, Poppe, Van Roy, De Paepe and Speleman2002). Thus a combination of the three most stable genes might be a good choice for qPCR assay.
Determination of the optimal number of internal control genes for normalization as assessed by geNorm. The geNorm program calculated the normalization factor (NF) from at least two genes and the variable V defines the pair-wise variation between two sequential NF values. According to the algorithm and software instructions, a cut-off value of 0.15 was used.

NormFinder assesses the expression variation by testing the stability value (Sv) for each individual gene. The gene with the lowest Sv value has the most stable expression, whereas the gene with the highest Sv value has the least stable expression (Andersen et al., Reference Andersen, Jensen and Ørntoft2004). NormFinder uncovered the three most stable (ALDOA, RPS18 and ACTB) and the least stable (GAPDH), which were similar with those identified by geNorm. However, a different ranking was obtained (Figure 4).
Rank of gene stability value (Sv) provided by geNorm and NormFinder.

BestKeeper was also used to calculate the CV and the standard deviation of the Ct values using the whole Ct value data set (Pfaffl et al., Reference Pfaffl, Tichopad, Prgomet and Neuvians2004). The most stable ICGs were identified based on having the lowest CV±SD. In this study, RPL13A, SSU72 and DAK were found to have remarkable stable expression in all samples. Although GAPDH were found to have the least stable expression, which was consistent with that obtained from geNorm and NormFinder (Table 1).
Discussion
IMF is an important contributor to pork quality. Evaluation of gene expression profiles at mRNA and protein level is extremely valuable for further elucidation of molecular mechanism involved in IMF deposition. qPCR may be the ideal experiment method to monitor gene expression at mRNA level, considering its sensitivity, specificity, accuracy and cost-effectiveness. However, an appropriate ICG should be used to normalize the raw PCR data, and the appropriate ICG should show consistent expression in various tissues and experimental conditions. The ICGs selected can significantly influence the results obtained. However, increasing evidence has shown that all of existing ICGs may vary depending the state of the cell or tissue, age and other experimental conditions (Zhang et al., Reference Zhang, Li and Sun2015). Up to now, although numerous qPCR analyses have been conducted to improve IMF content, a through test for the expression stability of commonly used ICGs in IMF is still lacking. Moreover, the stability of ICGs across adipogenic process has not been evaluated in MSVCs.
In pig, several reference gene studies have been performed in various breeds (Park et al., Reference Park, Kwon, Hwang, Park, Kim and Kim2015), within (Svobodová et al., Reference Svobodová, Bílek and Knoll2008) and across tissues (Nygard et al., Reference Nygard, Jørgensen, Cirera and Fredholm2007), time-course during early embryonic development (Kuijk et al., Reference Kuijk, du Puy, van Tol, Haagsman, Colenbrander and Roelen2007), pre and postnatal skeletal muscle development(Feng et al., Reference Feng, Xiong, Qian, Lei, Xu and Ren2010), yielding various ICGs in different context. These results suggest that constitutively expressed ICGs are not consistently stable across all cell types, tissues and developmental stages. In this study, we collected 31 ICGs on record and analyzed their expression stability in porcine MSVCs using three popular software packages: geNorm, NormFinder and BestKeeper.
GeNorm and NormFinder are two of the most commonly used method to screen stable ICGs required for qPCR normalization (Zhang et al., Reference Zhang, Li and Sun2015). GeNorm identifies the most suitable genes by calculating the gene stability measure (M) values, which indicate the changes in gene expression with respect to other genes. The higher the M values, the less variation in expression stability. GeNorm also suggest the optimal number of ICGs for qPCR normalization (Vandesompele et al., Reference Vandesompele, De Preter, Pattyn, Poppe, Van Roy, De Paepe and Speleman2002). NormFinder evaluates the expression variation by providing the Sv for each individual gene, and ranks the candidate ICGs from the most stable to the least stable (Andersen et al., Reference Andersen, Jensen and Ørntoft2004). BestKeeper is another algorithm to validate appropriate ICGs based on the standard deviation and CV of each single gene (Pfaffl et al., Reference Pfaffl, Tichopad, Prgomet and Neuvians2004). As a result in our study, the top three highest and lowest ranked genes were the same between geNorm and NormFinder, although the rankings of the candidate reference genes showed slightly different patterns among the programs.
ACTB, ALDOA and RPS18 ranked as the top three most stably expressed ICGs, revealed by geNorm and NormFinder. ACTB was documented to be a suitable reference gene during early porcine embryonic development (Kuijk et al., Reference Kuijk, du Puy, van Tol, Haagsman, Colenbrander and Roelen2007) and between porcine backfat and longissimus dorsi muscle (Erkens et al., Reference Erkens, Van Poucke, Vandesompele, Goossens, Van Zeveren and Peelman2006). RPS18 was reported to stably expressed during postnatal skeletal muscle development (Zhang et al., Reference Zhang, Tang, Wang, Long and Li2012) and among different tissues in Yorkshire pigs (Park et al., Reference Park, Kwon, Hwang, Park, Kim and Kim2015). Based on geNorm’s manual, combination of these three most stable genes might benefit a accurate and reliable normalization when analyzing qPCR in porcine MSVCs (Vandesompele et al., Reference Vandesompele, De Preter, Pattyn, Poppe, Van Roy, De Paepe and Speleman2002).
Unexpectedly, all the three software packages ranked GAPDH, one of the most commonly used ICGs, in the bottom position, suggesting that GAPDH may be not the optimal gene to use as ICGs in porcine MSVCs during adipogenic differentiation. GAPDH was also reported to be relatively unstable within (Svobodová et al., Reference Svobodová, Bílek and Knoll2008) and across (Nygard et al., Reference Nygard, Jørgensen, Cirera and Fredholm2007) various pig tissues. GAPDH showed least expression stability during skeletal muscle development (Feng et al., Reference Feng, Xiong, Qian, Lei, Xu and Ren2010) too.
The combination of NSUN5, TIMM17B and VPS4A was previously recommended to normalize qPCR data of porcine adipose-derived stem cells (Monaco et al., Reference Monaco, Bionaz, de Lima, Hurley, Loor and Wheeler2010), whereas in current study, all these three ICGs shown acceptable but not the lowest expression variability.
In summary, this study provides the first reported assessment of endogenous control genes in porcine MSVCs during adipogenic differentiation. In general, different software packages used to identify expression stability did not rank the candidate ICGs in the same order. The combination of ACTB, ALDOA and RPS18 is recommended by geNorm and NormFinder to normalize the qPCR assay. GAPDH is the least stable gene during porcine MSVCs adipogenic differentiation, and not a suitable reference gene for qPCR assay.
Acknowledgements
Authors’ contributions: X. L. and G. Y. conceived and designed the experiments; K. H. and X. L. performed the qPCR; K. H., F. C. and W. L. performed the cell culture; X. L. analyzed the data and wrote the paper; X.-E. S. and S. S. introduced our studies.
This work is supported by National Natural Science Foundation (31501925), Natural Science Foundation of Shaanxi Province (2014JQ3103), China Postdoctoral Science Foundation (2014M562465) and Major Projects for Genetically Modified Organisms Breeding (2014ZX0800947B).
Supplementary material
To view supplementary material for this article, please visit http://dx.doi.org/doi:10.1017/S1751731115002748