I. INTRODUCTION
Organometallic compounds are currently the main components of organic light-emitting diodes (OLEDs), Reference Yang, Hao, Wang, Li, Wang and Xu1 but some biological applications have also been found for these substances. For example, screening technique based on the oxidation processes of some ligands, followed by the quenching of the phosphorescence in the presence of cellular oxygen, seems to be a promising biological application. Reference Rosselli, Quirino, Legnani, Calil, Teixeira, Leităo, Capaz, Cremona and Achete2,Reference Shinar and Shinar3
Iridium complex compounds have attracted attention as emitters for efficient electrophosphorescent devices. Special attention has been devoted for the compounds with different types of ligands and several attempts have been made to find proper ligands that generate white light. Reference Mao, Hong and Yeh4 The most effective approach is to find an organometallic compound with three types of ligands that can emit three colors based on its phosphorescent properties. Another way to produce such a mixture of colors is to extend the structure of the ligands by adding heavy ions or radicals, which changes the electronic distribution of the ligands. Reference Polosan and Radu5,Reference Polosan, Radu and Tsuboi6
Until now, there have been few examples of iridium cyclometalated molecules that exhibit red emission in full color RGB displays, Reference Sengottuvelan, Yun, Kim, Hwang, Kang and Kim7 because the low energy band gap of the red emission (or phosphorescence) generally limits its quantum yield. Reference Bera, Cumpustey, Burn and Samuel8 As a result, an overlap between the ground state and the excited state occurs due to the vibrations that increase the nonradiative transitions, destroying the red emissions.
As a consequence, finding new complexes that provide red emissions is a continuous challenge. Red emission compounds can be synthesized using heteroleptic complexes, such as 2-phenylquinoxaline, Reference Sengottuvelan, Seo, Kang and Kim9 or with a 2-pyrazinecarboxylic acid substituent. In the case of 2-phenylquinoxaline, a lower band gap occurs because of the delocalization of the p electrons from the aromatic ligand chromophore, which is dominated by the Ir–N bonds and complex combinations of Ir–O bonds from the ancillary ligands. From this point of view, IrQ(ppy)2 seems to be a stable red emitter compound.
The most important parameters of the organometallic compounds which can be used in the OLED technology are high decomposition and glass transition temperatures. For example, a decomposition temperature over 300 °C should be high enough to deposit molecules without any decomposition under reduced pressure. Reference Jung, Lee, Kim, Park, Park and Kang10 Secondly, a glass transition temperature over 110 °C should be enough to exceed the joule effects which occur during the operation of the OLED devices. Reference Rothmann, Fuchs, Schildknecht, Langer, Lennartz, Munster and Strohriegl11
IrQ(ppy)2 combines two types of ligands, phenylpyridine for green phosphorescence and quinoline for red phosphorescence. Organometallic complexes like IrQ(ppy)2–5Cl or IrQ(ppy)2–5CH3 have triclinic or monoclinic structure, but have weak red emission compared with their green emission. Reference Huang, Chow, Wu, Sun, Tsai, Wen, Polosan and Tsuboi12 This study presents the synthesis and structural characterization of IrQ(ppy)2 organometallic compound. Several methods were used to identify their crystallographic structure, such as x-ray diffraction (XRD) and scanning electron microscopy (SEM), together with specific measurements concerning the thermal behavior of IrQ(ppy)2 organometallic compound, namely, thermogravimetric analysis (TGA) and differential scanning calorimetry (DSC). Moreover, to determine the nature of bonds around iridium ions, the x-ray photoelectron spectroscopy (XPS) and backscattering electrons (BSE) were used. To study the emissive properties of the IrQ(ppy)2 under an electron beam, the cathodoluminescence (CL) spectrum and the image patterns for the red monochromated light were examined. The purity of the final compound was checked with nuclear magnetic resonance (NMR).
II. EXPERIMENTAL
A. Synthesis
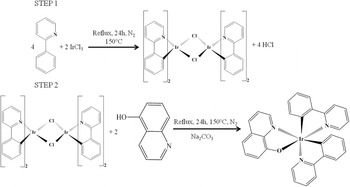
To synthesize the IrQ(ppy)2 compound, a two-step reaction procedure was used. Reference Yi, Yang, Liu, Xu, Wang, Cao and Gao13 In the first step, iridium chloride reacts with phenylpyridine, forming a [(C^N)2Ir-µ-Cl]2 bridged dimer, which will be referred to as the “intermediate compound” hereinafter. A mixture of 2-phenylpyridine (ppy), 2-ethoxyethanol, and iridium chloride hexahydrate was heated to reflux under a nitrogen atmosphere for 24 h. The yellow precipitate was cooled and washed with ethanol and then dried in vacuum. The chemical yield varied between 75 and 80%. The second step involved the reaction of the intermediate compound with 8-hydroxyquinoline leading to the formation of the final complex, IrQ(ppy)2 in which the mixture of 2-ethoxyethanol, [(C^N)2Ir-µ-Cl]2, 8-hydroxyquinoline, and sodium carbonate was heated to reflux under a nitrogen atmosphere for 24 h (Fig. 1).
Two-step synthesis of the IrQ(ppy)2 compound.

It was then cooled to room temperature and filtered to extract the precipitate from 2-ethoxyethanol. The crude product was dissolved in dichloromethane and filtered to remove the sodium carbonate catalysts. The IrQ(ppy)2 powder was obtained after crystallization from dichloromethane and dried 12 h at 60 °C. The chemical yield for the final compound varied between 55 and 60%.
B. Characterization
The XRD measurements were performed on a BRUKER D8 ADVANCE type x-ray diffractometer (Karlsruhe, Germany), in focusing geometry, equipped with copper target x-ray tube and LynxEye one-dimensional detector, using CuKα1 radiation (λ = 1.54056 Å), at 40 kV and 40 mA. The 2θ scan range was 5–20°, with a step size of 0.02° and a resolution of 0.01°. The line width was determined after subtraction of Kα2 lines from the Kα1–Kα2 doublet, using the Rachinger algorithm with the Bruker Difracplus Basic Evaluation program package. Reference Rachinger14 The entire spectrum was refined by using Crystal Sleuth software Reference Laetsch and Downs15 to determine the crystallographic behavior of the final compound.
A Zeiss EVO 50 SEM (Berlin, Germany) with a LaB6 cathode with the Bruker EDX system was also used. Based on the SEM images, the equipment may generate secondary electrons (SEs), backscattered electrons, characteristic x-ray and CL. All SEM and CL images are taken under 30 kV electron beams. TGA of the samples was conducted on Q500 TA equipment, using nitrogen atmosphere from 20 to 800 °C with 10 °C/min heating rate. For the DSC, NETZSCH DSC 204 F1 equipment (Selb, Germany) with an aluminum crucible was used. The temperature range was set between 20 and 400 °C, with a 10 °C/min heating rate in nitrogen atmosphere. The XPS spectra were recorded on Thermo Scientific K-Alpha equipment, fully integrated, with an aluminum anode monochromatic source. Survey scans (0–1200 eV) were performed to identify the composition of the intermediate and final compounds.
NMR measurements were performed in chloroform, which was used as a NMR standard solvent. NMR was performed with a Bruker Advance DRX 400 MHz (BioSpin, Rheinstetten, Germany) at room temperature (approximately 26 °C).
III. RESULTS AND DISCUSSION
The 1H NMR spectrum is dominated by chemical shifts from the phenylpyridine ligand, with a few shifts from quinoline: 7.99 ppm (1H, d), 7.66 ppm (1H, q), and 7.05 ppm (1H, d) for the pyridine ring; 6.79 ppm (4H, m) and 6.27 ppm (1H, d) for the phenolic ring. These shifts are in good agreement with those of the similar compound, IrQ(ppy)2–5Cl.
Organometallic compounds with two different types of ligands, in which Cl and CH3 replace the hydrogen ions in the quinoline ring, show similar structures, i.e., monoclinic and triclinic, respectively. Reference Huang, Chow, Wu, Sun, Tsai, Wen, Polosan and Tsuboi12 The secondary phase appears to be due to a reduced chemical yield, which, in our case, varies between 55 and 60%. It is important to mention that, without the recrystallization process following the filtration procedure of the final compound, a rather amorphous structure was observed, which was probably influenced by other compounds added as catalysts.
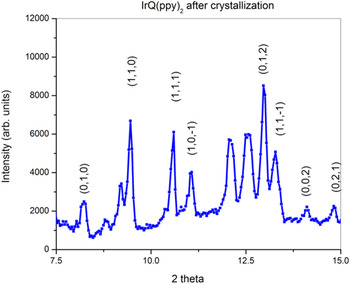
Figure 2 shows the XRD patterns of IrQ(ppy)2 after crystallization from dichloromethane. The main peaks are assigned to a triclinic structure but some peaks suggest a secondary phase that appears during the chemical reaction. Data collection and refinement parameters for this triclinic structure, with P-1 symmetry, have the following parameters a = 10.3; b = 13.0; c = 13.8; α = 65.6°; β = 86.7°; γ = 60° and a volume structure of V = 1500.
XRD patterns of IrQ(ppy)2 after recrystallization.

To investigate the thermal stability of the organometallic compounds, TGA and DSC were performed.
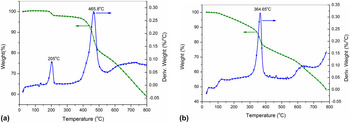
TGA of the intermediate and the final compounds is shown in Figs. 3(a) and 3(b). For the intermediate compound, the TGA curve shows a small mass decreasing by 3.3% with a sharp peak at around 205 °C in the derivative signal, followed by a strong decrease of about 15% with a peak centered at 465 °C.
(a) TGA of the intermediate compound. (b) TGA of the final compound.

Following the molecular masses involved in the intermediate compound (1076.24 g/mol), these peaks can be assigned to the broken dimer that releases the chlorine ions in the first step and the phenylpyridine ring (155.22 g/mol) in the second step. This fact is supported by the similar behavior of the well-known Ir(ppy)3 compound, which exhibits a weight loss greater than 5% at approximately 423 °C. Reference Lee, Park, Yang and Kang16
In the case of some mixed ligands, the weight loss is different, depending on the type of ligand in question. For example, the mer-Ir(dfpypy)3 compound exhibits over 5% weight loss centered at 384 °C compared with the fac-Ir(dfpypy)3 which has weight loss centered at 452 °C. Reference Jung, Lee, Kim, Park, Park and Kang10 In our case, the weight loss is centered at approximately 365 °C, the temperature decrease being due to the weak coupling of the quinoline ligands with the compound resulting from the chemical reaction with the intermediate compound. Reference Polosan and Radu5 In fact, the relatively low decomposition temperature is related to the weak hybridization between the iridium and quinoline ligands through Ir–O bond.
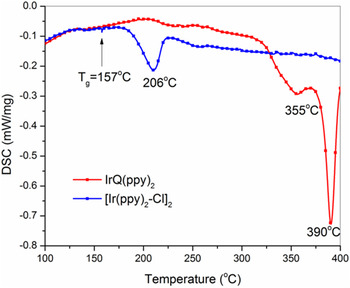
Concerning the DSC curve shown in Fig. 4, the intermediate compound exhibits a relatively low stability, with an endothermic peak at around 206 °C, which begins at about 177 °C and ends at 227 °C, with an enthalpy of approximately 13.12 J/g. In the case of the final compound, DSC patterns show a higher stability, the melting point being centered at around 355 and 390 °C with an enthalpy of about 28.64 J/g. These peaks are assigned to the melting process of the mixed IrQ(ppy)2 compound.
DSC patterns of the intermediate and final compound.

In DSC patterns, a small decreasing step at approximately 157 °C is observed, and can be assigned to the glass transition temperature, T g. This fact is similar to the case of mer-Ir(dfpypy)3, for which T g was observed at 159.8 °C with a melting point at 383 °C, according to DSC experiments. Reference Jung, Lee, Kim, Park, Park and Kang10 Even if the endothermic peak at 206 °C is somehow asymmetric, the coincidence between DSC and the derivative weight in the TGA at 205 °C leads to a structural change of the intermediate compound which releases the chlorine ions.
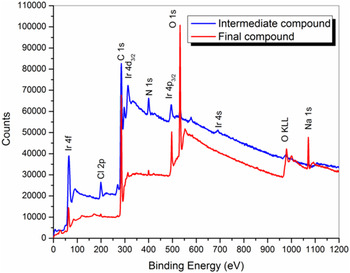
To investigate the elemental composition of the intermediate and final compounds, the XPS technique was used, particularly to point out the changes in the 4f states of the Ir ions. The core level spectra were registered using a hemispherical energy analyzer for electron detection with an energy resolution of 100 meV. A complete survey of the XPS spectra for the intermediate and the final compounds reveals some interesting features, some of which are theoretically predicted (Fig. 5). The intermediate compound shows a large concentration of the chlorine 2p photoemission at 198.3 eV, which is almost completely absent in the final compound. Moreover, the oxygen 1s photoemission of the final compound at 531.4 eV is enhanced compared with intermediate compound. The photoemission peak of Na 1s at 1072 eV comes from Na2CO3 which was added as a catalyst and which increases the rate of the chemical reaction by reducing the activation energy. This remains unchanged during the reaction. Traces of Na do not affect the spectroscopic characteristics of the final compound.
XPS survey scans of the intermediate and final compound.

The 4f7/2 seems to have the same position in both compounds, at 61.4 ± 0.1 eV, while the 4f5/2 is situated at 64.1 ± 0.1 eV [Figs. 6(a) and 6(b)]. The binding energy of the Ir 4f7/2 core level for metallic Ir is centered at 60.8 eV and the splitting of the 4f7/2–4f5/2 doublet is 2.9 eV. Reference Wagner, Riggs, Davis, Moulder and Muilenberg17 The ratio between 4f7/2–4f5/2 intensities was maintained at 4:3 in all the fitting procedures.
(a) Ir 4f XPS spectrum of the intermediate compound. (b) Ir 4f XPS spectrum of the IrQ(ppy)2.

The main difference in the XPS spectra between the intermediate and the final compound is related to the presence of 64.8 ± 0.1 and 66.3 ± 0.1 eV peaks in the intermediate compound in the dimer configuration. The first peak at 64.8 ± 0.1 eV is attributed to the Ir–Cl by comparison with other similar compounds. Reference El-Issa, Katrib, Ghodsian, Salsa and Addassi18 The presence of the peak from 66.3 ± 0.1 is controversial. The appearance of this peak is apparently without chemical backup and it has been explained as being a result of the final state screening responses, i.e., conduction band interaction during the photoemission process. Reference Atanasoska, Atanasoska and Trassati19 This peak does not appear in the spectrum of the final compound. For the final compound, the presence of the peak centered at 63.06 ± 0.1 eV could be assigned to Ir–O bond from the quinoline ligand, by comparison with IrO x compounds. Reference Atanasoska, Gupta, Deng, Warner, Larson and Thompson20
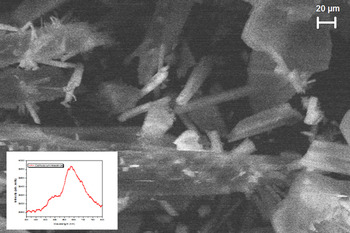
The CL technique is closely related to the photoluminescence (PL) spectroscopy due to their incoherent part of the emission. Basically, the sample is excited with electrons, after which decays inelastically and emits light in the visible region. The most important difference between CL and PL is the excitation source, which in this case is an electron beam. Excitation with an external light is coupled with strong dipole modes. The electron beam can excite metastable levels, Reference García de Abajo21 because they are capable of transferring large momenta to the sample under investigation. This method is quite useful for the study of the organometallic compounds because of the primary property of these materials: emission from the triplet states, as in the case of Alq3 which contain also quinoline ligands. Reference Radu, Polosan, Enculescu and Iovu22 Under 30 kV electron beam the CL spectrum shows two main peaks, one at 530 nm (2.34 eV) and another, more intense peak at 635 nm (1.95 eV), the spectrum being measured on powder.
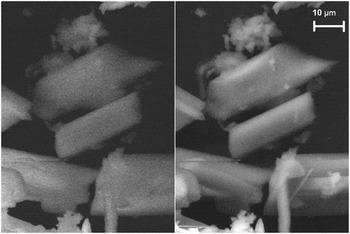
Figure 7 shows the CL image patterns of the IrQ(ppy)2 compound in monochromatic light centered at 635 nm (1.95 eV), in which the triclinic structure of the nanocrystals can be distinguished. It can be seen that some of them are dispersed, while some are in aggregated structures.
Cathodoluminescence and SEM images of the final compound

The CL spectrum is similar to the PL spectrum of IrQ(ppy)2–5Cl embedded in the polystyrene matrix, but the intensity of the red emission is greater than that of green. Reference Polosan, Radu and Tsuboi6 This fact confirms the dual emitter characteristic of the IrQ(ppy)2 organometallic compound.
The SEM images show the formation of some triclinic structures by recording the SE profile. In Fig. 8, a comparative image between CL and SE images reveals the same structures on a relative large spot size under an electron beam of 30 kV. The size of the luminescent structures is approximately 30 μm.
Cathodoluminescence image and spectrum of the IrQ(ppy)2.

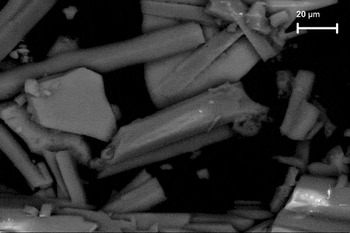
To identify the spatial distribution of the iridium ions in the IrQ(ppy)2 compound, a BSE image was taken (Fig. 9). Larger atoms (with a greater atomic number, Z) have a higher probability of producing an elastic collision because of their greater cross-sectional area. Consequently, the number of backscattered electrons reaching a BSE detector is proportional to the mean atomic number of the sample.
Backscattering electron image of the IrQ(ppy)2.

A “brighter” BSE intensity correlates with greater average Z in the sample, and “dark” areas have lower average Z. In our sample, the iridium atoms are considered to be the larger atoms, compared with the Z of the other elements (C, O, N, H) and the BSE images show a relatively uniform distribution of iridium ions.
IV. CONCLUSIONS
A dual emitter IrQ(ppy)2 organometallic compound was synthesized by combining two types of ligands (phenylpyridine and quinoline), with green and red emissions, following a classical two-step reaction. The chemical yield varied between 55 and 60%. The purity of the final compound was checked with the NMR measurements, which confirmed that the structure contained the two types of ligands.
XRD patterns of partially crystalline powder, obtained from dichloromethane, show a P-1 triclinic structure, which was confirmed by SEM and CL images. DSC patterns of the intermediate compound show decomposition of the bridged dimer in two steps, firstly due to the chlorine release and then by phenylpyridine decomposition. For the final compound IrQ(ppy)2, a single exothermic peak was found and assigned to decomposition of the mixed ligands.
The XPS peak positions of the 4f levels of iridium show different behaviors between the intermediate and final compounds. The intermediate compound shows several peaks assigned to iridium-chloride in the bridged dimer and Ir–Cl bonds, respectively. Through comparison with IrO x compounds, in IrQ(ppy)2, the peak centered at 63.06 ± 0.1 eV could be attributed to the Ir–O bond. The SEM images show a polycrystalline structure in both samples and a relatively uniform distribution of iridium ions in the backscattering electron images.
The CL spectrum between 400 and 800 nm indicates two peaks centered at 530 nm (green emission) and 635 nm (red emission) and the CL image, in monochromatic light at 635 nm, confirms a triclinic phosphorescent organometallic compound.
ACKNOWLEDGMENT
This work was supported by a grant of the Romanian National Authority for Scientific Research, CNCS-UEFISCDI, project number PN-II-ID-PCE-2011-3-0620.