Introduction
Obesity and metabolic syndrome are major public health concerns in both developed and developing countries. Importantly, it has been estimated that over 30% of women worldwide in their reproductive years are obese.Reference Nathanielsz, Ford and Long 1 , Reference Vickers 2 Developmental programming can be defined as the response to a specific challenge during a critical time window of mammalian development with effects on health that persist throughout life.Reference Nathanielsz, Ford and Long 1 Studies in humansReference Ravelli, van der Meulen and Michels 3 – Reference Roseboom, van der Meulen and Osmond 5 and in animal modelsReference Zambrano, Bautista and Deas 6 – Reference Torres, Bautista and Tovar 9 have reported that an adverse fetal and neonatal nutritional environment can induce in the offspring obesity, impairment of glucose metabolism, insulin resistance and metabolic syndrome, some of these can persist even in the second generation.Reference Zambrano 10 , Reference Zambrano, Martinez-Samayoa and Bautista 11 Although the mechanisms of metabolic programming by maternal diet are now better explained, few studies have addressed interventions that prevent or recuperate adverse offspring phenotypes. Animal studies have shown that nutritional or life-style-targeted therapeutic interventions during windows of developmental programming have the ability to reverse adverse offspring metabolic outcomes.Reference Nathanielsz, Ford and Long 1 , Reference Vickers and Sloboda 12 Most interventional approaches have been performed in mothers, before or during pregnancy,Reference Vickers and Sloboda 12 – Reference Zambrano, Martinez-Samayoa, Rodriguez-Gonzalez and Nathanielsz 15 whereas interventions after establishment of the programmed offspring phenotype are lacking. Therefore, in this study, we hypothesized that later life dietary intervention with two different diets based on either animal or vegetable proteins reverts, in adult female offspring, the negative metabolic outcomes caused by maternal protein restriction during pregnancy.
Materials and methods
Care and maintenance of animals
All procedures were approved by the Institutional Animal Experimentation Ethics Committee of Instituto Nacional de Ciencias Médicas y Nutrición Salvador Zubirán (INNSZ), Mexico City, and were in accordance with international laws for laboratory animal care. Eighteen virgin female albino adult Wistar rats aged 15–17 weeks and weighing 220–260 g with regular cycles were obtained from INNSZ and maintained on chow diet (Purina 5001) at 22/23°C under controlled lighting (lights on from 07:00 am to 07:00 pm). Females were mated with proven male breeders (two females per one male). The day on which spermatozoa were detected in a vaginal smear was designated as conception (day 0). Only rats that got pregnant within 5 days of introduction of the male were included in the study. On day 0, pregnant rats were transferred to individual cages and randomly allocated to be fed either 20% casein protein (C – casein control diet group, n=6) or 10% casein protein isocaloric diet (R – casein restricted diet group, n=6). The casein diet was provided in the form of large flat biscuits retained behind a grill through which the rats nibbled the food.
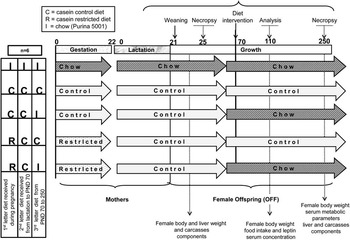
Pregnant rats were weighed daily and given free access to the assigned diet and water. The day of delivery (22 post-conceptual days) was considered as day 0 of postnatal life. All rats were born via spontaneous vaginal delivery. Time of delivery, litter size and pup weight were recorded at birth. To ensure homogeneity of study animals, litters over 14 pups were not included in the study. Litters comprised 10–14 pups were adjusted to 10 pups per mother, while maintaining a sex ratio as close to 1:1 as possible. After delivery, both C and R mothers were fed the C diet during lactation. In this study, we report data on female offspring. Male offspring were included in another study. At weaning, postnatal day (PND) 21, pups were separated from their mothers and female offspring were fed the C diet ad libitum until young adulthood (PND 70). At PND 70, female offspring either continued with the C diet (CCC and RCC) or were fed commercial Chow Purina 5001 called dietary intervention (I), CCI and RCI until PND 250. Another group of mothers and offspring were fed I throughout (III). For all the groups, n=6 offspring from different litters.
On PND 110, one female from each litter was fasted overnight and blood was obtained by retro-orbital puncture for serum leptin quantification. On PND 25 and 250, one female rat from each litter was fasted for 8 h and then euthanized between 10:00 and 11:00 am by decapitation performed by an experienced personnel trained in the procedure using a rodent guillotine (Thomas Scientific, USA). Trunk blood was collected into polyethylene tubes and allowed to clot at 4°C for 1 h, centrifuged at 1500 g for 15 min at 4°C and the serum was stored at −20°C until assayed. Offspring livers and carcasses were dissected, cleaned, weighed and frozen at −75°C.
Dietary intervention
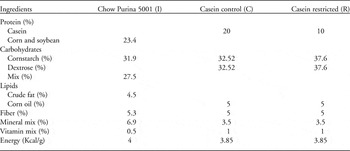
At PND 70, female offspring either continued with the C diet or were subjected to dietary intervention by feeding I diet, which contained vegetable protein (Table 1). The experimental design is provided in Fig. 1.
Study time in pregnancy and lactation followed by dietary intervention at postnatal day 70.

Diet composition

Body weight and food intake measurements
Body weight was recorded at PND 110 and 250. From PND 95 to 110 and from 235 to 250, food intake was measured daily, and an average of the 15 days recorded was compared between the groups.
Blood glucose measurement
At PND 250, serum glucose concentrations of the female offspring were determined spectrophotometrically by the enzymatic hexokinase method (Beckman Coulter Co. Fullerton, CA, USA). Intra- and inter-assay coefficients of variations were <2% and <3%, respectively.
Triglycerides and total cholesterol measurement
At PND 250, serum triglycerides and total cholesterol concentrations of female offspring were determined enzymatically using the Synchron CX auto analyzer (Beckman Coulter Co.). Intra- and inter-assay coefficients of variation were <7% and <6% for triglycerides and <4% and <3% for cholesterol, respectively.
Leptin radioimmunoassay
At PND 110 and 250, serum leptin concentrations of female offspring were determined by RIA using commercial rat kits from Linco Research Inc. (St. Charles, MO, USA Cat. RL-83K). The intra- and inter-assay coefficients of variation were <4% and <5%, respectively.
Carcass components
At PND 25 and 250, offspring carcasses were obtained and were frozen at −20°C in individual plastic bags until analysis. Before analysis, the abdomen was opened and the stomach and cecum were excised and discarded. After weighing (wet weight), each carcass was chopped into small pieces, placed in a tared beaker and dried at 60°C to a constant weight. The amount of weight lost was a measure of body water content. The dried carcasses were ground and aliquots were taken for fat determination by the Soxhlet method and for total nitrogen (N) estimation by the Kjeldahl method, as previously described.Reference Zambrano, Bautista and Deas 6
Statistical analysis
All data are presented as mean±s.e.m., n=6 per group. Differences between groups were compared using multiple ANOVA followed by Tukey’s test. Student’s t-test was also used to compare results of pregnancy diet and adult dietary intervention CCC v. CCI and RCC v. RCI. P<0.05 was considered statistically significant.
Results
Maternal body weight during pregnancy and lactation
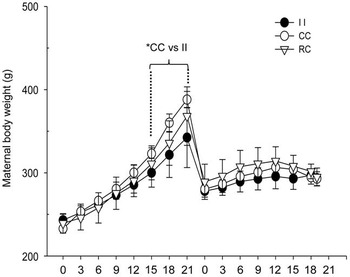
Maternal body weight increased as pregnancy advanced. From day 15 to the end of pregnancy, mothers fed the control casein diet showed increased weight gain compared with diet II (CC=155±11 v. II=99±8.4 g; P<0.05), no differences were observed between the RC and CC groups (Fig. 2). No statistical differences were observed in maternal body weight among the different diets during lactation or at weaning.
Maternal body weight during gestation and lactation. Mean±s.e.m., n=6 mothers per group. P<0.05* CC v. II.

Offspring body weight and carcass composition before dietary intervention as young adults
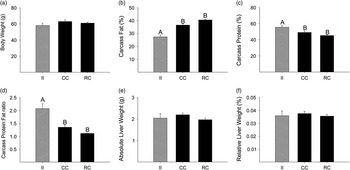
At PND 2, female pups from mothers fed the R diet during pregnancy had significantly lower body weight compared with the CC group (II: 7.8±0.1ab; CC: 8.2±0.2a and RC: 7.4±0.1b g; P<0.05 for groups not sharing at least one letter). RC females demonstrated complete catch-up growth by PND 25, as weights were similar at this pre-pubertal age (Fig. 3a). Carcass fat was increased and carcass protein was reduced in casein-fed female offspring (CC and RC) compared with group II (Fig. 3b and 3c). As a consequence, the protein:fat ratio was reduced in the CC and RC groups compared with group II (Fig. 3d). No differences were found in absolute or relative liver weight (Fig. 3e and 3f, respectively).
Female offspring body weight (a), carcass fat (b), carcass protein (c), carcass protein fat:ratio (d), absolute liver weight (e) and relative liver weight (f) at postnatal day 25. Mean±s.e.m. Females from n=6 litters per group. Data not sharing a letter are statistically different, P<0.05.

Body weight after dietary intervention
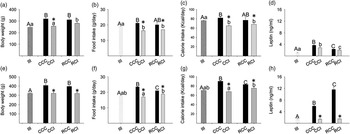
At PND 110, body weight was higher in the casein-fed CCC and RCC offspring compared with group III. After 40 days of dietary intervention, body weight decreased in the CCI group compared with CCC, but RCI animals were heavier compared with III and CCI animals (Fig. 4a). At PND 250, offspring that received the casein diet (CCC and RCC) were heavier than animals in III, CCI and RCI groups, and there were no differences between chow-fed animals (III, CCI and RCI; Fig. 4e).
Female offspring body weight (a, e), food intake (b, f), calorie intake (c, g) and serum leptin concentration (d, h) at 110 (a, b, c, d) and 250 postnatal days (e, f, g, h) (mean±s.e.m). n=6 females from litters per group. Capital letters show differences between groups III, CCC, RCC with no dietary intervention. Small letters show differences after dietary intervention III, CCI and RCI. *Refers to differences between the casein-fed groups with and without dietary intervention. Data not sharing a capital or a small letter are statistically different, P<0.05.

Food intake at 110 and 250 PND
At PND 110, food and calorie intake was increased in the CCC group compared with group III. Dietary intervention decreased the food and calorie intake of CCI and RCI animals compared with casein-fed animals (CCC and RCC) and with group III females (Fig. 4b). By PND 250, food and calorie intake was higher in the CCC group compared with the RCC and RCI groups (Fig. 4f and 4g, respectively). Dietary intervention maintained lower food and calorie intake in the CCI and RCI groups compared with their casein-fed counterparts. No differences were found between group III and CCI animals, but RCI animals had a higher intake compared with group III animals (Fig. 4f).
Serum leptin levels at PND 110 and 250
At PND 110, serum leptin levels were lower in group III compared with all the other groups; the CCC group had higher values than the RCC group, whereas the CCI group had higher values than the RCI group (Fig. 4d). By PND 250, leptin levels were higher in females that continued with the C diet compared with group III animals, and the RCC group had greater values compared with the CCC group. In contrast, changing to I diet from PND 70 diminished serum leptin concentrations to levels similar to that of group III (Fig. 4h).
Adult carcass composition
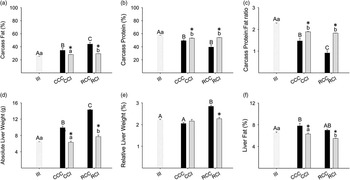
At PND 250, the percentage of carcass fat was higher in the RCC group compared with the CCC group, and the CCC animals had higher values than group III animals. Changing the diet at PND 70 diminished fat percentage in the CCI and RCI animals, although RCI animals had higher fat content than group III animals (Fig. 5a). At the same age, carcass protein content was lower in the CCC and RCC groups compared with group III, a significant recovery in body protein was observed in the CCI and RCI animals (Fig. 5b). Lower protein:fat ratio was found in the CCC group compared with the RCC group, and both had higher ratios than group III; dietary intervention from PND 70 increased protein and decreased fat content leading to a significant increase in their ratio. Although intervention improved carcass composition, CCI and RCI animals still had lower protein:fat ratio compared with group III animals (Fig. 5c).
Female offspring carcass fat (a), carcass protein (b), carcass protein:fat ratio (c), absolute liver weight (d), relative liver weight (e) and liver fat (f) at postnatal day 250 (mean±s.e.m.). Females from n=6 litters per group. Capital letters show differences between casein fed groups with no dietary intervention and III. Small letters refer to differences after dietary intervention and III. *Refers to differences between the casein fed groups with and without dietary intervention. Data not sharing a capital or a small letter are statistically different, P<0.05.

Adult liver composition
At PND 250, liver weight was higher in the RCC group compared with the CCC group, and the lowest liver weight was observed in group III offspring. Intervention reduced absolute liver weight in both CCI and RCI groups; however, RCI animals had heavier livers than the CCI and group III animals (Fig. 5d). Liver weight adjusted to body weight was increased in RCC animals, and dietary intervention significantly reduced the relative weight in RCI animals (Fig. 5e). CCC livers had higher fat content than group III, but no differences were found compared with RCC animals. Dietary intervention reduced liver fat in the CCI group compared with the CCC group and in the RCI compared with RCC and III (Fig. 5f).
Blood chemistry at PND 250
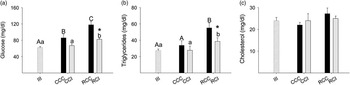
Fasting blood glucose was higher in the RCC group compared with the CCC group, and both groups had greater values compared with group III animals. Intervention with I diet diminished fasting glucose levels in the RCI compared with RCC animals (Fig. 6a), and RCI animals had higher values than group III animals. Triglyceride levels in the RCC group were higher compared with CCC and group III animals, and the RCI group had higher values than groups CCI and III. Dietary intervention reduced serum triglyceride concentrations in the RCI compared with the RCC group (Fig. 6b). No changes were found in total blood cholesterol among groups (Fig. 6c).
Female offspring serum parameters at postnatal day 250; glucose (a), triglycerides (b), cholesterol (c) (mean±s.e.m.). Females from n=6 litters per group. Capital letters show differences between casein fed groups with no dietary intervention and III. Small letters refer to differences after dietary intervention and III. *Refers to differences between the casein fed groups with and without dietary intervention. Data not sharing a capital or a small letter are statistically different, P<0.05.

Discussion
Extensive studies exist about the adverse effects of sub-optimal maternal nutrition on their offspring; however, only few studies explore the effects of later life offspring interventions on unfavorable programming.Reference Vickers, Gluckman and Coveny 8 , Reference Vickers and Sloboda 12 In this study, we show that a dietary intervention in the female offspring during adulthood has beneficial effects in overcoming body composition as well as some of the metabolic/biochemical changes resulting from maternal protein restriction during pregnancy.
Nutrition plays a fundamental role in determining the development of individuals. It is well-known that maternal malnutrition during pregnancy is associated with low birth weight;Reference Zambrano, Bautista and Deas 6 , Reference Zambrano, Martinez-Samayoa and Bautista 11 , Reference Guzman, Cabrera and Cardenas 16 – Reference Bieswal, Ahn and Reusens 18 however, if the cause of growth deficiency is corrected, it can be followed-up by catch-up growth. This phenomenon has been previously observed by us and others.Reference Guzman, Cabrera and Cardenas 16 – Reference Zambrano, Rodriguez-Gonzalez and Guzman 19 In the present study, body weight at PND 2 was lower in RC pups compared with CC and group II pups. However, they rapidly catch-up, and by PND 25 their weights were similar. We also observed that as they aged, the catch-up becomes much more evident according to the type of protein that is consumed, as female offspring maintained on the casein control diet during adulthood (CCC and RCC) exhibited increased body weight at PND 110 and 250, as well as higher fat percentage at PND 250. Food and calorie intake in RCC animals tended to be lower compared with CCC animals, indicating higher metabolic efficiency with lower food intake.Reference Zambrano, Bautista and Deas 6 Offspring body composition can be affected by maternal protein restriction during pregnancyReference Bautista, Boeck, Larrea, Nathanielsz and Zambrano 20 , and body fat accumulation can be associated with metabolic diseases.Reference van Straten, Bloks and van Dijk 21 , Reference DePaoli 22 In the present study, the carcass of pups from the groups that were fed casein had lower protein content and more fat. We observed that after 40 days of dietary intervention, body composition can be enhanced as female offspring from the CCI and RCI groups showed an increased in the protein:fat ratio. In addition, female offspring from both the groups with dietary intervention exhibited lower food intake; interestingly, by PND 110, food consumption was even lower in female offspring that were switched to commercial chow diet when compared with group III animals, indicating changes in appetitive behavior and programming of hypothalamus by R in fetal life. However, by PND 250, RCI animals increased their intake compared with group III and CCI animals, but was still lower than that of RCC animals. The reduced food intake also could be the consequence of a different dietary palatability or the offspring’s preference, as the amount of carbohydrates and fat are different in the diets. It seems that the offspring liked the casein diet more than chow; therefore, female offspring reduced food intake until they were accustomed to the new diet. However, their consumption did not reach that of the casein-fed groups, indicating that the improvements in metabolic phenotype and body composition observed in the intervened groups can be related to the quantity or quality of food or a combination of both.
Another plausible explanation for the changes observed in food intake and body composition could be related with leptin regulation. Leptin is secreted by adipose tissue and acts in the hypothalamus by suppressing food intake and increasing the rate of metabolic activity.Reference Penicaud, Meillon and Brondel 23 , Reference Petervari, Rostas and Soos 24 Breast milk contains significant amounts of leptin and can be transferred to offspring through the milk.Reference McFadin, Morrison, Buff, Whitley and Keisler 25 – Reference Sanchez, Oliver and Miralles 27 Experimental animal studies showed that nutritional imbalance during lactation can affect the timing and magnitude of the neonatal leptin surge, leading to alterations in the hypothalamic development and impairment of energy balance.Reference Kirk, Samuelsson and Argenton 28 , Reference Teixeira, Passos, Ramos, Dutra and Moura 29 We have reported that maternal protein restriction delays the normal neonatal rise in leptin,Reference Bautista, Boeck, Larrea, Nathanielsz and Zambrano 20 and that during adult life high leptin levels were not seen in RC females.Reference Zambrano, Bautista and Deas 6 In this study, we observed that leptin levels in CCC and RCC offspring were higher at PND 110 and much higher at PND 250 and these results can be correlated with more body fat in the same groups at older age; 40 days of dietary intervention did not decrease serum leptin levels in CCI and RCI animals. In contrast, by PND 250, serum leptin levels and carcass fat decreased in CCI and RCI animals, which were similar to group III.
Liver plays a key role in lipid metabolism. However, lipid accumulation in the hepatocytes results in hepatic steatosis.Reference Nguyen, Leray and Diez 30 In rats, maternal protein restriction during pregnancy alters fetal liver growth, development and lipid content.Reference Torres, Bautista and Tovar 9 In the present study, at PND 25, absolute or relative liver weight was unchanged, but by PND 250 livers were heavier in the CCC and RCC groups compared with group III; interestingly, absolute liver weight and fat content were increased in CCC than in group III. The RCC group had significantly increased relative liver mass, but this was not due to higher fat content. Dietary intervention during adulthood not only improved body weight in both intervention groups but also reduced absolute and relative liver weights, as well as hepatic fat content, thus diminishing the risk of hepatic steatosis.
Maternal protein restriction has been associated with the development of metabolic disease (glucose intolerance and insulin resistance) and increased risk for cardiovascular diseases in the adult offspring.Reference Zambrano, Bautista and Deas 6 , Reference Liu, Qi and Gao 7 , Reference Petry, Dorling, Pawlak, Ozanne and Hales 31 In accordance, our data at PND 250 showed increased fasting glucose in RCC and CCC groups compared with group III, and triglycerides were higher only in RCC animals compared with group III animals. In both cases, dietary intervention improved these parameters, supporting the hypothesis that interventional strategies are able to overcome adverse effects of developmental programming. Offspring from the RC group were born ready for a hostile environment, because during lactation RC pups were exposed to a differential nutritional environment. Despite the fact that RC and CC mothers received the same diet during lactation,Reference Bautista, Boeck, Larrea, Nathanielsz and Zambrano 20 the fetal growth deficiency was followed-up by a catch-up growth, as we have reported here and in previous publicationsReference Zambrano, Bautista and Deas 6 , Reference Zambrano, Martinez-Samayoa and Bautista 11 regarding metabolic parameters to overcome the protein restriction they have been recently exposed. The relative resistance of the RC group to intervention might be due to the predictive adaptive responses in order to adjust their metabolic profile in anticipation of conditions expected in adulthood.
It is noteworthy to point out the differential outcomes between dietary intervention using a commercial chow and maintaining the offspring on casein diet. A possible explanation of our results is that they are due to the protein in the diets, one being casein, obtained from animal milk, and the other a mixture of vegetable protein from corn and soybean. Casein-based purified diets have been widely used as a model of nutrition for rodents.Reference Reeves, Nielsen and Fahey 32 , Reference Reeves, Rossow and Lindlauf 33 The advantage of its use is the homogeneity between batches of the same diet, and that every ingredient can be modified providing an easily managed nutritional approach. In developmental programming models, casein diets have been extensively used as a standard to assure isocaloric protein restriction and to avoid global nutrient/energy restriction. In fact, the American Institute of Nutrition recommends these diets;Reference Reeves, Nielsen and Fahey 32 , Reference Reeves, Rossow and Lindlauf 33 however, in most animal care facilities, rodents are fed commercial chow diet, which contains vegetable protein and other nutrients that casein-based diets lack, such as phytoestrogens, which could exert an action on the developmental trajectory of the offspring. It has been reported that genistein supplementation in mice during gestation protects offspring from susceptibility to obesity.Reference Dolinoy, Weidman, Waterland and Jirtle 34 Other differences in the formulation of these diets include the type and quantity of simple carbohydrates and the energy provided per gram that is lower in casein diets. Monosaccharides are higher in casein-based diets and these compositional differences in carbohydrates could be in part responsible for the accumulation of body and liver fat.
In summary, our goal was to demonstrate the possibility of reversal of the metabolic adverse outcomes of dietary programming. This study suggests that the deleterious effects of developmental programming by maternal protein restriction can be ameliorated during adulthood after dietary intervention, and that some beneficial effects of dietary intervention are observable. It is important to point out that in agreement with the programming concept the benefits of dietary intervention in adult life in RCI group are discrete in comparison with the CCI group.
In conclusion, early life events in utero trigger responses that prepare the individuals to face the environment they will encounter throughout postnatal life by adapting their physiological development (re-establishing set points of metabolic and endocrine regulation) that may be beneficial for short-term survival. However, if the intrauterine and postnatal environment mismatch, this can lead to maladaptive phenotypes during adulthood, contributing to poor health outcomes when offspring are exposed to catch-up growth. Even if the benefits of changing diet were more evident in the control group in comparison with protein-restricted offspring, dietary intervention in adult life improves some specific outcomes due to maternal restriction. Our data suggest that in order to avoid the deleterious effects of programming, those born in disadvantageous conditions should adopt, as early as possible, healthy lifestyles that would maintain homeostatic parameters, preventing or reducing the complications observed to appear at older ages.
Acknowledgments
None.
Financial Support
The authors’ experimental work presented in this review was supported by a grant from CONACyT – 155166.
Conflicts of Interest
None.