Introduction
Attention deficit hyperactivity disorder (ADHD) is a childhood disorder characterized by developmentally inappropriate and impairing levels of inattentiveness, hyperactivity and impulsivity (APA, 2000), with a prevalence in school-aged children of around 5% (Polanczyk et al. Reference Polanczyk, de Lima, Horta, Biederman and Rohde2007; Polanczyk & Jensen, Reference Polanczyk and Jensen2008). Although current diagnostic criteria preclude a co-diagnosis (DSM-IV), epidemiological studies suggest that co-morbid ADHD symptomatology is demonstrated in 30% of children with autism spectrum disorder (ASD), a disorder characterized by abnormalities in social interaction, communication and restricted/repetitive behaviours (Simonoff et al. Reference Simonoff, Pickles, Charman, Chandler, Loucas and Baird2008). In addition, a substantial proportion of overlap between ADHD and ASD is attributable to shared genetic influences (Rommelse et al. Reference Rommelse, Franke, Geurts, Hartman and Buitelaar2009). It is under discussion whether this common co-occurrence reflects an additive co-morbidity, as supported in the upcoming DSM-5, rather than a separate condition with distinct impairments (Taurines et al. Reference Taurines, Schwenck, Westerwald, Sachse, Siniatchkin and Freitag2012). One approach to distinguish between the different co-morbidity models is to evaluate underlying pathophysiological mechanisms associated with ASD and ADHD in the co-morbid ASD + ADHD group.
One domain of shared impairment between ASD and ADHD is executive function (EF; Rommelse et al. Reference Rommelse, Geurts, Franke, Buitelaar and Hartman2011). Specifically, substantial overlap is evident for inhibition, verbal fluency and spatial working memory with subtle differences in severity between the disorders (Nyden et al. Reference Nyden, Gillberg, Hjelmquist and Heimann1999; Geurts et al. Reference Geurts, Verte, Oosterlaan, Roeyers and Sergeant2004; Ozonoff et al. Reference Ozonoff, Cook and Coon2004; Goldberg et al. Reference Goldberg, Mostowsky, Cutting, Mahone, Astor, Denckla and Landa2005; Verte et al. Reference Verte, Geurts, Roeyers, Oosterlaan and Sergeant2006; Corbett et al. Reference Corbett, Constantine, Hendren, Rocke and Ozonoff2009). Other studies, however, suggest the disorders can be dissociated on the basis of, for example, intact inhibitory control and more severe impairments in cognitive flexibility and planning in ASD (Ozonoff & Jensen, Reference Ozonoff and Jensen1999; Geurts et al. Reference Geurts, Verte, Oosterlaan, Roeyers and Sergeant2004; Happé et al. Reference Happé, Booth, Charlton and Hughes2006; Verte et al. Reference Verte, Geurts, Roeyers, Oosterlaan and Sergeant2006). There are few and inconsistent findings from EF studies that include individuals with co-morbid ASD + ADHD to delineate this phenotypic variability. Inhibitory deficits similar to ADHD have been reported for co-morbid ASD + ADHD whereas other studies demonstrate reduced cognitive flexibility compared to ASD (Sinzig et al. Reference Sinzig, Morsch, Bruning, Schmidt and Lehmkuhl2008; Bühler et al. Reference Bühler, Bachmann, Goyert, Heinzel-Gutenbrunner and Kamp-Becker2011). Conversely, relatively intact performance (number of errors) on a continuous performance test (CPT) has been shown in ASD + ADHD compared to ADHD (Nyden et al. Reference Nyden, Niklasson, Stahlberg, Anckarsater, Wentz, Rastam and Gillberg2010), which suggests that these impairments are not necessarily an additive effect of the pure disorders.
Evidence for an inhibitory deficit in ADHD is supported by event-related potential (ERP) studies that allow sensitive measurement of distinct temporal stages in overt and covert cognitive processing (McLoughlin et al. Reference McLoughlin, Kuntsi, Brandeis and Banaschewski2005). Several studies have demonstrated, using a cued-CPT, a reduced frontocentral NoGo-P3 component in response to non-target stimuli as an index of response inhibition (Banaschewski et al. Reference Banaschewski, Brandeis, Heinrich, Albrecht, Brunner and Rothenberger2004; Fallgatter et al. Reference Fallgatter, Ehlis, Seifert, Strik, Scheuerpflug, Zillessen, Herrmann and Warnke2004; Valko et al. Reference Valko, Doehnert, Müller, Schneider, Albrecht, Drechsler, Maechler, Steinhausen and Brandeis2009; Doehnert et al. Reference Doehnert, Brandeis, Imhof, Drechsler and Steinhausen2010). Importantly, however, this deficit is typically preceded by attenuated electrophysiological responses to cues, as indexed by the parietal Cue-P3 and the subsequent central contingent negative variation (CNV) (Van Leeuwen et al. Reference Van Leeuwen, Steinhausen, Overtoom, Pascual-Marqui, van't Klooster, Rothenberger, Sergeant and Brandeis1998; Brandeis et al. Reference Brandeis, Banaschewski, Baving, Georgiewa, Blanz, Schmidt, Warnke, Steinhausen, Rothenberger and Scheuerpflug2002; Banaschewski et al. Reference Banaschewski, Brandeis, Heinrich, Albrecht, Brunner and Rothenberger2003, Reference Banaschewski, Brandeis, Heinrich, Albrecht, Brunner and Rothenberger2004; Albrecht et al. Reference Albrecht, Banaschewski, Brandeis, Heinrich and Rothenberger2005; Valko et al. Reference Valko, Doehnert, Müller, Schneider, Albrecht, Drechsler, Maechler, Steinhausen and Brandeis2009; Doehnert et al. Reference Doehnert, Brandeis, Imhof, Drechsler and Steinhausen2010). Notably, the Cue-P3 and the CNV index covert processing because these deficits occur without concurrent responses or performance errors and predict subsequent performance (Van Leeuwen et al. Reference Van Leeuwen, Steinhausen, Overtoom, Pascual-Marqui, van't Klooster, Rothenberger, Sergeant and Brandeis1998; Banaschewski et al. Reference Banaschewski, Brandeis, Heinrich, Albrecht, Brunner and Rothenberger2003, Reference Banaschewski, Brandeis, Heinrich, Albrecht, Brunner and Rothenberger2004). In addition, N2 enhancement from Go to NoGo trials, an index of conflict monitoring (Yeung & Cohen, Reference Yeung and Cohen2006), is reduced in ADHD during the Stop Signal Task (Pliszka et al. Reference Pliszka, Liotti and Woldorff2000), although case–control differences are not reported in the CPT-OX (Overtoom et al. Reference Overtoom, Verbaten, Kemner, Kenemans, van Engeland, Buitelaar, Camfferman and Koelega1998; Banaschewski et al. Reference Banaschewski, Brandeis, Heinrich, Albrecht, Brunner and Rothenberger2004; Fallgatter et al. Reference Fallgatter, Ehlis, Seifert, Strik, Scheuerpflug, Zillessen, Herrmann and Warnke2004) unless ADHD has co-occurring oppositional defiant disorder (ODD; Overtoom et al. Reference Overtoom, Verbaten, Kemner, Kenemans, van Engeland, Buitelaar, Camfferman and Koelega1998). These impairments are seen in ADHD during childhood, adolescence (Spronk et al. Reference Spronk, Jonkman and Kemner2008; Valko et al. Reference Valko, Doehnert, Müller, Schneider, Albrecht, Drechsler, Maechler, Steinhausen and Brandeis2009; Doehnert et al. Reference Doehnert, Brandeis, Imhof, Drechsler and Steinhausen2010) and adulthood (McLoughlin et al. Reference McLoughlin, Albrecht, Banaschewski, Rothenberger, Brandeis, Asherson and Kuntsi2010). These parameters also share familial influences with ADHD in children (Albrecht et al. Reference Albrecht, Brandeis, Uebel, Valko, Heinrich, Drechsler, Heise, Mueller, Steinhausen and Rothenberger2012) and adults (McLoughlin et al. Reference McLoughlin, Asherson, Albrecht, Banaschewski, Rothenberger, Brandeis and Kuntsi2011), which, combined with limited evidence of shared environmental effects on ADHD (Faraone et al. Reference Faraone, Perlis, Doyle, Smoller, Goralnick, Holmgren and Sklar2005; Burt, Reference Burt2009; Wood et al. Reference Wood, Buitelaar, Rijsdijk, Asherson and Kuntsi2010; Burt et al. Reference Burt, Larsson, Lichtenstein and Klump2012), suggests that they are a marker of genetic risk in ADHD (Tye et al. Reference Tye, McLoughlin, Kuntsi and Asherson2011).
Despite consistent evidence for attention deficits in ASD (Sanders et al. Reference Sanders, Johnson, Garavan, Gill and Gallagher2008), there is limited neurophysiological research on these processes (Jeste & Nelson, Reference Jeste and Nelson2009). In visual oddball tasks and variants thereof, which involve response to rare targets among frequently occurring stimuli, longer latencies of the P3 and N2 and larger amplitudes of the P3 to target stimuli have been reported in ASD (Strandburg et al. Reference Strandburg, Marsh, Brown, Asarnow, Guthrie and Higa1993; Kemner et al. Reference Kemner, van der Gaag, Verbaten and van Engeland1999; Sokhadze et al. Reference Sokhadze, Baruth, Tasman, Sears, Mathai, El-Baz and Casanova2009; Tsai et al. Reference Tsai, Pan, Wang, Tseng and Hsieh2011). These findings may suggest inefficient categorization and processing of attentional stimuli. Nevertheless, the direction of effects is not consistent (Pritchard et al. Reference Pritchard, Raz and August1987; Courchesne et al. Reference Courchesne, Lincoln, Yeung-Courchesne, Elmasian and Grillon1989; Verbaten et al. Reference Verbaten, Roelofs, van Engeland, Kenemans and Slangen1991; Townsend et al. Reference Townsend, Westerfield, Leaver, Makeig, Jung, Pierce and Courchesne2001; Hoeksma et al. Reference Hoeksma, Kemner, Kenemans and van Engeland2006; Tsai et al. Reference Tsai, Pan, Wang, Tseng and Hsieh2011) and null findings are also reported (Pritchard et al. Reference Pritchard, Raz and August1987; Courchesne et al. Reference Courchesne, Lincoln, Yeung-Courchesne, Elmasian and Grillon1989; Hoeksma et al. Reference Hoeksma, Kemner, Kenemans and van Engeland2006; Tsai et al. Reference Tsai, Pan, Wang, Tseng and Hsieh2011). In addition, no ERP study has used a paradigm that measures attentional orienting and inhibitory control in ASD directly, and there has been no comparison of these attention processes at the neurophysiological level with co-morbid ASD + ADHD cases.
Very few previous cognitive-electrophysiological studies of ASD and ADHD include either a comparison group of the other disorder or a separate co-morbid group (although see, for example, Groen et al. Reference Groen, Wijers, Mulder, Waggeveld, Minderaa and Althaus2008; Clarke et al. Reference Clarke, Barry, Irving, McCarthy and Selikowitz2011), and many studies do not measure the possibility of co-occurring symptoms. This not only introduces ‘blurring’ of diagnostic groups but also limits any conclusions being made about the nature of deficits in the co-morbid group. In combination with the inconsistent findings on EF at the behavioural level, little is known about the mode of co-occurrence between ASD and ADHD at the neural level. The aim of this study was therefore to investigate whether ERP abnormalities associated with ADHD are also found in ASD and co-morbid ASD + ADHD, following in-depth diagnostic assessments that minimize misspecification in group allocation. Because of the lack of previous studies investigating these constructs, this analysis was exploratory and thus limited hypotheses were made: (1) children with ADHD would demonstrated reduced inhibitory processing; (2) children with ASD would show reduced conflict monitoring (because of its close association with shifting strategy); and (3) children with ASD + ADHD would show both of these deficits but would not necessarily present as an additive co-occurrence, based on the limited studies of all three conditions.
Method
Sample
Nineteen participants with ASD, 18 with ADHD, 29 with ASD + ADHD, and 26 typically developing controls (TD) took part in the study. Only males were included in the study to reduce sample heterogeneity and because of the higher ratio of males diagnosed with ASD compared to females (Polanczyk et al. Reference Polanczyk, de Lima, Horta, Biederman and Rohde2007; Elsabbagh et al. Reference Elsabbagh, Divan, Koh, Kim, Kauchali, Marcín, Montiel-Nava, Patel, Paula, Wang, Yasamy and Fombonne2012). The age range was 8–13 years, with a mean overall age of 10.77 years (s.d. = 1.80) and there was no significant difference in age between groups (Table 1). All participants were required to have an IQ > 70, normal or corrected-to-normal vision, and not to be taking any medication except for stimulants, which had to be interrupted 48 h prior to testing sessions. Within the sample, six participants with ADHD were taking medication (one Equasym, three Concerta, one Equasym plus Concerta, one unspecified) and six participants with ASD + ADHD were taking medication (five Concerta, one dexamphetamine). Exclusion criteria included non-fluent English, specific medical disorders, other co-morbid psychiatric disorders (not including ODD), history of traumatic brain injury and a diagnosis of epilepsy.
Clinical and demographic characteristics

TD, Typically developing controls; ASD, autism spectrum disorder; ADHD, attention deficit hyperactivity disorder; ASD + ADHD, co-morbid ASD and ADHD; IQ, intelligence quotient; SCQ, Social Communication Questionnaire; Conners, Conners 3rd Edition Parent Rating Scale Short Form; s.d., standard deviation; n.s.d., non-significant difference.
The participants were recruited from out-patient neurodevelopmental clinics and local parent support groups in South East London. All participants had a clinical diagnosis made according to ICD-10 criteria (autism, Asperger's syndrome, ADHD combined type) and then underwent systematic and rigorous clinical assessment to confirm pure or co-morbid research diagnosis (Fig. 1). All cases were initially evaluated with Conners 3rd Edition Parent Rating Scale short form (Conners, Reference Conners2008) and the Social Communication Questionnaire (SCQ; Berument et al. Reference Berument, Rutter, Lord, Pickles and Bailey1999; Rutter et al. Reference Rutter, Bailey and Lord2003). Cases of ASD were diagnosed using the Autism Diagnostic Interview − Revised (ADI-R; Lord et al. Reference Lord, Rutter and Couteur1994) using modified criteria (IMGSAC, 1998) and the Autism Diagnostic Observation Schedule – Generic (ADOS-G; Gotham et al. Reference Gotham, Risi, Pickles and Lord2007). Cases of ADHD were diagnosed using Parent Account of Childhood Symptoms (PACS; Taylor et al. Reference Taylor, Schachar, Thorley and Wieselberg1986), which has been used extensively by the International Multicenter ADHD Genetics Project (IMAGE) consortium (Chen et al. Reference Chen, Zhou, Sham, Franke, Kuntsi, Campbell, Fleischman, Knight, Andreou, Arnold, Altink, Boer, Boholst, Buschgens, Butler, Christiansen, Fliers, Howe-Forbes, Gabriels, Heise, Korn-Lubetzki, Marco, Medad, Minderaa, Muller, Mulligan, Psychogiou, Rommelse, Sethna, Uebel, McGuffin, Plomin, Banaschewski, Buitelaar, Ebstein, Eisenberg, Gill, Manor, Miranda, Mulas, Oades, Roeyers, Rothenberger, Sergeant, Sonuga-Barke, Steinhausen, Taylor, Thompson, Faraone and Asherson2008). Co-morbid ASD + ADHD cases met full diagnostic criteria for ASD and full diagnostic criteria for ADHD using the ADI-R/ADOS-G and PACS. Questionnaire measures confirmed that participants with ASD + ADHD and ADHD had a higher number of ADHD symptoms and also a lower full-scale IQ compared to both ASD and TD. Participants with ASD + ADHD followed by ASD had the highest number of autism symptoms, compared to ADHD and TD (see Table 1).
Flowchart showing assessment of clinical groups for research diagnostic group allocation. SCQ, Social Communication Questionnaire; Conners, Conners 3rd Edition Parent Rating Scale Short Form; ADI-R, Autism Diagnostic Interview – Revised; ADOS-G, Autism Diagnostic Observation Schedule – Generic; PACS, Parental Account of Childhood Symptoms; ASD, autism spectrum disorder; ADHD, attention deficit hyperactivity disorder; ASD + ADHD, co-morbid ASD and ADHD. a ADI-R cut-off: Impairment of Social Interaction = 10; Impairment of Communication = 8; Stereotyped Behaviour = 3; participants may fall one point below the threshold in one of the behavioural domains according to modified criteria. b ADOS-G cut-off: Social Affect and RRBI = 7.

The TD group consisted of children recruited through local schools and forums. Children were not included if they had any psychiatric diagnosis and were assessed with the Strengths and Difficulties Questionnaire (SDQ; Goodman, Reference Goodman1997), the SCQ and Conners. Ten TD participants scored above threshold on the Conners. Further assessment of eight of these children with the PACS interview confirmed that they did not reach a diagnosis of ADHD and thus were retained in the studyFootnote 1 Footnote †. In addition, participants who had a sibling with a diagnosis of ASD and/or ADHD were not included. The study protocol was approved by a medical ethics committee. Written parental consent was given before the experiment began.
Tasks and stimuli
The cued-CPT, flanker version (Doehnert et al. Reference Doehnert, Brandeis, Straub, Steinhausen and Drechsler2008; Valko et al. Reference Valko, Doehnert, Müller, Schneider, Albrecht, Drechsler, Maechler, Steinhausen and Brandeis2009; McLoughlin et al. Reference McLoughlin, Albrecht, Banaschewski, Rothenberger, Brandeis, Asherson and Kuntsi2010, Reference McLoughlin, Asherson, Albrecht, Banaschewski, Rothenberger, Brandeis and Kuntsi2011), consists of a black letter array formed of a centre letter flanked on each side by distractor letters, presented in four identical blocks of 100 letter arrays each. Participants were instructed to ignore the distractor letters and attend only to the centre letter. There were 11 different centre letters (O, X, H, B, C, D, E, F, G, J and L) subtending approximately 0.5°. Target centre letters ‘X’ and ‘O’ were flanked by the incompatible letter ‘O’ or ‘X’ and distractor letters were flanked by either ‘X’ or ‘O’. The letter arrays were presented briefly (150 ms) every 1.65 s in a pseudo-random sequence at the centre of a computer monitor at a viewing distance of 120 cm. The 80 cues (XOX) initiated 40 cue-target (XOX-OXO) and 40 cue-non-target sequences (XOX-XDX). In 40 cases, a distractor-X letter array (OXO) was not preceded by the cue and had to be ignored, along with any other irrelevant letters. Participants were instructed to respond only to cue-target sequences (XOX-OXO) by pressing a button as quickly as possible with the index finger of their preferred hand (Table 1). The task was practised (24 trials including three cue-target and two cue-non-target sequences) and comprehension ascertained based on correct performance prior to task onset. The duration of the task was 11 min. Participants were seated on a height-adjustable chair in a video-monitored testing cubicle. The flankered CPT-OX was administered after 6 min of resting electroencephalography (EEG) data recording as part of a larger test battery (not presented here) with a total duration of 70 min. Presentation of the tasks was ordered in the same way for each group to control for effects of practice and fatigue. IQ was assessed using four subtests (Block Design, Vocabulary, Matrix Reasoning and Similarities) of the Wechsler Abbreviated Scale of Intelligence (WASI; Wechsler, Reference Wechsler1999) and took 45 min to complete.
Cognitive performance
Performance measures in the flankered CPT-OX task included mean reaction time to target stimuli (MRT; mean latency of responding in ms after target onset), within-subject variability in RTs (SD-RT, in ms), and the coefficient of reaction time variability (CV = SD-RT/MRT), calculated across correctly answered target-OXOs that were detected between 200 and 1500 ms post-stimulus. Errors were broken down into subcategories (omission errors, total commission errors and O-not-X commission errors).
Electrophysiological recording and analysis
Electroencephalograms were recorded using a 62 active electrode recording system (ActiCap, Brain Products, Germany; extended 10–20 montage). The recording reference electrode was positioned at FCz. Vertical and horizontal electro-oculograms (EOGs) were recorded simultaneously from electrodes above and below the left eye and at the outer canthi. The signal was digitized at a 500-Hz sampling rate, stored and analysed offline.
Data were analysed in Brain Vision Analyzer version 2.0 (Brain Products). The signal was re-referenced offline to the average reference and down-sampled to 256 Hz. We applied 0.1–30 Hz (24 dB/Oct) Butterworth filters. Ocular artefacts were removed from the data using biased infomax independent component analysis (Jung et al. Reference Jung, Makeig, Humphries, Lee, McKeown, Iragui and Sejnowski2000). The extracted independent components were inspected manually and ocular artefacts were removed by backprojection of all but those components. Remaining artefacts exceeding 200 μV peak-to-peak in any channel were rejected from the data. Baseline correction was performed using a 200-ms prestimulus reference period. Stimulus-locked epochs (peristimulus window from −200 to 1650 ms) were averaged for the following trial types: cue (trials to letter XOX); go (trials to OXOs preceded by XOX); and no-go (trials to random target letters, for example ODO following XOX). Averages contained at least 19 segments (see online Supplementary Table S1), only included trials with correct responses (Go) or correctly rejected trials (NoGo, Cue) and were free from residual artefacts.
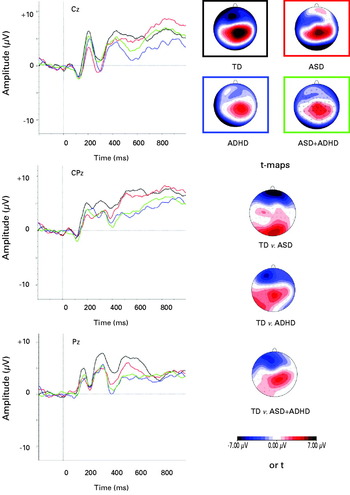
ERP amplitudes were restricted to leads for which effects were expected to be largest, based on previous studies (Banaschewski et al. Reference Banaschewski, Brandeis, Heinrich, Albrecht, Brunner and Rothenberger2003, Reference Banaschewski, Brandeis, Heinrich, Albrecht, Brunner and Rothenberger2004; Jonkman, Reference Jonkman2006; Valko et al. Reference Valko, Doehnert, Müller, Schneider, Albrecht, Drechsler, Maechler, Steinhausen and Brandeis2009). The P3 was calculated as the mean amplitude in a 400–700-ms latency window because the activity within this time window occurred over a long period making it difficult to identify one peak, as has been done in previous similar studies (Groom et al. Reference Groom, Cahill, Bates, Jackson, Calton, Liddle and Hollis2010). The Cue-P3 and Go-P3 were measured at Pz, and the NoGo-P3 was measured at Cz, Cpz and Pz because of increased anteriorization with increasing age (Jonkman, Reference Jonkman2006; Valko et al. Reference Valko, Doehnert, Müller, Schneider, Albrecht, Drechsler, Maechler, Steinhausen and Brandeis2009). This is supported by our topographical maps (Fig. 3). The N2 was scored as the maximal negative peak at Fz between 170 and 400 ms. The CNV was calculated as the mean area at Cz between 1300 and 1650 ms. Because of potential effects of the CNV on the baseline of subsequent ERPs (target and non-target stimuli), the ERP data were analysed with an additional longer baseline of –350 ms, which did not change the results (data available upon request).
Statistical analysis
Six children were excluded from performance and ERP analysis on the basis of extreme omission errors (>70%, upper 5% of sample) indicating a lack of attention to task and/or poor understanding of task instructions that limited the number of segments for reliable ERP analysis (ADHD n = 2; ASD + ADHD n = 4). One TD participant was removed from analysis because of technical difficulties during recording and two additional ASD + ADHD participants were removed from the Go condition because of insufficient segments. Outliers were removed (±3.5 s.d.; n = 1 ASD from CNV analysis). Clinical and demographic characteristics excluding these participants remained the same, although the difference in full-scale IQ between ADHD (103) and ASD (117) became significant (p = 0.03). Excluded participants were significantly younger (9.08 years) than included participants (10.92 years, p = 0.01) and had higher inattention symptom scores (t score = 83 v. 71, p = 0.03).
Errors and SD-RT were non-normally distributed, indicated by the sktest command in Stata (Stata Corporation, USA), and were therefore square-root transformed, indicated by the ladder command in Stata. The NoGo-P3 at the three scalp locations was entered into a MANOVA with Tamhane correction, which caters for unequal variance. The N2 was entered into a repeated-measures ANOVA with condition (Go v. NoGo) as the within-subjects factor. For other performance and ERP measures (Cue-P3, Go-P3, CNV), the groups were compared for differences using separate univariate ANOVAs. Sidak correction was used to correct for multiple testing, unless otherwise stated. To evaluate the utility of this method to dissociate clinical groups and elucidate the basis of co-morbidity, the between-subjects factor was defined in two ways: (1) a comparison of four groups of ASD-only, ADHD-only, ASD + ADHD and TD to assess differences between pure and co-morbid groups; and (2) 2 × 2 comparisons with ADHD (ADHD/ ASD + ADHD) and ASD (ASD/ ASD + ADHD) to examine the interaction between the disorders. A non-significant interaction between the disorders is compatible with an additive model.
Correlations between IQ and age and each of the dependent variables were calculated across the whole sample (and verified within each diagnostic group) because of differences in IQ between groups and developmental effects on these parameters. When these correlations were significant, ANCOVAs were conducted, or for correlations, age-corrected residuals were calculated to analyse whether group differences were influenced by IQ and/or age. Where significant group differences were found, correlations were calculated between ERP parameters and cognitive performance. A difference score calculated for the N2 ERP amplitude between Go and NoGo conditions and a calculated average across the three electrode locations for the NoGo-P3 ERP amplitude were entered into the correlation analysis. Main effects and interactions at a significance level of p < 0.05 (two-tailed) and trends (p < 0.1) were followed up with further analysis.
Results
CPT performance
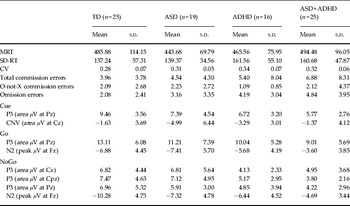
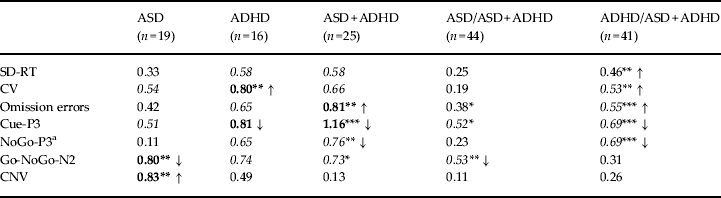
The CPT performance data are summarized by group in Tables 2 and 3. IQ had no significant effects on performance measures (all p > 0.5). Age was a significant covariate for MRT, SD-RT and omission errors and was therefore retained in these analyses. There was a significant effect of group on the number of omission errors (F 3,80 = 2.89, p = 0.04). Post-hoc analyses revealed a significantly higher number of errors made by ASD + ADHD participants (p = 0.04, d = 0.81). Significant main effects of group were found on CV (F 3,81 = 3.26, p = 0.03) and post-hoc analyses revealed that the ADHD-only group had more variable RTs than the TD group (p = 0.03, d = 0.80). No significant effects were found for MRT, SD-RT, commission errors or O-not-X commission errors (all p > 0.1).
Descriptive data for behavioural measures and ERP amplitudes

ERP, Event-related potential; TD, typically developing controls; ASD, autism spectrum disorder; ADHD, attention deficit hyperactivity disorder; ASD + ADHD, co-morbid ASD and ADHD; MRT, mean reaction time; SD-RT, within-subject variability in RTs in ms; CV, coefficient of variation (SD-RT/MRT); s.d., standard deviation.
Summary of main behavioural and ERP findings for TD versus each clinical group (Cohen's d, direction of effect shown for significant and/or large effect sizes)

ERP, Event-related potential; TD, typically developing controls; ASD, autism spectrum disorder; ADHD, attention deficit hyperactivity disorder; ASD + ADHD, co-morbid ASD and ADHD; SD-RT, within-subject variability in reaction times (RTs) in ms; CV, coefficient of variation [SD-RT/(mean RT)]; CNV, contingent negative variation.
Medium effect sizes in italics (d = 0.5), large effect sizes in bold (d = 0.8).
a Calculated average for three scalp locations Cz, CPz and Pz.
* p < 0.10, ** p < 0.05, *** p < 0.01.
Combining participants with ADHD diagnosis (ADHD-only and ASD + ADHD) revealed increased variability, as indexed by SD-RT (F 1,80 = 4.31, p = 0.04, d = 0.59) and CV (F 1,81 = 6.06, p = 0.02, d = 0.53), and more omission errors (F 1,80 = 6.54, p = 0.01, d = 0.55), compared to participants with no ADHD symptoms (ASD-only and TD). Comparisons of participants with ASD diagnosis (ASD-only and ASD + ADHD) and without ASD diagnosis (ADHD-only and TD) were not significantly different on any performance measures (all p > 0.05). The interaction between ADHD and ASD was non-significant for SD-RT (F 1,80 = 0.55, p = 0.46) and omission errors (F 1,80 = 0.38, p = 0.54), suggesting additive effects. There was, however, a trend towards an interaction for CV (F 1,81 = 3.34, p = 0.07).
ERP parameters
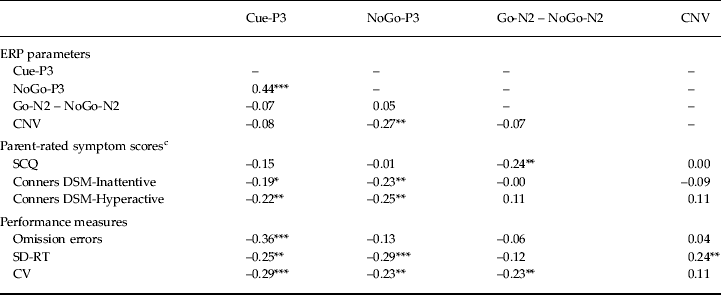
The ERP data are summarized by group in Tables 2 and 3. Age and IQ were not significant as covariates for any of the ERP measures (all p > 0.5). Noted correlations between ERP parameters and behavioural measures across the whole sample are shown in Table 4.
Correlations between ERP parameters, symptom scores and performance measures across the whole sample a , b

ERP, Event-related potential; CNV, contingent negative variation; SCQ, Social Communication Questionnaire; Conners, Conners 3rd Edition Parent Rating Scale Short Form; SD-RT, within-subject variability in reaction times (RTs) in ms; CV, coefficient of variation [SD-RT/(mean RT)].
a Spearman's correlations performed only on ERP parameters showing significant group differences.
b See Supplementary online Table S2 for correlations by group.
c Partial correlations between rating scale measures and ERP parameters were conducted to control for the effect of measures that are correlated with both autism spectrum disorder (ASD) and attention deficit hyperactivity disorder (ADHD), due to correlations between scores on the SCQ and the Conners (SCQ–Conners Inattention: r = 0.41, p < 0.001; SCQ–Conners Hyperactivity-Impulsivity: r = 0.46, p < 0.001).
* p < 0.10, ** p < 0.05, *** p < 0.01.
Cue-P3
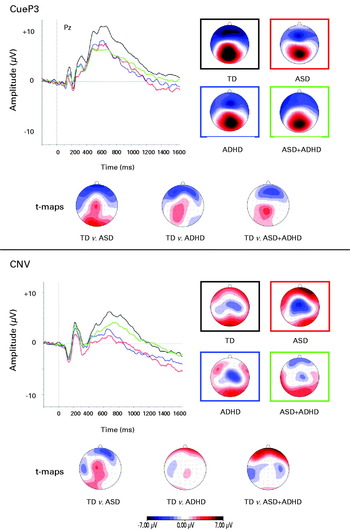
ERP grand averages and maps of all four groups are illustrated in Fig. 2. A significant main effect of group on amplitude of the Cue-P3 emerged (F 3,81 = 4.79, p = 0.004). Post-hoc analyses indicated attenuated Cue-P3 in ASD + ADHD (p = 0.002, d = 1.16) compared to the TD group. Participants with ADHD diagnosis (ADHD/ ASD + ADHD) (F 1,81 = 7.81, p = 0.01, d = 0.68) were driving the attenuation of the Cue-P3, with a trend for participants with ASD diagnosis (ASD/ ASD + ADHD) (F 1,81 = 3.71, p = 0.06, d = 0.52). The interaction between ADHD and ASD was non-significant, suggesting additive effects (F 1,81 = 0.52, p = 0.48). Across the whole sample, the Cue-P3 amplitude was associated with ADHD symptoms (Inattention: r = − 0.19, p = 0.07; Hyperactivity-Impulsivity: r = − 0.23, p = 0.03) and not ASD symptoms (r = − 0.15, p = 0.18). Attenuated Cue-P3 was correlated with poor task performance (SD-RT: r = − 0.25, p = 0.02; CV: r = − 0.29, p = 0.01; omission errors: r = − 0.36, p = 0.001) and attenuated NoGo-P3 (r = 0.50, p < 0.001).
Grand mean event-related potentials (ERPs) to Cue stimuli for each group and isocontour maps derived for the grand average in the 400–700-ms window for Cue-P3 and the 1300–1650-ms window for contingent negative variation (CNV) for each group, plus t maps for the group comparison. TD, Typically developing controls; ASD, autism spectrum disorder; ADHD, attention deficit hyperactivity disorder; ASD + ADHD, co-morbid ASD and ADHD. Black represents TD, red represents ASD-only; blue represents ADHD-only; green represents ASD + ADHD.

Go-P3
There was no main effect of group on the amplitude of the Go-P3 (F 3,79 = 1.91, p = 0.13). When combined by the presence of ADHD diagnosis, there was a trend towards attenuated Go-P3 amplitude (F 1,79 = 3.68, p = 0.06, d = 0.47), which was not shown when combined by ASD diagnosis (F 1,79 = 1.14, p = 0.29, d = 0.31). There was no significant interaction between ASD and ADHD (F 1,79 = 0.10 p = 0.75).
NoGo-P3
ERP grand averages and maps of all four groups are illustrated in Fig. 3. A significant multivariate effect on group emerged for the NoGo-P3 (F 9,237 = 2.19, p = 0.02; Pillai's trace = 0.23). Univariate testing indicated a significant effect of group at CPz using a Bonferroni-adjusted α level of 0.017 (F 3,79 = 4.68, p = 0.01). Post-hoc analyses revealed that the ASD + ADHD group displayed significantly attenuated NoGo-P3 at CPz compared to TD (p = 0.01, d = 1.04), with a trend compared to ASD-only participants (p = 0.08, d = 0.86). When combined by ADHD diagnosis (ADHD/ ASD + ADHD), a multivariate effect of group emerged (F 3,77 = 4.35, p = 0.02, d = 0.69; Pillai's trace = 0.14), indicating significantly attenuated NoGo-P3 in ADHD/ ASD + ADHD. Univariate analyses revealed reduced amplitude at each scalp location, reaching Bonferroni-corrected significance at CPz (F 1,79 = 12.82, p = 0.001, d = 0.79) and uncorrected significance at Cz (F 1,79 = 5.15, p = 0.02, d = 0.053) and Pz (F 1,79 = 5.88, p = 0.03, d = 0.52) compared to participants without ADHD (TD/ASD). There was no effect of the presence of ASD diagnosis (ASD/ ASD + ADHD; all p > 0.05), supported by correlations with symptom scores (Inattention: r = –0.23, p = 0.03; Hyperactivity-Impulsivity: r = –0.25, p = 0.02; SCQ: r = –0.01, p = 0.93). There was no significant interaction between ASD and ADHD, suggesting additive effects (F 3,77 = 1.08, p = 0.36). The amplitude of the NoGo-P3 was associated with response variability (SD-RT: r = –0.29, p = 0.01; CV: r = –0.23, p = 0.03).
Grand mean event-related potentials (ERPs) to NoGo stimuli for each group and isocontour maps derived for the grand average in the 400–700-ms window for NoGo-P3 for each group, plus t maps for the group comparison. TD, Typically developing controls; ASD, autism spectrum disorder; ADHD, attention deficit hyperactivity disorder; ASD + ADHD, co-morbid ASD and ADHD. Black represents TD, red represents ASD-only; blue represents ADHD-only; green represents ASD + ADHD.

N2
A main effect of condition emerged showing enhanced amplitude in the NoGo condition (F 1,79 = 7.66, p = 0.01). A main effect of group on N2 amplitude across both conditions emerged (F 3,79 = 5.83, p = 0.001), with post-hoc analyses revealing that the N2 was significantly attenuated in the ASD + ADHD group compared to the TD group (p = 0.001, d = 1.12) and the ASD-only group (p = 0.04, d = 0.90). When grouped according to symptoms, both ADHD diagnosis (ADHD/ ASD + ADHD; F 1,79 = 11.25, p = 0.001, d = 0.73) and a trend for ASD diagnosis (ASD/ ASD + ADHD; F 1,79 = 3.55, p = 0.06, d = 0.46) were associated with reduced N2 amplitude.
A significant interaction between group and condition emerged (F 3,79 = 3.69, p = 0.02). Post-hoc analyses revealed that, compared to TD, participants with ASD-only demonstrated significantly reduced N2 amplitude enhancement in the NoGo condition (p = 0.02, d = 0.80), with a trend emerging for ASD + ADHD participants (p = 0.08, d = 0.73). An ASD diagnosis (ASD/ ASD + ADHD) seemed to account for this deficit (F 1,79 = 4.51, p = 0.04, d = 0.53) and there was no effect of ADHD diagnosis (ADHD/ASD + ADHD; F 1,79 = 1.27, p = 0.26, d = 0.30), supported by correlations with symptom scores (Inattention: r = –0.00, p = 0.99; Hyperactivity: r = 0.11, p = 0.34; SCQ: r = 0.24, p = 0.03). There was a trend towards an interaction between ASD and ADHD and condition (F 1,79 = 3.89, p = 0.05). N2 amplitude enhancement was associated with response variability on the task (CV: r = –0.23, p = 0.04).
CNV
ERP grand averages and maps of all four groups are illustrated in Fig. 2. Analyses indicated a significant main effect of group on amplitude of the CNV (F 3,80 = 4.10, p = 0.01). Post-hoc analyses revealed that participants with ASD-only had a significantly greater amplitude compared to the TD group (p = 0.04, d = 0.083) and the ASD + ADHD group (p = 0.01, d = 0.90). When combining the groups by the presence of ASD (ASD/ ASD + ADHD) or ADHD (ADHD/ASD + ADHD), there were no significant group differences (p > 0.1), suggesting that an enhanced CNV is specific to ASD-only. The interaction term between ASD and ADHD was significant, suggesting non-additive effects (F 1,80 = 10.11, p = 0.002). To examine the potential contribution of developmental effects to this finding, we ran the analyses excluding the youngest third of participants (age < 9.82), revealing a trend-level effect of group on CNV amplitude (F 3,54 = 2.37, p = 0.08), with no significant post-hoc differences between groups. Enhanced amplitude of the CNV was associated with enhanced NoGo-P3 amplitude (r = –0.27, p = 0.01) and reduced response variability on the task (SD-RT: r = 0.24, p = 0.03).
Discussion
This novel study investigated (1) differences in the neurophysiological correlates of attention and inhibition in strictly defined cases of ASD and ADHD and (2) whether these markers were shared or distinct in co-morbid ASD + ADHD, using an ERP paradigm that has been used in previous studies of ADHD. Findings from group differences for diagnostic status and correlations between quantitative trait measures converge to suggest unique deficits across the two disorders. For the majority of findings, children with co-morbid ASD + ADHD display deficits of both disorders suggestive of an additive co-occurrence, rather than a separate condition with a distinct pattern of deficits.
The attenuation of the NoGo-P3 in both ADHD groups supports previous studies that indicate abnormal inhibitory processing in children with ADHD (Banaschewski et al. Reference Banaschewski, Brandeis, Heinrich, Albrecht, Brunner and Rothenberger2004; Fallgatter et al. Reference Fallgatter, Ehlis, Seifert, Strik, Scheuerpflug, Zillessen, Herrmann and Warnke2004; Valko et al. Reference Valko, Doehnert, Müller, Schneider, Albrecht, Drechsler, Maechler, Steinhausen and Brandeis2009; Doehnert et al. Reference Doehnert, Brandeis, Imhof, Drechsler and Steinhausen2010). Notably, these deficits were demonstrated in ADHD and not in ASD, which is in line with previous cognitive research (Happé et al. Reference Happé, Booth, Charlton and Hughes2006; Bühler et al. Reference Bühler, Bachmann, Goyert, Heinzel-Gutenbrunner and Kamp-Becker2011). In addition, both ADHD groups displayed reduced amplitude of the Cue-P3, in agreement with previous studies (Van Leeuwen et al. Reference Van Leeuwen, Steinhausen, Overtoom, Pascual-Marqui, van't Klooster, Rothenberger, Sergeant and Brandeis1998; Banaschewski et al. Reference Banaschewski, Brandeis, Heinrich, Albrecht, Brunner and Rothenberger2003, Reference Banaschewski, Brandeis, Heinrich, Albrecht, Brunner and Rothenberger2004; Doehnert et al. Reference Doehnert, Brandeis, Imhof, Drechsler and Steinhausen2010). The non-significant effect for ASD-only and ASD-related symptoms implies that attentional orienting impairments may be specific to ADHD, which may suggest that reported deficits in attentional orienting in ASD are due to undetected ADHD symptoms (Sanders et al. Reference Sanders, Johnson, Garavan, Gill and Gallagher2008; Tsai et al. Reference Tsai, Pan, Wang, Tseng and Hsieh2011). The trend for reduced Cue-P3 in the ASD groups suggests, however, that attentional orienting might be impaired in ASD in a larger sample. Given that the Cue-P3 also correlated with poor task performance associated with ADHD, this finding may indicate less effective recruitment of cognitive resources to process subsequent stimuli, and suggests that behavioural impairments are temporally or causally preceded by neuronal deficits in covert processes (Spronk et al. Reference Spronk, Jonkman and Kemner2008).
Attenuated N2 amplitude across both conditions was found in children with ASD + ADHD, suggesting that this group displays the most severe abnormalities. Reduced or absent N2 amplitude enhancement from Go to NoGo trials was only found in the ASD groups. This complements previous work in ASD reporting problems in shifting from one response to another (Hill, Reference Hill2004; Sanders et al. Reference Sanders, Johnson, Garavan, Gill and Gallagher2008). The intact N2 amplitude enhancement in ADHD is in line with previous studies using the CPT-OX that did not find case–control differences (Overtoom et al. Reference Overtoom, Verbaten, Kemner, Kenemans, van Engeland, Buitelaar, Camfferman and Koelega1998; Banaschewski et al. Reference Banaschewski, Brandeis, Heinrich, Albrecht, Brunner and Rothenberger2004; Fallgatter et al. Reference Fallgatter, Ehlis, Seifert, Strik, Scheuerpflug, Zillessen, Herrmann and Warnke2004). Differences have been found in other more demanding tasks, such as the Stop task (Albrecht et al. Reference Albrecht, Banaschewski, Brandeis, Heinrich and Rothenberger2005) and the Eriksen flanker task (Albrecht et al. Reference Albrecht, Brandeis, Uebel, Heinrich, Mueller, Hasselhorn, Steinhausen, Rothenberger and Banaschewski2008; McLoughlin et al. Reference McLoughlin, Albrecht, Banaschewski, Rothenberger, Brandeis, Asherson and Kuntsi2009), which may suggest that reduced N2 in ADHD is task dependent. These findings suggest that impaired conflict monitoring is related to ASD symptoms, and as children with ASD-only seem to present with the greatest deficits, investigation of a continuum of ASD severity increasing with impairment is warranted in this domain.
Children with ASD-only had enhanced CNV amplitude compared to TD and ASD + ADHD children. This may indicate that children with ASD + ADHD have impaired preparatory processes compared to ASD-only children, and further that ASD-only children allocate more cognitive resources to prepare for the upcoming stimulus compared to ASD + ADHD and TD children. This is supported by associations between the CNV and the NoGo-P3, suggestive of a compensatory strategy or alternative mechanism to strengthen typical inhibitory control that is present in the ASD-only group (O'Hearn et al. Reference O'Hearn, Asato, Ordaz and Luna2008). This finding also indicates syndrome-specific abnormalities in pure and complex cases of ASD. The lack of significant abnormality in ADHD-only participants is inconsistent with previous work (Banaschewski et al. Reference Banaschewski, Brandeis, Heinrich, Albrecht, Brunner and Rothenberger2004; Valko et al. Reference Valko, Doehnert, Müller, Schneider, Albrecht, Drechsler, Maechler, Steinhausen and Brandeis2009), although not all have reported differences (Van Leeuwen et al. Reference Van Leeuwen, Steinhausen, Overtoom, Pascual-Marqui, van't Klooster, Rothenberger, Sergeant and Brandeis1998). This may be due to developmental changes in the CNV (Klein & Feige, Reference Klein and Feige2005); studies of ADHD show an enhanced late CNV in occipital regions at 5–7 years of age (Spronk et al. Reference Spronk, Jonkman and Kemner2008), with a trend reported at 6–12 years (Hennighausen et al. Reference Hennighausen, Schulte-Korne, Warnke and Remschmidt2000). The non-significant finding may therefore be due to varying stages of development in the sample, as supported by additional analyses revealing limited group effects when excluding younger participants.
In support of previous research using the same task, there was limited evidence of impaired response execution processes as indexed by the Go-P3 (Van Leeuwen et al. Reference Van Leeuwen, Steinhausen, Overtoom, Pascual-Marqui, van't Klooster, Rothenberger, Sergeant and Brandeis1998; Banaschewski et al. Reference Banaschewski, Brandeis, Heinrich, Albrecht, Brunner and Rothenberger2004). As these impairments in target detection are more apparent in slow conditions (Wiersema et al. Reference Wiersema, van der Meere, Roeyers, Van Coster and Baeyens2006), this might suggest that these deficits in ADHD are related to suboptimal arousal, and further that they can be reduced by valid cues as used in the present task (McLoughlin et al. Reference McLoughlin, Albrecht, Banaschewski, Rothenberger, Brandeis, Asherson and Kuntsi2010), which may also explain the typical Go-P3 amplitude in ASD contrary to some previous work (Townsend et al. Reference Townsend, Westerfield, Leaver, Makeig, Jung, Pierce and Courchesne2001).
Task performance was impaired in both ADHD groups, shown by increased response variability and reduced accuracy, supporting previous findings (Willcutt et al. Reference Willcutt, Doyle, Nigg, Faraone and Pennington2005; Klein et al. Reference Klein, Wendling, Huettner, Ruder and Peper2006; Kuntsi et al. Reference Kuntsi, Wood, Rijsdijk, Johnson, Andreou, Albrecht, Arias-Vasquez, Buitelaar, McLoughlin, Rommelse, Sergeant, Sonuga-Barke, Uebel, van der Meere, Banaschewski, Gill, Manor, Miranda, Mulas, Oades, Roeyers, Rothenberger, Steinhausen, Faraone and Asherson2010) and suggesting that increased variability is not shown in ASD (Johnson et al. Reference Johnson, Robertson, Kelly, Silk, Barry, Daibhis, Watchorn, Keavey, Fitzgerald, Gallagher, Gill and Bellgrove2007). The lack of further group differences in performance is likely to be due to the use of the flanker version of the CPT-OX, which was not designed specifically to optimally measure task performance. The larger effect sizes for neurophysiological markers in comparison to task performance highlight the greater sensitivity of ERP measures to detect differences in inhibitory measures between diagnostic groups.
Taken together, the findings indicate neurophysiological abnormalities in response preparation and conflict monitoring in ASD, which is in line with theoretical accounts that propose that children with ASD have behavioural difficulties in the ability to flexibly shift to different cognitive demands (Hill, Reference Hill2004) and disengage attention (‘sticky attention’; see, for example, Holmboe et al. Reference Holmboe, Elsabbagh, Volein, Tucker, Baron-Cohen, Bolton, Charman and Johnson2010). Children with ADHD display neurophysiological abnormalities in attentional orienting, inhibitory processing and behavioural deficits in task performance, suggestive of specific deficits compared to ASD, along with widespread attentional dyscontrol. According to cognitive energetic models, suboptimal arousal may be the basis of these varied deficits because of problems in cognitive resource allocation to activation and arousal systems (Sergeant, Reference Sergeant2000). The findings provide insight into the pathophysiological basis of the co-morbidity between ADHD and ASD and are generally compatible with an additive co-occurrence demonstrating deficits of both disorders, supporting findings from twin studies (Ronald et al. Reference Ronald, Simonoff, Kuntsi, Asherson and Plomin2008). This is of particular interest because the association between ASD and ADHD traits is proposed to be the result of genetic overlap with attention problems (Polderman et al. Reference Polderman, Hoekstra, Vinkhuyzen, Sullivan, van der Sluis and Posthuma2012). Because the deficits are most apparent in the co-morbid group for inhibitory processing and attentional orienting, the specificity of ADHD correlates may be dependent on the presence or absence of co-morbid disorders. Nevertheless, the significant interaction between ASD and ADHD on CNV amplitude, and also on response variability as indexed by the CV, suggests non-additive effects and the conceptualization of the co-morbid condition as a distinct condition. An examination of face and gaze processing deficits in the same sample, however, demonstrates gaze processing abnormalities in the ASD and co-morbid group that were not shown in the ADHD group, supporting an additive model (Tye et al. Reference Tye, Mercure, Ashwood, Azadi, Asherson, Johnson, Bolton and McLoughlin2013). The highly heterogeneous nature of all clinical groups is likely to give rise to various models of co-morbidity across domains and tasks.
Certain limitations should be taken into consideration. The relatively small sample size poses difficulties in the interpretation of the data because of low power and may lead to ambiguous conclusions. In particular, considering the lack of significant differences between ASD-only and ADHD-only when analysed in the four-group design, replication is warranted. Higher ASD symptom scores were demonstrated in the ASD + ADHD group, which may indicate exacerbation of autistic traits with co-morbid ADHD, in line with other findings (e.g. Yerys et al. Reference Yerys, Wallace, Sokoloff, Shook, James and Kenworthy2009). Alternatively, inflation of ASD scores by less obvious features in the defining features of the disorders, such as idiosyncratic attention–inattention patterns in ASD or peer rejection in ADHD, may occur (Clark et al. Reference Clark, Feehan, Tinline and Vostanis1999). The presence of subthreshold symptoms of ADHD in a few of the controls, and of other disorders associated with impaired inhibitory processing, such as conduct disorder in the diagnostic groups, may influence group results (Banaschewski et al. Reference Banaschewski, Brandeis, Heinrich, Albrecht, Brunner and Rothenberger2004). As the finding of EF deficits across ADHD and ASD is somewhat dependent on the task used (Sergeant et al. Reference Sergeant, Geurts and Oosterlaan2002), it may be the case that inhibitory deficits are displayed in ASD in different tasks or age groups. Similarly, it may be argued that this task taps into response selection processes and interference control rather than response inhibition per se, which should be tested explicitly using alternative tasks. In addition, the exclusion of participants due to poor performance and subsequent insufficient trials may reflect task difficulty, particularly for younger and less attentive participants, and potential floor effects; the pathophysiological correlates of this poor performance would be of interest. Although the stringent criteria applied throughout recruitment and analyses arguably limit generalizability to clinic patients, they have the significant advantage of reducing heterogeneity and helping to define objective markers of the disorders, which is necessary for advancing understanding of these disorders. In addition, these findings broaden previous work to suggest that certain neurophysiological abnormalities are associated with differential symptomatology, on the basis that the findings extend from diagnostic group analyses to quantitative symptom measures. Although we have proposed shared and distinct markers, these processes do not necessarily have distinct neuroanatomical or biological underpinnings, and as such, further work investigating the underlying mechanisms is required.
This is the first study to investigate directly whether ERP correlates of attention are similar or unique in children with ASD, ADHD and ASD + ADHD using the same test paradigm across groups. The findings indicate that there may be specific neuronal abnormalities in attention for ASD and ADHD, and suggest an additive model of ASD + ADHD. This complements and extends cognitive findings and suggests that previous inconsistent findings in the literature may be due to misspecification in group allocation. Along with accumulating evidence of co-occurring ADHD and ASD, this supports the adoption of a broader view of the psychopathology when assessing the underlying pathophysiology. Efforts to further define these disorders may help to refine classification systems and enhance the assessment of these complex cases for more specific treatment strategies (Banaschewski & Brandeis, Reference Banaschewski and Brandeis2007). Disentangling behavioural variation in EF is also likely to aid the identification of shared or disorder-specific susceptibility genes and other causal mechanisms underlying the complex aetiology of ASD and ADHD.
Supplementary material
For supplementary material accompanying this paper visit http://dx.doi.org/10.1017/S0033291713001049.
Acknowledgements
We thank the participating families and all staff involved in this study, in particular S. Cartwright, S. Lewis and S. Newman. This work was supported by a grant from the National Institute for Health Research (NIHR) Biomedical Research Centre for Mental Health (BRC), the Waterloo Foundation (G686984) and the Steel Charitable Trust (G38575208). Professor Bolton is supported by an NIHR Senior Investigator award and the BRC at the South London and Maudsley National Health Service (NHS) Trust Hospital, London.
Declaration of Interest
None.