I. INTRODUCTION
Commercial-purity titanium (Ti) has been widely used in medical industry owing to its high ratio of strength and weight, high corrosion resistance, and excellent biocompatibility. Reference Lee, Kim, Kim, Jung and Han1 However, it has a low yield stress, ultimate strength, and fatigue limit due to its coarse grain (CG) size, which restricts its application. According to the Hall–Petch law, Reference Hall2,Reference Petch and Lron3 grain refinement is an effective way to enhance both strength and ductility of metals and alloys. Severe plastic deformation (SPD), including equal channel angular pressing (ECAP), high press torsion, accumulative roll-bonding (ARB), Reference Valiev, Islamgaliev and Alexandrov4 and surface nanocrystallization (SNC), Reference Tao, Wang, Tong, Sui, Lu and Lu5 has proved to be one of the effective techniques to produce ultrafine grains (UFG, 100 nm < d < 1000 nm) and nanograins (NG, d < 100 nm). Reference Wang and Ma6 The strength of UFG/NG materials produced by SPD can be significantly improved. Recent research Reference Roland, Retraint, Lu and Lu7,Reference Fang, Li, Tao and Lu8 shows that a gradient UFG/NG microstructure produced on the surface of Ti by SNC can possess excellent strength and fatigue life. The results in literature Reference Yang and Hodgson9 demonstrated that the gradient UFG/NG layer has a crack-stopping effect to prevent catastrophic failure. Wen et al. Reference Wen, Wen, Hodgson and Li10 found that the pure Ti after a two-step treatment including surface mechanical attrition treatment (SMAT) combined with thermal oxidation process showed excellent wear-resistance and biocompatibility.
The SNC technique includes shot peening, cryogenic burnishing, SMAT, surface mechanical grinding treatment (SMGT), Reference Li and Soh11 and low plasticity burnishing. Reference Avilés, Albizuri, Rodríguez and López de Lacalle12,Reference Prevéy and Cammett13 The SPD behavior of Ti has been extensively studied during ECAP Reference Dheda and Mohamed14 and ARB, Reference Terada, Inoue and Tsuji15 which are often carried out at 450–500 °C to avoid the billet to be broken. In fact, the dislocation slip and shear bands are activated, and the deformation twinning is suppressed at this range of temperature during plastic deformation. Reference Chen, Li, Walmsley, Dumoulin and Roven16,Reference Yang, Cizek, Hodgson and Wen17 Twinning is an important deformation mode in HCP Ti, specifically at high strain rate and low temperature. Numerous studies have proved that deformation twinning can accelerate the grain refinement process. Reference Tao and Lu18,Reference Ghaderi and Barnett19 Recently, the UFG/NG Ti has been fabricated by ECAP at room temperature by increasing the channel angle of the die and using a relatively slow ram speed. Reference Zhao, Fu, Yang and Langdon20 However, little attention is paid to the difference of refinement mechanism between room temperature and the elevated temperature. Although the effect of deformation twinning on grain refinement in pure Ti at room temperature has been investigated by Lu et al. Reference Zhu, Vassel, Brisset, Lu and Lu21 during SMAT, further quantitative information is needed. The objective of this paper is to supply more details for the refinement of grains in the surface and subsurface of titanium with a large depth of gradient structure in hcp Ti fabricated by the surface rolling treatment (SRT) by analysis of x-ray diffraction (XRD), optical microscopy (OM), transmission electron microscope (TEM), EBSD, and microhardness. The evolution of microstructure with different depths from the treated surface was characterized. Special attention is paid to the role of twinning and dislocations in refining grain size. Grain refinement mechanisms at different depths from the surface were summarized based on analysis of the substructure.
II. EXPERIMENTAL PROCEDURE
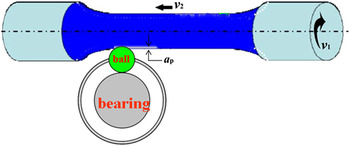
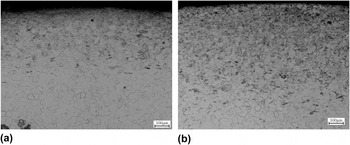
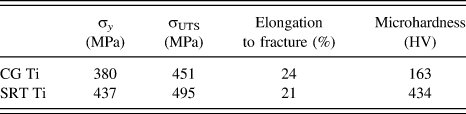
The material used in this study is the annealed commercial-purity Ti bars of 16 mm in diameter, with an average grain size of ∼30 μm. To obtain a nanostructure on the surface, a specific combination of ball and bearing was designed, as schematically illustrated in Fig. 1. This technique is similar to the SMGT technology, to some extent, which was invented by Lu et al., Reference Li and Soh11,Reference Li, Tao and Lu22 except replacing the turning tool with a moving ball. The Ti bars were processed by means of SRT at room temperature. The effect of different parameters on the microstructure and microhardness was first investigated by optical microscopy observation and microhardness test. For example, the results of pure Ti fabricated with different passes are shown in Fig. 2. It is observed that the sample obtained a deeper refined microstructural region after ten passes treated than five passes. Meanwhile, the surface microhardness increases from 354 to 432 Hv. Finally, the optimized parameters for pure Ti are determined: the rotation velocity of samples v 1 = 630 rpm, horizontal travel speed of the ball v 2 = 1 mm/s, and the rolling depth of the ball into the sample every time a p = 50 μm. The SRT was continuously repeated ten times with the same process parameters so as to achieve a thick and uniform nanograined layer. We have just conducted tension tests on the SRTed titanium sample and untreated sample. The strength and elongation to the fracture are given in Table I together with hardness.
Schematic illustration of SRT.

The optical microstructure of Ti sample fabricated by SRT with five passes (a) and ten passes (b).

The mechanical properties of pure Ti before and after SRT.

XRD analysis on the surface layer of SRT samples was carried out on a Rigaku D/max x-ray diffractometer (12 Kw; Japan) with a Cu Kα radiation. Small angular steps of 2θ = 0.02° and accounting time of 20 s were used to measure the width of a diffraction peak in a step-scanning mode.
The microstructural evolution of SRT samples was characterized using Olympus OLS4000 OM and JEM-200CX TEM (Japan). Metallographic samples were immersed in a solution of 2% (volume) HF, 8% HNO3, and 90% H2O for 10–15 s and immediately washed with water. Different subsurface layers were mechanically ground from the untreated side to ∼50 μm in thickness and then electro-polished using a twin-jet technique in a solution of 60% methanol (volume %), 35% butyl alcohol, and 5% perchloric acid at a voltage of 10–15 V and a temperature of about −30 °C. Electron backscatter diffraction (EBSD) was used to characterize the type of deformation twinning.
III. RESULTS
A. XRD analysis
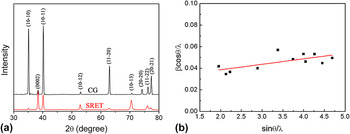
XRD analysis results of the surface layer in CG and SRTed Ti are shown in Fig. 3(a). Bragg diffraction peaks were broadened in SRTed sample compared with the as-received Ti. The similar characteristic was observed in other SPD metals and alloys. Reference Chen, Sun, Xiao and Sun23 The Bragg diffraction peak broadening could be attributed to the effect of grain refinement and microstrain increase in lattice scale. The relationship between the grain refinement broadening and microstrain broadening can be approximately expressed by the Scherrer equation Reference Youssef, Sakaliyska, Bahmanpour, Scattergood and Koch24 :
 $${\rm{\beta }}\cos {\rm{\theta }} = \left( {k{\rm{\lambda }}/d} \right) + {\rm{\varepsilon }}\sin {\rm{\theta }}\quad {\rm{,}}$$
where β is the measured integral breadth, θ is the peak maximum position, d is the grain size, ε is the microstrain, λ is the wave length, and k is a constant. Figure 3(b) showed a linear regression relationship between βcosθ/λ and sinθ/λ for all measured peaks of the SRTed samples. According to Eq. (1), grain size and microstrain are equal to the reciprocal of intercept and the slope of regression line, respectively. Reference Yang, Cizek, Fabijanic, Wang and Hodgson25 Figure 3(b) shows that the average grain size is about 72 nm when the microstrain is about 0.51%.
B. Optical and TEM microstructural observation
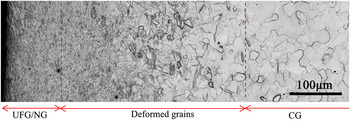
Optical microstructure in SRTed Ti is shown in Fig. 4. A gradient structure of 800 μm in depth was obtained as the depth increased from the treated surface. The gradient structure can be further divided into three regions. In the outmost of 100 μm (region I), the grain boundaries were obscure. It indicates that the CGs have been refined into ultrafine or nanoscale, which will be further confirmed by the following TEM images. To the authors' knowledge, such a depth of nanostructure in Ti has not been reported in other SNC treatments, such as SMAT, SMGT, and shot peening. Reference Roland, Retraint, Lu and Lu7,Reference Fang, Li, Tao and Lu8 In a depth of 100–800 μm (region Π), the microstructure gradually transformed into the deformed CGs, which were characterized by plenty of deformation twinning. The density of deformation twinning decreased as the depth increased. When the depth is larger than 800 μm (region Ш), the microstructure remains CG matrix. Similar results were also observed in SMATed Ti. Reference Zhu, Vassel, Brisset, Lu and Lu21,Reference Xiao26
XRD results of the surface layer in coarse-grained and SRTed Ti (a) XRD curves and (b) the relationship between βcosθ/λ and sinθ/λ.

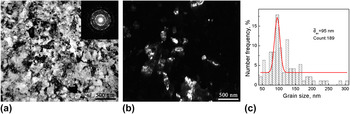
The microstructure at different depths was further examined with TEM. Figures 5(a) and 5(b) show the bright and dark fields of TEM images and the corresponding selected-area electron diffraction pattern (SADP) in SRTed Ti at a depth of ∼50 μm. The microstructure is mainly composed of ultrafine grains and nanograins [Fig. 5(a)]. Nanograins are almost characterized with curved grain boundaries with a high density of dislocations in most grains. The SADP exhibits well-defined rings, which suggest that nanograins are highly disoriented with respect to each other. Figure 5(c) shows the histogram map of grain size distribution obtained from a bright field image and at least four dark field images. It is demonstrated that the grain size at a depth of ∼50 μm subsurface ranges from 50 to 300 nm with an average grain size of 95 nm.
Optical micrograph in the cross-section of the SRTed Ti.

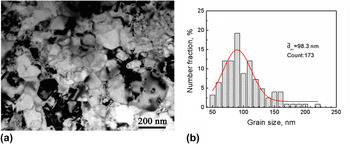
Microstructural feature on the topmost layer is shown in Fig. 6(a). In comparison with the micrograph in Fig. 5(a), the nanograins are more defined and equiaxed. Dislocation density was significantly reduced. This indicates that continuous dynamic recrystallization (CDRX) took place. As a result, dislocations rearranged and internal stresses decreased; but extra grain growth did not occur, as shown in Fig. 6(b).
TEM microstructure and the corresponding grain size distribution at the outmost depth of 50 nm in the SRTed Ti: (a) bright field (the inset is the SADP), (b) dark field, and (c) grain size distribution map.

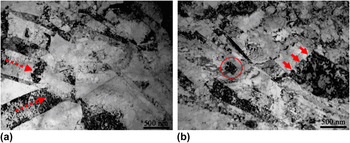
The bright field TEM images in SRTed Ti at the depth of ∼400 μm are shown in Figs. 7(a) and 7(b). Deformation twin is the major microstructural features at this depth. Some twin–twin intersection and twin–dislocation interaction were observed. In Fig. 7(a), two sets of deformation twins intersect with each other and ultimately refine the microstructure into irregular shape of nanograins. In Fig. 7(b), several dislocation walls perpendicular to the twin boundary were formed within the deformation twins due to the accumulation of a plenty of dislocations, as indicated by arrows in Fig. 7(b). Meanwhile, these dislocation walls broke deformation twins into rhomboid blocks.
TEM image (a) and the corresponding grain size distribution (b) in SRTed Ti at a depth of ∼10 μm.

C. EBSD analysis of microstructure
Six types of twins, including {11
 $\overline 2$
1}, {10
 $\overline 1$
2}, {11
 $\overline 2$
3}, {10
 $\overline 1$
1}, {11
 $\overline 2$
2}, and {11
 $\overline 2$
4}, have been observed in the deformed Ti, as listed in Table II.
Reference Li, Tao and Lu22,Reference Xiao26
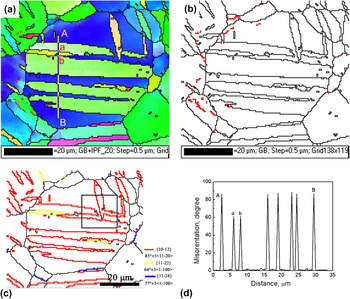
To determine the evolution of deformation twinning and the boundary misorientations with the distance from the treated surface in the SRTed Ti, the EBSD was used to characterize the microstructure. Figure 8 demonstrates the EBSD results in the CG at the depth of ∼600 μm. There are plenty of deformation twins in the selected grains. Grains were subdivided into several segments by twin boundaries, as shown in Fig. 8(a). All boundaries formed by twinning are large angle grain boundaries, as shown in Fig. 8(b). In comparison, some low angle grain boundaries (LAGBs) were formed due to dislocations accumulation. The volume fraction of the low angle boundaries is smaller than the large angle grain boundaries produced by twinning [Fig. 8(b)]. This indicates that twinning is the dominant deformation mode at this depth. In Fig. 8(c), different types of deformation twinning boundaries were marked by different colors. Black lines indicate high angle boundaries (θ > 15°) and red line indicates low angle boundaries (5°<θ < 15°). {10
 $\overline 1$
2} <10
 $\overline 1$
1> twinning and a small amount of {11
 $\overline 2$
2} <11
 $\overline 2$
3> and {11
 $\overline 2$
4} <22
 $\overline 4$
3> were observed in the selected grain. On close examination, the {10
 $\overline 1$
2} <10
 $\overline 1$
1> tensile twins were parallel to each other and encompassed inside the entire grain. In some case, the {10
 $\overline 1$
2} <10
 $\overline 1$
1> tensile twins also intersected with each other, as indicated by a black square in Fig. 8(c).
The misorientations angle along the axis and Schmid factors for different deformation twins in Ti.

TEM microstructure in the SRTed Ti at a depth of ∼400 μm (a) twin–twin intersection and (b) twin–dislocation interaction.

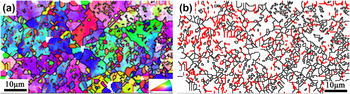
The EBSD inverse pole map and the grain boundary map at the depth of ∼300 μm are shown in Figs. 9(a) and 9(b), respectively. It contains a large number of ultrafine grains inside the twinned bands, which are formed by different types of twin intersections and secondary twins [Fig. 9(a)]. As deformation twinning became saturated with strain increasing, the pyramidal and prismatic slip played an important role in maintaining a homogeneous plastic deformation. The dislocation cells or subgrains were formed by the dislocation–dislocation interactions, dislocation–twins boundaries interactions. Dislocations were accumulated in the vicinity of twinning bands. This result can be proved by the corresponding grain boundary mapping, as shown in Fig. 9(b). There exist a large number of low angle boundaries colored in red inside twinning bands. This indicates that a great amount of dislocation slip took place.
EBSD results in the CG region at a depth of ∼600 μm: (a) inverse pole figure map, (b) boundary map, and (c) different types of twin boundary map. Black lines indicate high angle boundaries (θ > 15°) and red line indicates low angle boundaries (5° < θ < 15°), and (d) Point-to-point misorientation line profile along the direction of line AB in (a).

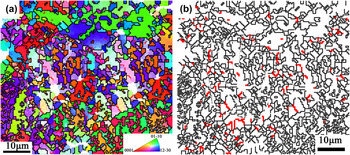
The EBSD inverse pole map and the grain boundary map at the depth of ∼100 μm are shown in Figs. 10(a) and 9(b), respectively. It was clearly seen that the initial grains have also been refined to submicrometer similar to the microstructure at a depth of ∼300 μm. However, the fraction of low angle boundaries sharply decreases. In other words, with increasing strain, the misorientations of dislocation cells and subgrain boundaries increased, leading ultimately to the formation of high angle boundaries.
EBSD inverse pole figure map at a depth of ∼300 μm (a) and the corresponding boundary mapping (b). [High angle boundaries (θ > 15°) are colored in black and low angle boundaries (5° < θ < 15°) are colored in red.]

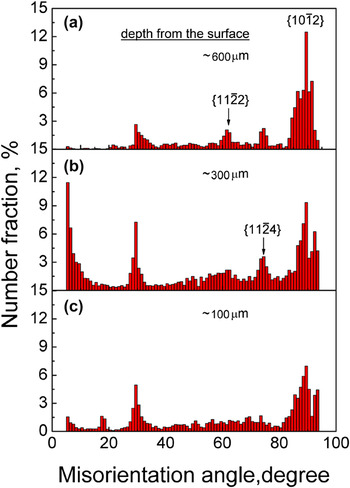
Figure 11 describes the corresponding misorientation angle distribution in the above EBSD maps. At the depth of ∼600 μm, some peaks of grain boundary misorientations were observed at about 30, 64, 76, and 85°, respectively, as shown in Fig. 11(a). The peaks of 64, 76, and 85° were ascribed to the {10
 $\overline 1$
2}, {11
 $\overline 2$
4}, and {11
 $\overline 2$
2} twinning systems. However, the formation mechanism of peak at about 30° is still unclear.
Reference Hong, Park and Lee27
The volume fraction of {10
 $\overline 1$
2} twin is larger than that of {11
 $\overline 2$
4} and {11
 $\overline 2$
2} twins. This suggested that the {10
 $\overline 2$
1} twins were mainly activated at initial deformation due to their low critical resolved shear stress.
Reference Obara, Yoshinaga and Morozumi28,Reference Li, Joshi, Almagri, Ma, Ramesh and Mukai29
At the depth of ∼300 μm [Fig. 11(b)], as the dislocations slip became the dominant deformation mode, the formation of dislocation walls and cells resulted in the increase of low angle boundaries. With strain increasing, the low angle boundaries transform into the high angle boundaries, as shown in Fig. 11(c). Meanwhile, the volume fraction of twin decreases as the twinning areas lost coherency with the matrix.
EBSD inverse pole figure map at a depth of ∼300 μm (a) and the corresponding boundary map (b). [High angle boundaries (θ > 15°) are colored in black and low angle boundaries (5° < θ < 15°) are colored in red.]

IV. DISCUSSION
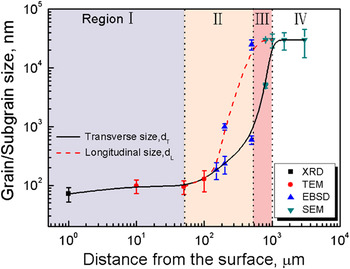
Based on different microstructural characterization techniques, the grain or subgrain size as a function of the distance from the surface can be summarized in four regions, as shown in Fig. 12. Three different grain refinement mechanisms could be clarified.
Misorientations distribution at different depths from the surface: (a) ∼600 μm, (b) ∼300 μm, and (c) ∼100 μm.

The grain/subgrain size as a function of the distance from the surface.

A. Twinning division and subdivision refinement
According to the Zener–Hollomon criterion,
Reference Zener and Hollomon30,Reference Li, Zhang, Tao and Lu31
the deformation twinning takes place in the early stage of deformation in hcp Ti. Six different types of twinning have been observed in pure Ti (Table II).
Reference Li, Tao and Lu22,Reference Hong, Park and Lee27
The selective criterion of different twinning systems has been investigated by many researchers.
Reference Christian and Mahajan32,Reference Kim, Kim, Shin, Liao and Zhu33
With the highest Schmid factor, {10
 $\overline 1$
2} twin is easier to be activated than other types of twins at the same deformation condition. Meanwhile, its volume fraction is large. They nucleate and propagate quickly inside the entire grain. The initial grains are divided into several finer grains by twinning boundaries [Fig. 8(a)]. Here, the new twinning region and the remained matrix can be considered as different independent grains. The corresponding grain/subgrain size distribution at this stage is located in the region III of Fig. 12. The transverse size sharply decreases and directly depends on the thickness of deformation twinning, while the longitudinal size decreased gently and the value is nearly equal to the initial grain size. With the strain increasing, the twins with the lower Schmid factors such as {11
 $\overline 2$
2} and {11
 $\overline 2$
4} gradually appear and the remained matrix is successively segmented. It is worth noting that the number of twinning with the lower Schmid factor is obviously fewer, and its thickness is narrower than that of {10
 $\overline 1$
2} twinning [Fig. 8(d)]. Occasionally, when the orientation of twinning areas is suitable for subsequent further twinning, the secondary twins or tertiary twins could be activated inside the primary twins.
Reference Ma, El Kadiri, Oppedal, Baird, Horstemeyer and Cherkaoui34,Reference Li, Wu, Bian, Tang, Liu, Koizumi and Chiba35
This results in the fragmentation of the primary twins. Moreover, the various deformation twinning systems may intersect with each other [Fig. 7(a)].
B. Grain refinement due to dislocation accumulation
It has demonstrated that twinning deformation mechanism is sensitive to the grain size. Reference Tao and Lu18 The formation of fresh twins becomes difficult as the grain size reduces to a critical value. Reference Ulacia, Dudamell, Galvez, Yi, Perez-Prado and Hurtado36,Reference Barnett, Keshavarz, Beer and Atwell37 The volume fraction of deformation twinning reaches to a saturation value with the increase in strain. The twinning subdivision effectiveness is no longer active. Dislocation slip becomes a dominant plastic deformation mode. Reference Zhu, Vassel, Brisset, Lu and Lu21,Reference Shin, Kim, Kim, Kim and Semiatin38 Subgrains or dislocation cells will be formed inside the twinning area and the remained matrix via dislocation slip process [Fig. 7(b)]. In the area of twinning, dislocations walls were formed as the dislocations accumulated. They usually are perpendicular to the twinning boundaries. The twinning grains were broken into several segments due to the formation of the dislocations walls. Extensive investigations show that the mean diameter of subgrains formed by this process depends on the thickness of twins. Reference Chen, Li, Walmsley, Dumoulin, Gireesh, Armada, Skaret and Roven39 As a result, the size of a subgrain due to the fragmentation of twins with a high Schmid factor is larger than that with a low Schmid factor. In the remained matrix, various slip systems including pyramidal and prismatic slip will be activated to accommodate the further plastic deformation. A plenty of dislocations activities led to the formation of dislocation walls and tangles. These dislocation configurations will gradually subdivide the remained matrix by forming individual dislocation cells [Fig. 7(b)].
C. The evolution of LAGBs to HAGBs
Subgrain or dislocation cells are typical LAGBs. With the further increase of strain, the LAGBs can transform into high angle grain boundaries (HAGBs). The LAGBs movement is driven by stress, which has been systematically investigated from the perspective of experiments, Reference Gorkaya, Molodov, Molodov and Gottstein40 dislocation dynamics simulation, Reference Lim, Haataja, Cai and Srolovitz41 and molecular dynamics simulation. Reference Janssens, Olmsted, Holm, Foiles, Plimpton and Derlet42,Reference Olmsted, Holm and Foiles43 The stress-driving migration of LAGBs ultimately leads to the formation of HAGBs. Since the pure Ti has a high stacking-fault energy, Reference Guo, Miodownik, Saunders and Schille44 some amount of adiabatic heat may produce on the outmost treated surface during SPD. Therefore, CDRX could occur [Fig. 6(a)]. Consequently, LAGBs evolve into HAGBs with the progressive increasing of misorientation of LAGBs. Reference Chun, Yu, Semiatin and Hwang45,Reference Zherebtsov, Dyakonov, Salem, Sokolenko, Salishchev and Semiatin46 However, the subgrains or cells do not show an obvious growth with the increase of misorientation, as shown in the region I of Fig. 12.
V. CONCLUSIONS
-
(1) A depth of 800 μm of gradient nano structure was produced in pure Ti by means of SRT.
-
(2) The gradient structure can be divided into three regions. In the outmost depth of 100 μm, nanograins with an average grain size of ∼100 nm were achieved. In a depth span of 100–800 μm, a large number of twins were observed. In the depth over 800 μm, the initial CGs were kept.
-
(3) Three different types of deformation twinning, including a large volume fraction of {10-12} <10-11> and a low fraction of {11-22} <11-23>, {11-24} <22-43>, were observed in the deformed grain regions.
-
(4) The grain refinement mechanism can be summarized as prior refinement by deformation twinning, grain refinement due to dislocation accumulation effect, and the evolution of LAGBs into HAGBs.
ACKNOWLEDGMENTS
This project was financially supported by the National Natural Science Foundation of China (Grant Nos. 51071118, 51271136, 50831004, and 51321003), the 973 Program of China (Grant Nos. 2010CB631003 and 2014CB644003), and the 111 Project of China (Grant No. B06025).