




No CrossRef data available.
Article contents
Normal patterns of flow in the superior caval, hepatic and pulmonary veins as measured using Doppler echocardiography during childhood
Published online by Cambridge University Press: 18 April 2005
Abstract
To date, no reference values have been provided for right and left atrial filling in normal children. The aim of our study, therefore, was to characterize measurements of superior caval, hepatic, and pulmonary venous flow using Doppler echocardiography in a large group of normal children to reflect the effects of age, body mass index, sex, heart rate and respiration.
Doppler echocardiographic examinations of the superior caval, hepatic and pulmonary veins were performed during inspiration and expiration in 72 healthy children with a mean age of 6.73 ± 5.10 years. The subjects were segregated into four age groups, namely infants <2 years, preschool children between the ages of 2 and 7 years, children of school age between 7 and 11 years, and adolescents older than 11 years.
Age has significant effect on the systolic and reverse atrial flows within the superior caval vein (p < 0.05). No change in the Doppler velocities was observed related to body mass index or sex. All peak systolic velocities decreased significantly during expiration (p < 0.05). This decrease was most prominent in the hepatic vein (26%), but less remarkable in the superior caval vein (5.7%) and the pulmonary veins (3.9%). During expiration, the peak diastolic flow in the superior caval and the hepatic veins decreased, while the reverse atrial flow in the hepatic vein increased (p < 0.05). Pulmonary venous velocities were similar in all age groups (p > 0.05). Except for the systolic pulmonary venous velocities, these parameters were not influenced by respiration (p > 0.05). The diastolic time, the interval between reverse atrial flow and ventricular systole reflected by the R wave on the electrocardiogram, and the interval between ventricular systole and diastolic flow, were negatively correlated with heart rate (p < 0.05; r = −0.35, −0.85, and −0.8 respectively), and positively correlated with age (p < 0.05; r = 0.3, 0.8, and 0.7 respectively). They were not influenced by respiration.
Our study provides data of the patterns and the normal ranges of velocities of superior caval, hepatic, and pulmonary venous flow in a series of normal children. The results can now be used for comparison with the patterns found in the setting of disease.
Information
- Type
- Original Article
- Information
- Copyright
- © 2003 Cambridge University Press
Doppler echocardiography has been used to detect abnormalities of the patterns of filling of the right and left atriums in adult patients.1–6 These patterns, however, have been much less frequently studied in children.7–10 Indeed, data are currently lacking for a large series of normal children. The purpose of our study, therefore, was to determine the normal patterns and velocities of flow in the superior caval, hepatic, and pulmonary veins using Doppler echocardiography in children of all ages. Our findings should then prove of value to paediatric cardiologists assessing children with cardiac disease.
Material and methods
Subjects studied
Newborn infants in the first week of life, older than 3 days, were recruited from the well baby nursery of the Hacettepe University Children's Hospital. Older children were recruited from the pediatric clinics of the Hacettepe University during their routine health maintenance visits, and from those referred to the pediatric cardiology unit for innocent murmurs. A few were volunteers or siblings of the patients. No children were acutely ill, nor taking any medications at the time of the study. All were growing normally, in a normal hemodynamic state, and normally hydrated during the echocardiographic study. We excluded children with conditions that may have caused an increased cardiac output, such as anaemia or hepatic or pulmonary disease. Informed consent was obtained for any examination not indicated clinically.
Systemic cardiac pathologies were excluded by means of a thorough physical examination, electrocardiography, and echocardiography. All children were in sinus rhythm and had normal electrocardiographic patterns. We noted the age, sex, height and weight of all patients, along with heart rate and blood pressure. We calculated the body mass index by dividing weight by the square of the height.
In order to define the ranges of normal velocities of flow at different ages, we divided our children into four subgroups in terms of age. Our infants had a mean age of 0.7 years, with a range from birth to 1 9/12 years. The preschool children had a mean age of 4.35 years, with a range from 2 8/12 to 6 5/12 years. Those of school age ranged from 7 to 10 3/12 years, with a mean age of 7.97 years. The adolescents ranged from 11 to 16 9/12 years, with a mean age of 13.92 years (Table 1).
Table 1. The children studied.

Echocardiographic examination
A complete echocardiographic study was performed, using multiple planes to confirm normal cardiac anatomy and function. Each child was examined in the supine position so as to exclude any variation in flow caused by changes in body position. No sedatives were used, and the studies were performed in a quiet, dimly lit, room with the infants and children in an awake and calm state. The same pediatric cardiologist performed all the echocardiographic examinations using a General Electric Vingmed System Five Performance using 10, 3.5, and 2.5 mHz probes. All the studies were recorded on the hard disc of the echocardiographic scanner for later analysis.
Velocities of superior caval venous flow were recorded from the subxyphoid sagittal view. The 2 mm-pulse wave Doppler sample volume was placed in the superior caval vein just proximal to the cavoatrial junction (Fig. 1). For assessing the velocity of hepatic venous flow, we studied the hepatic vein most closely aligned with the ultrasound beam as seen using the subcostal sagittal view. The sample volume was placed within 1 cm of the inferior cavoatrial junction. Only studies with adequate recordings showing the triphasic waveform were included (Fig. 2).

Figure 1. Measurements of the superior caval vein. (Left) Schematic drawing showing the superior caval venous velocities and the timed events. S: peak systolic flow; D: peak diastolic flow; A: peak reverse atrial systolic flow; A-R: the interval between the beginning of atrial contraction velocity and the beginning of ventricular contraction (the following R wave on the ECG); R-D: the interval between the R wave on the ECG (ventricular contraction) and the end of diastolic velocity; DT: interval from the beginning of early diastolic wave to the end of atrial contraction wave (diastolic time). (Right) Cross-sectional echocardiographic image of the superior caval vein (left) and the velocities measured by pulsed-wave Doppler echocardiography (right). svc: superior caval vein; LA: left atrium; RA: right atrium.

Figure 2. Measurements of the hepatic vein. (Left) Schematic drawing of the velocities of hepatic venous flow and the timed events. S: peak systolic flow; D: peak diastolic flow; A: peak reverse atrial systolic flow; A-R: the interval between the beginning of atrial contraction velocity and the beginning of ventricular contraction (the following R wave on the ECG); R-D: the interval between the R wave on the ECG (ventricular contraction) and the end of diastolic velocity; DT: interval from the beginning of early diastolic wave to the end of atrial contraction wave (diastolic time). (Right) Cross-sectional echocardiographic image of the hepatic vein (left) and the velocities of flow as measured by pulsed-wave Doppler echocardiography (right). hv: hepatic vein; RA: right atrium.
Pulmonary venous flow was recorded in the orifice of the right upper pulmonary vein using the subxyphoid four-chamber view, placing the sample volume within 1 cm of the venoatrial junction. Angle correction of the velocities was not used (Fig. 3).

Figure 3. Measurements of the pulmonary vein. (Left) Schematic drawing of the velocities of pulmonary venous flow and the timed events. S: peak systolic flow; D: peak diastolic flow; A: peak reverse atrial systolic flow; A-R: the interval between the beginning of atrial contraction velocity and the beginning of ventricular contraction (the following R wave on the ECG); R-D: the interval between the R wave on the ECG (ventricular contraction) and the end of diastolic velocity; DT: interval from the beginning of early diastolic wave to the end of atrial contraction wave (diastolic time). (Right) Cross-sectional echocardiographic image of the pulmonary vein (left) and the velocities measured by pulsed-wave Doppler echocardiography (right). pv: hepatic vein; LA: left atrium; RA: right atrium.
For each vein, we measured:
- Peak velocity of the antegrade systolic wave resulting from movement of the atrioventricular annulus toward the cardiac apex shortly after the QRS complex.
- Peak velocity of the antegrade early diastolic wave resulting from opening of the atrioventricular valve shortly after the T wave.
- Peak velocity of the late diastolic, retrograde atrial contraction wave resulting from atrial contraction immediately after the P wave.
The mean velocity of blood flow was calculated from the integral of the Doppler velocity tracings. To time the flow events, we simultaneously recorded an electrocardiogram, measuring the interval between the beginning of atrial and ventricular contraction as revealed by the following R wave on the electrocardiogram, the interval between the R wave and the end of diastolic velocity, and the interval from the beginning of the diastolic wave to the end of the atrial contraction wave, the latter representing the diastolic time (Figs 1–3). A phonocardiogram probe was placed in the xyphoid notch to determine systole and diastole, and a respiratory probe was placed in one of the nostrils to differentiate the phases of respiration.
Each Doppler measurement was made twice in end-inspiration, and twice in end-expiration. We averaged the measurements in inspiration and expiration, and also averaged all four measurements to give the total mean.
Statistics
The data is given as mean and standard deviation. The comparison of the echocardiographic measurements in different subgroups was made with analysis of variance and Student's t test. The Mann–Whitney U test with Bonn Feroni correction was applied to data with a non-normal distribution. The correlation of the measured data with variables like heart rate and body mass index were analyzed using the Pearson correlation constant, using the Spearman correlation constant for data with a non-normal distribution. A p value of < 0.05 was considered significant.
Results
The mean age of the children studied was 6.74 years, the mean weight was 24.03 kg, the mean body mass index was 16.65 kg/m2, and the mean systolic blood pressure was 98.5 mmHg (Table 1). The normal measurements from the superior caval, hepatic and pulmonary veins are shown in Table 2. Tables 3–5 show the flows in the superior caval, hepatic, and pulmonary veins, respectively, detailed according to the groups.
Table 2. Normal measurements from the superior caval vein, hepatic vein and pulmonary vein.

Table 3. Measurements of superior caval venous flow.

Table 4. Measurements of hepatic venous flow.

Table 5. Measurements of pulmonary venous flow.

The peak systolic velocities were greater than the peak diastolic velocities in all the veins. The systolic velocity integrals were similarly greater than the diastolic velocity integrals (Table 2). The mean ratio of maximum systolic velocity to maximum diastolic velocity was 1.55, with a range from 0.97 to 2.33, in the superior caval vein, 1.38, with a range from 0.67 to 2.69, in the pulmonary vein, and 1.24, with a range from 0.79 to 2.01, in the hepatic vein. All the peak systolic velocities decreased significantly during expiration (p < 0.05) (Fig. 4). This decrease was most prominent in the hepatic vein, with a mean decrease of 26%. The changes with respiration were less remarkable in the superior caval and pulmonary venous waveforms, with a mean decrease in the superior caval vein of 5.7%, and in the pulmonary vein of 3.9%. The velocity integral of the systolic flow in the superior caval and hepatic veins diminished significantly in expiration (p < 0.05). A similar decrement was observed in velocity integrals of the diastolic and atrial reverse flows in the hepatic vein (p < 0.05). Pulmonary diastolic flows, both during early diastole and during atrial contraction, did not change significantly with respiration (p > 0.05) (Fig. 4), whereas the peak early diastolic inflow to the right atrium from the superior caval and hepatic veins decreased in expiration (p < 0.05). In contrast, the reverse atrial flow in the hepatic vein was slightly increased in expiration (p < 0.05), while that in the superior caval vein did not change (p > 0.05) (Fig. 4).

Figure 4. Change in measurements with respiration. pv: pulmonary vein, hv: hepatic vein, svc: superior caval vein; S: peak systolic flow; D: peak diastolic flow; A: peak reverse atrial systolic flow. *p < 0.05: change with respiration is statistically significant.
The differences in duration of the timed events, namely the interval between atrial and ventricular contractions, the interval between ventricular contraction and diastolic flow, and the total diastolic time, were significant in all age groups, and they increased with age as the heart rate decreased (p < 0.05). It is of note that the heart rate also decreased significantly in expiration, although the timed events were similar in inspiration and expiration (p > 0.05).
Comparing the parameters for superior caval and hepatic venous flow showed that peak systolic flows and reverse atrial flows had significant, but weak, correlations with each other (p < 0.05, r = 0.5 for atrial flows; r = 0.4 for systolic flows). On the other hand, diastolic flows were not correlated in the systemic veins. There was no correlation between flows into the right as opposed to the left atriums.
None of the indexes of Doppler flow, nor the timed events, was influenced by sex (p > 0.05). Age, however, had important effects on the systolic flow and the reverse atrial flow in the superior caval vein, but only the inspiratory systolic flow in the hepatic vein was significantly influenced by age (p < 0.05). All these parameters decreased significantly with age, yet only the systolic flow in the superior caval vein had a weak significant correlation with age (p < 0.05, r = −0.43). All pulmonary venous velocities were similar in all age groups (p > 0.05).
None of the velocities were correlated with the index of body mass (p > 0.05). The systolic flow in the right atrium was weakly correlated with heart rate (p < 0.05; r = 0.3 for hepatic vein and r = 0.45 for superior caval vein).
Among the timed events, diastolic times, and the intervals between ventricular systole and early diastole had good correlation with each other for all the veins (p < 0.05, r = 0.8 for all the values), whereas the interval between atrial contraction and ventricular systole had weaker correlations (p < 0.05, r = 0.5 for all the values). All the timed events were negatively correlated with heart rate (p < 0.05; r = −0.85 for diastolic time, r = −0.8 for the interval between ventricular systole and early diastole, and r = −0.35 for the interval between atrial contraction and ventricular systole), and positively correlated with age (p < 0.05; r = 0.7 for diastolic time, r = 0.8 for the interval between ventricular systole and early diastole, and r = 0.3 for the interval between atrial contraction and ventricular systole).
Discussion
Our study was designed to determine the indexes of superior caval, hepatic, and pulmonary venous flow as measured using Doppler echocardiography in infants and children. Such studies have been made for the superior caval vein,11–13 the hepatic vein,14–17 and the pulmonary vein18–20 in adults, but as far as we know, such indexes have yet to be provided for a large group of normal children. The studies carried out in adults showed that the normal pattern of flow was triphasic, with systolic velocity amplitude greater than that of diastolic velocity, and minimal reversal occurring with atrial contraction.10–20 We found similar patterns in our group of children.
The systolic flow in the superior caval vein, and the reversed atrial flow, decreased with age. This is in keeping with the findings of Salim et al.,21 who demonstrated an age dependent relationship of the superior caval venous contribution to the total cardiac output. They found that this contribution was 49% at birth, and had increased to 55% by the age of 2.5–3 years. Afterwards, it declined, presumably as the inferior caval venous contribution increased. Since the newborn babies are not considered in a separate group in our study, and all the children less than 2 years old are included in one group, the increase in the contribution of superior caval vein to the cardiac output could not be observed. The subsequent expected decrease, however, was evident in our population.
While the inspiratory systolic flow in the hepatic veins significantly decreased with age, the expiratory component did not change. One reason could be that liver compliance is greater in children than in adults. Accordingly, the range and value of hepatic venous velocities vary more in children.10 Changes in hepatic venous velocities with age, therefore, were less remarkable than those measured in the superior caval vein. On the other hand, the respiratory changes were most prominent in the hepatic vein, with a mean decrease in systolic flow of 26%, compared to decreases of 5.7% and 3.9% in the superior caval and pulmonary veins, respectively. The pulmonary diastolic flows did not change with respiration, whereas peak diastolic flow in the hepatic and superior caval veins increased. This is due to the augmentation of the right ventricular filling with inspiration. The mechanisms proposed for this include the increase in systemic afterload secondary to negative pleural pressure, and the shift in position of the ventricular septum towards the left ventricle following the increased right ventricular filling. Furthermore, the increase in venous capacitance of the pulmonary vessels creates a relatively decreased left ventricular inflow.22 The larger tricuspid valvar orifice may also contribute to the increased diastolic inflows to the right atrium.23 The reverse atrial flow in the hepatic vein was slightly increased in inspiration, which may be attributed to the increased right atrial pressure in inspiration with the increased right ventricular filling. Zhang-An et al.3 have observed that patients with increased right heart pressures, as in pulmonary hypertension, had higher reversed atrial velocities in the hepatic vein.
The patterns of pulmonary venous flow, except for the systolic flow, were unaltered by respiration and all the velocities were uniform at all ages. Aging causes an increase in pulmonary venous systolic and atrial contraction flows, together with a decrease in pulmonary diastolic flow in adults, owing most likely to the decreased compliance and relaxation of the left ventricle with age.24 As children get older, however, the velocities in the pulmonary veins are not significantly changed. One may hypothesize that the patterns of left ventricular compliance and relaxation possibly start deteriorating after adulthood, and do not represent a continuous process from birth.
Among all the measured velocities of flow, only the systolic flow in the right atrium was weakly correlated with heart rate. The lower difference in pressure between the right atrium and right ventricle contributes to the slower relaxation of the right ventricle in diastole. The increased heart rate while decreasing the diastolic filling time may augment the systolic filling fraction of the right atrium as the tricuspid annulus moves towards the apex.25
The differences in the measured timed events, namely the interval between atrial and ventricular contractions, the interval between ventricular contraction and early diastolic flow, and the diastolic time, were significant among all the age groups. The duration of these events increased with age as the heart rate decreased. Diastolic time, and the interval between ventricular contraction and diastolic flow, had good negative correlation, while the interval between atrial and ventricular contractions had weaker correlation with heart rate. Similar, but positive, correlations were observed between these timed intervals and age. This was primarily attributed to the decrease in heart rate that is normally observed as the child gets older. On the other hand, although the heart rate of the subjects studied significantly decreased in expiration, the duration of these events was similar in inspiration and expiration. The impact of respiration on the heart rate is probably less obvious and short lived than the change observed in heart rate with age. The timed events, therefore, are influenced more by age-related changes in heart rate.
There is limited data currently available concerning the patterns of venous flow in disease states, and how they differ from normal. The studies available are mostly related to the hemodynamic changes after establishment of the Fontan circulation, where there is marked respiratory dependence of systemic and hepatic venous return, and where detrimental effect of gravity on the lower body venous return is significant.26–29 Understanding the normal hemodynamic in healthy individuals will surely make easier the understanding of the complex hemodynamic states in pre-and-post operative patients with congenital cardiac malformations.
References
Ghio S, Recusani F, Sebastiani R, et al. Doppler velocimetry in superior vena cava provides useful information on the right circulatory function in patients with congestive heart failure. Echocardiography 2001; 18: 469–477.Google Scholar
Byrd BF, Linden RW. Superior vena cava Doppler flow velocity patterns in pericardial disease. Am J Cardiol 1990; 65: 1464–1470.Google Scholar
Zhang-An, Himura Y, Kumada T, et al. The characteristics of hepatic venous flow velocity pattern in patients with pulmonary hypertension by pulsed Doppler echocardiography. Jpn Circ J 1992; 56: 317–324.Google Scholar
Wranne B, Pinto FJ, Hammarstrom E, St Goar FG, Puryear J, Popp RL. Abnormal right heart filling after cardiac surgery: time course and mechanism. Br Heart J 1991; 66: 435–442.Google Scholar
Oki T, Iuchi A, Tabata T, et al. Transesophageal pulsed Doppler echocardiographic study of systolic flow velocity patterns of the pulmonary vein in patients with atrial fibrillation. Echocardiography 1998; 15: 147–156.Google Scholar
Vitarelli A, Luzzi MF, Penco M, Ciciarello F, Fedele F, Dagianti A. PVF velocity pattern in patients with heart failure: transesophageal echocardiographic assessment. Cardiology 1997; 88: 585–594.Google Scholar
O'Leary PW, Durongpisitkul K, Cordes TM, et al. Diastolic ventricular function in children: a Doppler echocardiographic study establishing normal values and predictors of increased ventricular end-diastolic pressure. Mayo Clin Proc 1998; 73: 616–628.Google Scholar
Jequier S, Jequier JC, Hanquinet S, Le Coultre C, Belli DC. Hepatic vein Doppler studies: variability of flow pattern in normal children. Pediatr Radiol 2002; 32: 49–55.Google Scholar
Jequier S, Jequier JC, Hanquinet S, Gong J, Le Coultre C, Belli DC. Doppler waveform of hepatic veins in healthy children. Am J Roentgenol 2000; 175: 85–90.Google Scholar
Meyer RJ, Goldberg SJ, Donnerstein RL. Superior vena cava and hepatic vein velocity patterns in normal children. Am J Cardiol 1993; 72: 238–240.Google Scholar
Klein AL, Leung DY, Murray RD, Urban LH, Bailey KR, Tajik AJ. Effects of age and physiologic variables on right ventricular filling dynamics in normal subjects. Am J Cardiol 1999; 84: 440–448.Google Scholar
Gindea AJ, Slater J, Kronzon I. Doppler echocardiographic flow velocity measurements in the superior vena cava during the Valsalva maneuver in normal subjects. Am J Cardiol 1990; 65: 1387–1391.Google Scholar
Cohen ML, Cohen BS, Kronzon I, Lightly GW, Winer HE. Superior vena caval blood flow velocities in adults: a Doppler echocardiographic study. J Appl Physiol 1986; 61: 215–219.Google Scholar
Shapiro RS, Winsberg F, Maldjian C, Stancato-Pasik A. Variability of hepatic vein Doppler tracings in normal subjects. J Ultrasound Med 1993; 12: 701–703.Google Scholar
Abu-Yousef MM. Normal and respiratory variations of the hepatic and portal venous duplex Doppler waveforms with simultaneous electrocardiographic correlation. J Ultrasound Med 1992; 11: 263–268.Google Scholar
Coulden RA, Lomas DJ, Farman P, Britton PD. Doppler ultrasound of the hepatic veins: normal appearances. Clin Radiol 1992; 45: 223–227.Google Scholar
Appleton CP, Hatle LK, Popp RL. Superior vena cava and hepatic vein Doppler echocardiography in healthy adults. J Am Cardiol 1987; 10: 1032–1039.Google Scholar
De Marchi SF, Boldenmuller M, Lai DL, Seiler C. Pulmonary venous flow velocity patterns in 404 individuals without cardiovascular disease. Heart 2001; 85: 23–29.Google Scholar
Klein AL, Abdulla I, Murray RD, et al. Age independence of the difference in duration of pulmonary venous atrial reversal flow and transmitral A-wave flow in normal subjects. J Am Soc Echocardiogr 1998; 11: 458–465.Google Scholar
Gentile F, Mantero A, Lippolis A, et al. Pulmonary venous flow velocity patterns in 143 normal subjects aged 20 to 80 years old. An echo 2D colour Doppler cooperative study. Eur Heart J 1997; 18: 148–164.Google Scholar
Salim MA, DiSessa TG, Arheart KL, Alpert BS. Contribution of superior vena caval flow to cardiac output in children. Circulation 1995; 92: 1860–1865.Google Scholar
Riggs TW, Snider R. Respiratory influence on right and left ventricular diastolic function in normal children. Am J Cardiol 1989; 63: 858–861.Google Scholar
Eckner FAO, Brown WB, Davidson DL, Glagov S. Dimensions of normal human hearts. Arch Pathol 1969; 88: 497–507.Google Scholar
Kuecherer HF, Muhiudeen IA, Kusumoto FM, et al. Estimation of mean left atrial pressure from transesophageal pulsed Doppler echocardiography of pulmonary venous flow. Circulation 1990; 82: 1127–1139.Google Scholar
Zoghbi WA, Habib GB, Quinones MA. Doppler assessment of right ventricular filling in normal population. Comparison with left ventricular filling dynamics. Circulation 1990; 82: 1316–1324.Google Scholar
Hsia TY, Khambadkone S, Deanfield JE, Taylor JF, Migliavacca F, de Leval MR. Subdiaphragmatic venous hemodynamics in the Fontan circulation. J Thorac Cardiovasc Surg 2001; 121: 436–447.Google Scholar
Hsia TY, Khambadkone S, Redington AN, Migliavacca F, Deanfield JE, de Leval MR. Effects of respiration and gravity on infradiaphragmatic venous flow in normal and Fontan patients. Circulation 2000; 102 (19 Suppl 3): III: 148–153.Google Scholar
Kaulitz R, Bergman P, Luhmer I, Paul T, Hausdorf G. Instantaneous pressure-flow velocity relations of systemic venous return in patients with univentricular circulation. Heart 1999; 82: 294–299.Google Scholar
Kaulitz R, Luhmer I, Kallfelz HC. Pulsed Doppler echocardiographic assessment of patterns of venous flow after the modified Fontan operation: potential clinical implications. Cardiol Young 1998; 8: 54–62.Google Scholar
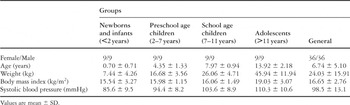
Table 1.

Measurements of the superior caval vein. (Left) Schematic drawing showing the superior caval venous velocities and the timed events. S: peak systolic flow; D: peak diastolic flow; A: peak reverse atrial systolic flow; A-R: the interval between the beginning of atrial contraction velocity and the beginning of ventricular contraction (the following R wave on the ECG); R-D: the interval between the R wave on the ECG (ventricular contraction) and the end of diastolic velocity; DT: interval from the beginning of early diastolic wave to the end of atrial contraction wave (diastolic time). (Right) Cross-sectional echocardiographic image of the superior caval vein (left) and the velocities measured by pulsed-wave Doppler echocardiography (right). svc: superior caval vein; LA: left atrium; RA: right atrium.

Measurements of the hepatic vein. (Left) Schematic drawing of the velocities of hepatic venous flow and the timed events. S: peak systolic flow; D: peak diastolic flow; A: peak reverse atrial systolic flow; A-R: the interval between the beginning of atrial contraction velocity and the beginning of ventricular contraction (the following R wave on the ECG); R-D: the interval between the R wave on the ECG (ventricular contraction) and the end of diastolic velocity; DT: interval from the beginning of early diastolic wave to the end of atrial contraction wave (diastolic time). (Right) Cross-sectional echocardiographic image of the hepatic vein (left) and the velocities of flow as measured by pulsed-wave Doppler echocardiography (right). hv: hepatic vein; RA: right atrium.

Measurements of the pulmonary vein. (Left) Schematic drawing of the velocities of pulmonary venous flow and the timed events. S: peak systolic flow; D: peak diastolic flow; A: peak reverse atrial systolic flow; A-R: the interval between the beginning of atrial contraction velocity and the beginning of ventricular contraction (the following R wave on the ECG); R-D: the interval between the R wave on the ECG (ventricular contraction) and the end of diastolic velocity; DT: interval from the beginning of early diastolic wave to the end of atrial contraction wave (diastolic time). (Right) Cross-sectional echocardiographic image of the pulmonary vein (left) and the velocities measured by pulsed-wave Doppler echocardiography (right). pv: hepatic vein; LA: left atrium; RA: right atrium.
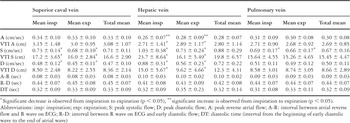
Table 2.
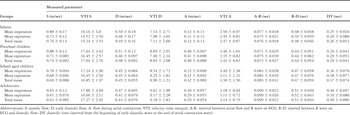
Table 3.
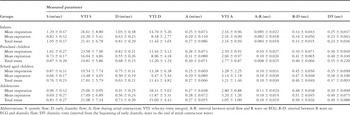
Table 4.
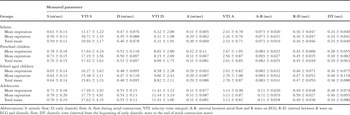
Table 5.

Change in measurements with respiration. pv: pulmonary vein, hv: hepatic vein, svc: superior caval vein; S: peak systolic flow; D: peak diastolic flow; A: peak reverse atrial systolic flow. *p < 0.05: change with respiration is statistically significant.
 You have
Access
- 14
- Cited by