INTRODUCTION
Mild cognitive impairment (MCI) describes a boundary condition between normal aging and dementia. A key feature of this syndrome was objective memory impairment, now referred to as amnestic MCI (aMCI) (Petersen et al., Reference Petersen, Smith, Waring, Ivnik, Tangalos and Kokmen1999). More recently, the classification criteria for MCI were expanded to include individuals with cognitive impairments in addition to memory (i.e., aMCI—multiple domain). Furthermore, people with deficits in one or more cognitive domains other than memory (e.g., language, attention/executive, and visuospatial skills) are described as having nonamnestic MCI (naMCI) (Petersen, Reference Petersen2004; Winblad et al., Reference Winblad, Palmer, Kivipelto, Jelic, Fratiglioni, Wahlund, Nordberg, Backman, Albert, Almkvist, Arai, Basun, Blennow, de Leon, Decarli, Erkinjuntti, Giacobini, Graff, Hardy, Jack, Jorm, Ritchie, Van Duijn, Visser and Petersen2004).
Many functional magnetic resonance imaging (fMRI) memory studies of aMCI examine changes in hippocampal activation during episodic memory tasks. Some investigators report decreased hippocampal activation during encoding (Johnson et al., Reference Johnson, Baxter, Sussking-Wilder, Connor, Sabbagh and Caselli2004, Reference Johnson, Schmitz, Asthana, Gluck and Myers2008; Machulda et al., Reference Machulda, Ward, Borowski, Gunter, Cha, O’Brien, Petersen, Boeve, Knopman, Tang-Wai, Ivnik, Smith, Tangalos and Jack2003), while others report increased hippocampal activation (Dickerson et al., Reference Dickerson, Salat, Bates, Atiya, Killiany, Greve, Dale, Stern, Blacker, Albert and Sperling2004, Reference Dickerson, Salat, Greve, Chua, Rand-Giovanetti, Rentz, Bertram, Mullin, Tanzi, Blacker, Albert and Sperling2005). Investigators also report mixed findings when examining extra-temporal fMRI activation in aMCI during memory tasks. For example, studies report decreased frontal cortex (Petrella et al., Reference Petrella, Krishnan, Slavin, Tran, Murty and Doraiswamy2006) and posterior cingulate activation (Johnson et al., Reference Johnson, Schmitz, Moritz, Meyerand, Rowley, Alexander, Hansen, Gleason, Carlsson, Ries, Asthana, Chen, Reiman and Alexander2006), and increased activation in right precentral gyrus, left insula (Petrella et al., Reference Petrella, Krishnan, Slavin, Tran, Murty and Doraiswamy2006), precuneus, and left parieto-occipital cortex (Heun et al., Reference Heun, Freymann, Erb, Leube, Jessen, Kircher and Grodd2007). Some of the variability of the fMRI results in aMCI may be due to how MCI is defined, disease stage, and the specific demands of the memory tasks.
To date, the few published naMCI imaging studies focus on structural changes [e.g., gray matter (GM) density, white matter (WM) changes, and vascular lesions; Whitwell et al., Reference Whitwell, Petersen, Negash, Weigand, Ivnik, Knopman, Boeve, Smith and Jack2007; Yoshita et al., Reference Yoshita, Fletcher, Harvey, Ortega, Martinez, Mungas, Reed and DeCarli2006; Zanetti et al., Reference Zanetti, Ballabio, Abbate, Cutaia, Vergani and Bergamaschini2006]. To our knowledge, there are no studies that examine fMRI changes in naMCI. This study was designed to examine fMRI activation during encoding and recognition tasks in cognitively normal (CN) elderly, aMCI, and naMCI. We hypothesized that aMCI subjects would show diminished activation in medial temporal regions relative to CN, whereas naMCI subjects would show diminished activation in extra-temporal regions such as the parietal or frontal lobes.
MATERIALS AND Methods
Participants
Subjects were recruited through the Mayo Clinic Alzheimer’s Disease Research Center/Alzheimer’s Disease Patient Registry in Rochester, MN (Petersen et al., Reference Petersen, Kokmen, Tangalos, Ivnik and Kurland1990). This study was approved by the Mayo Clinic Institutional Review Board and followed Health Insurance Portability and Accountability Act (HIPAA) guidelines. Informed consent was obtained from every subject.
The classification of CN, aMCI, and naMCI was based on input from three sources: the neurologist’s clinical opinion based solely on the neurologist’s interview and examination of the participant, neuropsychological test results as interpreted “blindly” by the neuropsychologist, and the nurse’s opinion based exclusively on information about the participant obtained from an informant and reflected in the Clinical Dementia Rating Summary Score (Morris, Reference Morris1993). At the completion of these evaluations, the three evaluators discussed each patient and assigned a final “consensus” diagnosis. Functional MRI data were not available.
MCI Subjects
The following criteria defined MCI: (1) cognitive complaint preferably corroborated by an informant, (2) not normal for age (as determined by the neurologists’ and neuropsychologists’ clinical judgment), (3) not demented, (4) cognitive impairment, and (5) essentially normal functional activities. Subjects were then classified as one of the four MCI subtypes: (i) aMCI—single domain (aMCI-SD), (ii) aMCI—multiple domain (aMCI-MD), (iii) naMCI—single domain (naMCI-SD), or (iv) naMCI—multiple domain (naMCI-MD) (Petersen, Reference Petersen2004; Petersen et al., Reference Petersen, Doody, Kurz, Mohs, Morris, Rabins, Ritchie, Rossor, Thal and Winblad2001). These groups were determined using the following decision-making process: If the individual had significant memory impairment, she/he was classified as aMCI. If there was no memory impairment, the individual was classified as naMCI. If memory was the only cognitive domain affected, the classification was aMCI-SD. If the individual had impairment in other cognitive domains such as language, attention/executive, or visuospatial function in addition to memory, the aMCI-MD diagnosis was given. Similarly, individuals with naMCI were classified as single domain when only one cognitive nonmemory domain was affected or multiple domain when ³2 cognitive nonmemory domains were impaired.
Because of the relatively small number of individuals who met criteria for naMCI-SD, this group was combined with the naMCI-MD group to form one naMCI group. For symmetry of comparison, the aMCI-SD and aMCI-MD groups were also combined to form a single aMCI group. Combining the aMCI-SD and aMCI-MD groups is also supported conceptually by the finding that the majority of these individuals will progress to AD (Whitwell et al., Reference Whitwell, Shiung, Przybelski, Weigand, Knopman, Boeve, Petersen and Jack2008), whereas individuals with naMCI-SD or naMCI-MD may be more likely to develop another type of dementia (Boeve et al., Reference Boeve, Ferman, Smith, Knopman, Jicha, Geda, Silber, Edland, Parisi, Dickson, Ivnik and Petersen2004; Whitwell et al., Reference Whitwell, Petersen, Negash, Weigand, Ivnik, Knopman, Boeve, Smith and Jack2007).
CN Elderly
CN elderly (1) were independently functioning community dwellers, (2) did not have active neurological or psychiatric conditions, (3) had no cognitive complaints, (4) had a normal neurological and neurocognitive exam, and (5) were not taking any medications in doses that would impact cognition.
Exclusion Criteria
Exclusion criteria were (1) diagnoses other than CN, aMCI, or naMCI; (2) medical contraindications to MRI scanning; (3) dementia; (4) structural abnormalities (e.g., intracranial neoplasms, infarctions, severe leukoariosis); (5) essential tremor; or (6) concurrent illnesses or treatments interfering with cognitive function other than MCI [e.g., heart/liver/renal failure, psychiatric disorders (including depression), substance abuse, Parkinson’s disease, or visual impairment].
Neuropsychological Testing
Cognitive testing was completed within 4 months of the fMRI scanning. Memory was evaluated by percent retention scores after a 30-min delay for the Logical Memory and Visual Reproduction subtests of the Wechsler Memory Scale—Revised (Wechsler, Reference Wechsler1987) and the Rey Auditory Verbal Learning Test (Rey, Reference Rey1964). Language tests measured object naming (Boston Naming Test; Kaplan et al., Reference Kaplan, Goodglass and Weintraub1983) and category fluency (Lucas et al., Reference Lucas, Ivnik, Smith, Bohac, Tangalos, Graff-Radford and Petersen1998) (i.e., animals, fruits, and vegetables). Attention/executive tests included the Trailmaking Test Part B (Spreen & Strauss, Reference Spreen and Strauss1991) and the Digit Symbol subtest from the Wechsler Adult Intelligence Scale—Revised (Wechsler, Reference Wechsler1981) (WAIS-R). Visuospatial function was assessed by the WAIS-R Picture Completion and Block Design subtests. All tests were administered by experienced psychometrists and supervised by clinical neuropsychologists (R.J.I. and G.E.S.). Raw scores were converted to Mayo’s Older American Normative Studies (MOANS) age-adjusted scaled scores that are normally distributed and have a mean of 10 and a standard deviation of 3 in cognitively healthy subjects (Ivnik et al., Reference Ivnik, Malec, Smith, Tangalos, Petersen, Kokmen and Kurland1992, Reference Ivnik, Malec, Smith, Tangalos and Petersen1996; Lucas et al., Reference Lucas, Ivnik, Smith, Bohac, Tangalos, Graff-Radford and Petersen1998). In each cognitive domain, a composite MOANS age-corrected scaled score was computed for every participant based on the median of the domain-specific tests. Note that the patients’ MOANS scores within a certain domain did not strictly define their MCI category although cognitive tests informed the clinical consensus diagnosis.
fMRI Tasks
We used a block design paradigm for our activation tasks. Subjects completed one encoding run and one recognition run. For encoding, subjects viewed photographs of scenes of people engaged in activities of daily living selected from a commercially available CD (Photodisc™). Instructions were provided on each screen during the activation condition to “Memorize and Press button if outdoor.” Photographs were presented for 5500 ms with a 500 ms interstimulus interval. This resulted in five photographs presented during each 30 s ½ cycle. Eighty percent of the photographs depicted outdoor scenes.
The baseline condition consisted of two colored pixelated images that either matched or did not match. Subjects were instructed to “Press button if the same.” To control for the motor and decision-making response, we matched the frequency and presentation order of correct responses during each baseline ½ cycle to those required during the previous activation condition ½ cycle. Stimuli were again presented for 5500 ms with a 500 ms interstimulus interval with five presentations per ½ cycle. The baseline condition controlled for vigilance, motor planning, motor response, and basic aspects of visual processing such as luminance and color level proportion but did not control for specific aspects of feature detection and object recognition.
For the recognition paradigm, subjects were instructed to “Press button if you recognize the picture.” No response was required for new (i.e., unfamiliar) items. Half of the photographs presented were from the encoding run. The presentation order of old versus new photographs was varied across the activation condition ½ cycles. We used the same baseline condition described above but adjusted the number of correct responses to match our activation condition for the recognition task (i.e., 50%). In order to control for motor response, we again matched the order of presentation of correct responses and frequency of correct responses for the activation and baseline conditions. Note that although the instructions for our tasks were to memorize and recognize the photographs, there are strong visuoperceptual processing and attentional components for both tasks.
MR Image Acquisition
Subjects were scanned on a 3.0 T short-bore scanner with an eight-channel head coil (GE, Milwaukee, WI). Each subject underwent a three-dimensional Spoiled Gradient Recalled (SPGR) anatomic reference scan (Repetition Time (TR) = 18 ms, Echo Time (TE) = 3 ms, 1.5-mm coronal slices) followed by whole-brain gradient-echo echo-planar fMRI runs (TR = 3000 ms, TE = 50 ms, 5-mm axial slices, voxel size = 3.75 × 3.75 × 5 mm, bandwidth ±64 kHz). Frequency encode direction was right to left. Twenty-six contiguous slices were collected in an interleaved fashion, and the slice order direction was inferior to superior. Each functional run consisted of 120 time course image volumes and was 6 min in duration. We discarded studies that had >3 mm of translation or >3° of rotation.
Functional Scanning Procedures
All subjects completed a practice session on a PC outside the scan room. Instructions were repeated immediately prior to each scan run while the subject was in the scanner. The same investigator (M.M.M.) was present for each study and provided instructions for how to complete the tasks. If necessary, subjects were fitted with MR-compatible lenses. The cognitive tasks were run on two computers using E-Prime Software 1.0 and IFIS-SA (Psychology Software Tools™, Pittsburgh, PA) connected to a visual liquid crystal display mounted on the head coil. The stimulus presentation hardware was synchronized with the scanner to provide precise temporal coordination between the MRI scanning parameters and stimulus delivery. Responses and reaction times were recorded by an MRI-compatible response button.
Data Analysis
All fMRI data were analyzed using the SPM2 software package (www.fil.ion.ucl.ac.uk/spm) running in Matlab 7.2 (The Mathworks, Inc., Natick, MA).
fMRI Analysis
Preprocessing steps: (1) Applied slice timing correction due to the interleaved acquisition order of the echo-planar images (EPI). (2) Registered each EPI time series, via a 6 degrees of freedom (DOF) affine transformation with a least squares cost function, to the first volume in the series to create a mean EPI volume for the series. (3) Registered the mean EPI volume to the anatomical SPGR volume, using a 6 DOF affine transformation with a normalized mutual information cost function. (4) Obtained normalization parameters by normalizing each subject’s anatomic image to a custom template (see below) (Senjem et al., Reference Senjem, Gunter, Shiung, Petersen and Jack2005). These parameters were then applied to the EPI time series for each subject. (5) Smoothed the spatially normalized EPI images by convolution with a 9-mm full-width at half-maximum (FWHM) Gaussian filter.
Custom Template Creation
To reduce any potential normalization bias across the MCI groups, a customized template and prior probability maps were created from all subjects in the study. To create the customized template and priors, all images were first registered to the Montreal Neurological Institute (MNI) template using a 12 DOF affine transformation and segmented into three tissue classes: GM, WM, and cerebral spinal fluid (CSF) using MNI priors. Next, the GM images were “normalized” to the MNI GM prior using a nonlinear discrete cosine transformation (DCT). The normalization parameters were applied to the original whole head, and the images were segmented into GM, WM, and CSF, using the MNI priors. Average images were created of whole head, GM, WM, and CSF, and smoothed using an 8-mm FWHM smoothing kernel.
The spatially normalized, smoothed EPI images were analyzed within the general linear model framework of the SPM2 software package (Friston et al., Reference Friston, Holmes, Worsley, Poline, Frith and Frackowiak1995). The time-series data were modeled as blocks and convolved with the canonical hemodynamic response function (without temporal derivatives) to account for the lag between stimulation and Blood Oxygenation Level Dependent (BOLD) signal. A 128 s high-pass filter removed low-frequency components from the fMRI data. Statistical parametric maps (SPMs) of the baseline versus activation conditions were created for each subject for both the encoding and recognition tasks. The SPMs of each subject were then entered into a one-sample t test to identify regions of activation in each patient group.
Because age and education differed between the groups, we performed an analysis of covariance when assessing between-group differences in activation during the encoding and recognition tasks with these two variables entered as covariates. We used a threshold of p < .001 (uncorrected for multiple comparisons) for within- and between-group analyses.
Demographic/Psychometric/Behavioral Data
Accuracy and reaction time data were recorded in E-Prime® and exported to an Excel spreadsheet. Demographic, psychometric, and behavioral data were analyzed with the statistical software environment R (version 2.6.1; R Foundation for Statistical Computing, Vienna, Austria).
RESULTS
Sample Characteristics
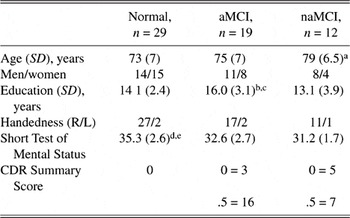
Demographic data are provided in Table 1. Kruskal–Wallis nonparametric tests compared differences among the groups due to the skewness in some measures. Post hoc pairwise comparisons were performed using the Wilcoxon rank sum test. Pairwise comparisons revealed that the naMCI group was older than CN. The aMCI group had more years of education than the CN and naMCI groups. CN had higher scores than both MCI groups on the Short Test of Mental Status (Kokmen et al., Reference Kokmen, Smith, Petersen, Tangalos and Ivnik1991). Eight of our subjects had a Clinical Dementia Rating (CDR) Summary Score of 0, yet were classified as MCI in the consensus conference. In every case, after each professional reported his/her independent classification, the group discussion resulted in a consensus diagnosis of aMCI or naMCI despite no changes in function as reported by the patient’s informant and reflected in the nurse’s CDR Summary Score. This is consistent with the criteria for MCI which state that MCI subjects usually (but not always) have a CDR = 0.5 (i.e., CDR = 0.5 is not a criterion for the diagnosis of MCI).
Demographic data for study participants

Note
R, Right; L, Left.
a naMCI > CN, p = .03.
b aMCI > naMCI, p = .03.
c aMCI > CN, p = .02.
d CN > naMCI, p = .02.
e CN > aMCI, p < .001.
Seventy-two percent of the CN group had an informant. Of these, 81% was either a spouse/partner or child. Forty-two percent of the individuals in the aMCI group had an informant, and all the informants were either a spouse/partner or a child. All the individuals in the naMCI group had an informant, and 92% of these were a spouse/partner or child.
Neuropsychometric Data
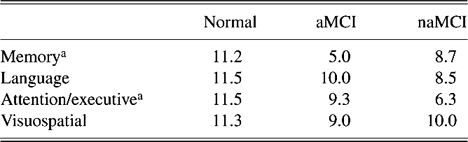
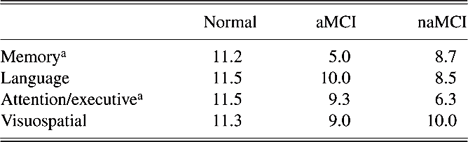
Of the aMCI group, 15 had only memory impairment, while 2 had impairment in memory and attention/executive function and 2 had impairment in memory and language. Of the naMCI group, seven had impairment in one cognitive domain, that is, five in attention/executive, one in language, and one in visuospatial function. Five had impairment in two domains, that is, four in attention/executive and visuospatial function and one in attention/executive and language. Median cognitive composite scores are provided in Table 2. There were group differences on both the Memory and Attention/Executive Cognitive Composite Scores.
Median cognitive composite MOANS
a Group-wise difference, p < .001.
Functional Imaging Findings
Within-group analyses
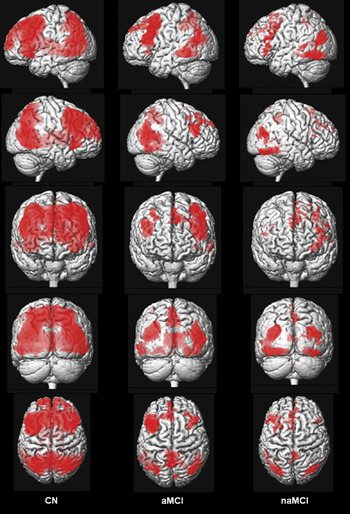
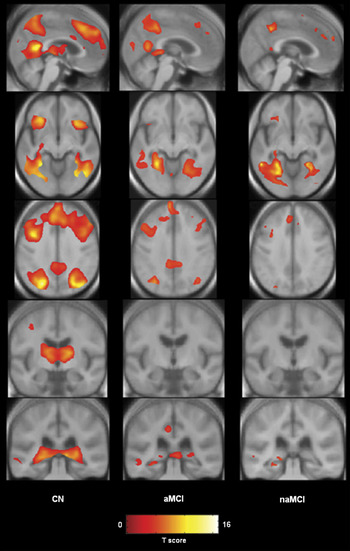
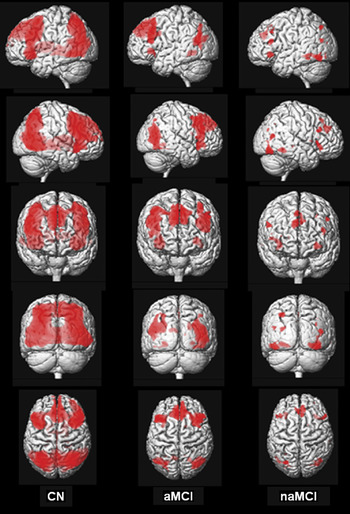
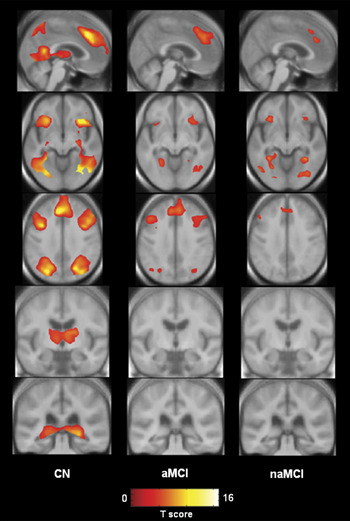
Visual inspection of activation maps shows that during the encoding versus baseline task, CN activated an extensive network that included bilateral occipital–parietal–posterior temporal visual association cortices, precuneus, posterior cingulate, posterior hippocampus, fusiform gyrus, thalamus, insular regions, medial and anterior frontal cortex, and superior/middle/inferior frontal gyri. Amnestic MCI activated an anatomic subset of these same regions except thalamus and insular cortex but with less magnitude and extent. Non-amnestic MCI also activated many of the same regions (except thalamus and insular cortex) but with less magnitude and extent still than either CN or aMCI (Figures 1 and 2).
Rendered images of activation during encoding in CN, aMCI, and naMCI displayed on a T1-weighted single-subject brain. Greater color intensity denotes greater proximity to the surface of the brain.

Views of activation during encoding for each patient group displayed on cross sections of custom template created from subjects in the study. Left side of the images corresponds to the left hemisphere.

During the recognition versus baseline task, CN subjects once again activated an extensive network that included occipital–parietal–posterior temporal visual association cortices, posterior cingulate, posterior hippocampus, thalamus, insular cortex, medial frontal, and superior/middle/inferior frontal gyri in a bilaterally symmetric manner. Amnestic MCI subjects activated the same regions (except thalamus, posterior cingulate, and posterior hippocampus), but visual inspection once again shows less magnitude and extent. Non-amnestic MCI subjects activated the same regions as CN and aMCI (except thalamus, posterior cingulate, and posterior hippocampus) but again with less magnitude and extent still than either CN or aMCI (Figures 3 and 4).
Rendered images of activation during recognition in CN, aMCI, and naMCI displayed on a T1-weighted single-subject brain. Greater color intensity denotes greater proximity to the surface of the brain.

Views of activation during recognition for each patient group displayed on cross sections of custom template created from subjects in the study. Left side of images corresponds to the left hemisphere.

Between-group comparisons
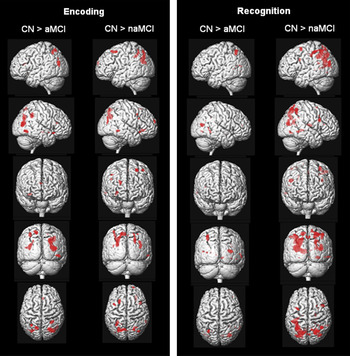
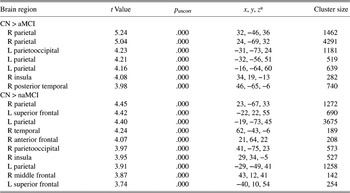
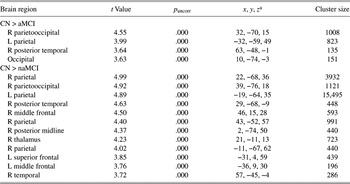
During encoding, CN had more activation than aMCI in bilateral parietal areas, right posterior temporal lobe, and small foci in the right frontal lobe. CN had more activation than naMCI in the parietal lobes bilaterally, right posterior temporal lobe, and several foci in the prefrontal cortex bilaterally (Figure 5, Table 3). There were no areas in which aMCI had more activation than naMCI, and no areas in which aMCI and naMCI had more activation than CN.
Rendered images showing increased activation in CN relative to aMCI and naMCI during encoding and recognition with age and education entered as covariates (p < .001, uncorrected).

Areas showing between-group differences during encoding with age and education entered as covariates

Note
R, Right; L, Left.
a Coordinates from the custom template created from subjects in the study. These values approximate MNI coordinates.
During recognition, CN had more activation than aMCI in the left parietal lobe and right posterior temporal lobe. CN had more activation than naMCI in larger areas involving the parietal lobes bilaterally, right posterior temporal lobe, and several foci in the prefrontal cortex bilaterally (Figure 5, Table 4). The aMCI versus naMCI comparison showed only a very small area in the occipital lobe. There were no areas in which naMCI had more activation than aMCI, and there were also no areas in which aMCI and naMCI had more activation than CN.
Areas showing between-group differences during recognition with age and education entered as covariates

Note
R, Right; L, Left.
a Coordinates from the custom template created from subjects in the study. These values approximate MNI coordinates.
Behavioral Performance During Scanning
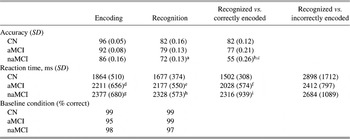
Behavioral data during scanning are provided in Table 5. During encoding, there was a trend for naMCI to perform less accurately than CN (p < .06). During recognition, the naMCI group was less accurate than CN. We also examined the percent of photographs correctly recognized relative to the percent correctly encoded and found that the naMCI group performed more poorly than the CN and aMCI groups. Finally, the aMCI and naMCI groups performed both tasks more slowly than CN.
Behavioral accuracy and reaction time during encoding and recognition tasks (all values presented are group means)

a CN > naMCI, p < .04.
b CN > naMCI, p < .005.
c aMCI > naMCI, p < .03.
d CN < aMCI, p < .05.
e CN < aMCI, p < .0008.
f CN < aMCI, p < .003.
g CN < naMCI, p < .02.
h CN < naMCI, p < .0002.
i CN < naMCI, p < .0001.
DISCUSSION
Our fMRI results are consistent with other studies showing widely distributed activation in frontal, parietal, and temporal regions in CN and aMCI during encoding and retrieval tasks (Heun et al., Reference Heun, Freymann, Erb, Leube, Jessen, Kircher and Grodd2007; Petrella et al., Reference Petrella, Krishnan, Slavin, Tran, Murty and Doraiswamy2006). Bilateral visual association cortex and structures that are part of the ventral processing stream, including lingual and fusiform gyri, are known to be involved in higher order visual processing (i.e., complex visual scenes) (Machielsen et al., Reference Machielsen, Rombouts, Barkhof, Scheltens and Witter2000). Lateral and medial parietal regions are also involved in higher order processing of visual stimuli (Machielsen et al., Reference Machielsen, Rombouts, Barkhof, Scheltens and Witter2000) and episodic recognition and retrieval tasks (Johnson et al., Reference Johnson, Schmitz, Moritz, Meyerand, Rowley, Alexander, Hansen, Gleason, Carlsson, Ries, Asthana, Chen, Reiman and Alexander2006; Wagner et al., Reference Wagner, Shannon, Kahn and Buckner2005). Frontal regions are frequently invoked during memory tasks and are thought to mediate processes such as updating/maintaining information, monitoring/manipulating information, and selecting processes and goals (Fletcher & Henson, Reference Fletcher and Henson2001). Other investigators report inferior and middle frontal lobe activation during complex scene memory tasks similar to what was used here (Gutchess et al., Reference Gutchess, Welsh, Hedden, Bangert, Minear, Liu and Park2005; Machielsen et al., Reference Machielsen, Rombouts, Barkhof, Scheltens and Witter2000). Our memory tasks produced additional activation in superior and medial frontal gyri, possibly reflecting recruitment of these regions for more elaborate semantic and attentional processing.
Contrary to our expectations, the areas of diminished activation in the aMCI group relative to CN were in lateral temporoparietal regions and a small area in the right frontal lobe during encoding and predominantly bilateral temporoparietal areas during recognition. This suggests disruption of memory circuitry that extends beyond the medial temporal lobe structures. Our results differ from a previous study showing decreased activation during a face–name encoding–retrieval task in aMCI in frontal regions, left hippocampus, and left cerebellum and increased activation in the posterior frontal lobes (Petrella et al., Reference Petrella, Krishnan, Slavin, Tran, Murty and Doraiswamy2006). This may be due to differences in the nature of the activation task as well as subject classification. It is plausible that since we did not observe any compensatory activation in our aMCI group, that our cohort is closer to progressing to dementia than individuals who retain sufficient cognitive reserve that they are able to produce a compensatory fMRI response (Celone et al., Reference Celone, Calhoun, Dickerson, Atri, Chua, Miller, DePeau, Rentz, Selkoe, Blacker, Albert and Sperling2006; Dickerson et al., Reference Dickerson, Salat, Bates, Atiya, Killiany, Greve, Dale, Stern, Blacker, Albert and Sperling2004, Reference Dickerson, Salat, Greve, Chua, Rand-Giovanetti, Rentz, Bertram, Mullin, Tanzi, Blacker, Albert and Sperling2005).
As noted above, these visually mediated tasks invoke activation in multiple brain regions. It is possible that a breakdown in any stage of processing may compromise an individual’s ability to successfully complete the task. Both tasks placed significant demands on visuoperceptual and attentional processing. We interpret the diminished parietal activation during both encoding and recognition tasks in the naMCI group as reflecting compromised visuospatial function, while attentional impairments result in diminished frontal activation. Difficulty with the visuoperceptual and attentional components of the task could also explain the poorer behavioral performance of the naMCI group during encoding and recognition. Ten subjects in the naMCI group had impairment in attention/executive function. Of these, four also had impairment in visuospatial function and one had impairment in language function. One subject had isolated impairment in visuospatial function. Thus, the majority of subjects in this group had impairment in cognitive domains that were heavily taxed by this task. We may have achieved slightly different within- and between-group results if we had used an auditorily presented verbal memory task (e.g., relatively greater left vs. right hemisphere and anterior vs. posterior activation.) However, even these types of fMRI tasks are not a “pure” assessment of memory function given that more than one domain of cognition (i.e., commonly language and attention) is invoked for successful completion of these tasks.
Both aMCI and naMCI had slower reaction times than CN during the encoding and recognition tasks, but the reaction times of the clinical groups were still well within the time allowed to respond to each photograph (i.e., 6 s). The greater magnitude and extent of activation observed in the CN group relative to aMCI despite similar behavioral performances may reflect more elaborate encoding and recognition strategies, resulting in recruitment of additional neocortical regions (Cabeza, Reference Cabeza2001; Gutchess et al., Reference Gutchess, Welsh, Hedden, Bangert, Minear, Liu and Park2005).
We excluded all subjects who had any evidence of infarct on structural scans. We did not require associated clinical evidence of stroke for exclusion in the presence of an infarction on MRI. We also screened for severe leukoariosis but not transient ischemic attacks. This would suggest that the diminished activation in the aMCI and naMCI groups is not solely the result of cerebrovascular disease. Rather, our subjects may be in the prodromal stage of a neurodegenerative disease such as Alzheimer’s disease, Lewy body dementia, or a frontotemporal spectrum disorder. Our findings may not extend to all aMCI or naMCI patients as they exist in the general population, many of whom may have cerebrovascular disease.
We observed posterior temporal but not anterior medial temporal activation in all three groups during the encoding task. This is consistent with studies by us and others reporting activation primarily in the posterior medial temporal lobe during complex scene encoding (Machulda et al., Reference Machulda, Ward, Cha, O’Brien and Jack2001; Rombouts et al., Reference Rombouts, Scheltens, Machielsen, Barkhof, Hoogenraad, Veltman, Valk and Witter1999). Somewhat unexpectedly and unlike our previously published results, we did not find statistical evidence for greater medial temporal lobe activation in CN compared to aMCI (Machulda et al., Reference Machulda, Ward, Borowski, Gunter, Cha, O’Brien, Petersen, Boeve, Knopman, Tang-Wai, Ivnik, Smith, Tangalos and Jack2003). Differences in methodology (i.e., Regions of Interest (ROI) vs. voxel-level analyses) may account for the lack of statistical differences in medial temporal lobe activation despite different levels of activation on visual inspection.
We used a clinical consensus to categorize our subjects. This is similar to the clinical diagnosis of dementia wherein clinical judgment—not psychometric cutoffs—has long been used with adequate reliability. This approach has several strengths. First, the information used to arrive at a diagnosis is gathered from several different sources including psychometric test performance, the neurological examination, information gathered by the neurologist from the patient and the patient’s caregiver (if available), and information gathered by a nurse from the patient and the patient’s caregiver (if available). This is the approach consistently used in our research and accepted in Consensus Criteria (Petersen et al., Reference Petersen, Smith, Waring, Ivnik, Tangalos and Kokmen1999, Reference Petersen, Ivnik, Boeve, Knopman, Smith and Tangalos2004; Winblad et al., Reference Winblad, Palmer, Kivipelto, Jelic, Fratiglioni, Wahlund, Nordberg, Backman, Albert, Almkvist, Arai, Basun, Blennow, de Leon, Decarli, Erkinjuntti, Giacobini, Graff, Hardy, Jack, Jorm, Ritchie, Van Duijn, Visser and Petersen2004). Utilizing input from several different sources results in greater diagnostic validity and reliability because the potential impact of random variations on any given psychometric test performance is minimized. This also avoids the downside of using a single psychometric cutoff which could result in misclassification as a result of poor test performance that is not related to the subject’s true ability level but rather error variance as a result of poor effort, distraction, anxiety, and so forth. There are also limitations to this approach. It is less quantitative and more subjective than psychometric data. The diagnostic classification of subjects depends on the skill level of the clinicians evaluating patients. As a result, it is also more difficult to replicate across different centers. Even though studies that utilize psychometric cutoffs are easier to implement and replicate across centers, this does not necessarily improve the reliability of findings.
A limitation of this study is the inevitable heterogeneity of subjects in all three groups. Some of the CN could be in a predementia state. By definition, most individuals with MCI are in a state of transition between normal aging and dementia. Although we used a well-characterized group of individuals diagnosed with aMCI and naMCI, some of them are undoubtedly closer to developing dementia than others. Within both MCI groups, there is also variability in the degree of cognitive impairment and the specific cognitive domain(s) affected. This is especially evident for naMCI because nearly half (5 of the 12) of the individuals in this group had cognitive impairment in two of three different nonmemory cognitive domains (i.e., attention/executive, visuospatial, or language function). Finally, a portion of our aMCI subjects (47%) were taking memory-enhancing medications (eight on a cholinesterase inhibitor and one on an N-methyl-D-aspartate (NMDA) antagonist). Only one naMCI subject was taking a cholinesterase inhibitor. It is unlikely that this would account for group differences given that memory-enhancing drugs are known to increase BOLD activation (Goekoop et al., Reference Goekoop, Rombouts, Jonker, Hibbel, Knol, Truyen, Barkhof and Scheltens2004; Saykin et al., Reference Saykin, Wishart, Rabin, Flashman, McHugh, Mamourian and Santulli2004).
We conclude that both aMCI and naMCI subjects who are mildly (as opposed to very mildly) impaired display decreased fMRI activation relative to healthy elderly control subjects. The fMRI activation patterns were not specific for the clinical syndromes of either aMCI or naMCI but rather seem to represent diminished activation in response to a task that placed demands on multimodal association cortical areas.
ACKNOWLEDGMENTS
Supported by Alzheimer’s Association NIRG-05-13067, NIH-NIA: AG19142, AG16574, AG06786, AG11378, the Robert H. and Clarice Smith and Abigail Van Buren Alzheimer’s Disease Research Program and the Alexander Family Alzheimer’s Disease Research Professorship of the Mayo Foundation, USA.