Introduction
Wastewater from Antarctic stations is frequently discharged into the marine environment with little or no treatment (Smith & Riddle Reference Smith and Riddle2009). A recent review of wastewater treatment practices found 37% of permanent stations and 69% of summer-only stations lacked any form of treatment (Gröndahl et al. Reference Gröndahl, Sidenmark and Thomsen2009). Treatment is not a requirement of the Environmental Protocol to the Antarctic Treaty (Madrid Protocol), which allows direct discharge into the sea where conditions exist for ‘initial dilution and dispersion’ (Article 5). The treaty specifies a minimum of maceration treatment for stations with c. 30 individuals or more over summer, and allows discharge from secondary treatment processes, such as rotary biological contactors, provided it ‘does not adversely affect the local environment’ (Jabour Reference Jabour2009, Smith & Riddle Reference Smith and Riddle2009, Jackson & Kriwoken Reference Jackson and Kriwoken2011).
Effective environmental management of wastewater disposal in Antarctica requires an understanding of its environmental risks and assessment of dilution and dispersal. To evaluate the effectiveness of wastewater treatment, baseline data is required against which improvements can be evaluated. Faecal indicator bacteria such as Escherichia coli (Migula) Castellani & Chalmers, thermotolerant coliforms (faecal coliforms) and faecal enterococci are commonly used to assess these factors. However, these organisms are also known to occur in Antarctic wildlife (Smith & Riddle Reference Smith and Riddle2009). Coastal Antarctic stations are generally located on ice-free areas commonly used for breeding and haulout by macrofauna, such as Adélie penguins (Pygoscelis adeliae (Hombron & Jacquinot)), south polar skuas (Stercorarius maccormicki (Saunders)) and southern elephant seals (Mirounga leonine L.), as well as largely sea ice associated emperor penguins (Aptenodytes forsteri Gray), Weddell (Leptonychotes weddelli (Lesson)) and leopard (Hydrurga leptonyx (de Blainville)) seals. For environmental monitoring and assessment of human sewage distribution around Antarctic stations, the question arises: faecal contamination by whom? Previous studies have used faecal sterols to identify the distribution of human-derived sewage effluents in the Antarctic context (Green et al. Reference Green, Skerratt, Leeming and Nichols1992, Montone et al. Reference Montone, Martins, Bícego, Taniguchi, da Silva, Campos and Weber2010). However, the source specificity of this approach needs to be reassessed in light of evidence indicating that Antarctic marine mammals are capable of producing significant quantities of the ‘human’ faecal biomarker coprostanol (5β(H)-cholestan-3β-ol) (Venkatesan & Santiago Reference Venkatesan and Santiago1989).
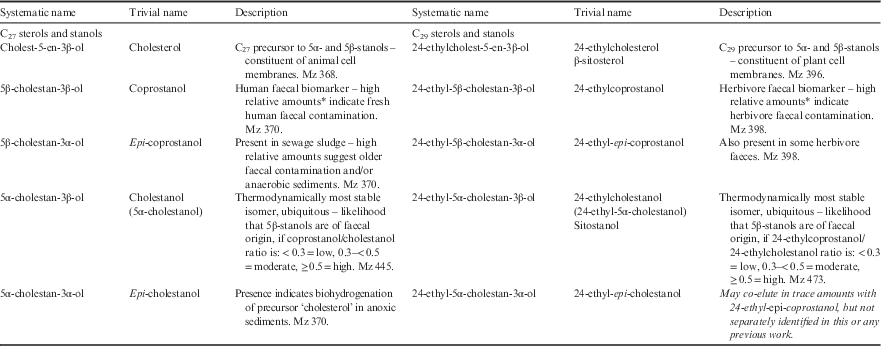
Faecal sterols have been used for over 40 years as indicators of faecal contamination, as well as to discriminate faecal contamination sources (see Table I and Methods for details of nomenclature used). The principal human faecal sterol is the C27 coprostanol, which constitutes c. 60% of total sterols found in human faeces (Leeming et al. Reference Leeming, Ball, Ashbolt and Nichols1996, Reference Leeming, Nichols and Ashbolt1998). In contrast, the principal faecal sterol excreted by herbivores is the C29 homologue of coprostanol; termed 24-ethylcoprostanol (24-ethyl-5β(H)-cholestan-3β-ol) and not to be confused with 5β-stigmastanol (5β-cholesta-22-en-3β-ol) which is a phytosterol. Neither biomarker is entirely unique to their source, rather they predominate in their respective hosts (see Bull et al. Reference Bull, Lockheart, Elhmmali, Roberts and Evershed2002 for a review of sterol biomarker specificity). The most sensitive sterol parameter for identifying either human or herbivore-derived faecal contamination is the 5β-/5α-stanols ratio: the C27 pair for human contamination and the C29 pair for herbivores (Leeming et al. Reference Leeming, Ball, Ashbolt and Nichols1996, Reference Leeming, Nichols and Ashbolt1998). The C27 ratio pair was first proposed by Grimalt et al. (Reference Grimalt, Fernandez, Bayona and Albaiges1990) as the ratio coprostanol/(coprostanol+cholestanol). Leeming et al. (Reference Leeming, Latham, Rayner and Nichols1997, Reference Leeming, Nichols and Ashbolt1998) refined the ratio to coprostanol/cholestanol; with <0.3 indicative of faecally uncontaminated, >0.5 contaminated and 0.3–0.5 requiring additional supporting data to assess status.
Systematic and trivial names and description of C27 and C29 sterols used in this study.
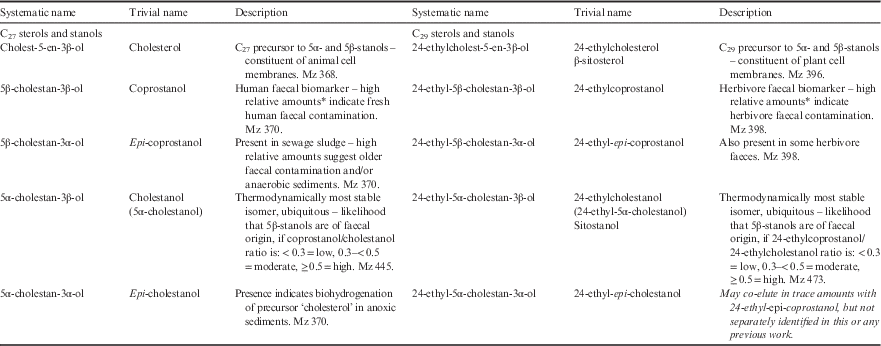
*Relative to 24-ethylcoprostanol in the case of coprostanol; relative to coprostanol in the case of 24-ethylcoprostanol. See Leeming et al. Reference Leeming, Nichols and Ashbolt1998 for respective criteria.
Δ5-sterol designates the location of the double bond in sterol ring structure. Microbes hydrogenate this double bond to either 5β(H) or 5α(H); the resulting sterol is then termed a stanol. Therefore, both coprostanol and 24-ethylcoprostanol have a 5β(H)–3β(OH) configuration. (OH)=hydroxyl group.
Due to the predominance of each biomarker in its respective source and similar degradation rates (Leeming Reference Leeming1996), such sterol ratios retain sufficient accuracy over time for use in environmental source tracking and attribution. However, in the Antarctic, marine mammals may excrete sufficient coprostanol to confound the utility of this approach for sewage source tracking (Venkatesan & Santiago Reference Venkatesan and Santiago1989). We hypothesized that the coprostanol-homologue, plant-derived C29 sterols (similar in structure and isomerization to the C27 sterols, but containing an additional ethyl group) may overcome these limitations in the Antarctic context, as humans are the only mammals with a partially herbivorous diet present contributing substantial faecal inputs and associated sterols.
Several studies have used coprostanol to define sewage distribution from Antarctic stations, including McMurdo (US), Davis (Australia), Rothera (UK) and Comandante Ferraz (Brazil) (Venkatesan & Mersadeghi Reference Venkatesan and Mirsadeghi1992, Green & Nichols Reference Green and Nichols1995, Hughes & Thompson Reference Hughes and Thompson2004, Martins et al. Reference Martins, Montone, Gamba and Pellizari2005, Montone et al. Reference Montone, Martins, Bícego, Taniguchi, da Silva, Campos and Weber2010). All these studies acknowledged the potential confounding aspect of marine mammal coprostanol inputs, but none distinguished between human and indigenous animal faecal profiles. The original research by Venkatesan & Santiago (Reference Venkatesan and Santiago1989) and Venkatesan et al. (Reference Venkatesan, Ruth and Kapaln1986) on faecal sterol profiles of marine mammals was based on captive animals from San Diego Marine World (seals and penguins) and faeces from whales and dolphins living around, or transiting through, the San Diego area. Green & Nichols (Reference Green and Nichols1995) examined elephant seal and Adélie penguin faeces in the Vestfold Hills (site of Davis Station), but did not report coprostanol in the faeces of either animal or examine any other species. As a result, these studies presumed differences between the suite of C27 sterols and stanols, such as coprostanol and cholesterol (see Table I for sterol/stanol nomenclature), were sufficient to distinguish human from animal faecal contamination.
An additional confounding factor when assessing the likelihood of human-derived faecal contamination of sediments is potential in situ production of stanols in anoxic sediments (Nishimura Reference Nishimura1982). The naturally occurring C27 stanol in pristine environments is 5α-cholestanol (5α(H)-cholestan-3β-ol), as this isomer appears the most thermodynamically stable (Nishimura Reference Nishimura1982). Toste (Reference Toste1976) demonstrated that sediment anaerobes could produce 5β-stanols, but Nishimura (Reference Nishimura1982) showed that a combination of available, labile organic matter and a drop in redox potential at, and just below, the sediment surface created favourable conditions for their production. Such conditions occur in sediments near Davis Station and probably in many other parts of Antarctica; high levels of primary productivity and depositional environments lead to anoxic sediments. This raises the potential for a third, sediment-derived stanol source.
To address the issue of faecal sterol source attribution, faeces from marine animals common around Davis Station was examined for the C27 stanol (coprostanol) and the level sufficient to confound the ability to distinguish human-derived sewage from indigenous animal faecal contamination was established. Given evidence from other studies indicating issues with faecal sterol source attribution (e.g. Martins et al. Reference Martins, Venkatesan and Montone2002), the marine animal faeces were also examined for the C29 herbivore faecal biomarker, 24-ethylcoprostanol. The issue of in situ production of stanols in sediments was also examined and their sterol profiles at a range of uncontaminated sites are described. To determine which biomarker suite would be more suitable for tracing human-derived faecal contamination in Antarctica, C27 and C29 stanol ratio assessments of sediment samples were then compared separately. Although we have a reasonable picture of the stanol profiles for each of the potential sources noted above, once the profiles are mixed, the assessment of contaminated versus uncontaminated sites becomes more difficult, particularly for locations at the edge of the sewage plume. Therefore, a practical likelihood assessment matrix has been constructed based on stanol ratios, compatible with commonly evaluated parameters, such as indicator microorganisms and/or proximity to outfalls, and risk assessment (ISO/IEC 2004a, 2004b), in order to objectively assess whether sites are possibly affected by sewage. This study was part of a larger project examining the impacts of the wastewater outfall at Davis Station (Stark et al. Reference Stark, Riddle, Snape, King, Smith, Power, Johnstone, Stark, Hince, Leeming, Palmer, Wise, Mondon and Corbett2011).
Methods
The sewage effluent examined in this study came from Davis Station (Australia) situated on the coast of the ice-free Vestfold Hills (68.5746°S, 77.9671°E). The effluent at time of sampling consisted of macerated, untreated sewage, which was being discharged into the intertidal zone near the station. Samples of c. 100 ml of effluent were collected in acid-washed amber glass bottles from the end of the outfall line and stored at 1–5°C in the dark. Effluent sub-samples were filtered through 45 mm Whatman GFF (nominal pore size 0.7 µm; heated at 450°C overnight prior to use) and kept frozen until extraction.
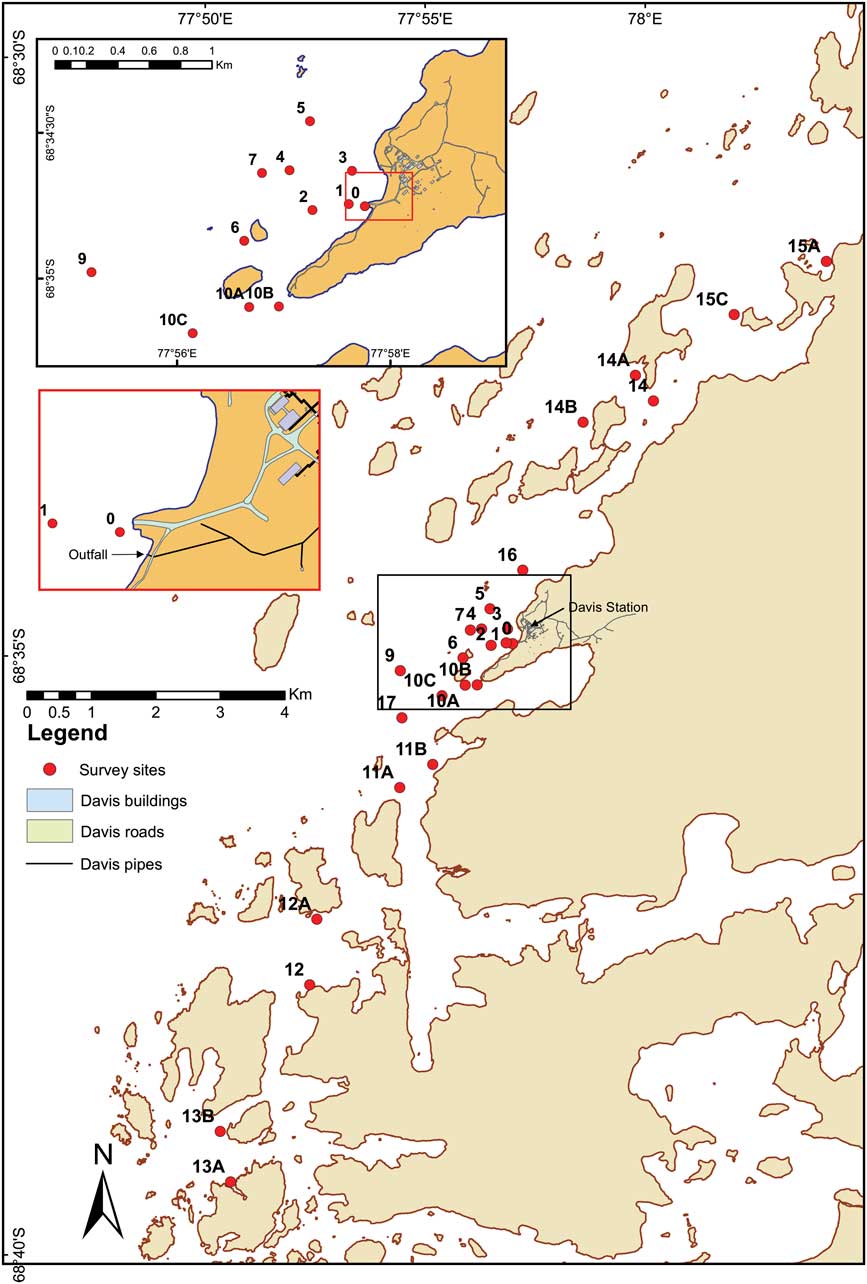
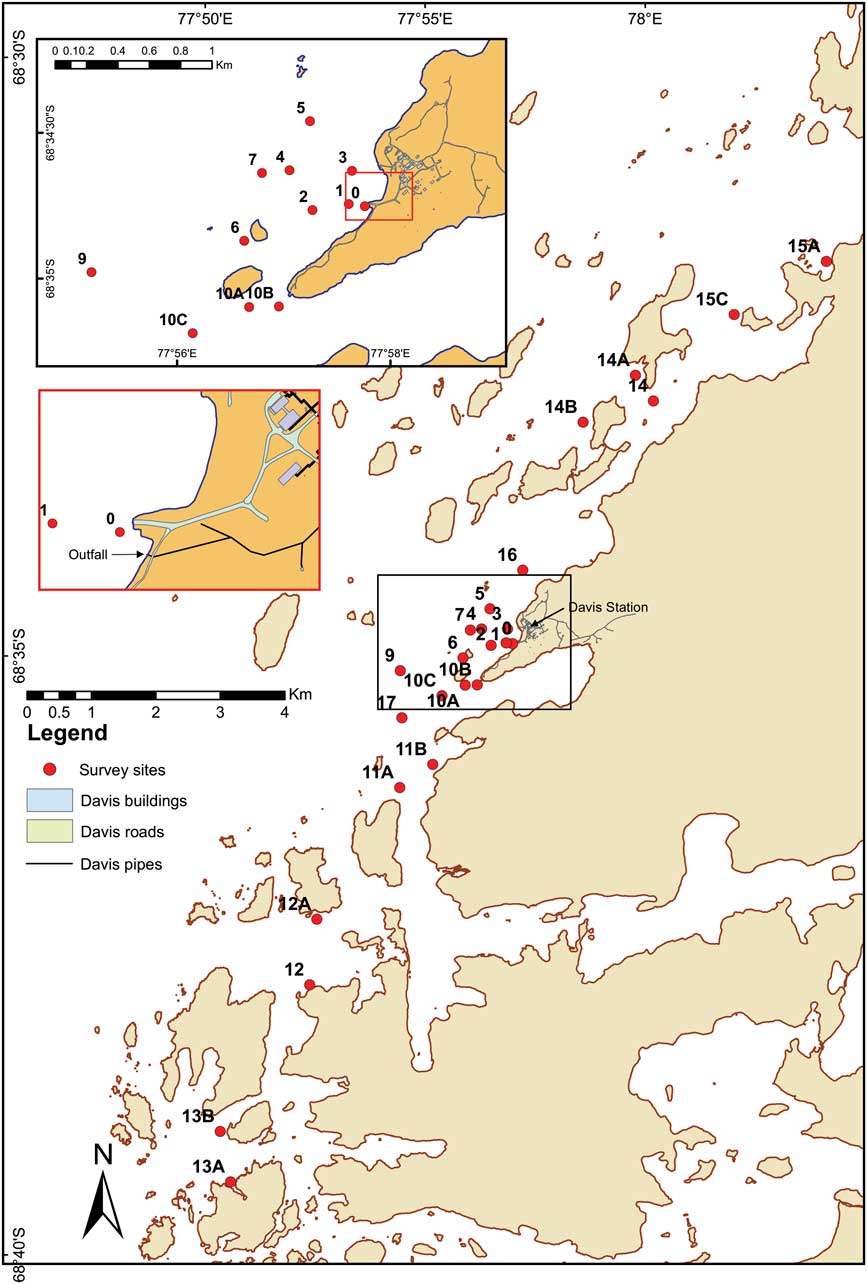
Sediment cores were collected by divers from 25 sites around the Vestfold Hills using acrylic core sleeves and caps, at increasing distances from the sewage outfall (Fig. 1). Cores were subsequently stored frozen at -18°C. Core sub-sampling was undertaken while cores were still frozen. For grain size analysis, the outer 5 mm edge of the core was removed with a scalpel blade, placed in a clean, dry preweighed beaker, weighed, dried at 45°C, reweighed, 2 mm sieved and any residual sediment in the beaker weighed. The <2 and >2 mm fractions were separately collected and weighed. A 5 g sample of the <2 mm fraction was used for grain size analysis, using a Malvern Mastersizer optical bench with Hydro 2000 g accessory, and particle refractive index of 1.544 (quartz) and 1.333 (water). Total organic carbon (TOC) analysis was carried out using a 2 g homogenized wet sediment sub-sample weighed into a pre-combusted crucible, dried at 105°C and reweighed before determination of total carbon by loss on ignition (LOI) at 550°C for 4 hours. For sterols analysis, the top 1 cm was sliced from each core, and a c. 3 g sediment sub-sample collected from the centre of the slice and placed in a precleaned, preweighed glass vial.
Map of sediment collection sites around Davis Station.
Weddell, elephant and leopard seal, as well as Adélie penguin faeces were aseptically collected into sterile 50 ml polycarbonate centrifuge tubes and kept refrigerated at 1–5°C. An additional leopard seal sample was also obtained from Taronga Zoo, Sydney for verification of that species’ sterol profile. All samples were kept frozen until extraction. Originally, sub-samples of animal faeces were composited and then analysed. Subsequently, some individual Weddell seal faecal samples were analysed to investigate their contribution(s) to differences between composites. The TOC was estimated by LOI by heating dried sub-samples to 450°C overnight and reweighing samples.
All samples were extracted using a modified Bligh & Dyer solvent mixture (Bligh & Dyer Reference Bligh and Dyer1959) utilizing dichloromethane (DCM). For each sample, 25 ml DCM/methanol/Milli-Q™ H2O (1:2:0.8 by volume) was added, shaken vigorously and left to extract for a minimum of 12 hours. Total lipid extracts were recovered by breaking phase using 10 ml DCM/NaCl-saturated Milli-Q™ H2O (1:1 by volume). Samples were shaken vigorously then centrifuged at 1000 rpm for 5 minutes. The solvent phase was pipetted from below the water layer into a round-bottom flask. The samples were then re-extracted with another 5 ml DCM, and added to the corresponding round-bottom flask. Solvent from extracts was evaporated under reduced pressure using a rotary evaporator and waterbath at 35°C. A small amount of methanol (2 ml) was added to help azitrope residual water. Total extracts were concentrated to near-dryness (<0.5 ml), and transferred to a glass screw cap 10 ml centrifuge tube using 3×1.5 ml DCM. Total extracts were reduced to near-dryness under N2 at 50°C.
Saponification was carried out using c. 2 ml 5% potassium hydroxide (KOH) in methanol/Milli-Q™ H2O (4:1 by volume), added to the total extracts from sediments. Then 6 ml 5% KOH in methanol/H2O (4:1 by volume) was added to the total extracts from effluent and faecal samples. Tubes containing extracts were flushed with N2 gas and heated to 80°C for 2 hours. After cooling, 3 ml Milli-Q™ H2O and 2 ml hexane:DCM (4:1 by volume) were added, extracts mixed using a vortex mixer and centrifuged at 2000 rpm for 2 min. The top solvent layer was transferred to borosilicate glass, gas chromatography (GC) vials. This extraction of the saponified neutral extracts (TSN) was repeated twice more for each sample. The combined TSN extracts were dried under N2 and derivatized using 100 µl bis(trimethylsilyl)trifluoroacteamide (BSTFA) containing 1% trimethylchlorosilane (TMCS; Alltech, KY, US). Mixtures were heated to 60°C for 60 minutes, BSTFA subsequently evaporated under N2 and TSN extracts prepared for GC analysis in DCM.
Gas chromatography with flame ionization detection (GC-FID) was initially performed using a Varian 3800 controlled by Galaxie chromatography software (Agilent Technologies, CA, US) to establish the optimal concentrations to run samples. Faecal sterols were verified and quantified by gas chromatography with mass spectral detection (GC-MS) using a ThermoQuest Trace DSQ™ bench top MS fitted with direct capillary inlet. Both GC-FID and GC-MS were equipped with 50 m x 0.32 mm inner diameter cross-linked 5% phenyl-methyl silicone (HP5) fused-silica capillary columns with He carrier gas set at 1.6 ml min-1 constant flow. Oven conditions for GC were: initial temperature 45°C, hold 1 minute, 25°C min-1 to 180°C, 2.5°C min-1 to 295°C, 8°C min-1 to 310°C, hold 10 minutes. Samples and standards were applied to the columns using 0.5 µl injections. Samples were run in scan mode to verify compound identity and multiple times (where required to ensure linearity) in selective ion monitoring (SIM) mode for quantification. The algal sterols (see Table II from phytol down) were quantified by GC-FID and are shown for reference and additional context. The mass ions (mz) scanned for faecal sterols were chosen on the basis of abundance and distinctiveness. For example, the most abundant mass fragment for 5α-cholestanol is mz 215. However, many other stanols also have this fragment. Therefore, the M-15 mass fragment, mz 445, was used for 5α-cholestanol instead as it is sufficiently abundant for quantification but more diagnostic than mz 215. The mass ion fragments used in SIM quantification are given in Table I. Xcalibur software was used for processing. Sterols were quantified using a synthetic sterol 5β(H)-cholan-24-ol (Chiron AS, Norway) as the internal standard which was added prior to extraction. Five point sets of calibration standards ranging from 4 ng µl-1 to 60 ng µl-1 were used to calculate individual response factors to the internal standard which were within the linear range for the instrument set up. R 2 values for the calibration regressions were all >0.85 and accuracy of measured standards versus predicted values were always closer than a 10% difference. Limits of detection for each matrix type are given in the footnote for Table II. Standards were obtained from Sigma and Chiron AS, Norway, except for epi-cholestanol (5β(H)-cholestan-3β-ol) and 24-ethyl-epi-coprostanol (24-ethyl-5β(H)-cholestan-3β-ol). Responses to the internal standard for these two compounds were calculated from cleaned-up laboratory standards of anaerobic sediment and cow manure, respectively, that had been quantified by GC-FID using the same response factors as their closest homologues, epi-coprostanol and coprostanol, respectively. While not covering all the compounds herein, an assessment of the method recoveries for the main C27 sterols can be found in Borjesson et al. (Reference Borjesson, Sundin, Leeming and Torstensson1998).
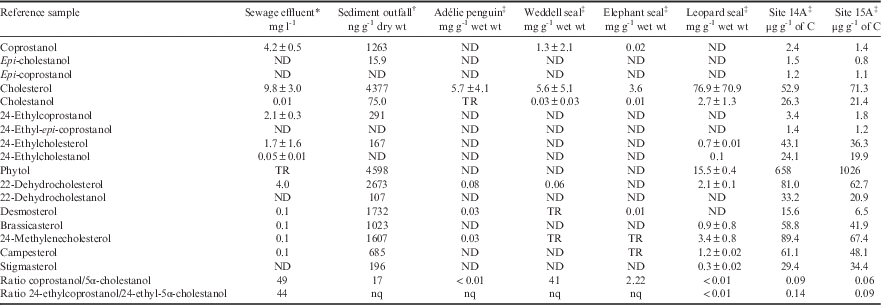
Ratios and concentrations (±standard deviation where possible) of faecal and other biomarkers in faecal and effluent reference samples from Davis Station and surroundings.
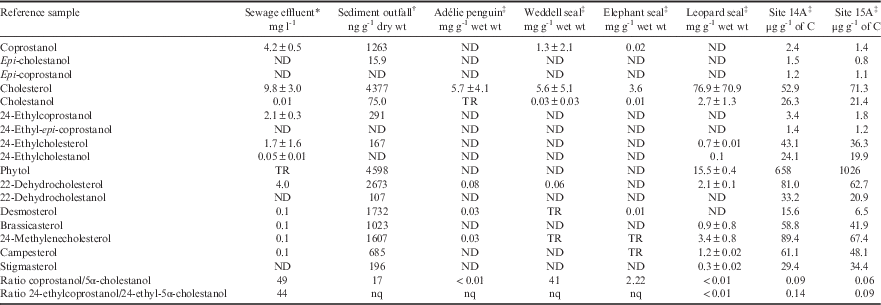
*Detection limit=0.001, †detection limit=5, ‡detection limit=0.02.
%Total organic carbon: Site 14A=9.3%, Site 15A=10%.
C=carbon, ND=not detected, nq=not quantifiable, TR=trace amounts, wt=weight.
The term ‘5β-/5α-stanol ratio’ refers equally to the ratios of coprostanol/5α-cholestanol and 24-ethylcoprostanol/24-ethylcholestanol unless a C27 or C29 prefix is given in which case it refers specifically to the former or latter ratio. Coprostanol is the C27 homologue of the C29 stanol 24-ethylcoprostanol just as cholesterol and 24-ethylcholesterol and epi-coprostanol and 24-ethyl-epi-coprostanol are also respective homologue pairs. Epi-isomers have a hydroxyl (OH) group in the α-configuration rather than β-configuration at carbon position 3. Unless epi is stated, the stanol referred to is the non-epimerized 3β-OH stanol. When epi-isomers are compared to 5β-stanols, the relationship is always within the C27 or C29 group, respectively. Cholesterol is the precursor to the suite of C27 stanols just as 24-ethylcholesterol is the precursor to the C29 stanols.
Results
The sterol profile of sewage effluent was generally typical of human waste as described in many other studies; i.e. a high ratio of both C27 and C29 5β-/5α-stanols (ratio >40) resulting from preferential microbial utilization of Δ5-sterols to 5β(H)-stanols (Δ denotes double bond, 5 denotes carbon position, see Table I). The concentration of coprostanol was greater than 24-ethylcoprostanol by a ratio of ≥2:1, and epi-isomers were below the minimum detection limit (MDL) (Table II; see Leeming Reference Leeming1996, Leeming et al. Reference Leeming, Latham, Rayner and Nichols1997). Of particular note, the precursor cholesterol was in greater concentration than coprostanol in both the effluent and sediment collected at the outfall pipe. Whereas for the corresponding C29 pair, 24-ethylcholesterol and 24-ethylcoprostanol, the latter was more abundant though not significantly (Table II).
The faecal biomarker profiles of the three species of seal and the penguin showed high levels of cholesterol (relative to other sterols) in their faeces (Table II). Weddell and elephant seal faeces also contained coprostanol. Epi-isomers were below the MDL in all cases.
Elephant seals (n=5 from one composite sample), which congregate adjacent to the sewage outfall, had high cholesterol levels (relative to other sterols), with C29 sterols below the MDL.
Three composite samples (n=3 each composite) of faeces from nine individual Weddell seals were initially analysed to determine whether coprostanol was present. Two of the Weddell seal composite samples were similar to the elephant seal samples; very high cholesterol (>8 mg g-1 wet weight), no detectable C29 sterols or stanols, but small amounts of both C27 5β- and 5α-stanols. However, one Weddell seal composite had a very high coprostanol concentration, with C27 sterol and stanol ratios more similar to human effluent. This prompted individual analysis of the remaining available Weddell seal faeces (n=4), which found that these individuals had concentrations of coprostanol and C27 5β-/5α-stanols ratios similar to human effluent. Therefore, the values shown in Table II are an average from seven samples comprising 13 animal stools. The high degree of variability in the presence of coprostanol is reflected in the standard deviation. A trace amount of the C29 stanol, 24-ethylcoprostanol, was detected in one of the Weddell seal composite samples.
Leopard seal faeces (n=2) contained primarily cholesterol and below the MDL for coprostanol, indicating their gut microflora were not capable of converting Δ5-sterols to stanols. Adélie penguin faeces (two composite samples of n=6 and n=5) also had very high cholesterol concentrations (>2.8 mg g-1 wet weight), trace amounts of 5α-cholestanol, and no detectable coprostanol. No C29 sterols or stanols were detected in samples from either of these species (Table II).
The TOC was correlated with sediment fine grain sizes, particularly in silts (15–63 μm, R>0.9, P<0.05). Of the 25 sites shown in Fig. 1, 11 were located within 1 km of the sewage outfall. Of these, sites 7 and 9 had %TOC values of 5.8% and 8.7%, respectively, with all other sites in this proximate group <2.2%TOC and with coarser grain sediments. At more distal sites, six sites had TOC<1.5%, and eight sites were more depositional in nature, with TOC values up to 13%. Overall, there were two distinct sediment types for comparing sterol profiles: i) coarse-low TOC and ii) fine-high TOC.
Examples of the low TOC sediment type were sites 13B and 14B. Both sites had low concentrations of the precursor sterols, cholesterol and 24-ethylcholesterol, and ratios of C27 and C29 5β-/5α-stanols <0.3. The amount of epi-isomers relative to 5β-stanols in these samples were variable due to their low abundance. Sites 14A and 15A were typical of sterol profiles measured in the high TOC sediment type, with C27 and C29 5β-/5α-stanol ratios <0.2 and epi-isomer/5β-stanol ratios >0.4. There was a broadly positive relationship between increasing distance from the outfall and increasing ratio of epi-isomers to respective non-epi counterparts (Figs 2b & 3b), as well as a positive correlation between grain sizes <250 μm and the ratio of C29 24-ethyl-epi-coprostanol/24-ethylcoprostanol (R=0.64). Sites 12 (low %TOC) and 13A (high %TOC) were unusual as both sites had substantially elevated concentrations of the C29 24-ethylcoprostanol but exhibited characteristics indicating sterols were not of faecal origin. For example, both sites had high concentrations of the precursor 24-ethylcholesterol. For both sites, C27 and C29 5β-/5α-stanol ratios were <0.3. However, site 13A had a low C29 epi-isomer/5β-stanol ratio, unlike site 12.
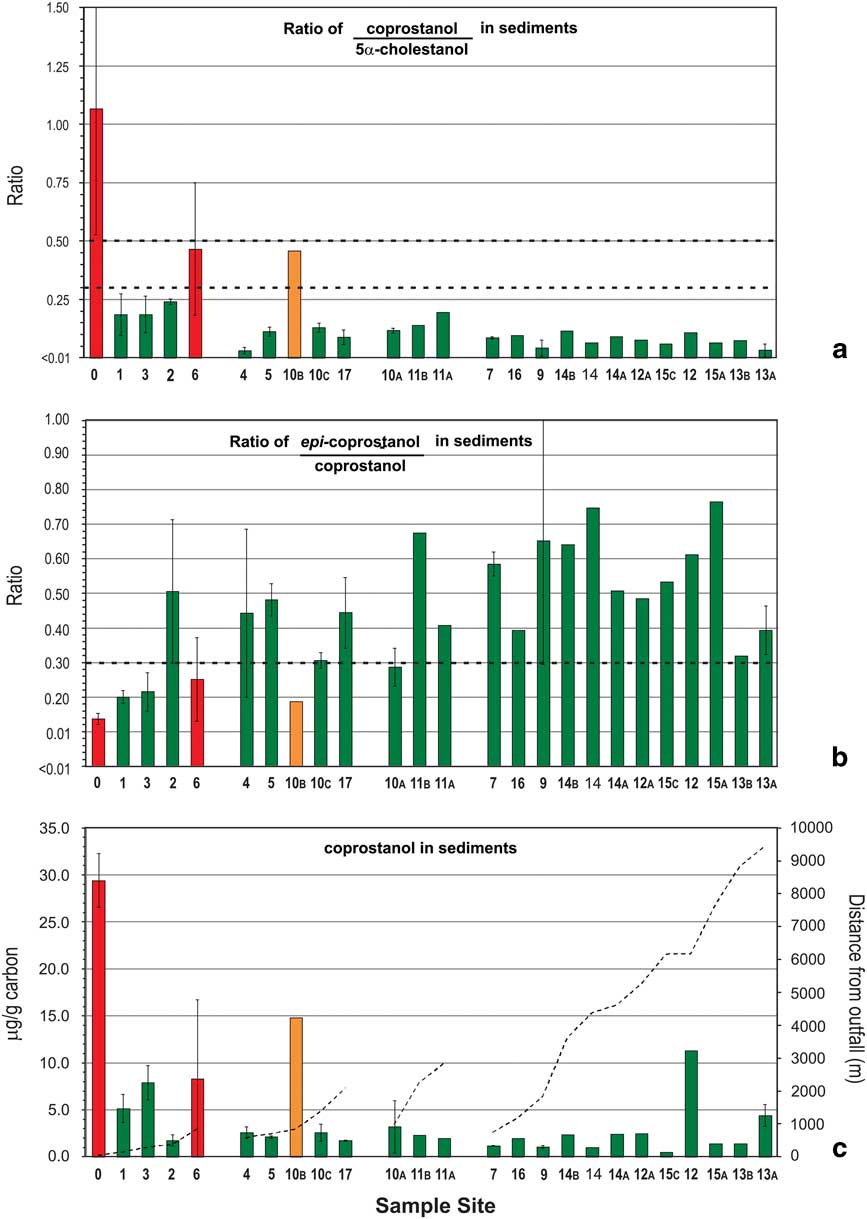
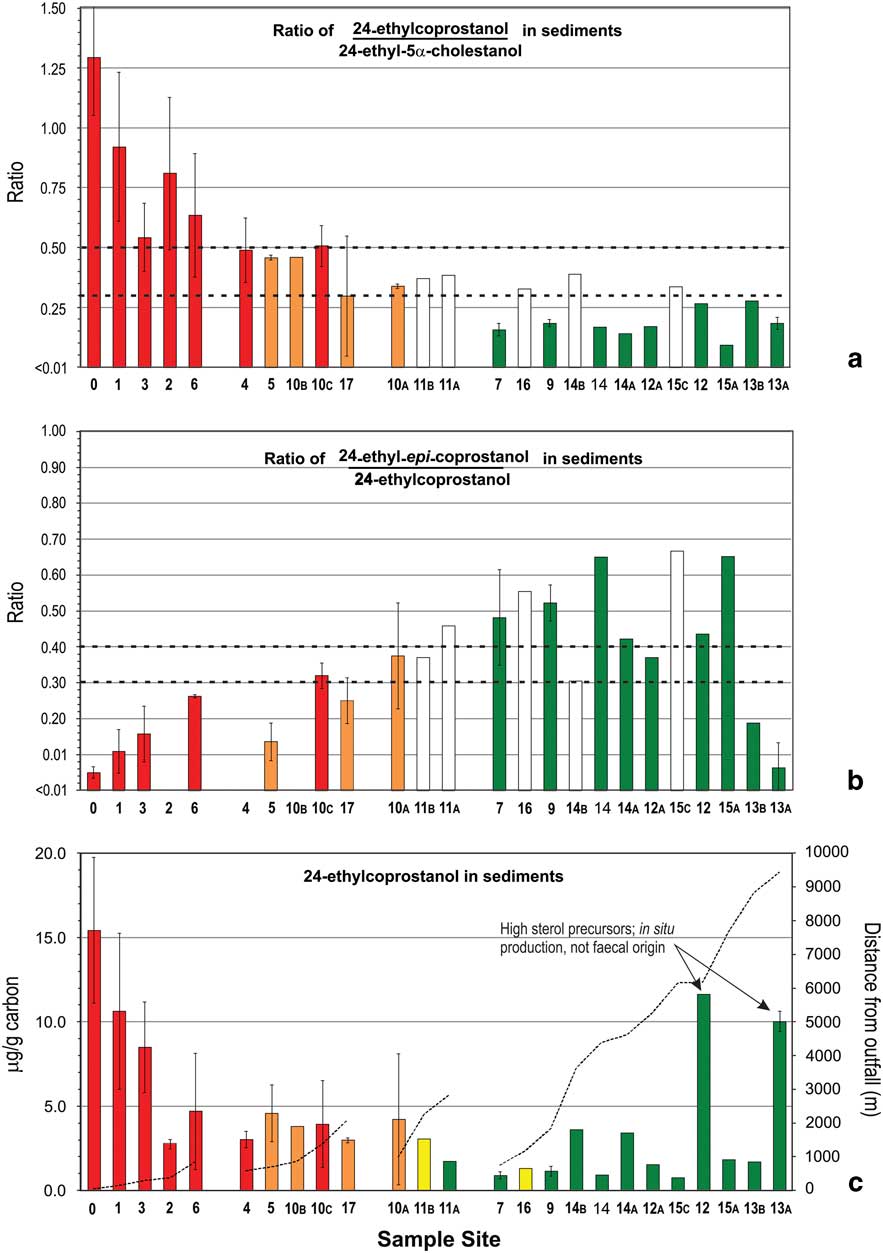
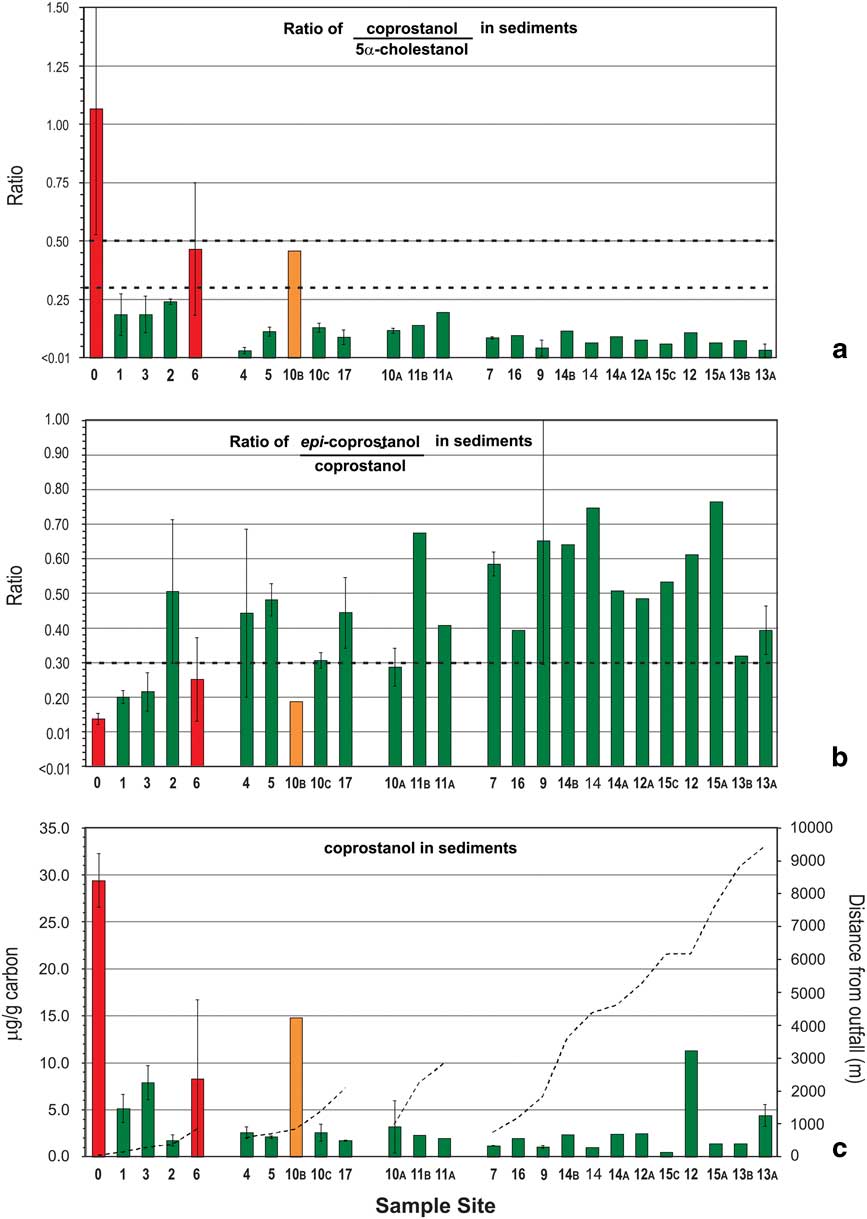
a. & b. Ratios of C27 stanols and c. levels of coprostanol in nearshore marine sediments of the Vestfold Hills with increasing distance from Davis Station. Sites are stratified by distance (primary strata) and likelihood of human faecal contamination (HFC) from C27-sterol data (secondary strata). See Fig. 1 for sample site locations. Bar shading indicates level of likelihood of HFC: green=negligible, yellow=low, orange=moderate, red=high. Overall likelihood (C) was determined using the assessment criteria described in Fig. 4 using data from a. and b. Dashed lines in a. and b. indicate respective ratio-likelihood criteria, while in c. indicate distance from outfall. Error bars are standard deviation (n=2).
a. & b. Ratios of C29 stanols and c. levels of 24-ethylcoprostanol in nearshore marine sediments of the Vestfold Hills with increasing distance from Davis Station. Sites are stratified by distance (primary strata) and likelihood of human faecal contamination (HFC) from C29-sterol data (secondary strata). See Fig. 1 for sample site locations. Bar shading indicates level of likelihood of HFC: blank=level 2 assessment required, green=negligible, yellow=low, orange=moderate, red=high. Overall likelihood c. was determined using the progressive assessment criteria described in Fig. 4 using data from a. and b. Dashed lines in a. and b. indicate respective ratio-likelihood criteria, while in c. indicate distance from outfall. Error bars indicate standard deviation (n=2).
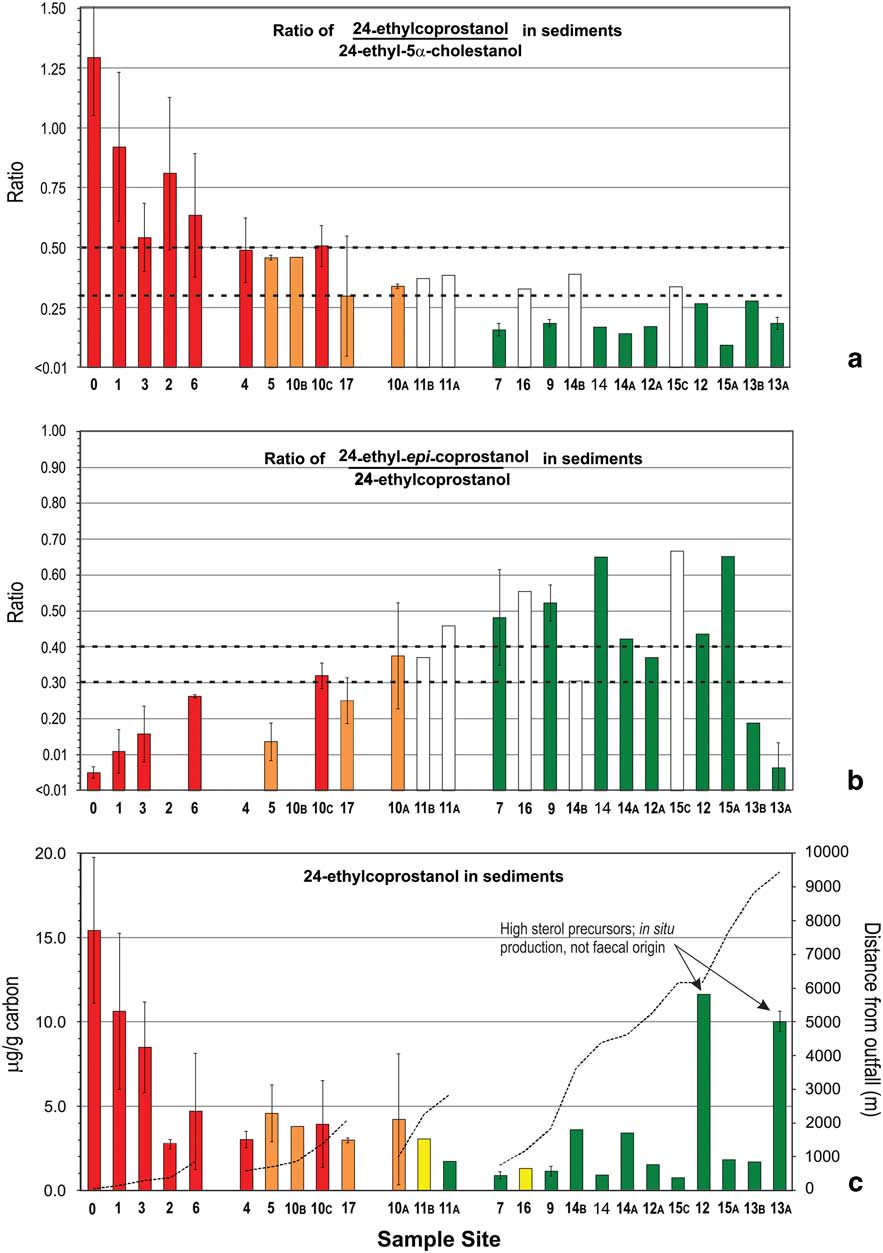
Levels of the C27 human faecal biomarker coprostanol were highest in sediments within 1 km of the outfall, at 5–29 μg g-1 of carbon (Fig. 2c), except for site 2. Intertidal sand directly below the outfall contained 1.26 μg g-1 dry weight coprostanol, and station wastewater contained 4.2 mg l-1 (Table II). Coprostanol concentrations >1 km from the outfall were generally below 3 μg g-1 of carbon, except sites 10B, 12 and 13A (Fig. 2c). The C27 5β-/5α-stanol ratio was >0.5 only at the outfall and >0.3 at sites 6 and 10B. All other sites had C27 5β-/5α-stanol ratios of <0.3 with a decreasing trend with distance from the outfall barely apparent (Fig. 2a). In contrast, concentrations of the C29 stanol 24-ethyl-coprostanol, and C29 5β-/5α-stanol ratios, showed a more consistent decreasing trend with distance from the outfall than their respective C27 homologues (cf. Figs 3 & 2, respectively). At five of the 11 sites, C29 5β-/5α-stanol ratios were >0.5 and within 1 km of the outfall, and a further four were >0.45.
Discussion
There are three potential sources of C27 5β-stanols (coprostanol) in Antarctica: humans, marine animals and in situ biohydrogenation of sterols in anoxic sediments. The faeces of elephant, Weddell and leopard seal, as well as Adélie penguins, are also a source of 5α-cholestanol, as they contain large amounts of cholesterol relative to other sterols, which is converted to 5α-cholestanol in aerobic conditions. Hence, if sediments contained coprostanol from indigenous marine animals, it could lead to a false positive assessment of human faecal contamination (HFC). Marine animal addition of 5α-cholestanol could alternatively skew the C27 5β-/5α-stanol ratio the other way to potentially return a false negative result. Cholesterol-rich food waste (primarily from inclusion of meat and cooking oil) is included in the station wastewater stream, as evidenced by greater quantities of cholesterol than coprostanol in effluent (Table II), and its conversion to cholestanol also potentially skews the C27 5β-/5α-stanol ratio to give a false negative result. In summary, multiple sources produce one or both of the principal C27 stanol biomarkers used in previous studies for faecal contamination assessment. However, there are only two sources of C29 5β-stanols, as none of the marine animal faeces samples from the Davis Station area contained 24-ethylcoprostanol (Table II). Therefore, the primary C27 5β-/5α-stanol-based ratio assessment for faecal contamination in Antarctica should instead be based on the C29 suite of sterols due to fewer confounding sources.
This leaves in situ production of 5β- and 5α-stanols as a potential confounding input to accurate site assessment. The best indicator of in situ anaerobic hydrogenation of sterols are higher ratios of epi-stanol isomers to their respective 5β-stanol counterparts (Table I), which in this case were the C29 homologues. This is supported by the correlation between TOC or fine grain sizes (i.e. favouring anoxic conditions) and increased C29 epi-isomer/5β-stanol ratios (24-ethyl-epi-coprostanol/24-ethylcoprostanol) observed in this study. The C27 epi-isomer/5β-stanol (epi-coprostanol/coprostanol) ratio showed a similar but more variable trend (Fig. 2b), this variation could be attributable to the dominance of the C27 epi-isomer (epi-coprostanol) in whale faeces (Venkatesan & Santiago Reference Venkatesan and Santiago1989). Therefore, the C27 epi-isomer/5β-stanol ratio may not be a reliable indicator of in situ stanols production in comparison to the C29 homologue.
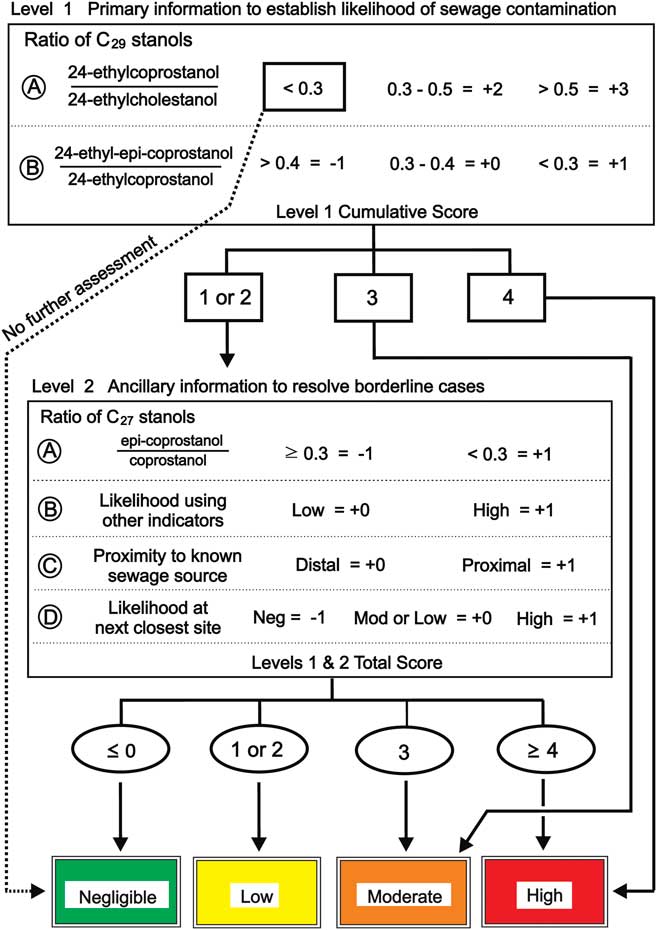
To clarify use of the various stanol ratios, Leeming et al. (Reference Leeming, Nichols and Ashbolt1998) produced a flow chart to distinguish human from herbivore faecal contamination in temperate water and sediment samples. In the present study, this approach was combined with a weighted risk assessment model and developed a polyphasic likelihood assessment matrix that was then applied to the sediment samples (Fig. 4). The assessment matrix initially used two principal criteria that needed to be assessed together to establish faecal contamination likelihood. The precautionary principle used in risk assessment is applied here, thus if a sample value has a mean and standard variation, then the value which would lead to a higher likelihood is used. The first criteria assessed the potential likelihood for HFC (level 1A, Fig. 4) and the second assessed the likelihood of in situ stanol production as a confounding factor (level 1B, Fig. 4). These two criteria comprise the initial level 1 assessment, which alone resolved contamination likelihood of the majority of the near-source and remote sites without requiring further assessment. Sites proximal to the outfall are more likely to have large quantities of human faecal-derived 5β-stanols than distal sites, producing level 1A results >0.5 and level 1B results <0.3, with a resultant cumulative score of ‘+4’ and ‘high’ likelihood. The low likelihood of in situ stanol production at these sites (low epi-isomer ratio) is insufficient to change their assessment as high likelihood of contamination. Further assessment of sites with 5β-/5α-stanol ratios <0.3 at level 1A is unnecessary as the primary criteria for HFC has not been reached (Fig. 3a).
Sewage contamination likelihood criteria and assessment matrix used to assess samples from Davis Station. Level 1A: likelihood of human sewage contamination. Level 1B: likelihood of in situ C29 stanols production. Level 2A: likelihood of in situ C27 stanols production. Level 2B: subjective likelihood based on other faecal indicators; e.g. faecal enterococci, etc. Level 2C: proximal is ≈<1 km from known sewage/faecal source, distal >1 km. Level 2D: based on likelihood value of the next-closest site.
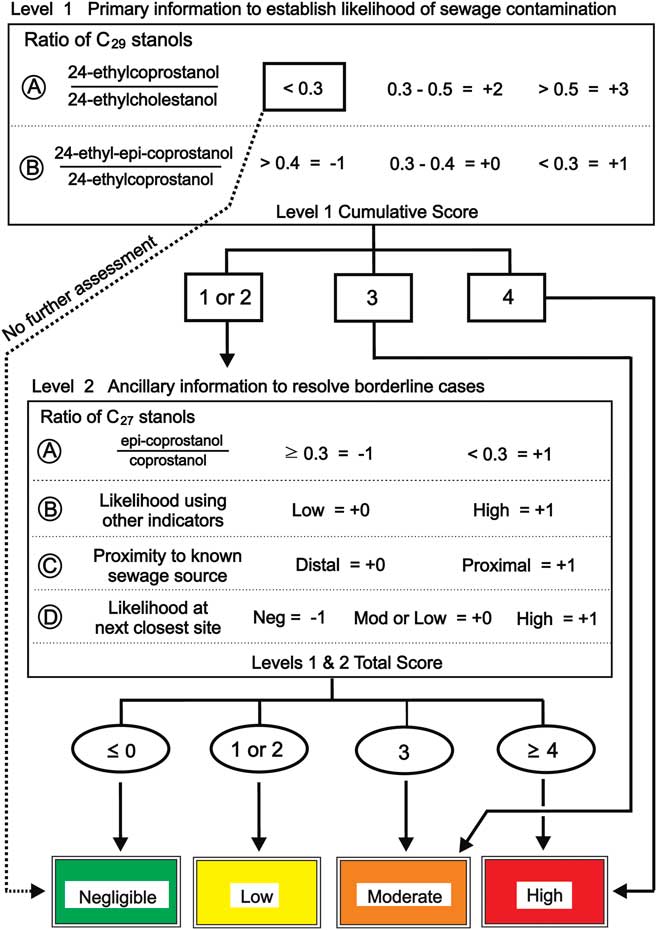
A moderate risk of HFC (level 1 cumulative score of +3) can be obtained in two ways. Firstly, by a high likelihood of HFC, with 5β/5α-ratio >0.5 (level 1A+3), combined with a moderate likelihood of in situ 5β-stanol production, with an intermediate epi-isomer ratio (level 1B+0) (Fig. 4). Secondly, a moderate likelihood of HFC (level 1A+2) combined with a low likelihood of in situ stanol production (level 1B+1).
Indeterminate assessments that produce a level 1 cumulative score of +1 or +2 constitute borderline cases where the combination of level 1A and 1B ratios mean that sources are difficult to attribute without additional information. Level 2 assessments can use ancillary information such as: the epi-isomer ratio of the alternative C27 homologues, presence of human faecal indicator microorganisms if available (E. coli, faecal enterococci, F+ RNA coliphage, etc) in substantial numbers, the proximity of the site to a sewage outfall, or the status of the site next-closest to the sewage/faecal source (Fig. 4). Escherichia coli and enterococci were detected at ≤22 CFU 100 ml-1 and ≤10 CFU g-1 dry weight in nearshore Vestfold Hills water and sediment samples, respectively, collected near penguin colonies and Weddell seal sea ice, tide-crack haulouts, >3.6 km from the wastewater outfall (data not shown). These faecal indicator organisms are known to occur in Weddell seal and Adélie penguin faeces, and have been detected in marine waters and sediments near similar groupings of Antarctic indigenous animals at similar concentrations; including ≤5 PFU F+RNA coliphage g-1 dry weight sediment (Smith & Riddle Reference Smith and Riddle2009). However, higher concentrations of these faecal indicator organisms may occur immediately proximal to penguin rookeries and/or seal wallows/haulouts (Smith & Riddle Reference Smith and Riddle2009). Given the overall combined sampling and measurement uncertainty of these microbiological measurands, and their proposed use in the present context as an ancillary factor for determination of HFC risk in conjunction with sterol-derived data and other ancillary factors, values of ≥25 CFU indicator bacteria or ≥1 PFU F+RNA coliphage 100 ml-1 in overlying water column, or ≥10 CFU indicator bacteria or ≥1 PFU F+RNA coliphage g-1 dry weight in sediment are recommended as substantially indicative of HFC. Enterococci are recommended over thermotolerant coliforms or E. coli as faecal indicator microorganisms for marine environments (Smith et al. Reference Smith, Howington and McFeters1994, WHO 2003). Despite C27 stanol ratios being a less reliable indicator of HFC in Antarctica, the C27 stanol ratio is included in the level 2 ancillary assessment because: i) their measurement should be performed as part of a comprehensive sterol analysis, ii) the C27 stanol ratio(s) shed additional light on the degree of anoxia in the sediments and the overall environmental inputs which may include native fauna, and iii) they form only a part of the level 2 assessment and their weighting is much less than their C29 counterparts.
In order to demonstrate the improvement this proposed scheme offers, this likelihood matrix was separately applied to all of the sediment samples using C27 stanols as the primary criteria and C29 stanols as supporting information; i.e. returning the paradigm to the established methodology. This C27 sterol-focussed assessment (Fig. 2c) closely mirrors previous assessments in temperate systems (Leeming et al. Reference Leeming, Nichols and Ashbolt1998) which were solely based on the C27 stanol ratios in Fig. 2a & b. The results of this C27 assessment did not require any level 2 assessments. In contrast, the C29-based, colour-coded final site assessments (Fig. 3c) are primarily based on the C29 stanol ratios from Fig. 3a & b with level 2 assessments from Fig. 2a & b where required.
Using C29-based ratios, sediment from sites 0–4 and 6 (<1 km from outfall) were classified as a high likelihood of contamination with human faeces, and as in situ stanol production at these sites was negligible (the bars for these sites have been coloured red in all three plots in Fig. 3). Site 10C was also classified as a high likelihood of contamination because level 1A scored a value of +3 and level 1B scored +1 as the error bar was below the 0.3 criteria. The HFC likelihood assessment using C27 stanols (Fig. 2a) indicated only site 0 (40 m from outfall) and site 6 as high likelihood (Fig. 2c). This illustrates the loss of HFC assessment sensitivity at contaminated sites using C27 rather than C29 stanol ratios, due to the presence of marine animal faeces and cholesterol from the station wastewater. Sediments with negligible level 1A HFC likelihood scores do not require further assessment (coloured green in Figs 2 & 3). C29-based HFC assessment classified nine sites as negligible likelihood (Fig. 3) and five sites as requiring further (level 2) assessment. In contrast, using C27 sterols at level 1A, 22 of the 25 sites were assessed as negligible likelihood, including some of the closest sites to the Davis outfall (Fig. 2), with no sites indicated as requiring further level 2 assessment. These substantially different outcomes demonstrate that the use of C27 stanols for level 1A assessment results in a much higher probability of false negative likelihoods.
Of the five sites that required level 2 assessments, remote sites 14B and 15C were assessed as negligible likelihood. Site 11A, at the southern extremity of sites in a direct line down-current of the sewage outfall, also resulted in negligible HFC likelihood. Its up-current neighbour, site 11B, was assessed as low likelihood whereas the next site up-plume, site 17, was assessed as moderate likelihood. Site 16, 1.18 km to the north of the outfall was assessed as a low likelihood of contamination. These outcomes fit with data regarding prevailing current direction, sewage plume dispersion and directionality, as well as other data such as heavy metals (collected by other researchers as part of a broad study of sewage at Davis Station, Stark et al. Reference Stark, Riddle, Snape, King, Smith, Power, Johnstone, Stark, Hince, Leeming, Palmer, Wise, Mondon and Corbett2011 and papers in preparation), which were higher at site 10C than at many other remote sites (Stark et al. Reference Stark, Riddle, Snape, King, Smith, Power, Johnstone, Stark, Hince, Leeming, Palmer, Wise, Mondon and Corbett2011) suggesting that anthropogenic contaminants are deposited at least this far south.
Once HFC likelihood has been established, the degree of contamination can be compared by using the quantity of 5β-stanols (24-ethylcoprostanol) in sediments. The concentrations of 24-ethylcoprostanol (Fig. 3c) and coprostanol (Fig. 2c) are shown in μg of stanol per g C. Such normalization to carbon helps in comparisons of sites with different depositional environments. The trends shown in Fig. 3a (C29 5β-/5α-stanol ratio) & c (24-ethycoprostanol) are quite similar, except for sites 12 and 13A which had comparable or higher amounts of 24-ethylcoprostanol g-1 C than many of the high HFC likelihood sites. Sites 12 and 13A are both remote, with stanol ratio values indicating negligible HFC likelihood, but both had quantities of 24-ethylcholesterol (the precursor of 24-ethycoprostanol) of 100 and >2000 μg g-1 C, respectively, which led to the formation of quantities of C29 5β-, 5α- and epi-stanols comparable to the outfall sites (Fig. 3c). This further illustrates why 5β-stanol concentration data alone cannot solely be relied upon for HFC assessment.
Finally, differences in human dietary intake between individuals effect sterol ratios. However, these differences are smoothed to a population average which is what is measured at a point source such as an STP. Unless a population consumes no vegetable matter at all, C29 stanols can provide a measureable indicator of HFC. This point source should always be checked for the presence of C29 stanols and be the reference against which remote samples are assessed.
Conclusion
Weddell and elephant seal faeces were found to contain significant quantities of the human faecal biomarker coprostanol but not the corresponding C29 herbivore faecal tracer, 24-ethylcoprostanol. Therefore, we propose reversing the commonly used C27 faecal coprostanol source tracer approach by using the C29-based herbivore faecal tracer 24-ethylcoprostanol to indicate human rather than non-human faecal contamination, as humans are the only mammal with a partially herbivorous diet in Antarctica. Antarctic studies using C27 coprostanol as a human faecal tracer may produce interpretations confounded by indigenous marine mammal inputs. The application of a likelihood assessment matrix to this data was able to objectively disentangle the presence of HFC from multiple sources of sterols and stanols.
These recommended ratios offer a potentially powerful monitoring and assessment tool for use in the Antarctic (and potentially sub-Antarctic) to: i) assess dispersal and dilution of sewage from outfalls, ii) assess the possibility of sewage discharge in areas of frequent tourist ship visitation, iii) broadly indicate other potential sewage-related risks, such as introduction of non-native microorganisms, pathogens and diseases, or chemical contamination, iv) determine whether potable water sources are contaminated by human sewage, and v) determine the efficacy of waste treatment and/or wastewater discharge minimization. Together with environmental impact information, the sterol-based likelihood assessment matrix produced in this study can be used to assess overall environmental risk, compatible with standardized risk assessment and environmental management procedures.
This study was part of a larger project examining the impacts of the wastewater outfall at Davis Station. The results of this study indicate that through the use of C29 sterol ratios, human sewage contamination is detectable up to 2 km from the outfall. This is corroborated by data on other contaminants, such as metals in sediments, and also fits with prevailing hydrodynamic conditions which will be the subject of other papers.
Acknowledgements
The authors thank Damian Gore for grain size analysis. Thanks to the reviewers whose efforts have made this a better article. Thanks to Teresa O’Leary for her initial help in the lab.