

The report from the National Longitudinal Transition Study-2 in 2005 has indicated that approximately 25% of students with disabilities who received special education services during grade school have entered postsecondary education (Wagner, Newman, Cameto, Garza & Levine, Reference Wagner, Newman, Cameto, Garza and Levine2005). This percentage increased to 67% in 2011, indicating that the number of students with disabilities who received special education services during grade school pursuing postsecondary education has increased dramatically over the past years (Newman et al., Reference Newman, Wagner, Knokey, Marder, Nagle, Shaver and Schwarting2011). In addition, a large number of college students without disabilities meet the criteria for mental health disorders (Hunt & Eisenberg, Reference Hunt and Eisenberg2010; Rodgers & Tennison, Reference Rodgers and Tennison2009). In many cases, students with disabilities and mental health disorders experience increased stress, as they are faced with navigating the typical stressors of postsecondary attendance in addition to the added stressors of coping with disabilities. As a result, promoting quality participation in and successful completion of postsecondary education for these students is critical since completion of postsecondary education plays an essential role in achieving positive postgraduation employment outcomes and economic success (Engle, Reference Engle2007; O’Neill et al., Reference O’Neill, Kang, Aldrich, Pfaller, Chan, Saánchez and Muller2015).
College life is often considered stressful for students with disabilities due to high academic pressure and potential social isolation when transitioning to new college life (Archer & Cooper, Reference Archer and Cooper1998; Kadison & DiGeronimo, Reference Kadison and DiGeronimo2004; Tansey et al., Reference Tansey, Smedema, Umucu, Iwanaga, Wu, Cardoso and Strauser2018). While students with disabilities have emphasized the benefit of social support from peers in promoting positive college adjustment and academic success (Cardoso et al., Reference Cardoso, Phillips, Thompson, Ruiz, Tansey and Chan2016; Sanders & Dubois, Reference Sanders and DuBois1996; Wegner, Reference Wegner2017), developing meaningful support network in college settings is frequently challenging for students with disabilities due to negative attitudes toward disabilities among their peers without disabilities (Green, Reference Green2007; Perlick et al., Reference Perlick, Rosenheck, Clarkin, Sirey, Salahi, Struening and Link2001; Vyavaharkar et al., Reference Vyavaharkar, Moneyham, Corwin, Saunders, Annang and Tavakoli2010).
Attitudes are defined as global evaluations of an individual, an object, or an event that can be favorable or unfavorable (Chan, Livneh, Pruett, Wang & Zheng, Reference Chan, Livneh, Pruett, Wang, Zheng, Chan, Da Silva Cardoso and Chronister2009). Attitudes are generally assumed to consist of cognitive, affective, and behavioral components (Eagly, Mladinic & Otto, Reference Eagly, Mladinic and Otto1994). For example, some college students without disabilities may believe individuals with serious mental illness (SMI), including past alcohol or drug history, depression, and anxiety, are dangerous, as these groups have frequently been associated with harming or self-harming behaviors (Chartrand, Sareen, Toews & Bolton, Reference Chartrand, Sareen, Toews and Bolton2012; Heerde & Hemphill, Reference Heerde and Hemphill2015; Mannarini & Boffo, Reference Mannarini and Boffo2015; Peluso & Blay, Reference Peluso and Blay2009; Raza, Abbasi, Khurshid & Ansari, Reference Raza, Abbasi, Khurshid and Ansari2018). While there is little scientific evidence supporting the cause of harming and self-harming behaviors among these groups (Van Dorn, Volavka & Johnson, Reference Van Dorn, Volavka and Johnson2012), this belief may encourage students to feel apprehensive around peers from these groups and, in turn, avoid contact with them.
While attitudes toward disabilities among students in college settings have gained attention from researchers, a majority of studies have focused on individuals with SMI (Amarasuriya, Jorm, Reavley & Mackinnon, Reference Amarasuriya, Jorm, Reavley and Mackinnon2015; Anderson, Jeon, Blenner, Wiener & Hope, Reference Anderson, Jeon, Blenner, Wiener and Hope2015; Botha, Shamblaw & Dozois, Reference Botha, Shamblaw and Dozois2017; Vankar, Prabhakaran & Sharma, Reference Vankar, Prabhakaran and Sharma2014). Research on this topic focusing on other types of disabilities is scarce. For example, while few studies have shown mixed findings regarding attitudes toward individuals with cerebral palsy (Martin, Rowell, Reid, Marks & Reddihough, Reference Martin, Rowell, Reid, Marks and Reddihough2005; Sarno & Colpoys, Reference Sarno and Colpoys1967), individuals with hearing impairment (Emerton & Rothman, Reference Emerton and Rothman1978), and individuals with autism spectrum disorder (ASD; Gillespie-Lynch et al., Reference Gillespie-Lynch, Brooks, Someki, Obeid, Shane-Simpson, Kapp and Smith2015; Obeid et al., Reference Obeid, Daou, DeNigris, Shane-Simpson, Brooks and Gillespie-Lynch2015), there is still a significant dearth of studies in this area focusing on individuals with other types of disabilities, such as visual impairment, spinal cord injury (SCI), and cancer survivor. Moreover, while several studies (Banks, in press; Dodd, Hermanson, Landstrom, Nelson & Rose, Reference Dodd, Hermanson, Landstrom, Nelson and Rose1991; Matthews, Anderson & Skolnick, Reference Matthews, Anderson and Skolnick1987; Vogel, Leyser, Wyland & Brulle, Reference Vogel, Leyser, Wyland and Brulle1999) investigating attitudes toward individuals with learning disability in college settings revealed positive attitudes toward this group, the major emphasis in those studies is mostly on the faculty’s perspectives about their willingness to provide academic accommodations instead of on students’ attitudes toward their peers with disabilities. As a result, it can be difficult to gain a comprehensive understanding of attitudes toward disabilities in college settings due to the limited number of empirical studies in this area.
Negative attitudes toward disabilities are likely to create a negative climate, decrease campus involvement, and contribute to a diminished sense of belonging for college students with disabilities. Each of these factors is considered key element for success and persistence in postsecondary education for students with disabilities (Fleming, Oertle, Plotner & Hakun, Reference Fleming, Oertle, Plotner and Hakun2017; Vaccaro, Daly-Cano & Newman, Reference Vaccaro, Daly-Cano and Newman2015). Therefore, it is crucial to gain a comprehensive understanding of attitudes toward college students with different types of disabilities among those without disabilities in college settings.
Research on attitudes toward disabilities specifically among students in college settings can be traced back to the 1960s (Freed, Reference Freed1964). While research on attitudes toward disabilities among students in college settings has been documented in the literature (e.g., Culp, Rojas-Guyler, Vidourek & King, Reference Culp, Rojas-Guyler, Vidourek and King2017; Leyser & Romi, Reference Leyser and Romi2008; Palmer, Redinius & Tervo, Reference Palmer, Redinius and Tervo2000; Seo & Chen, Reference Seo and Chen2009; Wagner & Stewart, Reference Wagner and Stewart2001), a majority of the extant studies display two critical methodological limitations: (a) problems in contextualizing attitude measurement and (b) treating all disability categories as a homogeneous group. These issues may potentially bias findings and the interpretations of the results.
1. Problems in Contextualizing Attitude Measurement
It has been emphasized that an attitude is context dependent (Kowalska & Winnicka, Reference Kowalska and Winnicka2013; Ouellette-Kuntz et al., Reference Ouellette-Kuntz, Burge, Brown and Arsenault2010). Wright (Reference Wright and Yuker1988) has accentuated the importance of social context related to disability. Hence, the result might not reflect the truth if attitudes toward disabilities among college students are investigated using measures assessing attitudes in a generic context (i.e., decontextualizing attitude measurement) instead of a specific context (i.e., contextualizing attitude measurement). For example, several studies utilized the Attitudes Towards Disabled Persons Scale (ATDP; Yuker & Block, Reference Yuker and Block1986; Yuker, Block & Young, Reference Yuker, Block and Young1970) to measure attitudes toward disabilities among college students (Fichten, Tagalakis & Amsel, Reference Fichten, Tagalakis and Amsel1989; Martin et al., Reference Martin, Rowell, Reid, Marks and Reddihough2005; Palmer et al., Reference Palmer, Redinius and Tervo2000; Seo & Chen, Reference Seo and Chen2009; Suthakaran, Wright, Simpson, Marra & Sonner, Reference Suthakaran, Wright, Simpson, Marra and Sonner2011); example items in the ATDP include “Disabled people are the same as anyone” and “Most disabled people feel sorry for themselves.” However, while the psychometric properties of the ATDP have been questioned (Breen, Reference Breen2018), this instrument measures attitudes toward disabilities in a generic context as opposed to a specific context (e.g., a context that is closely related to college settings). The studies (Gupta & Bonnell, Reference Gupta and Bonnell1993; Ionta & Scherman, Reference Ionta and Scherman2007) using the Opinions of Mental Illness Questionnaire (Struening & Cohen, Reference Struening and Cohen1963), which is a commonly used instrument measuring attitudes toward mental illness, also share a similar issue.
However, student attitudes toward individuals with disabilities in college settings (e.g., in the classroom or dorm) may be very different from the student attitudes toward individuals with disabilities in other life settings (i.e., employment or marriage). In other words, college student attitudes toward individuals with disabilities in a generic context may not generalize to other specific contexts because the levels of intimacy may differ when college students interact with individuals with disabilities in different life settings (Hergenrather & Rhodes, Reference Hergenrather and Rhodes2007; Huskin, Reiser-Robbins & Kwon, Reference Huskin, Reiser-Robbins and Kwon2018).
Another critical issue concerning contextualizing attitude measurement is that an attitude measurement may be contextualizing but involve distinctly different contexts (Bogardus, Reference Bogardus1933; Hergenrather & Rhodes, Reference Hergenrather and Rhodes2007). For example, despite the critiques to its psychometric properties (Ethington, Reference Ethington1997), the Social Distance Scale (SDS; Bogardus, Reference Bogardus1933) has been a popular instrument measuring attitudes toward disabilities. Some studies (Gillespie-Lynch et al., Reference Gillespie-Lynch, Brooks, Someki, Obeid, Shane-Simpson, Kapp and Smith2015; Obeid et al., Reference Obeid, Daou, DeNigris, Shane-Simpson, Brooks and Gillespie-Lynch2015) used the adapted version of the SDS to measure attitudes toward ASD among college students. The SDS consists of a series of questions to determine an individual’s willingness to engage with a specific group at varying levels of intimacy ranging from “starting a collaborative project” to “marrying a person” for instance. In such a case, when college students express willingness to work with peers with ASD on a collaborative project in the classroom, they may score low on a question under this context (i.e., low scores in this context represent a high level of willingness [low social distance] to work together on a collaborative project). However, the same respondents may not be willing to marry someone with ASD and therefore score high on a question under this context (i.e., high scores in this context represent a low level of willingness [high social distance] to marry someone with ASD). As a result, a scale score calculated with raw scores derived from these two distinctly different questions in terms of contexts may inaccurately reflect respondents’ attitudes toward individuals with ASD because scores derived from these two questions may offset one another. Such a case was also found in a study (Bean & Hedgpeth, Reference Bean and Hedgpeth2014) using the Disability Social Relations Generalized (DSRGD) Scale (Hergenrather & Rhodes, Reference Hergenrather and Rhodes2007) to investigate student attitudes toward people with disabilities.
The DSRGD is composed of three subscales measuring attitudes in three distinctly different contexts (i.e., dating, marriage, and work). The issue noted in the previous paragraph might be addressed by examining attitudes toward disabilities at the subscale level, since examining attitudes at the subscale level in this case would provide more accurate insights than examining attitudes at the full-scale level.
In brief, investigating attitudes toward disabilities with a decontextualizing attitude measurement (i.e., a generic context) may reflect respondents’ attitudes toward disabilities, but this type of measurement may provide little specific information related to attitudes in a specific context. Likewise, investigating attitudes toward individuals with disabilities with measurement consisting of different contexts and scores focusing on full-scale level may inaccurately reflect respondents’ broad attitudes toward disabilities, as scores from different contexts may offset one another.
2. Treating Disabilities as a Homogeneous Group
Many studies investigating attitudes toward individuals with disabilities frequently consolidate all disabilities into one homogeneous group and fail to address differences in attitudes toward specific groups with disabilities (Bean & Hedgpeth, Reference Bean and Hedgpeth2014; Bogart, Logan, Hospodar & Woekel, Reference Bogart, Logan, Hospodar and Woekel2019; Culp et al., Reference Culp, Rojas-Guyler, Vidourek and King2017; Hergenrather & Rhodes, Reference Hergenrather and Rhodes2007; Leyser & Romi, Reference Leyser and Romi2008; Palmer et al., Reference Palmer, Redinius and Tervo2000; Polo Saánchez, Fernaández-Jimeánez & Fernaández-Cabezas, Reference Polo Sánchez, Fernández-Jiménez and Fernández-Cabezas2018; Seo & Chen, Reference Seo and Chen2009; Suthakaran et al., Reference Suthakaran, Wright, Simpson, Marra and Sonner2011; Wagner & Stewart, Reference Wagner and Stewart2001). However, research has indicated that most individuals exhibit hierarchical preferences for specific groups of individuals with disabilities. For example, people generally harbor more positive attitudes toward individuals with physical disability than do individuals with psychiatric disability and more positive attitudes toward individuals with intellectual disability than individuals with psychiatric disability (Chan et al., Reference Chan, Livneh, Pruett, Wang, Zheng, Chan, Da Silva Cardoso and Chronister2009). Therefore, treating different disabilities as one homogeneous group is likely to provide little information specific to individuals’ attitudes and experiences of different types of disabilities.
A number of studies investigating attitudes toward disabilities among college students have focused on a specific group of individuals with disabilities (Ahlborn, Panel & Jungers, Reference Ahlborn, Panek and Jungers2008; Gibbons, Cihak, Mynatt & Wilhoit, Reference Gibbons, Cihak, Mynatt and Wilhoit2015; Granello & Granello, Reference Granello and Granello2000; Griffin, Summer, McMillan, Day & Hodapp, Reference Griffin, Summer, McMillan, Day and Hodapp2012; Haney & Fisher, Reference Haney and Fisher2017; Li, Tsoi & Wang, Reference Li, Tsoi and Wang2012; Matthews, Ly & Goldberg, Reference Matthews, Ly and Goldberg2015; Nevill & White, Reference Nevill and White2011; Sun et al., Reference Sun, Pu, Wang, Hu, Yang, Chen and Rosenheck2013; Youssef et al., Reference Youssef, Bachew, Bodie, Leach, Morris and Sherma2014). Focusing on one specific group of individuals with disabilities may pose limitations regarding insights into attitudes across different groups of individuals with disabilities. This narrow focus may also limit the development of efficient and innovative strategies for increasing disability awareness for disability groups who require higher levels of awareness from their peers without disabilities.
3. Purpose of the Study
Little research to date has focused on multiple groups of individuals with disabilities simultaneously (Schmelkin, Reference Schmelkin1984; Tringo, Reference Tringo1970; Upton, Harper & Wadsworth, Reference Upton, Harper and Wadsworth2005); few studies have taken into consideration the aforementioned methodological limitations. In order to fill this gap and expand the understanding of attitudes toward individuals with disabilities among students in college settings, the purpose of this study was to expand the understanding of attitudes toward 10 specific groups of individuals with disabilities among students in college settings while taking into consideration methodological limitations from the previous studies.
4. Method
4.1 Design and procedures
A quantitative descriptive design utilizing a convenience sample was used in this study. We recruited participants from a public university in the southern United States. Participants who were eligible to participate in the study were at least 18 years old and enrolled in a course in which the instructors agreed to participate in this study. Upon receiving approval from the Institutional Review Board at the hosting university, we, based on personal network, sent out an email to the instructors in an academic program preparing professionals at the hosting university for inquiring their willingness to help disseminate an online survey link for this study. The instructors who agreed to participate in this study helped to send out a survey link to students in their classes. The instructors offered extra credit to students for their participation in the online survey.
We purposely selected 10 types of disabilities to be involved in this study since the recipients of supports for academic accommodations at the hosting university had involved these groups. These groups comprised major depression, substance use disorder (SUD), anxiety disorder, ASD, cerebral palsy, hearing impairment, learning disability, visual impairment, SCI, and cancer survivor. This study also purposely involved two groups of individuals who were from a single-parent family and who were transfer students. The involvement of these two groups aims at serving as an anchor representing individuals without disabilities.
A list containing the selected 12 groups (i.e., 10 types of disabilities and 2 anchor groups) was presented in each question of the measures used in the survey. For example, the participants were asked “how willing would you be to start a collaborative project with someone from the given group of individuals?” and then provided their responses to this question by checking the response based on a Likert-type scale presented with each of the 12 groups. These 12 groups were presented in a random order in the list for the first question, with the first group being individuals who are cancer survivors, followed by individuals with SCI, individuals with visual impairment, individuals from a single-parent family, individuals with past alcohol/drug history, individuals with ASD, individuals with major depression, individuals with learning disability, individuals who are transfer student, individuals with anxiety disorder, individuals with hearing impairment, and individuals with cerebral palsy. This order remained the same throughout the remaining questions.
4.2 Participants
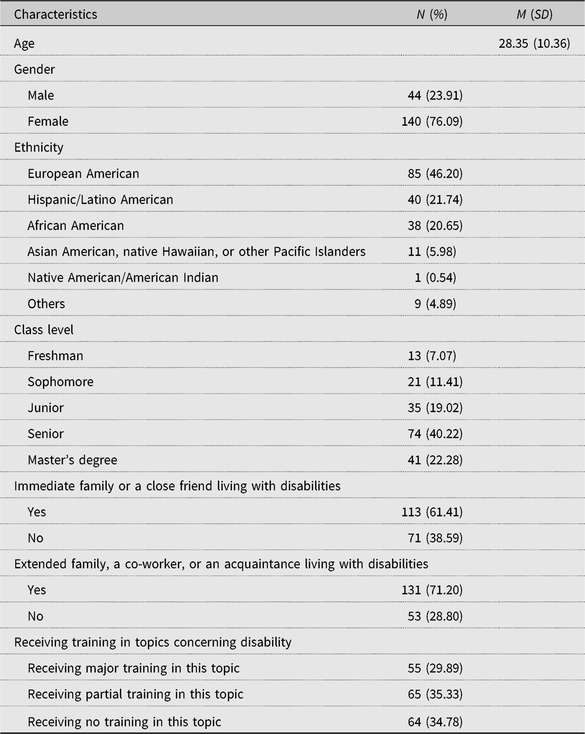
One hundred eighty-nine participants completed the online survey. Five cases were removed since more than 80% of values were missing, resulting in a final count of N = 184. Descriptive statistics for the sample are presented in Table 1.
Participant demographic characteristics (N = 184)

A majority of the sample were female (76%), while 24% were male. Participants ranged in age from 18 to 62 years (M = 28.35, SD = 10.36). Eighty-five participants reported as European American (46.20%), followed by Hispanic/Latino American (21.74%), African American (20.65%), Asian American, native Hawaiian, or other Pacific Islander (5.98%), Native American/American Indian (0.54%), and other (4.89%). Participants reported that they were college seniors (40.22%), master’s students (22.28%), juniors (19.02%), sophomores (11.41%), and freshmen (7.07%). One hundred thirteen participants (61.41%) reported that a member of their immediate family or a close friend was living with disability, and 131 participants (71.20%) reported that a member of their extended family, co-worker, or acquaintance was living with disability. Sixty-five participants (35.33%) reported that topics concerning disability were not the major focus of their academic training but were addressed in classes, seminars, or workshops. Fifty-five participants (29.89%) reported that disability was the major focus of all or most of their academic training, and the remaining 64 participants (34.78%) reported that had received almost no training in topics concerning disability.
4.3 Measures
4.3.1 Social distance
An adapted version of the 4-item SDS (Bogardus, Reference Bogardus1933) was used to measure attitudes toward students with disabilities among students in college settings. The SDS measures attitudes by assessing participants’ willingness to engage with a given type of person (i.e., someone with specific type of disability) at various levels of intimacy. The original 6-item SDS asks participants how willing they would be (a) “to move next door to someone from the given group of individuals”; (b) “to spend an evening socializing with someone from the given group of individuals”; (c) “to start a collaborative project with someone from the given group of individuals”; (d) “to make friends with a person from the given group of individuals”; (e) “to have a person from the given group of individuals marry into the family”; and (f) “to marry or date a person from the given group of individuals.” In order to ensure the measurement’s context was more specifically relevant to college life, the last two items from the original 6-item SDS were excluded because the context concerning “marriage” was less directly relevant to college life. Each item was rated on a 7-point Likert-type scale ranging from 1 (definitely willing) to 7 (definitely unwilling). A mean score was computed, with higher scores indicating higher level of social distance. Cronbach’s alpha for the adapted 4-item SDS in this study was α = .92.
4.3.2 Perceived dangerousness
The Perceived Dangerousness Scale (PDS; Martin, Pescosolido & Tuch, Reference Martin, Pescosolido and Tuch2000; Phelan & Basow, Reference Phelan and Basow2007; Schnittker, Reference Schnittker2000) was utilized to assess participants’ perceived dangerousness of their peers with disabilities. The PDS comprises three items: (a) “How likely is it that the given group of individuals would do something violent toward other people?” (b) “How likely is it that the given group of individuals would do something violent toward themselves?” and (c) “How dangerous this group of individuals appears?” The first two items were rated on a 7-point Likert-type scale ranging from 1 (very unlikely) to 7 (very likely), and the third item was rated on a 7-point Likert-type scale ranging from 1 (not at all dangerous) to 7 (extremely dangerous). A mean score was computed, with higher scores indicating higher levels of perceived dangerousness of students with disabilities. Cronbach’s alpha for PDS in this study was α = .83.
4.4 Data analysis
Descriptive statistics, missing data analysis, multidimensional scaling (MDS) analysis, and hierarchical cluster analysis (HCA) were computed using statistical programming language R version 3.5.0 with RStudio version 1.1.453. An analysis for missing data revealed a missing pattern ranging from a low of 1% for SDS measuring stigma to a high of 4% for PDS measuring perceived dangerousness. Because missing values were not extreme in this sample, a single imputation using predictive mean matching for continuous variables and logistic regression for categorical variables (van Buuren, Reference Van Buuren2012) was utilized to replace missing values. This method is preferred over listwise deletion when less than 5% of items are missing to ensure that sample size and representativeness are intact (Fox-Wasylyshyn & El-Masri, Reference Fox-Wasylyshyn and El-Masri2005; Schafer & Graham, Reference Schafer and Graham2002).
A nonmetric MDS analysis was used to determine the degree to which objects (i.e., different groups of students with disabilities in this study) are dissimilar to each other based on the participants’ ratings on social distance (Borg & Groenen, Reference Borg and Groenen2005; Cox & Cox, Reference Cox and Cox2001). The dimensional structure underlying this set of objects was graphically presented in a perceptual space. In other words, the more distant two groups of students with disabilities are, the more dissimilar the two groups will be. Given the use of Likert-type scale, which is considered an indirect proximity measure in the MDS literature, the indirect proximity data were converted to a Euclidean distance matrix prior to model configuration (Ding, Reference Ding2018). The Euclidean distance matrix was then utilized for configuration using classical scaling solution (Torgerson Reference Torgerson1958). In order to determine an optimal dimensionality for MDS, we examined the Kruskal’s Stress-1 index (Kruskal, Reference Kruskal1964) and a scree plot (Cox & Cox, Reference Cox and Cox2001; Hout, Papesh & Goldinger, Reference Hout, Papesh and Goldinger2013) for the optimal MDS model selection. A Kruskal’s stress-1 index less than .10 represents a fair model fit, less than .05 represents a good fit, and less than .025 represents an excellent fit (Borg & Groenen, Reference Borg and Groenen2005; Kruskal, Reference Kruskal1964). Despite the fact that lower stress index indicates a better fit for an MDS model, the decreased stress index would lead to an increased number of dimensions (Borg & Groenen, Reference Borg and Groenen2005; Cox & Cox, Reference Cox and Cox2001; Ding, Reference Ding2018), which decreases the readability and interpretability of the MDS model (Jaworska & Chupetlovska-Anastasova, Reference Jaworska and Chupetlovska-Anastasova2009). Therefore, a scree plot, also known as “elbow method,” was further examined for addressing this limitation. The scree plot was generated by plotting stress function value against the number of dimensions (Jaworska & Chupetlovska-Anastasova, Reference Jaworska and Chupetlovska-Anastasova2009). An obvious “elbow” within the scree plot indicates an optimal number of dimensions since increasing dimensions does not affect stress index in any significant way (Hout et al., Reference Hout, Papesh and Goldinger2013).
We further applied a biplot for MDS. A biplot for MDS is a plot in two or more dimensions that illustrate objects on MDS perceptual space and external variables of a data matrix simultaneously (Cox & Cox, Reference Cox and Cox2001). Thus, a biplot is a representation of two modes (e.g., the objects on MDS space and external variables) in one plot but not to the dimensionality (Borg & Groenen, Reference Borg and Groenen2005). We generated an MDS biplot by adding an external variable (i.e., perceived dangerousness) to the MDS perceptual space. The projection of this external variable on the perceptual space was determined based on the linear regression coefficient of the external variable on the objects in the MDS perceptual space (Greenacre, Reference Greenacre2010).
An HCA also was conducted based on the participants’ ratings on social distance in order to further clarify the different groups of students with disabilities perceived by the participants. The number of clusters was determined by examination of the scree plot. The scree plot was generated by plotting Dindex value against the number of clusters (Charrad, Ghazzali, Boiteau, Niknafs & Charrad, Reference Charrad, Ghazzali, Boiteau, Niknafs and Charrad2014). The Dindex is based on clustering gain on intra-cluster inertia, which measures the level of homogeneity between the data (e.g., groups of disabilities) associated with a cluster (Lebart, Morineau & Piron, Reference Lebart, Morineau and Piron2000). An obvious “elbow” within the scree plot indicates an optimal number of clusters.
5. Results
5.1 Descriptive analysis
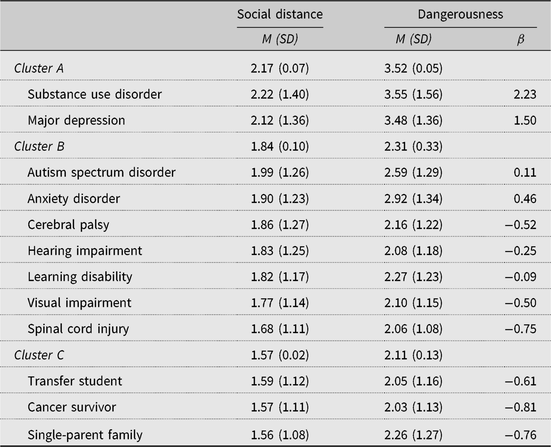
Descriptive statistics for social distance and perceived dangerousness across disability groups are presented in Table 2.
Descriptive statistics for social distance and perceived dangerousness; results of hierarchical cluster analysis and standardized regression coefficients resulting from MDS biplot

The descriptive statistics revealed mean scores for social distance ranging from a low on the group of single-parent family (M = 1.56, SD = 1.08) to a high on the group of SUD (M = 2.22, SD = 1.40). This result indicated that participants mostly held positive attitudes toward their peers from these groups in college settings, but more favored those who were from a single-parent family and least favored those living with SUD. In other words, participants were mostly or definitely willing to move to next door to those from a single-parent family, spend an evening socializing with those from a single-parent family, start a collaborative project with those from a single-parent family, and make friends with those from a single-parent family, but participants were only somewhat or mostly willing to move to next door to those living SUD, spend an evening socializing with those living with SUD, start a collaborative project with those living with SUD, and make friends with those living with SUD.
Mean scores for perceived dangerousness ranged from a low on the group of cancer survivors (M = 2.03, SD = 1.13) to a high on the group of SUD (M = 3.55, SD = 1.56). This result indicated that participants perceived a low level of dangerousness from a majority of the disability groups. In other words, participants considered that a majority of their peers from these disability groups were not dangerous and were unlikely to do something violent toward other people and themselves. However, participants held nearly neutral opinions about their peers living with SUD in terms of dangerousness, indicating that participants perceived low to moderate level of dangerousness from their peers living with SUD and that their peers living with SUD might be somewhat unlikely to do something violent toward other people and themselves.
5.2 Multidimensional scaling and biplot
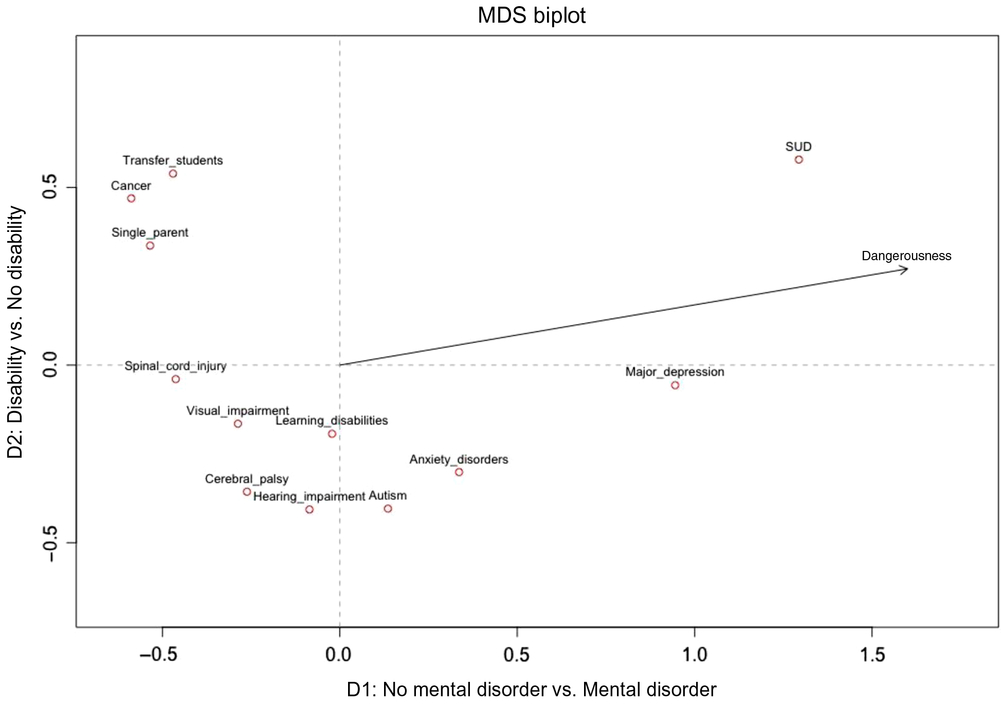
The MDS result indicated participants’ attitudes toward their peers from given groups of disabilities can be graphically represented in a two-dimension space based on the scree plot for MDS and Kruskal’s stress-1 index. The Kruskal’s stress-1 index was found to be .016 (< .025), indicating an excellent fit. Dimension one is represented by no mental disorder versus mental disorder, and dimension two is represented by disability versus no disability. The MDS perceptual space is presented in Fig. 1. It should be noted that MDS defines clusters of objects in terms of continuous dimensions instead of in an either–or fashion (Ding, Reference Ding2018); therefore, the groups of students with disabilities in this perceptual space are viewed as being likely to possess more of one attribute than the other (i.e., more likely to experience mental health disorders), rather than having that attribute or not (Ding, Reference Ding2018). As a result, participants were likely to perceive the groups locating more toward right side on this space as being more likely to experience a mental health disorder compared to the groups locating more toward left side on this space. Likewise, participants were more likely to perceive groups positioned toward the lower side on this space as living with a disability compared to the groups locating more toward upper side on this space.
A two-dimension solution for attitudes toward students with disabilities in college settings and biplot for the dangerousness vector.

The perceived dangerousness was added to generate an MDS biplot. This added external variable was represented by the projection of the vector as shown in Fig. 1. It should be noted that in the MDS biplot we only interpret the direction of the projected vector (i.e., the added external variable) pointing toward and the objects (i.e., the groups of disabilities) on the vector’s direction, not the distance between an object on the space and the vector (Borg & Groenen, Reference Borg and Groenen2005). In other words, while the groups of disabilities were positioned on the MDS perceptual space according to the participants’ ratings on social distance, the vector indicates how the ratings on perceived dangerousness relate to the ratings on social distance.
Building on this guideline, the vector on the right side on the space represents perceived dangerousness and points slightly toward upper-right direction (R 2 = .93), indicating that participants perceived higher level of dangerousness from the groups who were positioned in this direction, including those living with SUD (β = 2.23), major depression (β = 1.50), anxiety disorder (β = 0.46), and ASD (β = 0.11), as compared to the groups who were positioned at the opposite direction of dangerousness vector.
5.3 Hierarchical cluster analysis
The HCA was conducted to clarify the clustering of the different groups of disabilities. Based on the scree plot for HCA, the result indicated that the groups of disabilities can be clustered into three clusters: (a) cluster A is composed of groups living with SUD and depression; (b) cluster B is composed of groups living with ASD, anxiety disorder, cerebral palsy, hearing impairment, learning disability, visual impairment, and SCI; (c) cluster C is composed of groups who were transfer student, cancer survivor, and from a single-parent family. Participants rated cluster A as having the highest level of social distance, followed by clusters B and C (see Table 2). This pattern is similar to the result from the ratings on perceived dangerousness, in which cluster A received the highest ratings on perceived dangerousness, followed by clusters B and C.
6. Discussion
This study aimed at expanding the understanding of attitudes toward 10 specific groups of individuals with disabilities among students in college settings while taking into consideration methodological limitations from the previous studies. Our findings, as shown on the MDS perceptual space, indicated that the participants were likely to perceive the groups living with SCI, visual impairment, learning disability, cerebral palsy, hearing impairment, ASD, anxiety disorder, and depression as living with disabilities. These groups of individuals typically were considered living with disabilities by general public. However, it was surprising that the participants were less likely to perceive individuals who were cancer survivors or individuals who were living with SUD as living with disabilities.
Research has indicated that individuals living with SUD often are viewed to be dangerous and treated as a moral and criminal issue instead of a health concern and that this population also has been considered to have personal control over their behaviors (Livingston, Milne, Fang & Amari, Reference Livingston, Milne, Fang and Amari2012; Phelan & Basow, Reference Phelan and Basow2007; Radcliffe & Stevens, Reference Radcliffe and Stevens2008; Room, Reference Room2005). This may help explain why our participants were less likely to perceive individuals living with SUD as living with disabilities. In addition, our participants were less likely to view individuals who were cancer survivors as living with disabilities. One possible explanation is that since the term “cancer survivor” was used in the survey, participants might assume that those who were cancer survivors already recovered from cancer due to the term “survivor.” This assumption might further imply that individuals who were cancer survivors might have less functional limitations within the context of college settings (i.e., making friends or starting a collaborative project) because they already recovered from cancer. Further, mobility and communication were essential components for participating in academic-related activities. As compared to groups who were cancer survivors, those living with SCI, visual impairment, learning disability, cerebral palsy, hearing impairment, ASD, anxiety disorder, and depression were more likely to experience issues concerning communication, mobility, or other functional limitations. Participants might, therefore, consider that cancer survivors have less functional limitations within the context of college settings and were less likely to perceive this group as living with disabilities.
Participants, on the other hand, were more likely to perceive the groups living with SUD, depression, and anxiety disorder as being likely to experience a mental health disorder, while the remaining groups were perceived as being less likely to experience a mental health disorder. Noteworthily, the group living with ASD was positioned slightly toward to the right side. This may imply that our participants considered that their peers living with ASD were somewhat likely to experience mental health concerns. This explanation is plausible since experiences in anxiety and depression have been frequently reported by individuals living with ASD in college settings (Gelbar, Smith & Reichow, Reference Gelbar, Smith and Reichow2014).
6.1 Perceived dangerousness in the MDS biplot
The MDS biplot provided additional insights into the relationship between the MDS perceptual space and perceived dangerousness. The findings indicated that participants were likely to perceive dangerousness from the groups living with SUD, depression, anxiety disorder, and ASD.
Criminal issues among individuals living with SUD have been one of the major contributors to negative attitudes toward this population (Ahern, Stuber & Galea, Reference Ahern, Stuber and Galea2007). Research has shown that substance misuse is associated with increased perpetration of physically violent behaviors, property offences, and increased family violence (Choenni, Hammink & van de Mheen, Reference Choenni, Hammink and van de Mheen2017; Heerde & Hemphill, Reference Heerde and Hemphill2015; Margolin, Ramos, Baucom, Bennett & Guran, Reference Margolin, Ramos, Baucom, Bennett and Guran2013). Although our findings provide additional support for previous studies (Mannarini & Boffo, Reference Mannarini and Boffo2015; Schomerus et al., Reference Schomerus, Lucht, Holzinger, Matschinger, Carta and Angermeyer2010) suggesting a relationship between perceived dangerousness and SUD, research has shown that substance abuse might not causally lead to violence but might be due to involvement of other mental health issues (Choenni et al., Reference Choenni, Hammink and van de Mheen2017; Van Dorn et al., Reference Van Dorn, Volavka and Johnson2012). Besides, depression and anxiety disorder have been found to be associated with self-harming behavior (Chartrand et al., Reference Chartrand, Sareen, Toews and Bolton2012; Raza et al., Reference Raza, Abbasi, Khurshid and Ansari2018). Our findings are also consistent with previous findings (Peluso & Blay, Reference Peluso and Blay2009). This may help explain why the groups living with depression or anxiety disorder were positioned in the direction of dangerousness vector.
It is important to note that the group living with ASD also was positioned on the dangerousness vector despite the fact that this group was positioned very close to the opposite direction of the dangerousness vector. This finding also provides additional support for the previous study indicating that college students exhibited high level of social distance (i.e., negative attitudes) toward individuals living with ASD (Huskin et al., Reference Huskin, Reiser-Robbins and Kwon2018). However, the literature (White, Meloy, Mohandie & Kienlen, Reference White, Meloy, Mohandie and Kienlen2017) has shown that popular media have generated a concern regarding violent behaviors in individuals living with ASD even though no empirical studies support the causality between ASD and violent behaviors; instead the violent behaviors might result from undetected or untreated mental health issues (Del Pozzo, Roche & Silverstein, Reference Del Pozzo, Roché and Silverstein2018). These findings may also suggest that participants may possess insufficient or inaccurate knowledge of ASD and in turn leads to perception of dangerousness.
6.2 The clusters resulted from HCA
The patterns grouping the individuals with disabilities into three clusters were consistent with the positions where all the groups of individuals with disabilities located on the MDS perceptual space. The result from HCA also indicated that participants rated cluster A as having the highest level of social distance, followed by clusters B and C. It should be noted that cluster B is composed of groups living with ASD, anxiety disorder, cerebral palsy, hearing impairment, learning disability, visual impairment, and SCI. These groups are likely to exhibit functional limitations in terms of communication and mobility as compared to cluster A (individuals living with SUD and individuals with depressions) and C (individuals who were transfer student, individuals who were cancer survivors, and individuals who were from a single-parent family).
The MDS perceptual space was configured based on the SDS, and the behaviors (or activities) described in the SDS involve a certain level of communication and mobility, such as spending an evening socializing with peers from these groups, starting a collaborative project with peers from these groups, and making friends with peers from these groups. Communication and mobility are essential abilities needed in college life. Those groups in cluster B may have higher likelihood requesting academic accommodations (Berk, Reference Berk2013; Mash & Wolfe, Reference Mash and Wolfe2016; Wicks-Nelson & Israel, Reference Wicks-Nelson and Israel2013), and therefore, our participants may perceive those groups in cluster B share more similarity with each other as compared to those groups in cluster A and C. Further, while participants exhibited positive attitudes toward cluster B, the group living with ASD in cluster B was rated as having the highest level of social distance compared to other groups in cluster B, supporting the finding from the previous study (Huskin et al., Reference Huskin, Reiser-Robbins and Kwon2018) indicating that college students expressed negative attitudes toward ASD relative to other disability groups.
6.3 Implications
The findings from this study have significant implications for educators involved in training individuals who will likely work with clients with disabilities. Approximately two-thirds (65.22%) of our participants reported receiving disability-related training; however, it was unclear to what extent topics concerning mental health disorders (e.g., SUD, depression, and anxiety) as well as ASD were addressed in disability-related training. It is relevant for rehabilitation counselor educators to review disability-related educational programming for providing sufficient accurate information related to these specific groups of individuals with disabilities. On the other hand, findings from this study also suggest the need for educational programs at the university level to increase awareness and understanding for the group of individuals with disabilities who require higher levels of awareness from their peers without disabilities due to misunderstanding of the disabilities. Increased disability awareness may enhance students’ accurate understanding of their peers with disabilities and promote inclusion in college settings. Research has shown that inclusion is beneficial to students academically and socially, including those with disabilities, and that inclusive practices enable students without disabilities to develop empathy and skills necessary to support their peers with disabilities (Causton-Theoharis & Theoharis, Reference Causton-Theoharis and Theoharis2008; Peck, Staub, Gallucci & Schwartz, Reference Peck, Staub, Gallucci and Schwartz2004).
Our findings also highlight the need for future research in this area. Future research should consider examining academic training programs at the university level to determine how the concept of disability awareness is addressed. We also encourage researchers to consider probing attitudes toward disabilities among faculties and administrative staffs with contextualizing attitude measurement and involvement of multiple types of disability groups.
6.4 Limitations
Several limitations should be considered when interpreting the results of the study. First, the generalizability of the findings is restricted due to the use of an online survey format and a non-random convenience sample, which was made up with a majority of female participants. Second, the use of self-report measurements might have negative impact on data quality as self-report measurements could be vulnerable to social desirability bias (Krumpal, Reference Krumpal2013). Third, a descriptive design was utilized in this study; therefore, no statistical inference could be made. Fourth, despite the fact that our participants reported prior contact experiences in interacting with individuals with disabilities, the quality of contact experiences remains unclear and this could potentially exert impact on attitudes toward disabilities. In addition, individuals may exhibit attitudes toward disabilities differently because of different causes of disabilities (Chan et al., Reference Chan, Livneh, Pruett, Wang, Zheng, Chan, Da Silva Cardoso and Chronister2009). For example, individuals may exhibit fewer negative attitudes toward congenital disabilities (e.g., cerebral palsy) than acquired disabilities (e.g., alcohol or drug misuse). This study did not control for the potentially confounding impact of perception of disability causes on attitudes toward disabilities; therefore, the results should be interpreted with caution. Lastly, since this study did not adopt a counterbalance approach to present disability groups in the survey, the presentation of disability groups in the survey and the length of the survey may potentially influence the results due to rank-order effects (McFarland, Reference McFarland1981) and fatigue effects (Bradley & Daly, Reference Bradley and Daly1994).
7. Conclusion
Negative attitudes toward disabilities among students in college settings have led to challenges to college adjustment and participation for students with disabilities. While research in this area has been documented in the literature, a majority of the extant studies either have failed to contextualize attitude measurements or have failed to take into account the hierarchy of attitudes toward disabilities. This study was to fill this gap by investigating attitudes toward 10 specific groups of individuals with disabilities specifically among students in college settings. This study revealed that participants perceived the groups locating more toward right side on the MDS space as being more likely to experience mental health concerns compared to the groups locating more toward left side on this space and that participants were more likely to perceive the groups locating more toward lower side on this space as living with disabilities compared to the groups locating more toward upper side on this space. The MDS biplot further indicated that participants perceived higher levels of dangerousness from the groups living with SUD, major depression, anxiety disorder, and ASD. The HCA also clarified that the participants grouped the disabilities into three clusters. In brief, participants were “mostly” willing to move to next door to, spend an evening socializing with, start a collaborative project with, and make friends with those in cluster C (individuals who were transfer student, individuals who were cancer survivors, and individuals who were from a single-parent family) but were “somewhat” willing to perform the same behaviors with those in cluster A (SUD and depression). This study enhances our understanding of attitudes toward disabilities specifically among students in college settings. It is recommended that rehabilitation researchers need to take into account the hierarchy of attitudes toward specific groups of individuals with disabilities and contextualize attitude measurements when investigating attitudes toward disabilities. It is also urged to develop strategies that target on specific groups of individuals with disabilities (i.e., SUD, depression, anxiety disorder, and ASD) to increase disability awareness in college settings.
Acknowledgements
None.
Financial support
This research received no specific grant from any funding agency, commercial, or not-for-profit sectors.
Conflicts of interest
None.
Ethical standards
The authors assert that all procedures contributing to this work comply with the ethical standards of the relevant national and institutional committees on human experimentation and with the Helsinki Declaration of 1975, as revised in 2008.