INTRODUCTION
Food legumes are important food and feed crops worldwide. Dry peas (Pisum sativum), soybean (Glycine max), dry beans (Phaseolus vulgaris), groundnut (Arachis hypogaea), chickpea (Cicer arietinum), pigeonpea (Cajanus cajan), lentil (Lens culinaris), mungbean (Vigna radiata), urdbean (Vigna mungo) and cowpea (Vigna unguiculata) are among the most important legume crops. Legumes are rich in protein (180–290 g/kg), complementing cereal staples in the human diet. They also play an important role, particularly in low-input farming systems, in maintaining soil fertility by fixing atmospheric nitrogen through symbiotic association with bacteria. Food legumes are grown mostly under rainfed conditions on marginal lands, resulting in poor yields. Global production, currently about 55·9 million metric tonnes, can easily be increased by 30–40% if losses caused by biotic and abiotic stresses (e.g. wilt, rust, ascochyta blight, drought, heat and cold) are prevented (Sharma et al. Reference Sharma, Clement, Ridsdill-Smith, Ranga Rao, El Bouhssini, Ujagir, Srivastava, Miles and Kharkwal2008; Canci & Toker Reference Canci and Toker2009).
In the last five decades, global pulse production involving major grain legume crops except soybean and groundnut has increased only slightly, by 0·77% per year, with wide fluctuations in production (FAO 2010). In India, the world's largest producer, growth in terms of yield production was only 0·24% (AICRP on MULLaRP 2009–10). Per capita availability of pulses has declined. In India, which is predominantly vegetarian, per capita availability has fallen from 63 g/day in 1961 to 35·3 g/day in 2009 and is expected to drop to 27·3 g/day in 2010 (Commodity Online 2009). This decline is caused by a number of factors including biotic and abiotic stresses, diversion of cultivated land to other uses, rising temperature, frequent drought and declining factor productivity (Bellaloui et al. Reference Bellaloui, Mengistu and Paris2008; Koutroubas et al. Reference Koutroubas, Papageorgiou and Fotiadis2009; Zheng et al. Reference Zheng, Chen and Han2009).
Progress in genetic improvement and yield stability has been slow, partly due to large genotype×environment (G×E) interactions on the expression of quantitative traits (Imrie & Shanmugasundaram Reference Imrie and Shanmugasundaram1987; Malhotra & Singh Reference Malhotra and Singh1991; Singh & Kumar Reference Singh and Kumar1994; Kumar et al. Reference Kumar, Singh, Malhotra, Miranda and Gupta1996; Kumar & Ali Reference Kumar and Ali2006; Phakamas et al. Reference Phakamas, Patanothai, Pannangpetch, Jogloy and Hoogenboom2008). However, advances in molecular marker technology now offer opportunities for genetic dissection of complex quantitative traits such as grain yield: quantitative trait loci (QTLs) analysis can help identify QTLs providing stable responses across environments and interacting with specific environments. The molecular markers associated with the desirable QTLs that are identified can be used by plant breeders for more precise genetic manipulation of target traits. In the past two decades, a vast amount of genomic resources have been developed in legume crops. However, these resources are not yet routinely used in breeding programmes to improve productivity and grain quality. The present review focuses on the development, dynamics and utilization of genomic resources in major legume crops.
CHARACTERIZATION OF LEGUME SPECIES
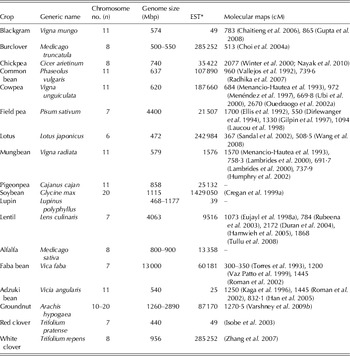
There are about 20 000 species of legumes, belonging to three subfamilies: Mimosoideae, Caesalpinioideae and Papilionoideae. Most of the economically important food and feed legumes belong to Papilionoideae, which has four clades (Doyle & Luckow Reference Doyle and Luckow2003; Gepts et al. Reference Gepts, Beavis, Brummer, Shoemaker, Stalker, Weeden and Young2005). Two clades, haseoloids/millettioid and galegoids/hologalegina, which have a common ancestor, comprise the world's most important tropical and temperate food legume species. Tropical or warm-season food legumes such as common bean (P. vulgaris), cowpea (V. unguiculata), soybean (G. max) and pigeonpea (C. cajan) fall into the haseoloids/ millettioid clade. Temperate or cool-season legumes are members of the galegoids/hologalegina clade, which further splits into Loteae and inverted repeat-loss subclades. The latter is characterized on the basis of a lost copy of the inverted repeat found in the chloroplast genome of most angiosperms. The model legume species Lotus japonicus is the member of Loteae, while many cool-season legumes including alfalfa (Medicago truncatula), chickpea (C. arietinum), faba bean (Vicia faba), lentil (L. culinaris) and pea (P. sativum) belong to the inverted repeat-loss subclade. Chickpea, pea and lentil were among the earliest domesticates in the Fertile Crescent of the Near East during Neolithic times (Zohary & Hopf Reference Zohary and Hopf2000). Peanut (A. hypogaea L.) and lupins (Lupinus angustifolius) are the two exceptions; they fall separately in the dalbergioid clade (which is more basal and mostly tropical) and the genistoid clade (Moretzsohn et al. Reference Moretzsohn, Bertioli, Guimarães, Madsen, Fredslund, Hougaard, Schauser, Sandal, Stougaard, Tabata and Bertioli2007). Based on phylogenetic relationships, species from different clades show genetic proximity to each other due to extensive genome conservation (Weeden et al. Reference Weeden, Muehlbauer and Ladizinsky1992; Menancio-Hautea et al. Reference Menancio-Hautea, Fatokun, Kumar, Danesh and Young1993; Zhu et al. Reference Zhu, Choi, Cook and Shoemaker2005), although crop legumes differ greatly in their genome size, base chromosome number, ploidy level and compatibility status (Table 1).
Information on the prominent legumes

* http://www.ncbi.nlm.nih.gov/nucest (accessed 18 May 2010; verified 11 May 2011).
During the course of evolution, plant species retained different levels of conservation in their genomes depending on their phylogenetic separation. In several studies, these conserved or orthologous regions have been shown to have physical and genetic colinearity in gene order and contents among different taxa (Choi et al. Reference Choi, Kim, Uhm, Limpens, Lim, Mun, Kalo, Penmetsa, Seres, Kulikova, Roe, Bisseling, Kiss and Cook2004a, b; Wojciechowski et al. Reference Wojciechowski, Lavin and Sanderson2004; Gepts et al. Reference Gepts, Beavis, Brummer, Shoemaker, Stalker, Weeden and Young2005; Zhu et al. Reference Zhu, Choi, Cook and Shoemaker2005; Phan et al. Reference Phan, Ellwood, Hane, Ford, Materne and Oliver2007). Several studies demonstrate that the M. truncatula genome has high-level synteny with Medicago sativa (Choi et al. Reference Choi, Kim, Uhm, Limpens, Lim, Mun, Kalo, Penmetsa, Seres, Kulikova, Roe, Bisseling, Kiss and Cook2004a), pea (Aubert et al. Reference Aubert, Morin, Jacquin, Loridon, Quillet, Petit, Rameau, Lejeune-Henaut, Huguet and Burstin2006), bean (Hougaard et al. Reference Hougaard, Madsen, Sandal, Moretzsohn, Fredslund, Schauser, Nielsen, Rohde, Sato, Tabata, Bertioli and Stougaard2008) and lentil (Phan et al. Reference Phan, Ellwood, Hane, Ford, Materne and Oliver2007). Conserved synteny has also been observed between lentil and pea (Weeden et al. Reference Weeden, Muehlbauer and Ladizinsky1992), common bean and soybean (Lee et al. Reference Lee, Grant, Vallejos and Shoemaker2001) and Lotus and bean (Hougaard et al. Reference Hougaard, Madsen, Sandal, Moretzsohn, Fredslund, Schauser, Nielsen, Rohde, Sato, Tabata, Bertioli and Stougaard2008). Limited synteny has been observed between cool-season and warm-season legume species (Choi et al. Reference Choi, Kim, Uhm, Limpens, Lim, Mun, Kalo, Penmetsa, Seres, Kulikova, Roe, Bisseling, Kiss and Cook2004a; Zhu et al. Reference Zhu, Choi, Cook and Shoemaker2005).
GENOMICS IN LEGUMES
A broad range of genomic resources is available, and can be used to accelerate legume improvement. These include expression sequence tag (EST) database, genome sequences (whole or partial), physical maps, molecular maps, DNA chips and bacterial artificial chromosome (BAC) or similar genomic libraries.
Genome sequences
Progress in legume genome sequencing has been particularly encouraging in three model species: Medicago, Lotus and Glycine. In cool-season legumes, M. truncatula and L. japonicus have been chosen as model species due to their small diploid genomes (c. 500 and 471 Mbp in size), short life cycle and availability of supportive resources (Young et al. Reference Young, Cannon, Sato, Kim, Cook, Town, Roe and Tabata2005). In Medicago, 0·6–0·7 of the estimated euchromatic genomic regions has been sequenced, capturing c. 0·60 of the genes. Sequencing is expected to be completed soon with an assembly of c. 300 Mbp, covering nearly all the euchromatin and capturing c. 0·90 of the genes (Young & Udvardi Reference Young and Udvardi2009). Similarly, gene space sequencing of the lotus genome is also nearly complete: 0·67 (315·1 Mbp out of 472 Mbp), probably covering 0·91 of the gene space, has been sequenced (Sato et al. Reference Sato, Nakamura, Kaneko, Asamizu, Kato, Nakao, Sasamoto, Watanabe, Ono, Kawashima, Fujishiro, Katoh, Kohara, Kishida, Minami, Nakayama, Nakazaki, Shimizu, Shinpo, Takahashi, Wada, Yamada, Ohmido, Hayashi, Fukui, Baba, Nakamichi, Mori and Tabata2008). Genome sequencing of these two species has provided a significant amount of information – available in the public domain – about their gene structure as well as physical and genetic maps. This has increased understanding of genetic network systems involved in biological functions of legume-specific phenomena (Stacey et al. Reference Stacey, Libault, Brechenmacher, Wan and May2006). Among Phaseoloid legumes, soybean has been chosen as a model genome for sequencing (Gepts et al. Reference Gepts, Beavis, Brummer, Shoemaker, Stalker, Weeden and Young2005) due to its economic importance (Nunberg et al. Reference Nunberg, Bedell, Budiman, Citek, Clifton, Fulton, Pape, Cai, Joshi, Nguyen, Xu and Stacey2006), moderate genome size (c. 1115 Mbp), existing infrastructure (Jackson et al. Reference Jackson, Rokhsar, Stacey, Shoemaker, Schmutz and Grimwood2006) and because it represents an excellent model for polyploid legume species (Jackson et al. Reference Jackson, Rokhsar, Stacey, Shoemaker, Schmutz and Grimwood2006). Recently, it has been reported that the soybean whole-genome shotgun comprises 950 Mbp of assembled and anchored sequences representing about 0·85 of the predicted genome size. It has been predicted that the soybean genome has 46 430 protein-coded genes and nearly 0·75 of these genes are present in multiple copies (Schmutz et al. Reference Schmutz, Cannon, Schlueter, Mitros, Nelson, Hyten, Song, Thelen, Cheng, Xu, Hellsten, May, Yu, Sakurai, Umezawa, Bhattacharyya, Sandhu, Valliyodan, Lindquist, Peto, Grant, Shu, Goodstein, Barry, Futrell-Griggs, Abernathy, Du, Tian, Zhu, Gill, Joshi, Libault, Sethuraman, Zhang, Shinozaki, Nguyen, Wing, Cregan, Specht, Grimwood, Rokhsar, Stacey, Shoemaker and Jackson2010). This complete draft assembly of the soybean genetic map is now available, with c. 5500 genetic markers (http://www.Soybase.org, verified 11 May 2011). Among diploid phaseoloid legumes, common bean has been selected as the best species for genome sequencing because of its medium-sized genome (588–637 Mbp) (Bennett & Leitch Reference Bennett and Leitch2010), availability of BAC libraries, 9× physical map, 25 linkage maps and 83 530 ESTs and knowledge of the genic (0·29) and repetitive (c. 0·49) portions of genome. The extensive macrosynteny with soybean as well as other legume species has also favoured genome sequencing. Much less genomic information is available for other legumes, though some progress has been made in pea, alfalfa (lucerne, M. sativa), peanut (=groundnut) and cowpea (for review, see Timko et al. Reference Timko, Rushton, Laudeman, Bokowiec, Chipumuro, Cheung, Town and Chen2008). The gene-space sequence reads (GSRs) had homology to genes encoding transcription factors (TFs) that can be utilized in mapping and tagging the genes for agronomically important traits in cowpea (Timko et al. Reference Timko, Rushton, Laudeman, Bokowiec, Chipumuro, Cheung, Town and Chen2008).
BAC/binary bacterial artificial chromosome (BIBAC) and physical maps
BAC and BIBAC libraries help in genome sequencing, development of new molecular markers and physical maps, and map-based cloning of genes (Tao et al. Reference Tao, Chang, Wang, Chen, Islam-Faridi, Scheuring, Wang, Stelly and Zhang2001). Libraries of 100–150 kbp clone size have been developed in chickpea (23 780 clones with a coverage of 3·8 genome equivalents; Rajesh et al. Reference Rajesh, Coyne, Meksem, Dersharma, Gupta and Muehlbauer2004), soybean (>78 000 BAC clones, representing 9·6× genome; Wu et al. Reference Wu, Sun, Nimmakayala, Santos, Meksem, Springman, Ding, Lightfoot and Zhang2004), cowpea (60 000 BAC clones assembled into a 10× physical map), common bean (89 000 BAC ends sequencing yielded a 9× draft physical map or 0·09 of the common bean genome; Schlueter et al. Reference Schlueter, Goicoechea, Collura, Gill, Lin, Yu, Kudrna, Zuccolo, Vallejos, Muñoz-Torres, Blair, Tohme, Tomkins, Mcclean, Wing and Jackson2008), pea (120 960 BAC clones; Coyne et al. Reference Coyne, Mcclendon, Walling, Timmerman-Vaughan, Murray, Meksem, Lightfoot, Shultz, Keller, Martin, Inglis, Rajesh, Mcphee, Weeden, Grusak, Li and Storlie2007) and groundnut (84 096 clones from AA genome equivalent to 7·4× genome and 75 648 BAC clones from BB genome, representing 2·7–5·3 haploid genome equivalents; Varshney et al. Reference Varshney, Bertioli, Moretzsohn, Vadez, Krishnamurthy, Aruna, Nigam, Moss, Seetha, Ravi, He, Knapp and Hoisington2009b). Using molecular markers, the physical map from BAC clones could also be related to the genetic map by locating existing genetic markers on the contigs (Lewers et al. Reference Lewers, Heinz, Beard, Marek and Matthews2002). This is a starting point for positional cloning of specific genes, and faster discovery of genes underlying phenotypes of agronomic interest (Liu et al. Reference Liu, Shan, Wang, Xu, Peng, Li and Zhang2001; Xu et al. Reference Xu, Song, Cheng, Jiang and Korban2001). For example in soybean, a physical map has been developed from the gene-rich region of linkage group A2 near the black seed coat and Rhg4 loci (Lewers et al. Reference Lewers, Heinz, Beard, Marek and Matthews2002). BAC libraries have also been used to generate simple sequence repeat (SSR) markers leading to identification of two genomic regions involved in resistance to the soybean cyst nematode (CSN; Cregan et al. Reference Cregan, Mudge, Fickus, Danesh, Denny and Young1996, Reference Cregan, Mudge, Fickus, Marek, Danesh, Denny, Shoemaker, Matthews, Jarvik and Young1999b). For fine mapping, BAC clones can provide large numbers of molecular markers from the genomic regions harbouring the QTL/genes.
Molecular maps
Molecular markers have been mapped in several legume species. These molecular maps have been prepared mostly using more than one type of marker, such as restriction fragment length polymorphism (RFLP), amplified fragment length polymorphism (AFLP), random amplified polymorphic DNA (RAPD) and SSR. Dense molecular maps consisting of more than 400 loci have been developed in a few legume crops including azuki bean (Vigna angularis; Han et al. Reference Han, Kaga, Isemura, Wang, Tomooka and Vaughan2005), blackgram (V. mungo; Gupta et al. Reference Gupta, Souframanien and Gopalakrishna2008), common bean (Freyre et al. Reference Freyre, Skroch, Geffroy, Adam-Blondon, Shirmohamadali, Johnson, Llaca, Nodari, Pereira, Tsai, Tohme, Dron, Nienhuis, Vallejos and Gepts1998) and cowpea (Ouedraogo et al. Reference Ouedraogo, Gowda, Jean, Close, Ehlers, Hall, Gillaspie, Roberts, Ismail, Bruening, Gepts, Timko and Belzile2002), using different types of markers (Table 1). In legumes, both inter- and intraspecific mapping populations have been used for preparation of molecular maps: the former is more commonly used because of the low level of polymorphism in the cultivated gene pool. For example, in lentil, use of divergent parents (wild×cultivated) in development of molecular maps often results in lower recombination rates and smaller map sizes (Tadmor et al. Reference Tadmor, Zamir and Ladizinsky1987). As a result, molecular maps developed from these populations cannot be used as reference maps. Intervarietal maps, which have more practical utility in tagging desirable gene(s), have not yet been developed, mainly due to limited availability of polymorphic molecular markers. The first intra-specific linkage map based on SSRs and gene analogue markers has been developed in chickpea and used to map a major resistance QTL for ascochyta blight disease (Flandez-Galvez et al. Reference Flandez-Galvez, Ford, Pang and Taylor2003a, Reference Flandez-Galvez, Ades, Ford, Pang and Taylorb). Recently, there have been efforts to develop dense intervarietal molecular maps based on highly polymorphic SSRs, single nucleotide polymorphism (SNP) and gene-based markers in soybean (Hwang et al. Reference Hwang, Sayama, Takahashi, Takada, Nakamoto, Funatsuki, Hisano, Sasamoto, Sato, Tabata, Kono, Hoshi, Hanawa, Yano, Xia, Harada, Kitamura and Ishimoto2009), chickpea (Nayak et al. Reference Nayak, Zhu, Varghese, Datta, Choi, Horres, Jüngling, Singh, Kavi Kishor, Sivaramakrishnan, Hoisington, Kahl, Winter, Cook and Varshney2010) and common bean (Hanai et al. Reference Hanai, Santini, Camargo, Fungaro, Gepts, Tsai and Vieira2010).
Functional genomics
EST databases
Extensive efforts have been made, in several legume species, to develop ESTs from genes expressing in different conditions and developmental stages (Table 1). The EST database can aid gene discovery, and generate raw material for production of cDNA arrays for transcriptome analysis (Coram & Pang Reference Coram and Pang2005a). As a result, these easily accessible EST sequences have emerged as a valuable and cost-effective resource for in silico generation of markers. They assist in comparative mapping in species where limited or no sequence information is available (Table 1). EST databases provide insights into the genes and putative relationship between EST and proteins. They assist in identifying candidate genes, and in mining the alleles responsible for target traits (Buhariwalla et al. Reference Buhariwalla, Jayashree, Eshwar and Crouch2005). For example, EST libraries in chickpea have been generated and analysed for isolation of candidate genes controlling the defence mechanism against ascochyta blight (Coram & Pang Reference Coram and Pang2005b), root development and abiotic stress tolerance (Jayashree et al. Reference Jayashree, Buhariwalla, Shinde and Crouch2005).
Gene cloning
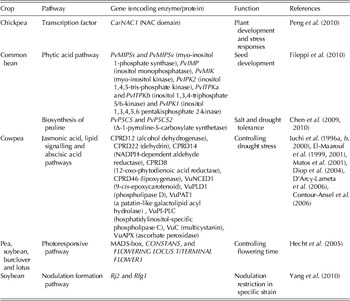
Classical genetic mapping identifies only the genes/QTL responsible for controlling the variation underlying the trait. However, what kind of function such genes/QTL performs at molecular and metabolic levels is not known. Using functional genomics, many genes expressing differentially in contrasting genotypes can be quickly identified. Genes that are functionally related to the target trait and are found within the genomic region where the QTL was mapped can be selected as candidates. These efforts have facilitated not only cloning of genes/QTL with major effects but also those with minor effects, helping to unlock gene networks underlying complex traits (Salvi & Tuberosa Reference Salvi and Tuberosa2005). The knowledge of nucleotide sequence of genes cloned in several legume species (Table 2) has enabled the development of functional markers for marker-assisted selection (MAS) and also to introgress valuable alleles of a gene through genetic engineering. For example, the majority of disease and pest resistance genes (R genes) are members of large gene families that encode the nucleotide-binding site (NBS) and leucine-rich repeat (LRR) domains. Many functionally known resistance gene analogues (RGA) have been cloned and identified in several food legume species including Lens (Yaish et al. Reference Yaish, Sáenz De Miera and Pérez De La Vega2004). Transcription factors (TFs), which are proteins, play an important role in controlling the expression of genes in most biochemical pathways including the response to stress (Kasuga et al. Reference Kasuga, Liu, Miura, Yamaguchi-Shinozaki and Shinozaki1999; Eulgem Reference Eulgem2005). Recent studies have identified numerous genes encoding TFs in plants and paved the way for improving stress tolerance (Singh et al. Reference Singh, Foley and Onate-Sanchez2002). TFs have been analysed on a large scale in Arabidopsis (Eulgem Reference Eulgem2005). Because the distribution of TF genes across TF families between legume and non-legume plants does not have significant differences, several TF genes have been identified in legumes on the basis of sequence homology with Arabidopsis genes (see reviews: Dita et al. Reference Dita, Rispail, Prats, Rubiales and Singh2006; Libault et al. Reference Libault, Joshi, Benedito, Xu, Udvardi and Stacey2009).
List of some genes cloned in legume species

Tools for functional genomics
Serial analysis of gene expression
Serial analysis of gene expression (SAGE) allows rapid and detailed analysis of thousands of transcripts. In chickpea, 80 238 26-bp tags representing 17 493 unique transcripts (UniTags) from drought-stressed and non-stressed control roots have been generated using SuperSAGE technology to analyse gene expression in chickpea roots in response to drought (Molina et al. Reference Molina, Rotter, Horres, Udupa, Besser, Bellarmino, Baum, Matsumura, Terauchi, Kahl and Winter2008). Sanger sequencing has been used to a limited extent to access the chickpea and pigeonpea transcriptomes (27 000 and 13 000 ESTs, respectively).
Microarrays or DNA chips and transcriptome analysis
Microarrays or DNA chips are important tools for identifying the network of genes underlying the expression of an agronomically important trait (Meyers et al. Reference Meyers, Galbraith, Nelson and Agrawal2004; Coram & Pang Reference Coram and Pang2005a). These can be developed from hundreds of thousands of ESTs or cDNA libraries available in model legumes (Medicago, Lotus) and crop species (soybean, chickpea, pea, lentil, etc.). An open source platform, EMMA, has also been developed (Dondrup et al. Reference Dondrup, Goesmann, Bartels, Kalinowski, Krause, Linke, Rupp, Sczyrba, Pühler and Meyer2003) for storage and analysis of large datasets from microarray experiments. Microarrays based on EST and other oligo sequences have been used to study the expression of genes involved in nodule formation during symbiotic association, and in flower, pod and seed development in M. truncatula (Barrel Medick or Barrel Clover; Liu et al. Reference Liu, Blaylock, Endre, Cho, Town, Vandenbosch and Harrison2003; Yahyaoui et al. Reference Yahyaoui, Kuster, Amor, Hohnjec, Puhler, Becker, Gouzy, Vernie, Gough, Niebel, Godiard and Gamas2004; Firnhaber et al. Reference Firnhaber, Puhler and Kuster2005; Lohar et al. Reference Lohar, Sharopova, Endre, Penuela, Samac, Town, Silverstein and Vandenbosch2006). A commercial affymetrix chip with a 51 k GeneChip could also be useful for comparative analysis of gene expression in related grain and forage legumes resulting in identification of thousands of genes that are induced or repressed during the development of nodules and symbiotic nitrogen fixation (Küster et al. Reference Küster, Hohnjec, Krajinski, Yahyaoui, Manthey, Gouzy, Dondrup, Meyer, Kalinowski, Brechenmacher, Van Tuinen, Gianinazzi-Pearson, Pühler, Gamas and Becker2004; Baier et al. Reference Baier, Barsch, Kuster and Hohnjec2007; Benedito et al. Reference Benedito, Torres-Jerez, Murray, Andriankaja, Allen, Kakar, Wandrey, Verdier, Zuber, Ott, Moreau, Niebel, Frickey, Weiller, He, Dai, Zhao, Tang and Udvardi2008; Jones et al. Reference Jones, Sharopova, Lohar, Zhang, Vandenbosch and Walker2008). Several other studies have also investigated the transcriptional basis of seed development, differentiation, desiccation, plant responses to aluminium toxicity and changes in nitrogen nutrition using microarray chips (Buitink et al. Reference Buitink, Leger, Guisle, Vu, Wuilleme, Lamirault, Le Bars, Le Meur, Becker, Kuster and Leprince2006; Gallardo et al. Reference Gallardo, Firnhaber, Zuber., Hericher, Belghazi, Henry, Kuster and Thompson2007; Narasimhamoorthy et al. Reference Narasimhamoorthy, Bouton, Olsen and Sledge2007; Chandran et al. Reference Chandran, Sharopova, Ivashuta, Gantt, Vandenbosch and Samac2008; Ruffel et al. Reference Ruffel, Freixes, Balzergue, Tillard, Jeudy, Martin-Magniette, Van Der Merwe, Kakar, Gouzy, Fernie, Udvardi, Salon, Gojon and Lepetit2008; Verdier et al. Reference Verdier, Kakar, Gallardo, Le Signor, Aubert, Schlereth, Town, Udvardi and Thompson2008). Long-oligo arrays of M. truncatula have also been used effectively to identify the transcripts upregulated in alfalfa trichomes secreting the molecules during insect defence (Aziz et al. Reference Aziz, Paiva, May and Dixon2005). For providing microarray data relating to abiotic stress resistance, an expression database called MtED has been developed that contains gene-expression profiles of the roots of M. truncatula based on time-course salt–stress experiments using the Affymetrix Medicago GeneChip (Li et al. Reference Li, Su, Dong and Wang2009).
In peas, a microarray (Ps6kOLI1) consisting of 70-mer oligo probes targeting c. 5200 EST clusters, assembled predominantly from cotyledons under the Grain Legumes Integrated Project (GLIP) has been developed primarily for identifying genes relevant to seed formation. In soybean, high-density expression arrays containing 18 000 cDNAs (Shoemaker et al. Reference Shoemaker, Schlueter, Cregan and Vodkin2003) and low redundancy unigene sets of 27 513 clones have been constructed from cDNA libraries made from a wide range of organs, developmental stages, disease-challenged tissues and various stress conditions. These microarrays have been used to examine tissue-specific gene expression and global expression in mutant iso-lines. This led to the identification of sets of candidate genes potentially encoded or modulated by the mutant phenotype (Vodkin et al. Reference Vodkin, Khanna, Shealy, Clough, Gonzalez, Philip, Zabala, Thibaud-Nissen, Sidarous, Strömvik, Shoop, Schmidt, Retzel, Erpelding, Shoemaker, Rodriguez-Huete, Polacco, Coryell, Keim, Gong, Liu, Pardinas and Schweitzer2004). The micro-array tools developed in soybean have also been used successfully to identify genetic markers closely linked to soybean aphid (Aphis glycines Matsumura (Hemiptera: Aphididae)) resistance gene Rag1 (Kaczorowski et al. Reference Kaczorowski, Kim, Diers and Hudson2008), and genes involved in iron deficiency chlorosis response in soybean under iron-deficient conditions (O'Rourke et al. Reference O'Rourke, Charlson, Gonzalez, Vodkin, Graham, Cianzio, Grusak and Shoemaker2007). In chickpea, microarray expression analysis of putative defence-related ESTs resulted in isolation and analysis of candidate ascochyta blight defence genes (Coram & Pang Reference Coram and Pang2005a). In another study, 768-featured microarray comprising 559 chickpea cDNAs, 156 grasspea cDNAs, 41 lentil RGAs and 12 controls were used to study the transcriptional change in genes conferring tolerance to different abiotic stresses. This led to the identification of a number of genes differentiating tolerant and susceptible genotypes with respect to drought, cold and salinity (Mantri et al. Reference Mantri, Ford, Coram and Pang2007, Reference Mantri, Ford, Coram and Pang2010). These genes code for various functional and regulatory proteins and highlighted the complexity of abiotic stress-response mechanisms due to multiple gene control (Mantri et al. Reference Mantri, Ford, Coram and Pang2007). The expression of common genes indicated crosstalk in the genetic pathways involved in responses to stress (Mantri et al. Reference Mantri, Ford, Coram and Pang2010). Similarly, in lentil, a cDNA microarray approach has deciphered the ascochyta blight resistance genes (Mustafa et al. Reference Mustafa, Coram, Pang, Taylor and Ford2009).
RNAi and targeting induced local lesions in genomes (TILLING) for reverse genetics
Forward genetics begins with specific phenotypes and eventually aims at identifying the responsible genes. This can be followed either through map-based cloning or T-DNA and transpose insertional or insertion mutagenesis for cloning the genes. For example, in L. japonicus, transposon tagging helped to isolate a Sym gene (LjNin or LjSym20). This was the first gene that was isolated by the group of Jens Stougaard (University of Aarhus, Denmark). In the same species, two new Sym genes (LjSym1 and LjSym2) have been isolated through a map-based cloning approach. The LjSym2 gene encodes a receptor-like kinase (hence its name was changed to LjSymRK) (Endre et al. Reference Endre, Kereszt, Kevei, Mihacea, Kaló and Kiss2002). The mutant population generated through T-DNA and retrotransposon insertions is also an important resource for reverse genetics, where gene sequences or a protein with unknown function is associated with the mutated phenotype. For example, screening of a tobacco retrotransposon, Tnt1 mutagenized population by sequencing of tagged sites has led to the isolation of M. truncatula ‘Pim’ gene (Benlloch et al. Reference Benlloch, D'erfurth, Ferrandiz, Cosson, Beltran, Canas, Kondorosi, Madueno and Ratet2006).
RNAi- and virus-induced gene silencing are other important approaches of reverse genetics to understand the function of genes. Both methods can block genes that belong to a gene family or are expressed across a number of tissues and developmental organs where antisense gene technology fails to perform similarly (Allen et al. Reference Allen, Millgate, Chitty, Thistleton, Miller, Fist, Gerlach and Larkin2004). Virus-induced gene silencing has been used in pea (Constantin et al. Reference Constantin, Krath, Macfarlane, Nicolaisen, Johansen and Lund2004) and soybean (Tuteja et al. Reference Tuteja, Clough, Chan and Vodkin2004), and could potentially be used in many other legumes as well. RNAi-induced gene silencing is well established in soybean and other model legumes using stable transformation either through biolistics or Agrobacterium tumefaciens (Srinivasa Reddy et al. Reference Srinivasa Reddy, Dinkins and Collins2003; Ivashuta et al. Reference Ivashuta, Liu, Liu, Lohar, Haridas, Bucciarelli, Vandenbosch, Vance, Harrison and Gantt2005; Lim et al. Reference Lim, Ko, Lambert, Kim, Korban, Hartman and Domier2005; Subramanian et al. Reference Subramanian, Graham, Yu and Graham2005; Nunes et al. Reference Nunes, Vianna, Cuneo, Amaya-Farfan, De Cap Deville, Rech and Aragao2006), hairy root transformation (Jackson et al. Reference Jackson, Rokhsar, Stacey, Shoemaker, Schmutz and Grimwood2006) and transposon mutagenesis (Jackson et al. Reference Jackson, Rokhsar, Stacey, Shoemaker, Schmutz and Grimwood2006; Tadege et al. Reference Tadege, Wen, He, Tu, Kwak, Eschstruth, Cayrel, Endre, Zhao, Chabaud, Ratet and Mysore2008). These methods will be greatly aided by knowledge of the genome and open reading frames (ORFeome) (Jackson et al. Reference Jackson, Rokhsar, Stacey, Shoemaker, Schmutz and Grimwood2006). The above methods for reverse genetics require Agrobacterium-mediated transformation. Unfortunately, in legumes, functional gene validation by transformation is impractical due to the difficulty of transforming legume species using Agrobacterium. But at the same time, this situation makes legumes ideal candidates for use of TILLING or deletion-TILLING (de-TILLING) to study the function of gene sequence. In this case, an effective association can be worked out between gene repositories available in the public domain and the genetic variability available in natural germplasm or in induced mutant populations. Several ongoing projects are using TILLING or de-TILLING to study the system biology of legume plants (Cooper et al. Reference Cooper, Till, Laport, Darlow, Kleffner, Jamai, El- Mellouki, Liu, Ritchie, Nielsen, Bilyeu, Meksem, Comai and Henikoff2008; Porch et al. Reference Porch, Blair, Lariguet, Galeano, Pankhurst and Broughton2009; Ramos et al. Reference Ramos, Huntley, Maleki and Ozias-Akins2009). A recent review by Tadege et al. (Reference Tadege, Wang, Wen, Ratet and Mysore2009) provides updated information on TILLING resources in food legumes including the ongoing projects on reverse genetics. In a TILLING-based high-throughput genotyping project in M. truncatula, 3840 individually curate germplasm lines are used for SNPs in five separate genes of relevance to plant–microbe interactions, which have yielded from 4 to 9 mutant alleles/gene, at an average recovery rate of 1 lesion/kbp/351 germplasm lines. These 3840 germplasm lines are expected to yield 10–22 mutant alleles/gene, with additional alleles being recovered from more germplasm that is available but not included in initial screening (Tadege et al. Reference Tadege, Wang, Wen, Ratet and Mysore2009). Using the same procedure, c. 2000 individual germlines were generated in M. truncatula (VandenBosch & Stacey Reference Vandenbosch and Stacey2003), a species phylogenetically related to lentil. Similarly, a TILLING facility has also been set up in L. japonicus. For this purpose, a population of >40 000 mutants was developed through induced mutation by using ethyl methanesulfonate (EMS) comprising mutants defective in morphological, metabolic and nodule formation characters (Perry et al. Reference Perry, Wang, Welham, Gardner, Pike, Yoshida and Parniske2003, Reference Perry, Brachmann, Welham, Binder, Charpentier, Groth, Haage, Markmann, Wang and Parniske2009). Mutants with variant alleles of SYMRK and sucrose synthesis genes were also developed using TILLING (Stracke et al. Reference Stracke, Kistner, Yoshida, Mulder, Sato, Kaneko, Tabata, Sandal, Stougaard, Szczyglowski and Parniske2002; Horst et al. Reference Horst, Welham, Kelly, Kaneko, Sato, Tabata, Parniske and Wang2007).
High throughput sequencing/genotyping platforms
For breeding applications, new generation sequencing and genotyping platforms such as Solexa 1 Gbp, 454/FLX sequencing and Illumina GoldenGate assay have revolutionized plant functional genomic research. These platforms, an alternative to DNA arrays, can generate millions of ESTs per run for whole-genome expression analysis, identification of SNPs, candidate gene discovery and development of molecular markers (Varshney et al. Reference Varshney, Graner and Sorrells2005). Using these methods, millions of EST and transcriptomes have been generated in several legume species including M. truncatula (Benedito et al. Reference Benedito, Torres-Jerez, Murray, Andriankaja, Allen, Kakar, Wandrey, Verdier, Zuber, Ott, Moreau, Niebel, Frickey, Weiller, He, Dai, Zhao, Tang and Udvardi2008; Young & Udvardi Reference Young and Udvardi2009), pigeonpea, chickpea and groundnut (Varshney et al. Reference Varshney, Close, Singh, Hoisington and Cook2009a). These platforms are useful tools for discovery of SNPs with high sensitivity and capable of identifying >0·95 of variant sites (Harismendy et al. Reference Harismendy, Poulin, Strausberg, Wang, Stockwell, Beeson, Schork, Murray, Topol, Levy and Frazer2009), particularly in pulses which have a narrow genetic base. Several institutions are working to develop SNP markers in cowpea, pigeonpea, chickpea and groundnut using these tools (Varshney et al. Reference Varshney, Close, Singh, Hoisington and Cook2009a).
Bioinformatics tools and websites for accessing the genomic resources
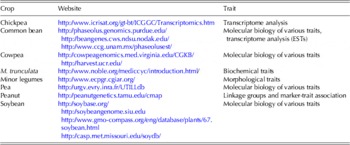
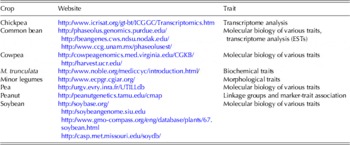
Information on legume genomic resources has been provided by various organizations as subsets within larger information resources. However, Beavis (Reference Beavis2004) made an effort to organize legume information resources on one web-based platform and summarized them as multispecies and species-specific information resources, making legume genomic resources more easily available. A number of other websites also provide information on genomic resources available for different legumes species (Table 3). The Cowpea Genespace/Genomics Knowledge Base (CGKB) database was developed under the Cowpea Genomics Initiative (CGI) programme; it contains information derived from 298 848 cowpea genespace sequences (GSS) isolated by methylation filtering of genomic DNA (Chen et al. Reference Chen, Liu, Kuo, Chein, Sun, Huang, Lin and Ku2007a, Reference Chen, Laudeman, Rushton, Spraggins and Timkob). M. truncatula databases have been developed in TRUNCATULIX, which integrates five public databases for gene sequences and gene annotations, as well as a database for microarray expression data covering raw data, normalized datasets and complete expression profiling experiments. This database is freely available online (http://lily.cebitec.uni-bielefeld.de/truncatulix/app, verified 11 May 2011). It can be accessed via an AJAX-based web interface using a standard web browser. For the first time, users can now search quickly for specific genes and gene-expression data in a huge database based on high-quality annotations. The results can be exported as Excel, HTML or as CSV files for further usage (Henckel et al. Reference Henckel, Runte, Bekel, Dondrup, Jakobi, Küster and Goesmann2009). Software called as SeqTrim, has been developed, which can be used as a high-throughput pipeline for pre-processing any type of sequence read (Falgueras et al. Reference Falgueras, Lara, Fernández-Pozo, Cantón, Pérez-Trabado and Claros2010). BAC end sequences or low-pass shotgun sequencing provides a glimpse of local gene content. Here, bioinformatics tools are vital for gene prediction and annotation, and exploitation of syntenic relationships.
List of website having databases of various legume species (URLs verified 11 May 2011)
Development of random genomic and functional markers
Genomic resources developed allow legume breeders to develop both random genomic (SSR, inter simple sequence repeats (ISSR), AFLP and RFLP) and functional or perfect (EST-SSR) markers. Among these markers, polymerase chain reaction (PCR)-based SSR and SNP markers are considered more practical, i.e. easy to handle and do not require specific equipment or skilled technicians. These markers also have a high level of polymorphism and reproducibility. In legumes, these markers are in use in several crops including cowpea (768 BAC end sequence (BES)-SSRs), chickpea (510 genomic SSRs and 1655 BES-SSRs), pigeonpea (130 genomic SSRs), groundnut (700 genomic SSRs and >2000 EST-SSRs), lentil (c. 100 genomic SSRs) and common bean (c. 500 genomic and EST-SSRs) (Varshney et al. Reference Varshney, Close, Singh, Hoisington and Cook2009a), and in soybean (6920 EST-SSRs; Hwang et al. Reference Hwang, Sayama, Takahashi, Takada, Nakamoto, Funatsuki, Hisano, Sasamoto, Sato, Tabata, Kono, Hoshi, Hanawa, Yano, Xia, Harada, Kitamura and Ishimoto2009). But many more such markers need to be developed. For example, the Pigeonpea Genomics Initiative (PGI) was launched in November in 2006 by the Indian Council of Agricultural Research (ICAR) and the Government of India, under the umbrella of Indo-US Agricultural Knowledge Initiative (AKI). This programme led to the development of SSR (>3000), SNP and diversity array technology (DArT) (>15 000 features) markers (Varshney et al. Reference Varshney, Penmetsa, Dutta, Kulwal, Saxena, Datta, Sharma, Rosen, Carrasquilla-Garcia, Farmer, Dubey, Saxena, Gao, Fakrudin, Singh, Singh, Wanjari, Yuan, Srivastava, Kilian, Upadhyaya, Mallikarjuna, Town, Bruening, He, May, Mccombie, Jackson, Singh and Cook2010a). The progress has also been noted in other pulses (Torres et al. Reference Torres, Avila, Gutierrez, Palomino, Moreno and Cubero2010).
The use of functional markers is of great interest to plant breeders as a huge amount of genomic sequences are junk DNA or repetitive sequences. Over the last few years, functionally characterized genes, ESTs and coding genome sequences have also become available to build molecular markers like SNP, SSR or conserved orthologous sets (COS) (Varshney et al. Reference Varshney, Graner and Sorrells2005). For example, use of the sequences of RGAs or resistance-gene candidates (RGACs) have been transformed into molecular markers including RGA polymorphism (Mutlu et al. Reference Mutlu, Miklas and Coyne2006), NBS profiling (van der Linden et al. Reference Van Der Linden, Wouters, Mihalka, Kochieva, Smulders and Vosman2004), cleavage amplification polymorphism (CAP) (Quint et al. Reference Quint, Mihaljevic, Dussle, Xu, Melchinger and Lübberstedt2002) and derived CAPs (dCAPs) (Komori & Nitta Reference Komori and Nitta2005). RGAs belonging to NBS gene families were recently isolated and characterized in faba bean and chickpea (Palomino et al. Reference Palomino, Satovic, Cubero and Torres2006). dCAPs and CAPs developed from 10 RGA classes have been used to explore the presence of SNPs and map them into the available faba bean, pea and chickpea mapping populations (Palomino et al. Reference Palomino, Fernández-Romero, Rubio, Torres, Moreno and Millán2009; Torres et al. Reference Torres, Avila, Gutierrez, Palomino, Moreno and Cubero2010).
UTILIZATION OF GENOMICS IN LEGUME IMPROVEMENT
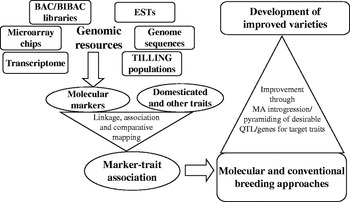
The use of genomics and functional genomics in lentil and chickpea breeding is reviewed in detail by Muehlbauer et al. (Reference Muehlbauer, Cho, Sarker, Mcphee, Coyne, Rajesh and Ford2006) and Coram et al. (Reference Coram, Mantri, Ford and Pang2007). In other legumes, a vast amount of genomic resources are available in the public domain. Plant breeders can exploit these genomic resources along with the available genetic resources, using different approaches (Fig. 1).
Strategies to use legume genomic resources for improvement of food legumes.

Marker-assisted diversity analysis
Crop improvement requires the presence of genetic diversity within the cultivated gene-pool. Understanding of crop genetic diversity helps in selecting diverse parental lines for generating segregating populations with more variability, broaden the genetic base of germplasm by introgressing genes from wild relatives, and conservation of landraces. Different kinds of molecular markers have been used to study genetic diversity in a number of food legume crops involving a set of cultivated and wild accessions (Ford et al. Reference Ford, Le Roux, Itman, Brouwer and Taylor2002; Seehalak et al. Reference Seehalak, Tomooka, Waranyuwat, Thipyapong, Laosuwan, Kaga and Vaughan2006; Yang et al. Reference Yang, Pang, Ash, Harper, Carling, Wenzl, Huttner, Zong and Kilian2006; Zong et al. Reference Zong, Redden, Liu, Wang, Guan, Liu, Xu, Liu, Gu, Yan, Ades and Ford2009; Ahmad et al. Reference Ahmad, Khan, Awan, Sadia, Sadaqat and Bahadur2010). Assessment of genetic diversity helps identify and rescue genetic resources at risk of extinction (Polegri & Negri Reference Polegri and Negri2010). For example, in cowpea, landraces from Umbria (Italy) were initially characterized for morphological, organoleptic and genetic traits and reintroduced among farmers. This led to an expansion of the area under land races and increased farmers’ income. To further encourage cultivation of land races, a request for the Protected Designation of Origin (PDO) status was initiated and studies conducted using AFLP markers with the aim of certifying that land races used in farmers’ fields actually belonged to the local traditional agricultural and cultural context. The genetic diversity and phylogenetic analysis based on AFLP markers classified the local land races and others into two separate groups, suggesting that farmers conserved those land races (Polegri & Negri Reference Polegri and Negri2010). There is a general perception among the scientists that current genetic improvement methods lead to narrowing down of the cultivated gene-pool due to the limited use of diversity. However, genetic diversity estimates using molecular markers in different crops including pea as representative of pulse crops demonstrates that no gain or reduction of genetic diversity has occurred in the last five decades (van de Wouw et al. Reference Van De Wouw, Van Hinten, Kik, Van Treuren and Visser2010).
Harnessing the desirable variability of wild relatives
Wild species/relatives are the reservoirs of genes conferring resistance to many biotic and abiotic stresses. However, their transfer from wild species to elite cultivars through conventional breeding has been limited, mainly due to the associated transfer of undesired alleles (linkage drag). It is now feasible to recover/transfer the favourable alleles in elite germplasm that were left behind by the domestication process more efficiently using molecular maps and integrative QTL analysis (for details, see Chamarthi et al. Reference Chamarthi, Kumar, Voung, Blair, Gaur, Nguyen, Varshney, Pratap and Kumar2010). There are two approaches: the first is to construct introgression libraries that are made up of several introgression lines (ILs). These lines are developed by successive backcrossing (generally three to four generations) of F1s derived from wild×cultivated lines. As a result, the donor genome (from the wild species) is distributed over the whole genome in the introgression lines and the impacts of these fragments on phenotypic expression can be studied. A few attempts to develop such libraries have been made in soybean using wild soybean species (Glycine soja) (Concibido et al. Reference Concibido, La Vallee, Mclaird, Pineda, Meyer, Hummel, Yang, Wu and Delannay2003) and in peanut from synthetic tetraploids (Foncéka et al. Reference Foncéka, Hodo-Abalo, Rivallan, Faye, Sall, Ndoye, Fávero, Bertioli, Glaszmann, Courtois and Francois Rami2009). The second approach is to use advanced-backcross QTL (AB-QTL) analysis for detecting additive, dominant, partially dominant and over-dominant QTL (Tanksley & Nelson Reference Tanksley and Nelson1996). This approach also employs repeated backcrossing with the elite parent in wild×cultivated species crosses in order to decrease the number and size of the exotic introgressions. This reduces the burden of linkage drag and advanced backcrossed populations (BC2F2 or BC2F3) are used to identify desirable genes/QTL through QTL analysis. Thus, it leads to simultaneous discovery of QTL and generation of introgression lines. Once favourable QTL alleles are identified, only a few additional marker-assisted generations are required to develop full near-isogenic lines (NILs) that can be field-tested and used for varietal development. The AB-QTL approach has been used successfully in common bean and soybean (Blair et al. Reference Blair, Pedraza, Buendia, Gaitan-Solis, Beebe, Gepts and Tohme2003; Chaky et al. Reference Chaky, Specht and Cregan2003).
Testing the hybridity of F1 plants
Making crosses between diverse parents is difficult in practice in food legume crops, especially lentil, where flower size is too small. As a result, it increases the chances of selfing. Moreover, differentiating F1 plants from selfed ones also becomes difficult due to low phenotypic diversity between the crossed plants. In this situation, molecular markers can be used to identify F1 plants and generate a true segregating F2 population for selection of desirable plants and avoiding segregation distortion. Recently, this has been applied successfully in lentil: 0·21 F1 plants were identified as true F1 plants, with the remainder being either selfed or admixtures (Solanki et al. Reference Solanki, Singh and Kumar2010). These results suggest that molecular markers can reduce the time and money required to grow a population from selfed or admixed plants and increase the efficiency of plant breeders in selection of recombinant plants (Solanki et al. Reference Solanki, Singh and Kumar2010).
Genetic dissection of network of genes underlying the complex traits (QTL analysis)
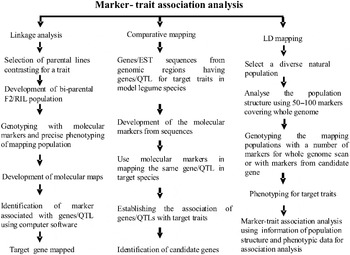
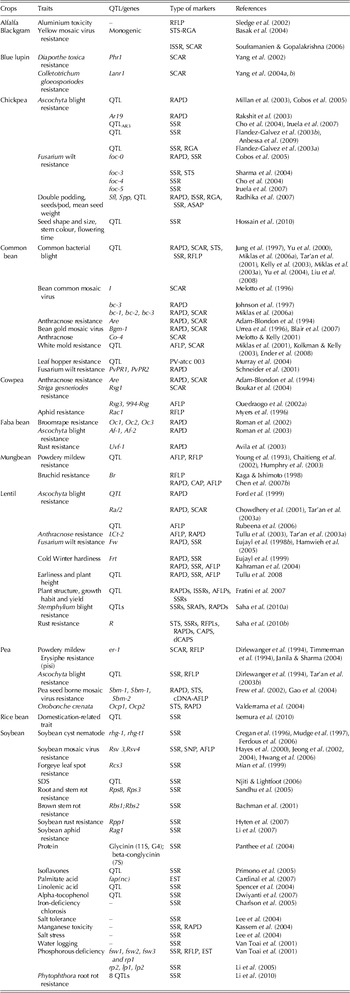
Markers can be used to decipher the network of genes underlying a complex trait. For this purpose, molecular maps developed in a number of legume species can be utilized as a reference map. Plant breeders can use the mapped markers to develop the framework linkage map from a trait-specific mapping population. This will help to identify markers associated with genomic regions contributing as major loci or interacting with environments (Kulwal et al. Reference Kulwal, Singh, Balyan and Gupta2004). Individual QTL is designated as major or minor or environment-responsive QTL if it expresses in a particular environment. Major QTL generally account for a relatively larger phenotypic variation (R 2>0·20) and minor for a small (R 2<0·20) variation. In general, traditional linkage mapping, association mapping and comparative genomics are routinely used methods for establishing the marker-trait association in food legume crops (Fig. 2). The traditional linkage mapping has been used to map a number of genes/QTL controlling both quantitative and qualitative traits (see Table 4 for references). It involved the use of biparental mapping population and focused to map the major genes controlling resistance to diseases and insect-pests. Among food legumes, it was first used in pea and cowpea (Adam-Blondon et al. Reference Adam-Blondon, Sévignac, Bannerot and Dron1994; Dirlewanger et al. Reference Dirlewanger, Isaac, Ranade, Belajouza, Cousin and De Vienne1994; Timmerman et al. Reference Timmerman, Frew, Weeden, Miller and Goulden1994). In order to identify a network of genes controlling a trait of interest, there is a need to prepare dense molecular maps and hence the efforts are now focused on development of such maps in soybean (Hwang et al. Reference Hwang, Sayama, Takahashi, Takada, Nakamoto, Funatsuki, Hisano, Sasamoto, Sato, Tabata, Kono, Hoshi, Hanawa, Yano, Xia, Harada, Kitamura and Ishimoto2009), common bean (Hanai et al. Reference Hanai, Santini, Camargo, Fungaro, Gepts, Tsai and Vieira2010) and chickpea (Nayak et al. Reference Nayak, Zhu, Varghese, Datta, Choi, Horres, Jüngling, Singh, Kavi Kishor, Sivaramakrishnan, Hoisington, Kahl, Winter, Cook and Varshney2010).
Flow diagram of different methods of marker-trait association analysis.

Molecular markers linked to desirable genes/QTL for MAS in legumes

During mapping, it becomes important to identify the closely linked markers so that these can be utilized in breeding programmes; therefore a distance of <5 cM between marker and target gene/QTL has been suggested as useful (Michlmore Reference Michlmore1995). Traditional linkage mapping usually localized a QTL within a 10–20 cM interval due to the use of a bi-parental mapping population that involves few recombination events occurring during their construction (Doerge Reference Doerge2002; Holland Reference Holland2007). Therefore, further fine mapping is required to identify the tightly linked markers for MAS and cloning of gene (Price Reference Price2006). Association mapping or linkage disequilibrium (LD) mapping provides high-resolution mapping between the marker and QTL-controlling target traits (i.e. within 1–2 cM intervals or within gene) due to the use of a natural population, which is developed after several rounds of recombination events occurring over a period of years (Risch & Merikangas Reference Risch and Merikangas1996; Nordborg & Tavare Reference Nordborg and Tavare2002). Moreover, its use also reduces the time required for development of biparental mapping population and identifies greater numbers of alleles (Yu & Buckler Reference Yu and Buckler2006). This can be performed as (i) candidate-gene association mapping where the associations between selected candidate genes and target traits are studied and (ii) genome-wide association mapping or genome scan where genetic variation in the whole genome is surveyed and associated with complex traits (Risch & Merikangas Reference Risch and Merikangas1996). For this purpose, only a few markers (50–100) distributed on the whole genome are utilized first for analysis of population structure of a diverse natural population comprising 100–500 individuals. The information obtained from population structure analysis and precise phenotypic data on target traits obtained over the environments are used to analyse the marker–trait association (for details, see Rafalski Reference Rafalski2010). In association mapping, diverse recombinant inbred lines (RILs) derived from several high-resolution biparental populations having one parent common can be used to afford very high resolution and power to detect those kinds of associations involving epistatic interactions. This approach, often known as nested association mapping, reduces the linkage disequilibrium (LD) and avoids population structure. Another advantage of this approach is that it allows a new trait to be mapped immediately by taking the new phenotype measurements, because very high-density genotypic data are already available on each biparental population (McMullen et al. Reference Mcmullen, Kresovich, Villeda, Bradbury, Li, Sun, Flint-Garcia, Thornsberry, Acharya, Bottoms, Brown, Browne, Eller, Guill, Harjes, Kroon, Lepak, Mitchell, Peterson, Pressoir, Romero, Rosas, Salvo, Yates, Hanson, Jones, Smith, Glaubitz, Goodman, Ware, Holland and Buckler2009). Thus, a new allele of QTL can be mined for complex traits through association mapping (Zhu et al. Reference Zhu, Gore, Buckler and Yu2008). Despite this, little effort has been made to deploy it in legume species except for a few studies (Huh& Huh Reference Huh and Huh2001; Smýkal et al. Reference Smýkal, Hýbl, Corander, Jarkovský, Flavell and Griga2008; Kwak & Gepts Reference Kwak and Gepts2009; Vir et al. Reference Vir, Bhat and Lakhanpaul2009). A candidate gene-based approach has been used successfully to map different loci for iron deficiency chlorosis (Wang et al. Reference Wang, Sato, Tabata and Kawasaki2008), and several candidate genes implicated in oleate biosynthesis have been mapped and their co-segregation with oleate and linoleate QTL investigated in soybean (Bachlava et al. Reference Bachlava, Dewey, Burton and Cardinal2009). Association mapping undoubtedly has great potential for legumes because large collections of global germplasm accessions are available for several grain legumes (Varshney et al. Reference Varshney, Close, Singh, Hoisington and Cook2009a). Fortunately, candidate-gene sequences for various complex traits are now available in several model species, which can be used to develop functional markers for association mapping of specific traits (Palomino et al. Reference Palomino, Fernández-Romero, Rubio, Torres, Moreno and Millán2009; Torres et al. Reference Torres, Avila, Gutierrez, Palomino, Moreno and Cubero2010). The high throughput next generation sequencing and genotyping technologies markedly reduced the cost of SNPs (Hirschhorn & Daly Reference Hirschhorn and Daly2005; Syvanen Reference Syvanen2005) and DArT markers (used in pigeonpea for diversity analysis; Yang et al. Reference Yang, Pang, Ash, Harper, Carling, Wenzl, Huttner, Zong and Kilian2006), leading to the possibility of genome-wide association mapping for complex traits in chickpea, common bean and soybean.
In legumes, the close phylogenetic relationship has also paved the way for cross-species mapping of genes/QTL for complex domesticated traits such as pod dehiscence, stem height, root mass, harvest index, seed dormancy, seed size and seed-quality characters. At least 15 qualitative and quantitative genes are known to control such traits (Weeden Reference Weeden2007). QTL analysis studies also demonstrate that a few QTLs control a large proportion of the phenotypic variability seen in domesticated traits. This is seen in, e.g. common bean, where three different QTLs collectively explain 0·36–0·48 of variation for seed weight and length (Park et al. Reference Park, Coyne, Jung, Skroch, Arnaud-Santana, Steadman, Ariyarathne and Nienhuis2000) and the contribution of the environment was observed to be relatively small. For seed size, a major gene distinguished wild progenitor and cultivated descendant in cowpea and mungbean (Fatokun et al. Reference Fatokun, Menancio-Hautea, Danesh and Young1992). The genes controlling different traits of domestication syndrome are shown to be frequently clustered or linked within the genome in legumes and several other crops. In common bean, the genes responsible for domestication syndrome were clustered in only three genomic locations that separately control growth habit and flowering time, seed dispersal and dormancy, and pod and seed size (Koinange et al. Reference Koinange, Singh and Gepts1996). At the same time, for some traits, apparent clustering may be the result of a single gene with pleiotropic effects (Johnson et al. Reference Johnson, Menendez, Nodari, Koinange, Magnusson, Singh and Gepts1996; Koinange et al. Reference Koinange, Singh and Gepts1996; Xiong et al. Reference Xiong, Liu, Dai, Xu and Zhang1999; Poncet et al. Reference Poncet, Lamy, Devos, Gale, Sarr and Robert2000). However, with the increasing number of examples of linked domestication traits, it is unlikely that pleiotropy is the sole explanation for clustering of domestication syndrome loci (Park et al. Reference Park, Coyne, Jung, Skroch, Arnaud-Santana, Steadman, Ariyarathne and Nienhuis2000). It has been shown that loci controlling the domesticated traits are conserved because they are involved in adaptation and hence are favoured during selection. For example, a seed weight QTL mapped in cowpea was found apparently conserved in cowpea and mungbean on similar locations (Fatokun et al. Reference Fatokun, Menancio-Hautea, Danesh and Young1992). A comparative study between common bean, cowpea and mungbean suggested that a seed weight QTL associated with Phs locus coding the most abundant seed storage protein (phaseolin) in common bean has a putative orthologue in mungbean (Johnson et al. Reference Johnson, Menendez, Nodari, Koinange, Magnusson, Singh and Gepts1996). Interestingly, a similar candidate for orthology was not identified in cowpea. Maughan et al. (Reference Maughan, Saghai-Maroof and Buss1996) identified a different soybean seed weight locus with a potential counterpart in cowpea. Moreover, comparative genomics using molecular markers linked with QTL for domesticated traits reveal whether two crops have same or different pattern of genes/QTL. In pea, a different set of genes was used to produce the same or similar phenotypic changes when compared with common bean, which demonstrate that relatively few genes appear to have been modified during its domestication (Weeden Reference Weeden2007). Comparative genomics has also helped to develop a QTL conditioning resistance to Ascochyta rabiei in chickpea (Bian et al. Reference Bian, Ford, Han, Coram, Pang and Taylor2007). Thus, similar gene patterns for trait(s) among different species can facilitate the use of marker-trait association from one species to other related crop species in marker-assisted breeding or cloning of the economically important genes.
Deployment of marker-trait association in breeding programmes (MAS)
Gene pyramiding is a pragmatic approach to achieving multiple and durable resistance (Shi et al. Reference Shi, Chen, Li, Zheng, Zhang and Hou2009). It is often cited that genetic markers can be deployed to identify and select specific genes or combine multiple-resistance genes (Gupta et al. Reference Gupta, Kumar, Mir and Kumar2010). It has been successfully demonstrated in soybean for stacking the genes controlling resistance to CSN (Concibido et al. Reference Concibido, Diers and Arelli2004). Its use in this crop has been shown to be cost-effective compared to greenhouse screening, and has increased the efficiency and speed of developing cultivars resistant to CSN (Concibido et al. Reference Concibido, Diers and Arelli2004). Also QTL/genes controlling tolerance to Phytophthora root rot and resistance to soybean mosaic virus have been pyramided in this crop (Shi et al. Reference Shi, Chen, Li, Zheng, Zhang and Hou2009; Li et al. Reference Li, Han, Teng, Zhang, Yu, Poysa, Anderson, Ding and Li2010). More efforts are required to use marker-assisted pyramiding in other food legumes as well. Marker-assisted backcrossing and marker-assisted recurrent selection are being utilized for introgressing/pyramiding QTL/genes for drought-related traits and resistance to diseases (Fusarium wilt and Ascochyta blight) in elite lines of chickpea at the International Crops Research Institute for the Semi-Arid Tropics (ICRISAT) and Indian Institute of Pulses Research (IIPR) in collaboration with other partners (Chamarthi et al. Reference Chamarthi, Kumar, Voung, Blair, Gaur, Nguyen, Varshney, Pratap and Kumar2010).
Increased knowledge about marker-trait association is useful to conventional plant breeders for developing improved cultivars through MAS. The direct manipulation of the genomic regions having positive additive effects on traits of interest can lead to maximum potential genetic gains through MAS for traits having low heritability and difficulties in scoring. In common bean, several lines have been developed using MAS for resistance to rust (Stavely Reference Stavely2000; Faleiro et al. Reference Faleiro, Ragagnin, Carvalho, Paula-Júnior, Moreira and Barros2001), anthracnose (Alzate-Marin et al. Reference Alzate-Marin, Menarim, De Arruda, Chagas, De Barros and Moreira1999) and bean golden yellow mosaic virus (Miklas Reference Miklas2002). Similarly, MAS for angular leaf-spot resistance was found to be effective when three genes were introgressed using RAPD and sequence characterized amplified region (SCAR) markers in this crop (de Oliveira et al. Reference De Oliveira, Alzate-Marin, Borem, De Azeredo Fagundes, De Barros and Moreira2005). In addition, MAS for two QTLs residing on separate linkage groups in common bean have been shown to be effective in enhancing white mould resistance (Ender et al. Reference Ender, Terpstra and Kelly2008). In another study, MAS for a major QTL associated with root–rot resistance was found to be effective and it has given realized gain in plant biomass and vigour traits associated with root–rot complex in snap bean (Navarro et al. Reference Navarro, Sass and Nienhuis2009). In soybean, MAS has proven effective for major genes controlling four-seeded pods (Zhu & Sun Reference Zhu and Sun2006). However, no significant improvement has been observed through marker-assisted introgression of QTL for multiple branching in common bean (Fazio et al. Reference Fazio, Chung and Staub2003) and for complex traits such as yield in soybean (Reyna & Sneller Reference Reyna and Sneller2001), probably due to epistatic interactions. At present, both the public and private sectors are actively involved in development of improved cultivars using MAS, the prime objective of molecular breeding. Consequently, in common bean, an improved line USPT-ANT-1 carrying Co-42 gene has been registered as resistant to all the known North American races of anthracnose (Miklas et al. Reference Miklas, Kelly and Singh2003a). Similarly, the SCAR markers SAP6 (Miklas et al. Reference Miklas, Coyne, Grafton, Mutlu, Reiser, Lindgren and Singh2003b) and SU91 (Pedraza et al. Reference Pedraza, Gallego, Beebe, Tohme, Singh and Voysest1997), tightly linked with QTL controlling bacterial blight resistance, have been used to develop a germplasm line, USDK-CBB-15, through MAS. This line possesses the two major QTLs mentioned above, which enabled combat of this severe disease problem in the U.S. (Miklas et al. Reference Miklas, Kelly, Beebe and Blair2006b). Successful utilization of MAS has also resulted in development of improved cultivars in soybean and common bean, although trait mapping using molecular markers has been done in different legume species. In these crops, a number of cultivars developed through MAS have been released in the recent past (Table 5; Chamarthi et al. Reference Chamarthi, Kumar, Voung, Blair, Gaur, Nguyen, Varshney, Pratap and Kumar2010).
Improved line/cultivars of soybean and common bean developed and released in USA using molecular breeding approaches

FUTURE DIRECTIONS
Significant progress has been made in recent years in developing genomic resources in model (L. japonicus and M. truncatula) and other major food legumes. However, more genomic resources will be required in the less-studied food legume crops (Varshney et al. Reference Varshney, Glaszmann, Leung and Ribaut2010b). Many biotic and biotic stresses can result from overexpression of gene(s) in a specific genetic context. More studies are needed, using microarray chips, transcriptome analysis and differential display, to explore gene overexpression systematically. The tools and techniques of functional genomics are valuable for isolation and identification of genes controlling traits of interest, and there is a need to promote widespread use in food-legume breeding. Microarrays can help answer the questions related to overexpression of genes of interest in different experimental conditions and to study their level of expression on large scale, but require highly skilled manpower and a well-established laboratory. To answer these questions, quantitative real-time-PCR (qRT-PCR) is the current method of choice and is also used to confirm microarray results (Mustafa et al. Reference Mustafa, Coram, Pang, Taylor and Ford2009). Use of RNAi and virus induce gene silencing (VIGS) for suppression of the gene function and overexpression of desirable genes requires development of transgenic plants. Application of these functional genomic tools for testing the functionality of candidate genes or other genes having unknown function will be greatly accelerated once it becomes routinely possible to regenerate transgenic plants in food legume crops. This will also help to generate transgenic populations created by insertion of T-DNA and transposable elements, which will serve as reverse-genetic resources for TILLING. In future, more efforts are needed to develop genetic-transformation protocols in legume crops. Induced mutation has been used to develop mutant populations in a few legumes. There is a need to develop such populations in other food legumes, and to use these populations as reverse-genetic resources for TILLING. These efforts should target a range of legume crops other than soybean, chickpea, cowpea, common bean and pigeonpea.
Plant breeders in association with molecular biologists can use these genomic resources to develop molecular markers. High-throughput sequencing can accelerate the development of polymorphic markers in legumes with a narrow genetic base. A wider range of dense maps with well-distributed molecular markers needs to be developed as a first step in identifying marker-trait associations. Candidate genes or tightly linked markers for resistance/tolerance to biotic and abiotic stresses can be identified through freely accessible germplasm collections capturing natural variability in different crop species, availability of gene sequences having unknown functions and availability of advanced molecular tools and techniques in the public domain, using association mapping and Eco-TILLING approaches.
Plant breeders are often concerned with the improvement of complex traits. A new approach called ‘genome-wide selection’ (GWS) or ‘genomic selection’ (GS), based on genome-wide marker profiling, can accelerate the genetic improvement of such traits. In this approach, superior progeny lines are selected for advancement in the breeding cycle on the basis of breeding values of progenies estimated using both genotypic and phenotypic data (Heffner et al. Reference Heffner, Sorrells and Jannink2009; Jannink et al. Reference Jannink, Lorenz and Iwata2010). Thus, QTL analysis for working out marker-trait associations is not needed (Bernardo Reference Bernardo2010a, Reference Bernardob; Tester & Langridge Reference Tester and Langridge2010).
The availability of high-throughput and cost-effective genotyping platforms, combined with automation in phenotyping methodologies, will increase the use of genomic tools in breeding programmes. There is a need to strengthen infrastructure and facilities for MAS that are still lacking. Development of highly polymorphic and reproducible markers such as SSR and SNP in marker-trait association analysis is a prerequisite for routine use of MAS. Interaction between biotechnologists and plant breeders should be enhanced in order to use MAS more systematically and efficiently. Overcoming these barriers may facilitate the use and handling of complex genomic datasets and the development of improved cultivars. Training for the next generation of scientists can span the ‘gap’ between genomics and breeding. Such training efforts are underway at several centres including ICRISAT and IIPR in India, Saskatoon Canada, the French National Institute for Agricultural Research (INRA), the International Center for Agricultural Research in the Dry Areas (ICARDA) in Syria and the US Department of Agriculture (USDA) in the USA: MAS has been included in breeding programmes despite several difficulties such as underestimation of QTL effects, genetic background effects and interactions on introgression of gene/QTL in diverse germplasm. However, young plant breeders and biotechnologists are aware of the power of MAS as a tool; and this bodes well for the future.
We sincerely acknowledge efforts of Mr Ajay Varadachary, Science Writer/Editor, CODIS, Aleppo, Syria for improving the quality of submitted manuscript by thorough editing.