

Introduction
The Brazilian semi-arid region occupies an area of approximately 1 million km2 that is mainly characterised by an average annual rainfall of less than 800 mm, high potential evapotranspiration and an aridity index of 0.5 or a drought risk of more than 60% (Sampaio, Reference Sampaio, Bullock, Mooney and Medina1995; Brasil, 2005). The northern region of Minas Gerais State is located within this environment and represents a transition area of difficult phytogeographical characterisation. The landscape observed is the result of the interaction between two major biomes: Caatinga and Cerrado (Brandão, Reference Brandão, Mendonça and Lins2000). Cerrado is a Brazilian savanna biome covering 23% of the country, and is one of the least-studied biomes in the world (Furley, Reference Furley1999; Machado et al., Reference Machado, Aguiar, Castro, Nogueira, Ramos-Neto, Faleiro and Farias-Neto2008). It has a significant number of endemic species and is considered a hotspot for the conservation of biodiversity in Brazil (Myers et al., Reference Myers, Mittermeier, Mittermeier, Fonseca and Kent2000). The situation for the Caatinga biome is very similar. Caatinga occupies 11% of the national territory and, despite being the only exclusively Brazilian biome, it is among the most degraded (Castelletti et al., Reference Castelletti, Silva, Tabarelli, Santos, Silva, Tabarelli, Fonseca and Lins2003). This biome, represented by scrub and dry forests (Sampaio, Reference Sampaio, Bullock, Mooney and Medina1995), has a considerable number of endemic species, about which there is currently little zoological and botanical knowledge (Castelletti et al., Reference Castelletti, Silva, Tabarelli, Santos, Silva, Tabarelli, Fonseca and Lins2003).
In this ecotonal region, different phytophysiognomies are observed. The savanna formations are interrupted by dry tropical forests (Ribeiro & Walter, Reference Ribeiro, Walter, Sano and Almeida1998) that are associated with interfluves, which are physiognomies that primarily occur in association with well-drained land, while riparian forest occurs in association with watercourses (Oliveira-Filho et al., Reference Oliveira-Filho, Ratter and Shepherd1990; Ribeiro & Walter, Reference Ribeiro, Walter, Sano and Almeida1998; Pinto et al., Reference Pinto, Oliveira-Filho and Hay2005). These riparian forests are characterised by great environmental heterogeneity resulting from physical factors such as topographic and soil variations (Oliveira-Filho et al., Reference Oliveira-Filho, Curi, Vilela and Carvalho2001; Budke et al., Reference Budke, Jarenkow and Oliveira-Filho2006; Costa-Filho et al., Reference Costa-Filho, Nanni and Campos2006) as well as biotic factors such as the influence of adjacent vegetation (Bertani et al., Reference Bertani, Rodrigues, Batista and Shepherd2001), resulting in a mosaic vegetation of high floristic diversity (Rodrigues & Leitão-Filho, Reference Rodrigues and Leitão-Filho2000). The ecological and evolutionary importance of these biomes is great because they are considered important biodiversity repositories (Oliveira-Filho & Ratter, Reference Oliveira-Filho and Ratter1995). Similarly, the contribution of this vegetation to controlling water quality is paramount because it regulates nutrient levels (Martin et al., Reference Martin, Noel and Federer1984).
Although they are protected by Brazilian environmental legislation, the riparian forests have been altered by agricultural activities associated with the use of fires for farmland clearing and wood extraction. This has led to the degradation and fragmentation of these environments (Battilani et al., Reference Battilani, Scremin-Dias and Souza2005). Thus, detailed studies on the floristic composition and ecology of the remnant riparian forests are critical to support protection and recovery initiatives for such vegetation (Van den Berg & Oliveira-Filho, Reference Van den Berg and Oliveira-Filho2000). A knowledge of forest regeneration processes gives us an opportunity to understand how various species will eventually occupy the upper stratum through succession (Barreira et al., Reference Barreira, Scolforo, Botelho and Mello2002).
The early life stages of plants are determined by strong environmental influences, including both intra- and inter-specific competition and various environmental stresses (Ponge et al., Reference Ponge, André, Zackrisson, Bernier, Nilsson and Gallet1998). The abundance of species decreases towards the extremes of a gradient, with factors such as light and nutrients (Rodrigues et al., Reference Rodrigues, Carvalho, Oliveira-Filho and Curi2007) determining the establishment of individuals in more favourable micro-sites (Oliveira-Filho et al., Reference Oliveira-Filho, Ratter and Shepherd1990, Reference Oliveira-Filho, Vilela, Carvalho and Gavilanes1994a). Differences in soil characteristics and variations in topography correspond to differences in floristic composition and plant community structure (Oliveira-Filho et al., Reference Oliveira-Filho, Ratter and Shepherd1990, Reference Oliveira-Filho, Vilela, Carvalho and Gavilanes1994a; Scarano et al., Reference Scarano, Ribeiro, Moraes and Lima1997). Studies that seek to determine the preferred habitat of species generate knowledge that can be used for the restoration of degraded areas (Oliveira-Filho et al., Reference Oliveira-Filho, Vilela, Carvalho and Gavilanes1994a). Hence, our study aimed to answer the following questions: (i) what is the structure, diversity and composition of the regenerating shrub-tree community along a stretch of riparian vegetation in an ecotonal area in relation to environmental heterogeneity, and (ii) which environmental variables tested (soil, light and flooding regime) affect the distribution of regenerating species?
Materials and Methods
Study area
This study was conducted at Vida Silvestre Refuge in the Environmental Protection Area of Pandeiros River, municipality of Januária, north of Minas Gerais, Brazil. This environmental protection area covers 393,060 hectares representing the entire Pandeiros River basin, including the Januária, Bonito de Minas and Cônego Marinho municipalities; it is the largest sustainable conservation area in the state of Minas Gerais, preserving the only swampland in the state (Azevedo et al., Reference Azevedo, Nunes, Veloso, Neves and Fernandes2009). The Pandeiros River is part of the São Francisco basin (middle São Francisco), which is considered a major tributary of the left bank of this river (Azevedo et al., Reference Azevedo, Nunes, Veloso, Neves and Fernandes2009).
The vegetation bordering the Pandeiros River exhibits remarkable diversity of ecosystems due to the transitional effect between the Cerrado and Caatinga biomes, which generates a peculiar junction of riparian forest, dry forest, Cerrado (savanna) and Veredas (palm swamps) (Azevedo et al., Reference Azevedo, Nunes, Veloso, Neves and Fernandes2009), and it is a priority area for scientific research (Drummond et al., Reference Drummond, Martins, Machado, Sebaio and Antonini2005). Regarding geomorphology, the environmental protection area is embedded in the São Francisco Depression and São Francisco Plateau, where the soils are deep and generally sandy, unstructured and with high drainage arising from the transport and sedimentation of material carried by large water flows in past geological periods (IGA, 2006). These conditions cause the soil to be poor in nutrients, very acidic and lacking in organic matter (Naime, Reference Naime1980).
The riparian forest area sampled lies between the coordinates 15°30′33.5″S and 44°45′12.7″W on the left bank and 15°30′27.9″S and 44°45′15.5″W on the right bank of the Pandeiros River. The reported altitude for the area varies between 459 and 488 m. According to the Köppen classification, the climate is tropical wet and dry or savanna climate (Aw), with a well-defined dry winter and rainy summers (Antunes, Reference Antunes1994). The average annual precipitation ranges from 900 mm to 1200 mm, and the average temperatures are between 21 and 24°C (INMet, 2008), with the highest levels of rainfall in December and January (Antunes, Reference Antunes1994).
Structural survey of the regenerating community
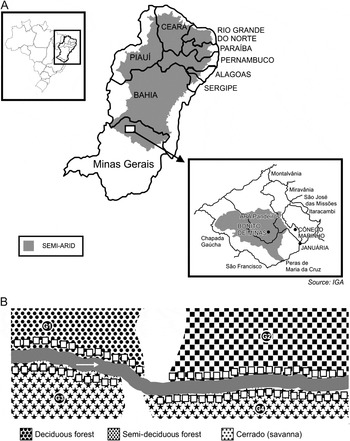
Sampling of the regenerating stratum was conducted between October and November 2007 in 70 plots of 25 m2 (5 m × 5 m) designated alongside the river course, 3 m from its bank, with an interval of 15 m between them. Plot distribution was systematic, with 35 plots on each river bank. However, due to the observed soil characteristics and the occurrence of disturbed stretches and some natural barriers (rock outcrops), the plots were divided into four groups with regard to location (Fig. 1): (1) plots close to limestone outcrops with lithic Neosol and haplic Cambisol soil types that are eutrophic, with low phosphorus availability, sandy texture and strongly undulating terrain resulting from sandstone alterations, with vegetation classified as deciduous seasonal forest (plots 1–15); (2) plots with cattle trampling, with soil characterised as red-yellow Oxisol that is dystrophic, with low phosphorus availability, sandy texture and gently undulating terrain, clothed with semi-deciduous seasonal forest (plots 16–35); (3) plots susceptible to flooding, with fluvic Neosol that is eutrophic, with low phosphorus availability, sandy texture and flat terrain, with Cerrado vegetation (plots 36–42); and (4) plots with dystrophic red-yellow Oxisol and haplic Entisols associated with low phosphorus availability, sandy texture and gently undulating terrain, also with Cerrado vegetation (plots 43–70). Due to the differing sizes of these areas, the number of plots was not equally distributed among them. We allocated 15, 20, 12 and 23 plots respectively to Groups 1, 2, 3 and 4. The soil classification follows EMBRAPA (1997) through field observation and physical and chemical analysis of soil properties.
(A) Location of the Brazilian semi-arid region and the Environmental Protection Area of Pandeiros River. (B) Distribution of the plots in the study area representing the different plot groups.

All woody individuals of size class ≥ 1 cm dbs (diameter at the base of the stem) and < 5 cm dbh (diameter at breast height; measured at a height of 1.3 m from the soil) were sampled and marked with numbered aluminium plates. Data on height, dbs and species name were recorded. Material from all of the species sampled was collected, identified in loco or sent to specialists. Voucher specimens were lodged at the Montes Claros Herbarium (HMC), Universidade Estadual de Montes Claros (UNIMONTES). Species were classified into families according to the Angiosperm Phylogeny Group II system (APG II, 2003).
Characterisation of environmental variables
To determine the influence of local environmental variables on the floristic composition and structure during natural regeneration processes, the following parameters were characterised: soil type (chemical and physical analysis), luminosity (canopy cover) and flooding regime (descriptive categories). The soil characterisation was performed in April 2008 on 10 m × 10 m areas (previously used for arboreal vegetation sampling; see Rodrigues et al., Reference Rodrigues, Azevedo, Veloso, Santos, Menino, Nunes and Fernandes2009) inside which the plots of this study were set. For soil characterisation, a 500 g composite sample was collected from surface soil (0–20 cm). The textural and chemical analyses of samples were performed in the Soil Analysis Laboratory at the Instituto de Ciências Agrárias, Universidade Federal de Minas Gerais, following the EMBRAPA protocol (EMBRAPA, 1997). The soil variables measured were: pH, concentration of potassium, Mehlich phosphorus, remnant phosphorus, calcium, magnesium, aluminium and hydrogen+aluminium, sum of bases, base saturation, organic matter, aluminium saturation, effective cation exchange capacity and capacity of soil to retain cations, and content of coarse and fine sand, silt and clay.
The percentage of canopy coverage was obtained by taking hemispherical photographs in each 5 m × 5 m plot using a Nikon® 8 mm fish-eye lens coupled to a Nikon® digital camera (D50 model) and attached to a monopod at 1.5 m above the ground. The camera was directed towards magnetic north and levelled with the aid of a spirit level. Photographs were taken during the early hours of the morning, avoiding the sun’s reflection on the lens, in April and September of 2008, thereby accounting for coverage in the wet and dry seasons, respectively. The photographs were processed using Gap Light Analyzer software (Frazer et al., Reference Frazer, Canham and Lertzman1999) after conversion of the images to black and white. White pixels in the photographs represent areas with no canopy and the proportion can be calculated.
Flooding regime characterisation was conducted in each plot by visual observation and grading of several variables including flooding (1 = absence; 2 = presence), sand deposition (1 = absence; 2 = presence), embankment height (1 = ≥ 4 m; 2 = ≥ 3 m and < 4 m; 3 = ≥ 2 m and < 3 m; 4 = ≥ 1 m and < 2 m; 5 = flat), water speed (visual scale between a lentic environment and the occurrence of rapids, assigning scores from 1 to 5) and location on the river bend (1 = no curve; 2 = erosion; 3 = sedimentation). The product of the scores given to each variable was the flooding regime variable, and the higher the value, the greater the influence of flooding on the plot.
Data analysis
The structure of the regenerating community was described using the classical calculation of quantitative parameters: absolute and relative density, absolute and relative dominance (based on basal areas), absolute and relative frequency and importance value index (IVI) (Mueller-Dombois & Ellenberg, Reference Mueller-Dombois and Ellenberg1974), and the Shannon diversity index (H′) and Pielou evenness (J′) (Brower & Zar, Reference Brower and Zar1984). For analysis of floristic similarity between groups, a Venn diagram was produced based on the presence or absence of species, allowing evaluation of the floristic composition (Oliveira-Filho & Ratter, Reference Oliveira-Filho, Ratter, Rodrigues and Leitão-Filho2004) and indicating the number of unique species common to the four plot groups. Furthermore, we calculated H′ and J′ for each group of plots. The H′s were compared using the Hutcheson t-test (Zar, Reference Zar1996). Comparisons were made in pairs because the Hutcheson t-test is the only test available for statistical comparisons between H′ values (Nunes et al., Reference Nunes, Mendonça, Botezelli, Machado and Oliveira-Filho2003).
To analyse the correlations between environmental and vegetation gradients, a canonical correspondence analysis (CCA) (Ter Braak, Reference Ter Braak1987) was performed using PC-ORD for Windows, version 4.14 (McCune & Mefford, Reference McCune and Mefford1999). The species matrix consisted of the cover value (relative density + relative dominance) of the individuals per plot relative to the total sample. In this analysis, only the 67 plots with identifiable individuals were used; three plots were excluded for not containing any individuals sampled. According to the recommendations of Ter Braak (Reference Ter Braak, Jongman, Ter Braak and van Tongeren1995), the cover values (a) were transformed by the expression ln(a + 1), to compensate for deviations caused by the very low and high values.
The environmental variables matrix initially included one categorical variable (groups) only to distinguish the four groups on the ordination diagram, 18 quantitative edaphic variables, two variables of the canopy opening percentage (dry and rainy seasons) and the flooding regime variable of each plot. However, after running a preliminary CCA, 17 of these quantitative variables were very weakly correlated or redundant and hence were excluded from the final analysis. The final CCA was processed with the categorical variable (which has no effect on the analysis itself) and the four variables that were most representative and strongly correlated with the ordination axes: the sum of bases, aluminium saturation, light during the rainy season and flooding regime. The Monte Carlo permutation test (Ter Braak, Reference Ter Braak1988) was performed to test the significance of the model. To verify the correlations among the 24 species that had at least 10 individuals and the four most representative environmental variables, Spearman’s rank correlation coefficients were employed (Zar, Reference Zar1996) for species relative dominance and variable values for each plot.
Results
Floristic composition, structure and diversity of the regenerating community
A total of 896 individuals were sampled in a 1750 m2 area, resulting in an estimated 5120 individuals/ha. These individuals were distributed among 108 species belonging to 85 genera and 40 families (see Appendix, where authorship of species names is also given). The six families with the highest species richness were Fabaceae (28 species), followed by Myrtaceae (11 species), Rubiaceae (six species), Anacardiaceae, Bignoniaceae and Sapindaceae (five species each), which accounted for 73.9% of the total number of individuals.
The eight genera with the highest species richness were Eugenia L., with four species, and Aspidosperma Mart. & Zucc., Bauhinia L., Copaifera L., Cordiera A.Rich. & DC., Hymenaea L., Machaerium Pers. and Psidium L., with three species each. The genera that contributed the highest percentage of individuals were Zygia P.Browne (9.93%), Tapirira Aubl. (9.15%), Bauhinia (6.91%), Myrcia DC. (6.14%), Cordiera A.Rich. & DC. (4.80%), Averrhoidium Baill. (4.46%), Hirtella L. (4.02%), Eugenia (3.35%) and Dilodendron Radlk. (3.24%).
The 10 most abundant species represented 52.4% of the total number of individuals, and these were Zygia latifolia, with 89 individuals (9.93% of the total), Tapirira guianensis, with 82 (9.15%), Bauhinia rufa, with 60 (6.69%), Myrcia guianensis, with 53 (5.91%), Averrhoidium gardnerianum, with 40 (4.46%), Hirtella gracilipes, with 36 (4.01%), Cordiera concolor, with 30 (3.34%), Dilodendron bipinnatum, with 29 (3.23%), Tocoyena formosa, with 26 (2.90%), and Astronium fraxinifolium, with 25 (2.79%). The species with the highest importance values (IV) were Zygia latifolia (23.56), Tapirira guianensis (20.52), Butia capitata (19.91), Bauhinia rufa (14.76), Hirtella gracilipes (13.70), Averrhoidium gardnerianum (13.06), Myrcia guianensis (11.74), Astronium fraxinifolium (9.80), Dilodendron bipinnatum (9.34) and Cordiera concolor (9.21), which was related to high densities of Z. latifolia, T. guianensis, M. guianensis and A. gardnerianum, dominance by B. capitata and A. fraxinifolium, and a high frequency of B. rufa, H. gracilipes, C. concolor and D. bipinnatum.
The species diversity (H′) in the total sample was 3.83, while the evenness (J′) was 0.81. The diversity between the groups was significantly different (P < 0.005) except for between Groups 1 and 2 (P > 0.05). Plot Groups 1, 2, 3 and 4 presented 58, 60, 17 and 56 species, respectively, with H′ of 3.58, 3.53, 1.96 and 3.28 and J′ of 0.88, 0.86, 0.69 and 0.81.
Species–environment correlation analysis
The canonical correspondence analysis showed eigenvalues for the first two ordination axes of 0.60 (Axis 1) and 0.48 (Axis 2), respectively (Table 1, Figs 2 and 3). The first eigenvalue can be considered high (Ter Braak, Reference Ter Braak, Jongman, Ter Braak and van Tongeren1995), meaning that the gradients are long; that is, there is high turnover of species along the gradient. The second eigenvalue indicates a short gradient where most of the species are distributed between the two extremes with variations only in their abundance. The first two axes explained 7.6% of the total variance. The small percentage of variance explained by the two axes indicates that part of the species variation is not explained by the measured variables. This result is normal in vegetation data and does not compromise the species–environment relationship analysis (Ter Braak, Reference Ter Braak1988; Rodrigues et al., Reference Rodrigues, Carvalho, Oliveira-Filho and Curi2007) because the species–environment correlations were high on both axes: 0.896 (Axis 1) and 0.866 (Axis 2). Furthermore, the Monte Carlo permutation test indicated that the species coverage and environmental variables correlated significantly (P < 0.05).
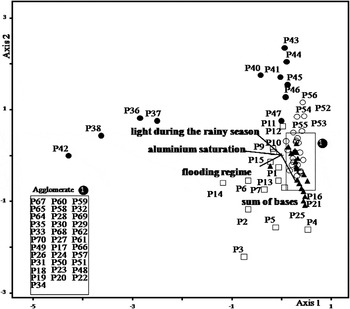
Ordination diagram of the 67 sample plots in the riparian vegetation of the Pandeiros River (Minas Gerais State, Brazil) by canonical correspondence analysis (CCA) of species cover, and correlation with four environmental variables (vectors). □ = lithic Neosol and haplic Cambisol; ▴ = red-yellow Oxisol; • = fluvic Neosol; ○ = red-yellow Oxisol and haplic Entisols.

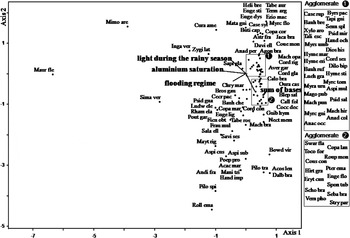
Ordination diagram of a 110-species sample in the riparian vegetation of the Pandeiros River (Minas Gerais State, Brazil) by canonical correspondence analysis (CCA) of species cover. The species are indicated by their abbreviated names (full names are given in the Appendix).

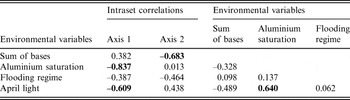
Canonical correspondence analysis (CCA) of 70 plots used to sample the regenerating community, soil, canopy openness and flooding regime in the riparian vegetation of the Pandeiros River (Minas Gerais State, Brazil). The values are intraset correlations in the first two ordination axes, and correlations of environmental variables used in this analysis

The internal correlations between environmental variables and the first two ordination axes (Table 1) showed that the variables that most strongly correlated with Axis 1 were aluminium saturation and canopy openness during the rainy season (April light). For Axis 2, the sum of bases and flooding regime were the variables that showed significant correlations. In contrast, in the weighted correlations between variables, positive interrelationships were detected for the variables aluminium saturation and light in the wet season (0.640), and negative interrelationships were found between the light in the rainy season and the sum of bases (–0.489), indicating that plots with more open canopies had higher aluminium levels and lower levels of the sum of bases.
The ordination of plots according to the environmental variables (Fig. 2) showed that three groups were formed along Axis 1. The first group is composed of Groups 2 and 4, followed by a group comprised of Group 1 and some plots of Group 3, and a third group was formed by the remaining plots of Group 3. The second axis separated the second grouping according to soil fertility because the first group showed the highest sum of bases. Groups 2 and 4 are not clearly separated, with the second axis showing a small separation in relation to the sum of bases content. The formation of these clusters indicates the heterogeneity of the environment studied, showing that other factors (besides the soil criteria characteristics initially used), such as light and flooding, are also responsible for this differentiation, which allows for environments that are close together to become floristically and structurally differentiated.
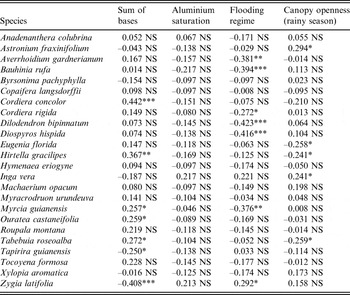
The species ordination diagram (Fig. 3) indicated that species such as Acacia martii, Acosmium lentiscifolium, Andira fraxinifolia, Aspidosperma cuspa, A. subincanum, Bowdichia virgilioides, Dalbergia brasiliensis, Fraunhofera multiflora, Handroanthus impetiginosus, Machaonia brasiliensis, Manilkara triflora, Maytenus rigida, Pilocarpus spicatus, P. trachylophus, Poeppigia procera, Rollinia emarginata, Salacia elliptica, Savia sessiliflora and Tabebuia roseoalba are related to more fertile soils that are associated with limestone outcrops. However, species such as Cordiera concolor, Hirtella gracilipes, Myrcia guianensis, Ouratea castaneifolia, Tapirira guianensis, Zygia latifolia and Tabebuia roseoalba mentioned above correlated significantly with base saturation (Table 2). At the other extreme, there are species such as Brosimum gaudichaudii, Cecropia pachystachya, Copaifera martii, Ficus obtusifolia, Ludwigia elegans, Mauritia flexuosa, Pouteria gardneri, Psidium guajava, Rhamnidium elaeocarpum and Simarouba versicolor that are associated with flooding. Averrhoidium gardnerianum, Bauhinia rufa, Cordiera rigida, Dilodendron bipinnatum, Diospyros hispida, Myrcia guianensis and the aforementioned Zygia latifolia also correlated with the flooding regime. Finally, the species Curatella americana, Inga vera, Mimosa arenosa and Zygia latifolia are associated with the flooded areas with high light intensity. Other species that correlated with light in the rainy season were Astronium fraxinifolium, Eugenia florida, Hirtella gracilipes, Tabebuia roseoalba and the aforementioned Inga vera.
Spearman’s rank correlation coefficients, with respective significance, between species cover and the environmental variables used in the CCA for the species with 10 or more individuals in the riparian vegetation of the Pandeiros River (Minas Gerais State, Brazil)

*P < 0.05; **P < 0.01; ***P < 0.001; NS, not significant.
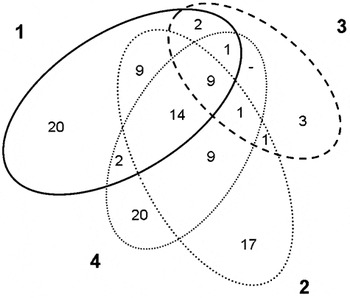
The differentiation between the groups can be seen when comparing the number of species that are shared between and unique to groups. Only nine species (8.33%) were common to the four groups of plots: Astronium fraxinifolium, Bauhinia rufa, Byrsonima pachyphylla, Curatella americana, Dilodendron bipinnatum, Tapirira guianensis, Tocoyena formosa, Xylopia aromatica and Zygia latifolia, and 55.55% of species occurred only in a single group, with 20, 17, 3 and 20 species being unique to Groups 1, 2, 3 and 4, respectively (Fig. 4), showing that there are large changes in the species present between plot groups.
Venn diagram produced from the shared and unique species between Groups 1, 2, 3 and 4 in the riparian vegetation of the Pandeiros River (Minas Gerais State, Brazil).

Discussion
The floristic composition of the regenerating stratum of the riparian vegetation of the Pandeiros River showed some similarities to other Brazilian riparian forests and to the tree stratum sampled in the same area. The families Fabaceae, Rubiaceae, Sapindaceae and Myrtaceae were also important in a survey of natural forest regeneration in the Tamanduá Forest Reserve in the Federal District (Silva et al., Reference Silva, Leite, Silveira, Nassif and Rezende2004), and the families Fabaceae, Anacardiaceae and Bignoniaceae were also the most representative of the tree stratum in that study area (Rodrigues et al., Reference Rodrigues, Azevedo, Veloso, Santos, Menino, Nunes and Fernandes2009). The species Zygia latifolia and Butia capitata, which have the first and third positions in order of importance (IVI) respectively, are normally found in very wet areas in Brazil (Lorenzi et al., Reference Lorenzi, Souza, Costa, Cerqueira and Ferreira2004; Nunes et al., Reference Nunes, Garcia, Lima and Carvalho-Okano2007), and Tapirira guianensis (second position) is considered a generalist (Oliveira-Filho & Ratter, Reference Oliveira-Filho, Ratter, Rodrigues and Leitão-Filho2004).
The Shannon diversity index, both for the total sample and for each individual plot except for Group 3, may be considered high compared with other studies on regenerating strata, such as those of Silva et al. (Reference Silva, Leite, Silveira, Nassif and Rezende2004) and Oliveira & Felfili (Reference Oliveira and Felfili2005) who respectively found diversity indices of 2.89 and 3.02 in central Brazil. The distribution of individuals among species as described by Pielou’s evenness calculation (J′ = 0.81) indicated that, in all probability, there is no concentration of the abundance of any species, which indicates the absence of ecological dominance (Dalanesi et al., Reference Dalanesi, Oliveira-Filho and Fontes2004). This diversity is further shown by the fact that only nine species were common to the four groups of plots, affirming the presence of strong environmental heterogeneity.
The riparian vegetation studied presents a great diversity of species, which may be due to the influence of other types of vegetation (Oliveira-Filho & Ratter, Reference Oliveira-Filho, Ratter, Rodrigues and Leitão-Filho2004). This type of contact is very evident from the occurrence of typical species of the Cerrado flora, including Astronium fraxinifolium, Curatella americana, Davilla elliptica, Eugenia dysenterica, Handroanthus ochraceus, Hymenaea stigonocarpa, Jacaranda brasiliana, Machaerium opacum, Magonia pubescens, Pterodon emarginatus, Tocoyena formosa and Xylopia aromatica (Mendonça et al., Reference Mendonça, Felfili, Walter, Silva-Junior, Rezende, Filgueiras, Nogueira, Sano and Almeida1998), and other species commonly found in seasonal forests, such as Anadenanthera colubrina, Casearia rupestris and Myracrodruon urundeuva (Prado & Gibbs, Reference Prado and Gibbs1993). In addition to the contribution exerted by the adjacent physiognomies, we observed the occurrence of species common to riparian areas, such as Casearia sylvestris, Cecropia pachystachya, Copaifera langsdorffii, Inga vera and Zygia latifolia (Oliveira-Filho & Ratter, Reference Oliveira-Filho, Ratter, Rodrigues and Leitão-Filho2004), showing the transitional character of the studied area.
Many studies have observed the occurrence of vegetation mosaics associated with riparian communities (Metzger et al., Reference Metzger, Bernacci and Goldenberg1997; Laurance et al., Reference Laurance, Laurance, Andrade, Fearnside, Harms, Vicentini and Luizão2010). The confirmation of a floristic identity shared between the predetermined groups indicates the plant recruitment response to the high level of environmental heterogeneity in riparian zones. The grouping of the plots within Group 1 is due to soil colour, which is indicative of distinct fertility properties, which are of great importance in the spatial distribution and structure of tropical forests (Oliveira-Filho et al., Reference Oliveira-Filho, Ratter and Shepherd1990, Reference Oliveira-Filho, Vilela, Carvalho and Gavilanes1994a; Scarano et al., Reference Scarano, Ribeiro, Moraes and Lima1997; Carvalho et al., Reference Carvalho, Oliveira-Filho, Vilela, Curi, van den Berg, Fontes and Botezelli2005). The plots in Groups 2 and 4 do not differ markedly in relation to species composition and structure, probably due to the presence of the same type of soil. However, the separation of certain plots of these groups with regard to soil fertility may be due to the forest composition of each group, where Group 2 represents a composition closer to the semi-deciduous forest and Group 4 one closer to the Cerrado.
In some cases, light can affect species differentiation more than soil variables (Oliveira-Filho et al., Reference Oliveira-Filho, Curi, Vilela and Carvalho1998); this can be seen in the plots of Group 3, where there was a clear direct relationship with canopy openness. Light availability has an important role in natural regeneration because the quality and quantity of light determines the survival of species, particularly affecting germination and seedling growth (Beckage & Clark, Reference Beckage and Clark2003; Gómez et al., Reference Gómez, Valladares and Puerta-Pinero2004; Madeira et al., 2009). The incidence of light during the growing season (rainy season) is a variable that influences the establishment of different species because canopy gaps are especially favourable sites for seedling recruitment and establishment (Denslow, Reference Denslow1980; Brokan, Reference Brokan1985). This fact may explain the significant effect of light during the rainy season on the richness and abundance of species observed during the natural regeneration process that, despite occurring within this riparian zone, is probably disrupted during the drought due to the hydric deficit in the upper layers of soil where most young plant roots are located. Thus, the recruitment and establishment of individuals are influenced by the amount of canopy cover at the time of the year that is most favourable for growth and establishment of recruits. However, separation of certain plots was also observed. This is probably due to the aluminium saturation level because plots 36, 37, 38 and 42 showed a higher concentration of aluminium and higher values of canopy openness and species that occurred exclusively in them, such as Mimosa arenosa and Mauritia flexuosa. Mimosa arenosa is one of the typical Caatinga species that occurs in areas where vegetation cover suffers continuing deforestation (Soares, Reference Soares2004), while Mauritia flexuosa usually occurs in poorly drained, slightly sandy and soaked soils (Lorenzi et al., Reference Lorenzi, Souza, Costa, Cerqueira and Ferreira2004).
Another important factor leading to great environmental heterogeneity is the fact that periodic floods vary in their extent (Oliveira-Filho et al., Reference Oliveira-Filho, Vilela, Carvalho and Gavilanes1994b; Bertani et al., Reference Bertani, Rodrigues, Batista and Shepherd2001; Sieben et al., Reference Sieben, Mucina and Boucher2009). This can be observed in the influence of the flooding regime in the Group 3 plots and in some Group 1 plots. The most marked effects of the flooding regime were in plots 2, 3, 5, 6 and 7 from Group 1 and all Group 3 plots. Species such as Inga vera, Matayba guianensis, Psidium guajava, Rhamnidium elaeocarpum, Rollinia emarginata, Salacia elliptica and Savia sessiliflora were restricted to those plots. Some studies have reported that some of these species are typical of humid environments, including Nunes et al. (Reference Nunes, Garcia, Lima and Carvalho-Okano2007) and Silva et al. (Reference Silva, van den Berg, Higuchi and Oliveira-Filho2007) who found Inga vera and Rollinia emarginata respectively in these environments. Therefore, the selectivity caused by frequent flooding may lead to differences in floristic composition (Giehl & Jarenkow, Reference Giehl and Jarenkow2008) because these variations in flood intensity have an important role in regeneration dynamics (Oliveira-Filho et al., Reference Oliveira-Filho, Curi, Vilela and Carvalho1998) as soil moisture is a key factor that controls seed germination and seedling establishment (Battaglia et al., Reference Battaglia, Foré and Sharitz2000).
The diversity of interactions between environmental factors such as soil type and species responses results in environmental heterogeneity that determines the formation of habitat mosaics (Hutchings et al., Reference Hutchings, John and Wijesinghe2003). According to Levin (Reference Levin1992), all biological systems exhibit a high level of heterogeneity and patchiness, which are fundamental factors in the dynamics of populations and communities. Thus, despite the search for patterns to make ecological studies more quantitative, increased evidence of the importance of heterogeneity leads to a dilemma between practical and theoretical ecology (Sparrow, Reference Sparrow1999). The data obtained here show the impossibility of implementing a single model of riparian vegetation recovery throughout the São Francisco basin. This is because, even in short tracts within a single river basin, there is great differentiation in the structure and diversity of the flora during natural regeneration caused by environmental factors such as soil type, light conditions and flooding regime. As a consequence, our knowledge of the patterns of natural regeneration in tropical vegetation is still in its infancy and research to increase our understanding of these processes should be a priority for conservation of biodiversity.
Acknowledgements
The authors thank G. S. Tolentino, I. F. P. Azevedo, P. M. S. Rodrigues, A. F. Murta and M. D. M. Veloso for their help with the fieldwork. We especially thank the Instituto Estadual de Floresta – IEF/MG, for logistic support, in particular W. V. Neves (Research Coordinator) and R. A. Souza (Manager of the Wildlife Refuge – Refúgio de Vida Silvestre). The project was funded by the Conselho Nacional de Pesquisa Científica – CNPq (555980/2006-5). G. C. O. Menino thanks the Fundação de Amparo a Pesquisa de Minas Gerais – FAPEMIG for providing a research fellowship, while Y. R. F. Nunes thanks the same organisation for grants CRA-BIP-00232-09 and CRA-PPM-00504-10, and G. W. Fernandes for FAPEMIG grants CRA 465/07, 122/07 and APQ-01278-08, and CNPq for 303352/2010-8, 474292/2010-0 and 561883/2010-6. This study was a partial fulfilment of the requirements for the Master of Science degree of G. C. O. Menino in the Universidade Estadual de Montes Claros – UNIMONTES (Programa de Pós-Graduação em Ciências Biológicas).
Family and species recorded in the riparian vegetation of the Pandeiros River (Minas Gerais State, Brazil) with respective structure parameters. Abb = abbreviated species name; VN = voucher number; N = number of individuals; AD = absolute density (individuals/ha); AF = absolute frequency (%); ADo = absolute dominance (m2/ha); and IV = importance value (%).