The importance of central line-associated bloodstream infections (CLABSIs) as a measure of healthcare quality is reflected by the inclusion of facility-specific CLABSI rates in publically reported healthcare-associated infection data. CLABSI surveillance involves the use of standardized definitions established by the National Healthcare Safety Network (NHSN). The NHSN definition for central venous catheter (CVC) days, used as the denominator for CLABSI rate reporting, does not account for the presence of concurrent CVCs in individual patients, which may indicate an increased risk for developing a CLABSI.1–Reference Legriel, Mongardon, Troche, Bruneel and Bedos5 Failure to account for concurrent CVCs could have ramifications for public reporting by those facilities with higher acuity patients with multiple CVCs in place.
Aslakson et alReference Aslakson, Romig and Galvagno6 assessed the impact of a modified CVC day definition in which concurrent CVCs contributed to the denominator. Over 1 month in 2 intensive care units (ICUs), the number of CVC days counted using the modified definition (745) was significantly higher than that identified by traditional surveillance (485), resulting in a 53.6% increase in CVC days and a 36% decrease in the calculated CLABSI rate.
Since 2010, all CVCs in every inpatient at Vanderbilt University Medical Center (VUMC) have been captured directly from electronic nursing documentation, which is required before any CVC maintenance practice can be recorded in a patient’s medical record. We aimed to expand on the study by Aslakson by examining the impact of a modified CVC day definition on CLABSI incidence measurement in a broader spectrum of inpatient units, including non-ICUs and pediatric areas, for a longer period of time (2 years).
METHODS
For all inpatient units at VUMC, the total number of CVCs in each patient at midnight every day in 2010 and 2011 were captured via validated electronic nursing documentation. CVC day counts were then determined using 2 methods. For CVC days counted using the NHSN definition (“conventional” count), the presence of 1 or more CVC at midnight was counted as a single CVC day, regardless of the presence of concurrent CVCs. A second CVC day count was calculated that accounted for concurrent CVCs (“unique” count; eg, x no. of concurrent CVCs in place at midnight = x CVC days). CLABSI events were determined by trained infection preventionists using NHSN definitions, and CLABSI rates were calculated using both types of CVC day counts.
Descriptive statistics were used to calculate the differences between conventional and unique counts, and the Wilcoxon signed rank test was used to compare the distributions between the mean monthly counts using the 2 methods. To assess the impact of the different CVC day counts on the intrafacility performance ranking of individual units, units with an annual CLABSI rate >0 were ranked into CLABSI rate decile strata, and the impact of accounting for a multiple CVCs on unit rankings was assessed separately for 2010 and 2011, similar to the method described by Thompson et al.Reference Thompson, Edwards and Bamberg7 Analyses were conducted using Stata software, version 9 (StataCorp). The Vanderbilt University Institutional Review Board approved this research and waived the need for informed consent.
RESULTS
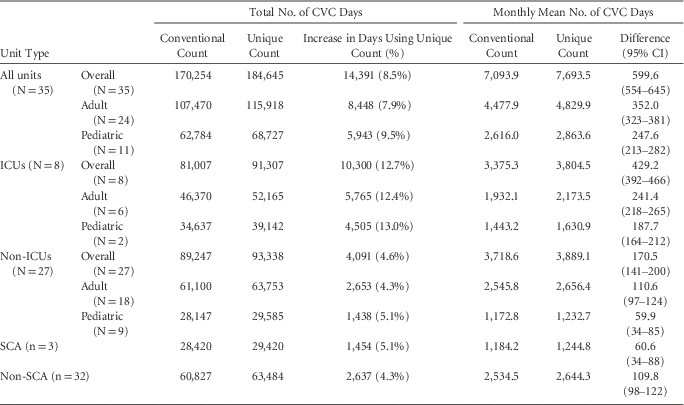
For all units combined, mean monthly CVC day counts increased by 8.5% when the unique method was used (conventional count: 7,093.9 [95% CI, 6,942.0–7,245.8] CVC days vs unique count: 7,693.5 [95% CI, 7522.5–7864.6] CVC days, Table 1), and the distributions were significantly different (P<.001). The percent change in CVC days was greater among ICUs (12.7% increase) compared with non-ICUs (4.6%) and among pediatric units (9.5%) compared to adult units (7.9%). There was also variation in the degree of increase between different ICU types: burn (11.8% increase), cardiothoracic (15.1%) medical (14.9%), neonatal (5.3%), neurosurgical (5.0%), surgical (15.8%), and trauma (5.6%). The pediatric ICU rate was impacted the most (23.8% increase in CVC days).
Comparison of Central Venous Catheter (CVC) Day Counts Using the National Healthcare Safety Network (NHSN) Definition (“Conventional”) and a Method that Accounts for Concurrent CVCs (“Unique”), 2010 and 2011 combined, by Unit Type.

Note. NHSN, National Healthcare Safety Network; CVC, central vascular catheter; ICU, intensive care unit; SCA, specialty care area.
CLABSI rates decreased for all unit types (Figure 1), with a percent decrease ranging from 4.2% to 11.9%. The units in which the CLABSI rate was most impacted when accounting for concurrent CVCs were the ICUs (11.9% decrease). The decrease in CLABSI rates was slightly higher in pediatric units (ICU and non-ICU) when compared to adult units, even though the actual CLABSI rate in these units was lower. Intrafacility CLABSI rate rankings were mildly impacted; 81.3% of units with at least 1 CLABSI event during 2010 had no change in the 2010 CLABSI rate decile and 82.6% of units with at least 1 CLABSI event during 2011 had no change in the 2011 CLABSI rate decile compared to decile rankings of rates calculated using the traditional CVC day count. Decile rankings changed for only 6 of 32 units in 2010 (3 increased, 3 decreased) and 4 of 23 units in 2011 (2 increased and 2 decreased). All decile ranking changes were within 1 decile (eg, a change from decile rank 5 to 6).
Comparison of central line-associated bloodstream infection (CLABSI) rates calculated using the conventional cvc day count and a method accounting for concurrent CVCs (“Unique”), by unit type. The percent decrease in CLABSI rate when the unique method is utilized to calculate CLABSI rates is noted in the boxes. CVC=central vascular catheter.
DISCUSSION
Changing to a CVC day definition that accounted for multiple concurrent CVCs increased device day counts and mildly impacted intrafacility CLABSI rate rankings. ICUs were particularly affected, but the degree of impact varied by ICU type. The milder impact in some ICUs was not completely unexpected. Specifically, burn and trauma ICU patients may have limited options for CVC placement related to the presence of orthopedic or burn injuries, so such patients may have a lower likelihood for placement of concurrent CVCs.
Several studies have suggested a higher risk of CLABSI development among patients with multiple CVCs.Reference Almuneef, Memish, Balkhy, Hijazi, Cunningham and Francis2–Reference Legriel, Mongardon, Troche, Bruneel and Bedos5 To account for this increased risk in the reporting of CLABSI rates, Aslakson et al examined the impact of counting concurrent CVCs upon CVC day and CLABSI rate calculations.Reference Aslakson, Romig and Galvagno6 They noted a 53.6% increase in the number of CVC days and a 36% decrease in the calculated CLABSI rate; however, this investigation occurred only in 2 surgical ICUs for a period of 1 month. The current study expands upon that study, noting increases in CVC days and decreases in CLABSI rates for several different types of adult and pediatric inpatient units using 2 years of data. The percent change in CVC days noted in the current study was not as pronounced as noted by Aslakson. This could be attributed to interfacility differences in CVC utilization practices as well as inclusion of different unit types in the 2 studies. In addition, this study included only CVCs in place concurrently at midnight, while that study used a window of 5 hours to determine concurrence.
Although CVC days did increase, this change did not have a major impact on unit-specific intrafacility rankings of CLABSI performance. A majority of units did not have a change in their decile ranking of CLABSI rates, and for those units where the ranking did change, it shifted by a single decile. This study does have some potential limitations. It was performed at a single university-affiliated tertiary care center, and the generalizability of these findings to all types of acute care hospitals may be limited. In addition, while intrafacility rankings were only mildly impacted, the effect on interfacility comparisons may be more dramatic, especially when comparing hospitals with a differing prevalence of concurrent CVC use. These data indicate that using a CVC day definition that accounts for concurrent CVCs may impact CLABSI rates in varying magnitudes specific to ICU type. Future studies examining counting CVC lumen days and studies using a method that includes arterial catheters should also be considered.
Acknowledgments
Financial support. This study was supported by institutional funds.
Conflicts of interest. All authors have no relevant conflicts to declare