1. Introduction
The understanding of the nature of near-wall turbulence has been greatly advanced by recent applications of dynamical-systems theory to turbulent flow (Kawahara, Uhlmann & van Veen Reference Kawahara, Uhlmann and van Veen2012). In particular, over the past two decades, the discovery of three-dimensional fully nonlinear travelling wave (TW) solutions to the Navier–Stokes equations has enabled a priori study of self-sustained near-wall coherent structures that resemble in many ways the transient structures observed in fully turbulent flows (Hof et al. Reference Hof, van Doorne, Westerweel, Nieuwstadt, Faisst, Eckhardt, Wedin, Kerswell and Waleffe2004). These solutions, also denoted as exact coherent states (Waleffe Reference Waleffe2001) (ECSs), are steady states in a reference frame translating at a constant streamwise speed. They have been found numerically in all canonical wall-bounded geometries for turbulent flows (plane Couette and Poiseuille, pipe and boundary layer) (Nagata Reference Nagata1990; Clever & Busse Reference Clever and Busse1997; Nagata Reference Nagata1997; Waleffe Reference Waleffe1998, Reference Waleffe2001, Reference Waleffe2003; Faisst & Eckhardt Reference Faisst and Eckhardt2003; Wedin & Kerswell Reference Wedin and Kerswell2004; Gibson, Halcrow & Cvitanovic Reference Gibson, Halcrow and Cvitanovic2008, Reference Gibson, Halcrow and Cvitanovic2009; Schneider, Gibson & Burke Reference Schneider, Gibson and Burke2010; Duguet et al. Reference Duguet, Schlatter, Henningson and Eckhardt2012; Blackburn, Hall & Sherwin Reference Blackburn, Hall and Sherwin2013). Most solutions that have been found to date are spatially extended, but recent studies show the existence of spatially localized travelling solutions that closely resemble turbulent puffs in the pipe flow geometry (Avila et al. Reference Avila, Mellibovsky, Roland and Hof2013; Chantry, Willis & Kerswell Reference Chantry, Willis and Kerswell2014) or turbulent spots in the plane Couette and Poiseuille geometries (Tillmark & Alfredsson Reference Tillmark and Alfredsson1992; Barkley & Tuckerman Reference Barkley and Tuckerman2005; Lemoult, Aider & Wesfreid Reference Lemoult, Aider and Wesfreid2013; Brand & Gibson Reference Brand and Gibson2014). Other ECSs or other types of invariant solutions to the governing equation have also been found numerically. Periodic or relative periodic orbits were computed for plane Couette (Kawahara & Kida Reference Kawahara and Kida2001; Viswanath Reference Viswanath2007; Cvitanović & Gibson Reference Cvitanović and Gibson2010) and Poiseuille flow (Toh & Itano Reference Toh and Itano2003), pipe flow (Duguet, Willis & Kerswell Reference Duguet, Willis and Kerswell2008) and two-dimensional Kolmogorov flow (Chandler & Kerswell Reference Chandler and Kerswell2013). Taken together, these solutions seem to form at least in part the dynamical skeleton underlying the chaotic dynamics of turbulent flow (Gibson et al. Reference Gibson, Halcrow and Cvitanovic2008; Kawahara et al. Reference Kawahara, Uhlmann and van Veen2012). In the present work, we report and analyse several new families of such solutions in the plane Poiseuille geometry and further develop the understanding of the relationship between these solutions and the dynamics of turbulence.
We focus here on plane Poiseuille (channel) flow of a Newtonian fluid with dynamic viscosity
 ${\it\mu}$
, density
 ${\it\rho}$
and kinematic viscosity
 ${\it\nu}={\it\mu}/{\it\rho}$
in a channel of half-height
 $h$
. The characteristic inner scales are the friction velocity
 $u_{{\it\tau}}=({\it\tau}_{w}/{\it\rho})^{1/2}$
and the near-wall length scale or wall unit
 ${\it\delta}_{{\it\nu}}={\it\nu}/u_{{\it\tau}}$
, where
 ${\it\tau}_{w}$
is the time- and area-averaged wall shear stress. As usual, quantities non-dimensionalized by these scales are denoted with a superscript ‘
 $+$
’. The friction Reynolds number is defined as
 $Re_{{\it\tau}}=u_{{\it\tau}}h/{\it\nu}=h/{\it\delta}_{{\it\nu}}$
.
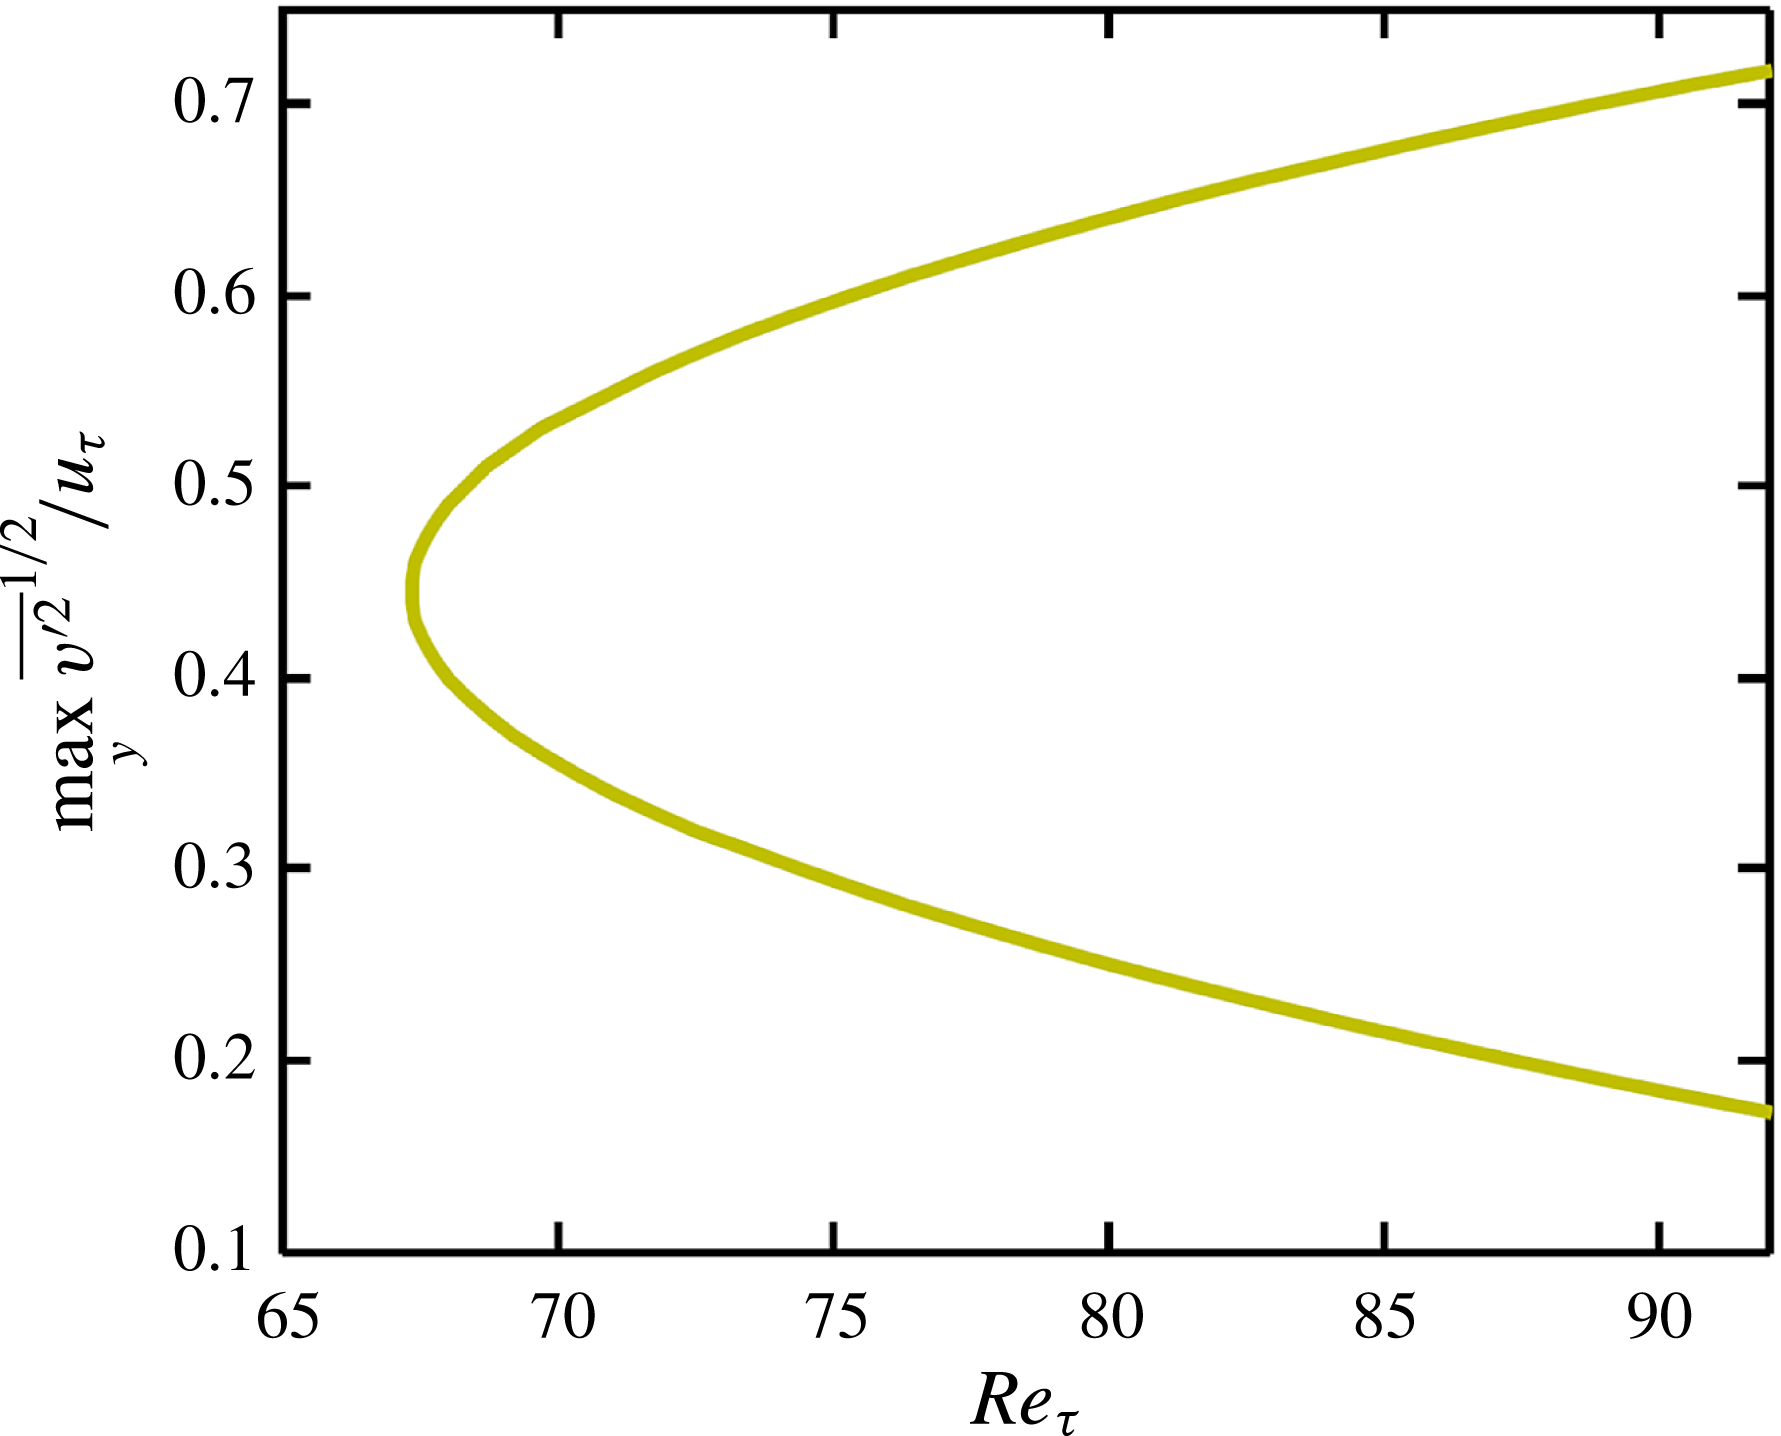
A bifurcation diagram for one solution family of travelling waves found in the present study (labelled P4 below), where the maximum in the root mean square wall-normal fluctuations is shown against Reynolds number.

Exact coherent states primarily arise in pairs via a saddle–node bifurcation at a particular Reynolds number. At the bifurcation, the pair of solutions emerges at finite amplitude; we refer to each such pair as a solution family. Figure 1 illustrates a bifurcation diagram of solution amplitude versus Reynolds number for one such family (the ‘P4’ family described below), using the maximum over
 $y$
of the root mean square wall-normal velocity fluctuations
 $\overline{v^{\prime 2}}^{1/2}$
normalized by the friction velocity
 $u_{{\it\tau}}$
as a measure of solution amplitude. An overbar indicates averaging over the streamwise and spanwise directions. The so-called lower-branch (LB) solution of each pair denotes a low-drag state due to its lower maximum wall-normal velocity fluctuation compared with its corresponding upper-branch (UB) solution. (Additional solution branches can and do bifurcate off these primary states – the ‘P2’ solutions described below are one such example.) In general, these solutions have a spatial structure in the form of low-speed streaks that are wavy in the streamwise direction, straddled by counter-rotating streamwise-aligned vortices: that is, they have the same basic qualitative structure as near-wall turbulence.
The basic self-sustaining process underlying these structures has been qualitatively described by Waleffe (Reference Waleffe1997). More recently, it has been observed for Couette flow that at least one LB solution family has a structure that consists of streaks, rolls and a weak streamwise-varying wave that develops a critical layer – i.e. its structure is localized around the surface where the streamwise velocity equals the wave speed of the ECS (Wang, Gibson & Waleffe Reference Wang, Gibson and Waleffe2007). In the classical linear stability theory of parallel shear flows, a critical layer is a planar surface around which normal-mode perturbations localize (Drazin & Reid Reference Drazin and Reid1981), while here the critical layer is a curved surface in 3D. Wang et al. (Reference Wang, Gibson and Waleffe2007) presented a scaling analysis suggesting that the wavy fluctuations should be localized in a region of thickness
 $O(Re^{-1/3})$
, and showed that this scaling was followed by their numerical solutions. In fact, they found that the flow structures at
 $Re=50\,000$
and
 $Re=3000$
were virtually identical modulo an
 $Re^{1/3}$
rescaling of the direction normal to the critical layer surface. Hall and coworkers (Hall & Sherwin Reference Hall and Sherwin2010; Blackburn et al.
Reference Blackburn, Hall and Sherwin2013) used a mixture of asymptotics and numerics to show, again for Couette flow, that the critical layer fluctuations couple back to the streamwise rolls to generate the nonlinear self-sustaining process that supports ECSs. In their formulation, this process is a version of wave–vortex interaction. They note that ‘remarkable’ agreement is obtained between the high-
 $Re$
asymptotics and the numerical results down to Reynolds numbers of order
 $10^{3}$
(Hall & Sherwin Reference Hall and Sherwin2010) – we emphasize this point because this is the Reynolds number range of the present results. Other recent and interesting work on critical layers and ECSs is found in Viswanath (Reference Viswanath2009), Deguchi, Hall & Walton (Reference Deguchi, Hall and Walton2013), Deguchi & Hall (Reference Deguchi and Hall2014) and Gibson & Brand (Reference Gibson and Brand2014) . Because of the clear importance of critical layer dynamics for at least some families of nonlinear TWs even at low
 $Re$
, § 3.2 of the present work focuses on this topic.
For plane Poiseuille flow, the first known families of TW solutions were obtained by a homotopy continuation from ECSs in plane Couette flow. Solutions were sought in a travelling reference frame using a Newton–Raphson method with the wave speed as an unknown (Waleffe Reference Waleffe1998, Reference Waleffe2001, Reference Waleffe2003; Nagata & Deguchi Reference Nagata and Deguchi2013; Gibson & Brand Reference Gibson and Brand2014). Solutions have been also computed by a multiple shooting method (Itano & Toh Reference Itano and Toh2001). It is worth noting that the lowest bifurcation point or onset Reynolds number for these solutions,
 $Re\approx 977$
or
 $Re_{{\it\tau}}\approx 44.3$
, is in good quantitative agreement with the Reynolds number for transition to turbulence observed in an experiment in this geometry (Carlson, Widnall & Peeters Reference Carlson, Widnall and Peeters1982). In fact, the solutions survive slightly below the critical Reynolds number for turbulence onset. Furthermore, the optimal spanwise wavelength
 $105.5{\it\delta}_{{\it\nu}}$
at the onset of TW solutions is remarkably matched well with that of experimentally and numerically observed near-wall streak spacing of
 $80{-}120{\it\delta}_{{\it\nu}}$
(Smith & Metzler Reference Smith and Metzler1983). In the present work, several more families of TWs are found, which seem to have a closer connection to turbulent dynamics than the ones found earlier.
An important issue regarding ECSs is their connection to the laminar–turbulent boundary – the boundary in state space between the basins of attraction of the laminar and turbulent states. Some of the LB ECSs found in turbulent shear flows are embedded on this boundary (Itano & Toh Reference Itano and Toh2001; Skufca, Yorke & Eckhardt Reference Skufca, Yorke and Eckhardt2006; Kerswell & Tutty Reference Kerswell and Tutty2007; Schneider, Eckhardt & Yorke Reference Schneider, Eckhardt and Yorke2007; Wang et al. Reference Wang, Gibson and Waleffe2007; Duguet et al. Reference Duguet, Willis and Kerswell2008; Viswanath & Cvitanovic Reference Viswanath and Cvitanovic2009). In particular, such solutions that have only one unstable direction are called edge states (Skufca et al. Reference Skufca, Yorke and Eckhardt2006). Because such solutions are somehow the weakest most marginal form of self-sustaining turbulence, the structure of the basin boundary and the dynamical trajectories that lie on it are likely to play an important role in understanding the dynamics of transition to turbulence or onset of turbulence in wall-bounded shear flows. Recently, an experimental observation has been reported for the existence of edge states in pipe flow (de Lozar et al. Reference de Lozar, Mellibovsky, Avila and Hof2012).
Returning to the dynamical-systems point of view, ECSs are periodic (or more complicated but still invariant) orbits in state space, while the time evolution of a turbulent flow is a dynamical trajectory wandering around them. An important question is how closely the turbulent trajectories approach these invariant states. For plane Couette flow, Gibson et al. (Reference Gibson, Halcrow and Cvitanovic2008) visualized a clear illustration of this dynamical-systems viewpoint of turbulence by projecting the trajectory onto a set of orthonormal basis states constructed with earlier ECSs. Kerswell & Tutty (Reference Kerswell and Tutty2007) also showed a clear visual illustration for a pipe flow. In addition to the state-space visualization, they proposed quantitative measurements of the distance between a given instant on the turbulent trajectory and ECSs, and suggested that ECSs are visited for approximately 10 % of the time in turbulent pipe flow. For a channel flow, the connections have yet to be fully made and will be investigated in the present study.
One important motivation for gaining a better understanding of turbulence is the possibility of reducing drag. In this context, the LB ECSs are attractive due to their low-drag flow features, and a natural question is whether it might be possible to somehow steer turbulent trajectories towards these states. One very successful approach to turbulent drag reduction is to add small amounts of rheologically active additives such as flexible long-chain polymers into a liquid (White & Mungal Reference White and Mungal2008; Graham Reference Graham2014). The most dramatic effect of the polymer additives on turbulence occurs in the near-wall region, weakening the turbulent eddies in this region. The key feature of these polymer solutions in drag reduction is the existence of the so-called maximum drag reduction (MDR) phenomenon, at which very high levels of drag reduction are achieved by polymer additives, first identified by Virk (Reference Virk1975). The most intriguing observation for MDR is its universal mean velocity profile, the experimentally observed upper limit on the amount of drag reduction that can be achieved with polymer additives, also known as the Virk asymptote (Virk Reference Virk1975). This asymptotic limit is insensitive to changes in the polymer solution such as concentration, molecular weight or polymer type. Thus, for a given situation, the maximum amount of drag reduction achievable with polymer additives is invariant.
Li et al. (Li, Xi & Graham Reference Li, Xi and Graham2006; Li & Graham Reference Li and Graham2007) have investigated the effects of polymer additives on the channel flow ECSs discovered by Waleffe (Reference Waleffe2001, Reference Waleffe2003). For this solution family, as the level of viscoelasticity is increased, the Reynolds number for the solutions to come into existence increases. The primary effect of viscoelasticity on these ECSs is the weakening of the streamwise vortices. Other effects are also seen in changes in the budgets of turbulent kinetic energy, Reynolds stress and mean shear stress. All of these effects show, at least at low levels of drag reduction, that the basic mechanism of drag reduction by polymers can be clearly elucidated by examining the impact of polymers on TW solutions. Nevertheless, these studies were limited to a single solution family and to relatively low Reynolds numbers and levels of viscoelasticity.
Another set of recent studies, while not directly focused on ECSs, sheds some light on the state-space dynamics of Newtonian and viscoelastic channel flow. Xi & Graham (Reference Xi and Graham2010a , Reference Xi and Graham2012b ) performed direct numerical simulation (DNS) studies of minimal channel flow at low Reynolds numbers, finding that in Newtonian flow and for low to intermediate values of the Weissenberg number, the flow cycles stochastically between ‘active’ intervals, with strong streamwise vortices and three-dimensionality, velocity and a velocity profile near the von-Kármán profile, and ‘hibernating intervals’, with very weak turbulence and a mean velocity profile approaching the Virk MDR profile. In viscoelastic flow, the polymers stretch during the active intervals, working against the streamwise vortices and shortening the duration of these intervals, while during the hibernating intervals the flow kinematics is very gentle and the polymers relax, only to begin stretching again at the beginning of the next active interval. Thus, as the degree of viscoelasticity (Weissenberg number) increases, the overall dynamics looks increasingly ‘Virk-like’ as the active intervals contribute a decreasing time duration to the overall statistics. A simple theory is developed, based on exponential stretching of polymers during active intervals and the idea that these intervals cannot persist once the polymer stress reaches a threshold value. This theory predicts the Weissenberg-number dependence of the duration of the active intervals in good agreement with the simulations. At high Weissenberg number, the hibernation intervals themselves are substantially altered and stabilized by viscoelasticity (Wang et al. Reference Wang, Graham, Hahn and Xi2014), through mechanisms that are not yet understood. In addition, at low Reynolds number in the minimal channel flow geometry, hibernating turbulence is closely related to an edge state in which the Virk profile also arises, not just as a transient, but in the time-averaged velocity (Xi & Graham Reference Xi and Graham2012a ), even in Newtonian flow. A comprehensive overview of these studies is provided in Graham (Reference Graham2014). The connection between active and hibernating turbulence and UB and LB Newtonian ECSs will be solidified in the present work.
There are other indications as well that the Virk asymptote is not just universal for drag reduction by polymers but also arises in Newtonian turbulence. Dubief et al. (Reference Dubief, White, Shaqfeh and Terrapon2011) observed in a simulation of Newtonian boundary layer flow that at a spatial position just upstream of where vortices and turbulence spots form, the mean velocity profile looks strikingly similar to the Virk MDR profile. Furthermore, the Virk MDR profile is also observed in a smoothed version of Newtonian plane Poiseuille flow in which spanwise length scales of the flow field below a specified size are suppressed (Kerswell, Obrist & Schmid Reference Kerswell, Obrist and Schmid2003). Finally, experimental observations of a Newtonian turbulent boundary layer flow subjected to spanwise wall oscillations display a mean velocity profile that, for
 $y^{+}\lesssim 30$
, closely resembles the Virk MDR profile (Bandyopadhyay Reference Bandyopadhyay2006).
In this paper, we present five new families of nonlinear travelling wave solutions in Newtonian plane Poiseuille flow, and examine their spatiotemporal structure and connections to the dynamics of turbulent flow in the same geometry. In particular, we find a family whose UB and LB solutions have mean velocity profiles that resemble Newtonian turbulent (von Kármán) and MDR (Virk) profiles and we show the relationship between those solutions and trajectories of turbulent flows. The problem formulation and solution methodologies are presented in § 2. Section 3.1 presents an overview of mean flow properties and spatial structures of the solutions, while § 3.2 illustrates the relation between the new TWs and critical layer dynamics. Sections 3.3 and 3.4 describe the connections between the TWs, the laminar–turbulent boundary and turbulent dynamics. Section 4 presents conclusions.
2. Formulation and solution approach
We consider an incompressible Newtonian fluid in the plane Poiseuille geometry, driven with a constant mass flux
 $Q$
. The characteristic length and velocity scales are the half-channel height
 $h$
and the laminar centreline velocity
 $U_{c}=(3/4)Q/h$
for the same mass flux respectively. With these characteristic scales, the Navier–Stokes equations in non-dimensional form are
 $$\begin{eqnarray}\displaystyle & \displaystyle \boldsymbol{{\rm\nabla}}\boldsymbol{\cdot }\boldsymbol{u}=0, & \displaystyle\end{eqnarray}$$
 $$\begin{eqnarray}\displaystyle & \displaystyle \frac{\partial \boldsymbol{u}}{\partial t}+\boldsymbol{u}\boldsymbol{\cdot }\boldsymbol{{\rm\nabla}}\boldsymbol{u}=-\boldsymbol{{\rm\nabla}}p+\frac{1}{Re_{c}}{\rm\nabla}^{2}\boldsymbol{u}. & \displaystyle\end{eqnarray}$$
 $Re_{c}=U_{c}h/{\it\nu}$
. It should be noted that
 $Re_{b}=U_{b}h/{\it\nu}=(2/3)Re_{c}$
, where
 $U_{b}$
is the bulk velocity. The
 $x,y$
and
 $z$
coordinates are aligned with the streamwise, wall-normal and spanwise directions respectively. Periodic boundary conditions are imposed in the
 $x$
and
 $z$
directions with fundamental periods
 $L_{x}$
and
 $L_{z}$
, and no-slip conditions are imposed at the walls
 $y=\pm 1$
. The computational domain is thus
 $[0,L_{x}]\times [-1,1]\times [0,L_{z}]$
or simply
 $[L_{x},2,L_{z}]$
. The velocities are
 $u$
,
 $v$
and
 $w$
in the
 $x$
,
 $y$
and
 $z$
directions, and the velocity at point
 $(x,y,z)$
and time
 $t$
is expressed as
 $\boldsymbol{u}=[u,v,w](x,y,z,t)$
.
Computation of nonlinear TWs is performed using the open source code ChannelFlow written by Gibson (Reference Gibson2012), with use of a Newton–Krylov-hookstep algorithm (Viswanath Reference Viswanath2007). A numerical grid system is generated on
 $N_{x}\times N_{y}\times N_{z}$
(in
 $x$
,
 $y$
and
 $z$
) meshes, where a Fourier–Chebyshev–Fourier spectral spatial discretization is applied to all variables. A typical resolution used is
 $(N_{x},N_{y},N_{z})=(48,81,48)$
. A TW solution has the following form:
 $$\begin{eqnarray}\boldsymbol{u}(x,y,z,t)=\boldsymbol{u}(x-c_{x}t,y,z),\end{eqnarray}$$
where
 $c_{x}$
is a constant wave speed in the streamwise direction. ChannelFlow seeks solutions of a more general case:
 $$\begin{eqnarray}{\it\sigma}\boldsymbol{f}^{t_{1}}(\boldsymbol{u})-\boldsymbol{u}=\mathbf{0}.\end{eqnarray}$$
Here,
 $\boldsymbol{f}^{t_{1}}$
is the time-
 $t_{1}$
forward time integration of the Navier–Stokes equations computed by a DNS, i.e.
 $\boldsymbol{f}^{t_{1}}(\boldsymbol{u}(t))=\boldsymbol{u}(t+t_{1})$
, and
 ${\it\sigma}$
is a symmetry operator to the flow field such that
 $$\begin{eqnarray}{\it\sigma}[u,v,w](x,y,z)=[s_{x}u,s_{y}v,s_{z}w](s_{x}x+a_{x}L_{x},s_{y}y,s_{z}z+a_{z}L_{z}).\end{eqnarray}$$
Here, we are following notations for flow symmetries introduced by Gibson et al. (Reference Gibson, Halcrow and Cvitanovic2008). The symmetry operator
 ${\it\sigma}$
consists of two sets of parameters:
 $s_{x},s_{y},s_{z}$
for rotation–reflection symmetries (values are either 1 or
 $-$
1) and
 $a_{x},a_{z}$
for streamwise and spanwise translations (values are real). The symmetry operator
 ${\it\sigma}$
in (2.4) describes the translation symmetry of the TW solution after time
 $t_{1}$
. To compute TW solutions propagating in the streamwise direction, the only unknown symmetry parameter is the streamwise shift
 $a_{x}~(=c_{x}t_{1}/L_{x})$
, because the spanwise shift
 $a_{z}$
is set to zero, the other symmetry parameters are inherent to the solution and the time shift
 $t_{1}$
is chosen a priori. The parameter
 $a_{x}$
is determined as part of the solution process.
More generally, the symmetries of fluid states can be expressed with the symmetry operator (2.5). That is,
 $\boldsymbol{u}={\it\sigma}\boldsymbol{u}$
for certain values of the symmetry parameters. The symmetry operator
 ${\it\sigma}$
is then expressed in different characters to describe different symmetries of fluid states:
 ${\it\tau}$
for the spatial phase shifts,
 ${\it\sigma}$
for the reflections and
 $s$
for the shift-reflection or shift-rotation. The four flow symmetries that arise in the present study are
 $$\begin{eqnarray}\displaystyle & \displaystyle {\it\sigma}_{y}[u,v,w](x,y,z)=[u,-v,w](x,-y,z), & \displaystyle\end{eqnarray}$$
 $$\begin{eqnarray}\displaystyle & \displaystyle {\it\sigma}_{z}[u,v,w](x,y,z)=[u,v,-w](x,y,-z), & \displaystyle\end{eqnarray}$$
 $$\begin{eqnarray}\displaystyle & \displaystyle {\it\tau}_{xz}[u,v,w](x,y,z)=[u,v,w]\left(x+\frac{L_{x}}{2},y,z+\frac{L_{z}}{2}\right), & \displaystyle\end{eqnarray}$$
 $$\begin{eqnarray}\displaystyle & \displaystyle s_{1}[u,v,w](x,y,z)=[u,v,-w]\left(x+\frac{L_{x}}{2},y,-z\right). & \displaystyle\end{eqnarray}$$
 ${\it\sigma}_{y}$
and
 ${\it\sigma}_{z}$
symmetries correspond to reflections with respect to the midplanes in the
 $y$
and
 $z$
directions respectively. The
 ${\it\tau}_{xz}$
and
 $s_{1}$
symmetries denote half-domain translations in the
 $x$
and
 $z$
directions and a shift-reflection symmetry respectively. In particular, the
 $s_{1}$
symmetry is related to the sinusoidal instability of streaks (Waleffe Reference Waleffe1997), which is also called the fundamental sinuous mode.
Finding solutions to (2.4) requires good initial guesses. We generate these using instantaneous velocity fields from DNS of turbulent trajectories that have been symmetrized with respect to the midplane of the domain,
 $y=0$
(i.e. all initial guesses satisfy
 $\boldsymbol{u}={\it\sigma}_{y}\boldsymbol{u}$
). In particular, since hibernating turbulence has been hypothesized to be closely related to travelling wave solutions (Xi & Graham Reference Xi and Graham2012a
), we chose initial guesses from instants with a lower wall shear stress than the mean value. The time shift
 $t_{1}$
is arbitrary. A relatively large value provides substantial improvement to the rate of convergence of the Krylov subspace methods that are used in our computation, but larger values of
 $t_{1}$
require longer to compute
 $\boldsymbol{f}^{t_{1}}$
. We chose
 $t_{1}=20$
in that it seems to balance these two aspects well. The initial guess for the streamwise shift
 $a_{x}$
is determined by approximating the wave speed as the bulk velocity of the symmetrized initial velocity field. Appropriate symmetries are enforced during the time-
 $t_{1}$
time integration and the search procedure. To solve (2.4) a Krylov subspace method is used to solve the linear systems arising at each Newton step. For better convergence, a trust-region limitation to the magnitude of the Newton steps or a hook step within a Krylov subspace is computed for the optimal Newton step. The Newton iteration is repeated until an accuracy of
 $O(10^{-15})$
is reached, where the accuracy is the residual of
 $\Vert {\it\sigma}\boldsymbol{f}^{t_{1}}(\boldsymbol{u})-\boldsymbol{u}\Vert$
, using the
 $L_{2}$
norm
 $$\begin{eqnarray}\Vert \boldsymbol{g}\Vert =\left[\frac{1}{2L_{x}L_{z}}\int _{0}^{L_{z}}\int _{-1}^{1}\int _{0}^{L_{x}}\boldsymbol{g}\boldsymbol{\cdot }\boldsymbol{g}\,\text{d}x\,\text{d}y\,\text{d}z\right]^{1/2}.\end{eqnarray}$$
It should be noted that the ChannelFlow code calculates this residual. A detailed description of the solution algorithm and DNS can be found in Gibson et al. (Reference Gibson, Halcrow and Cvitanovic2008, Reference Gibson, Halcrow and Cvitanovic2009) and Viswanath (Reference Viswanath2007, Reference Viswanath2009).
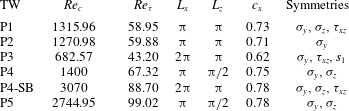
Scales and symmetries of TW solutions at their saddle–node bifurcation points. The wave speed is normalized by the laminar centreline velocity. It should be noted that the bifurcation points for P2 and the P4 subharmonic branch (SB) correspond to their minima due to the discovery of only one branch.

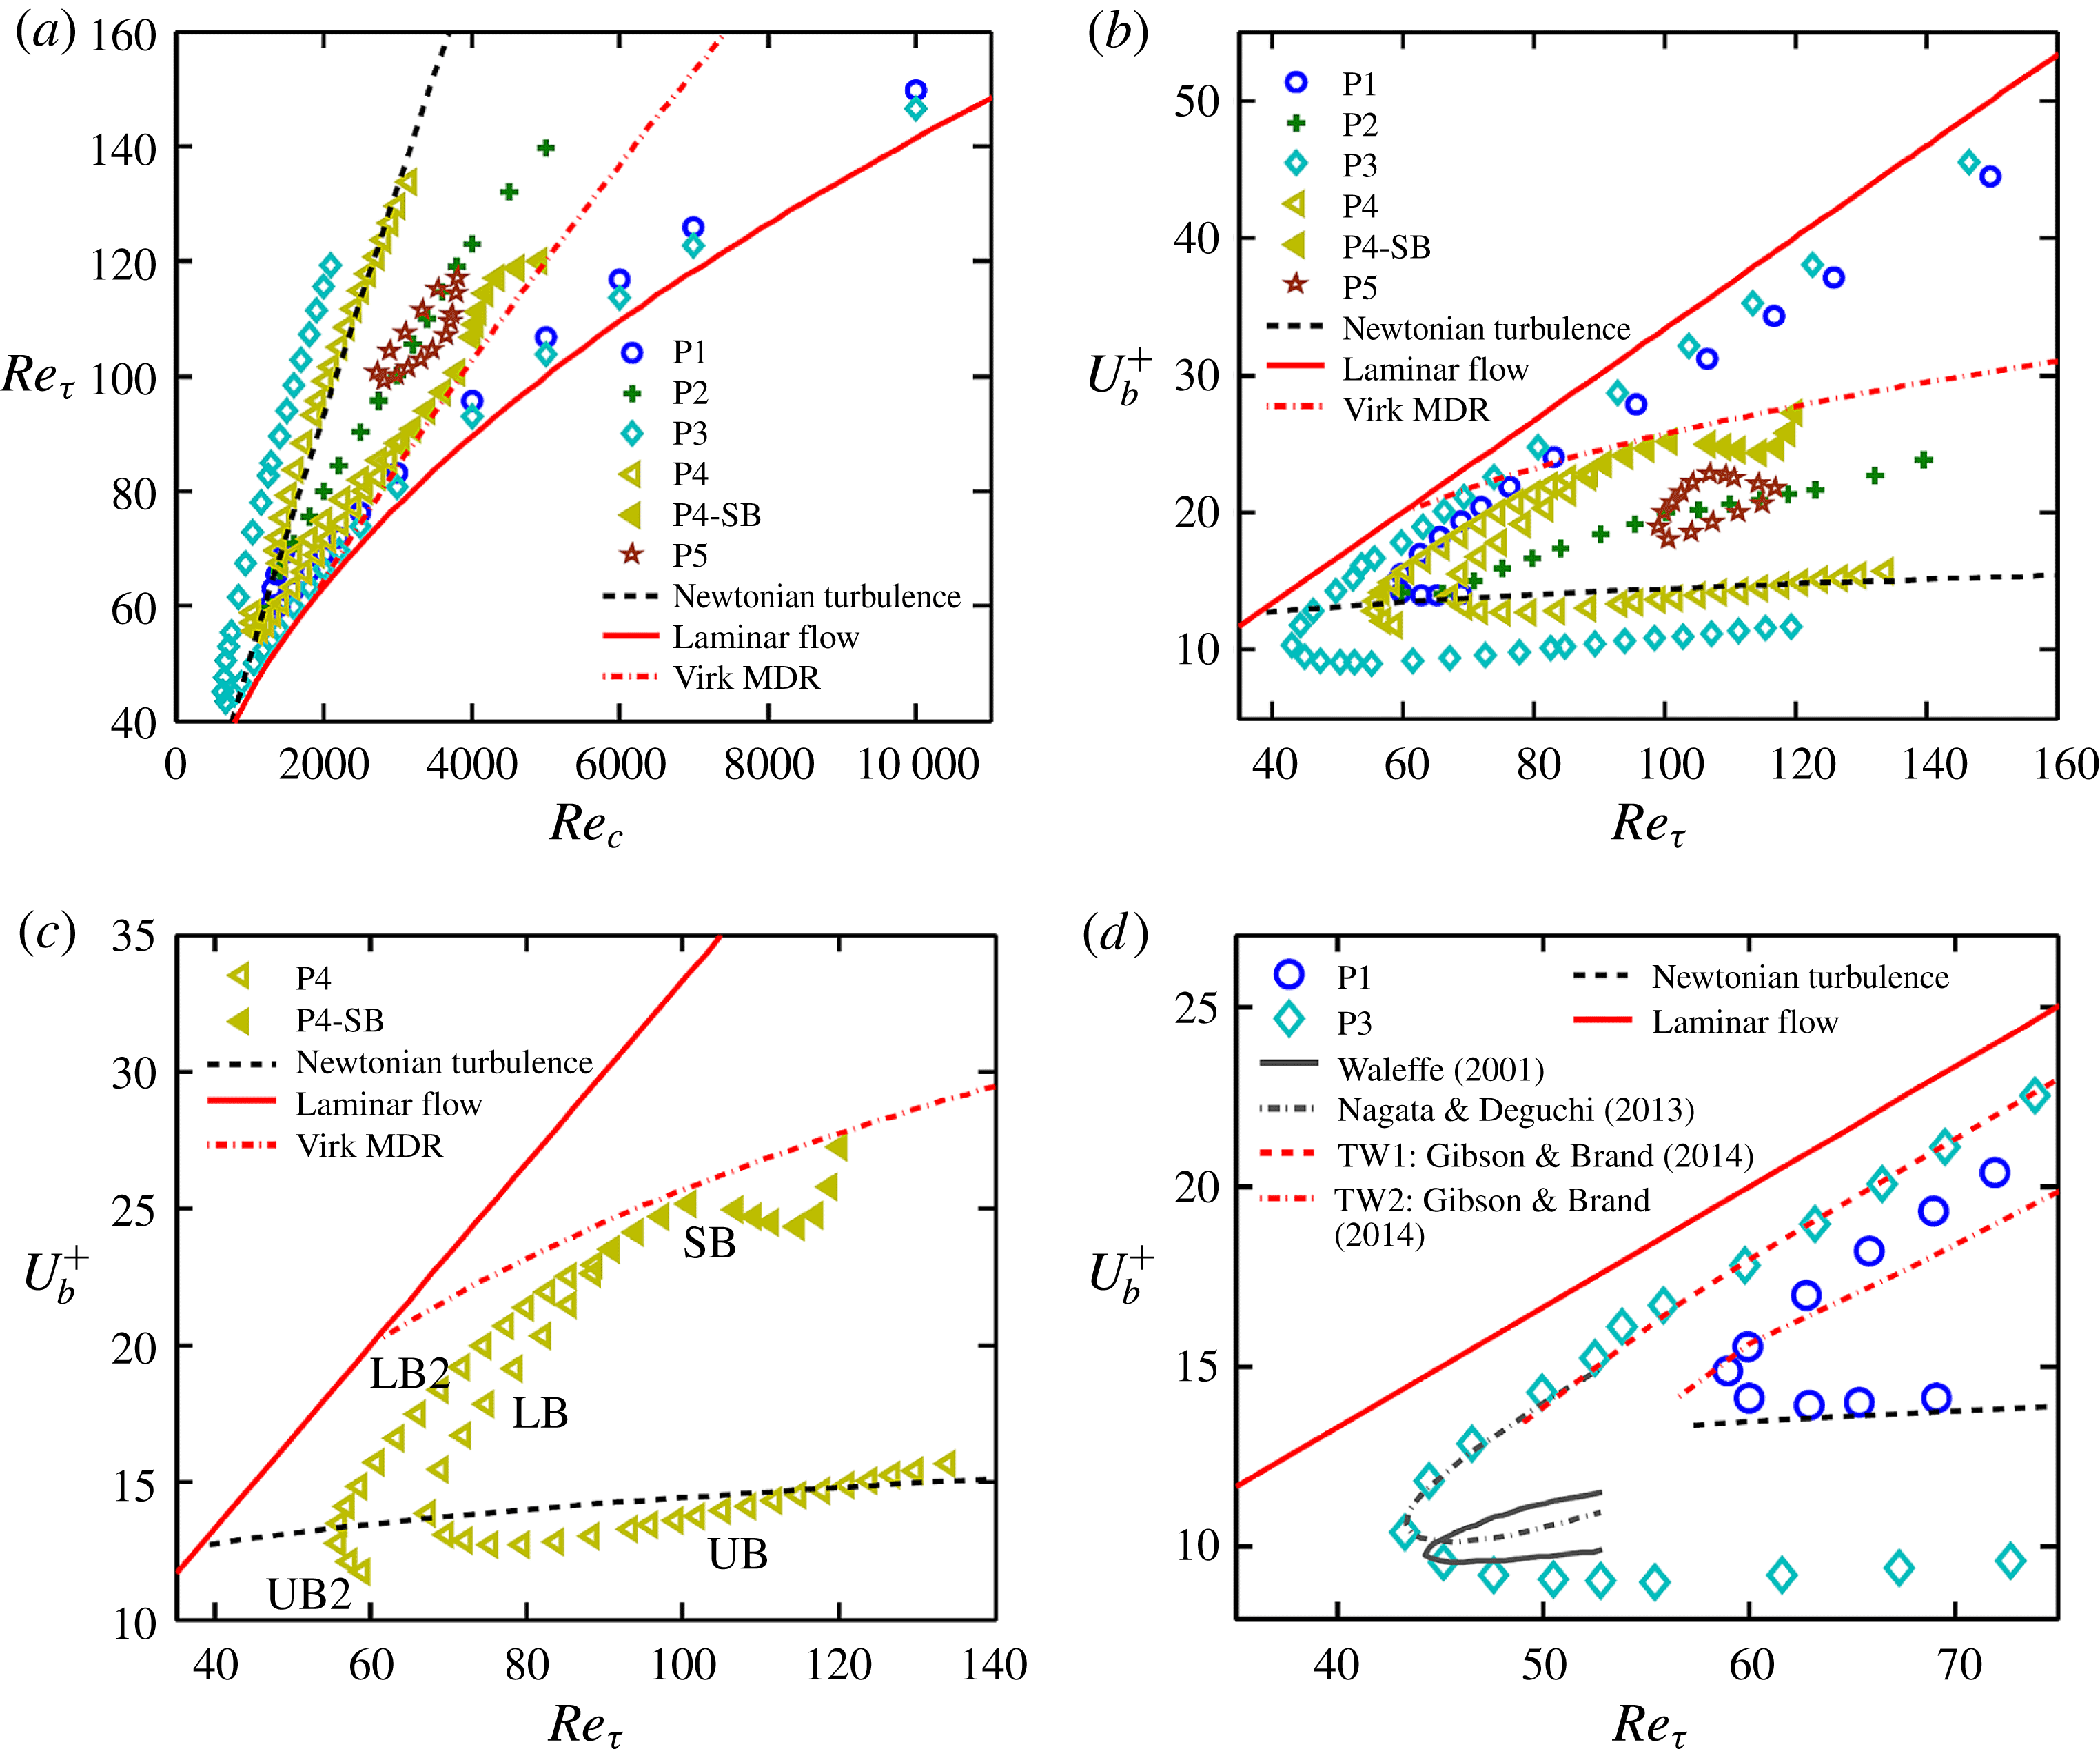
(a) A bifurcation diagram for five families of TW solutions in terms of the Reynolds number
 $Re_{c}=U_{c}h/{\it\nu}$
and friction Reynolds number
 $Re_{{\it\tau}}=u_{{\it\tau}}h/{\it\nu}$
. The curves for Newtonian turbulence and laminar flows are shown. For P4, solid symbols correspond to solutions computed by an SB. (b) A Prandtl–von Kármán plot for a bifurcation diagram. The average velocities as a function of the friction Reynolds number are shown along with curves for Newtonian turbulence, laminar flow and the Virk MDR. (c) Only the P4 solution family is shown. (d) A comparison of P1 and P3 to earlier solutions of Waleffe (Reference Waleffe2001), Nagata & Deguchi (Reference Nagata and Deguchi2013) and Gibson & Brand (Reference Gibson and Brand2014) in the same geometry.

3. Results and discussion
3.1. Travelling wave families: bifurcation diagram, mean profiles and overall structures
We computed five families of nonlinear TW solutions in plane Poiseuille flow, which we have labelled P1 to P5, in domains of three different sizes:
 $[{\rm\pi},2,{\rm\pi}]$
,
 $[2{\rm\pi},2,{\rm\pi}]$
and
 $[{\rm\pi},2,{\rm\pi}/2]$
. For the same flow geometry, the previous studies of Nagata & Deguchi (Reference Nagata and Deguchi2013) and Gibson & Brand (Reference Gibson and Brand2014) used the domain of
 $[2{\rm\pi},2,{\rm\pi}]$
and Toh & Itano (Reference Toh and Itano2003) used the domain of
 $[{\rm\pi},2,0.4{\rm\pi}]$
. The minimum spanwise domain size used here is approximately
 $95{\it\delta}_{{\it\nu}}$
, corresponding to the length scales of the optimal spanwise wavelength for ECSs (Waleffe Reference Waleffe2003) and of the near-wall streak spacing of approximately
 $100{\it\delta}_{{\it\nu}}$
(Smith & Metzler Reference Smith and Metzler1983). This minimum spanwise length scale is also within the range of the critical channel widths approximately 85–110 wall units used for the minimal flow unit studies (Jimenez & Moin Reference Jimenez and Moin1991). Table 1 presents scales and symmetries of the solutions at their bifurcation points. Since only one solution branch is found for P2, the lowest
 $Re$
solution is presented. Because we imposed the
 ${\it\sigma}_{y}$
symmetry on initial guesses, all solutions exhibit this
 ${\it\sigma}_{y}$
symmetry; P2 has only this symmetry. The half-period translations in the streamwise and spanwise directions,
 ${\it\tau}_{xz}$
, are found for P1 and P3. The shift-reflect symmetry
 $s_{1}$
responsible for the fundamental sinuous mode is found for P3.
The bifurcation diagram for these solution families is shown in figure 2(a). The solutions are plotted using the friction Reynolds number versus the laminar equivalent Reynolds number. For each solution family, a solution with higher
 $Re_{{\it\tau}}$
is a UB solution corresponding to high drag, while its counterpart is an LB solution. For comparison, Newtonian turbulence and laminar flow are also drawn. Another representation of the bifurcation diagram, a Prandtl–von Kármán plot, is shown in figure 2(b). This form is often used to represent drag reduction characteristics in wall-bounded turbulent flows. The bulk velocities
 $U_{b}^{+}$
are plotted as a function of the friction Reynolds number along with curves for Newtonian turbulence, laminar flow and Virk MDR. The curve for the Virk MDR is generated using its universal mean velocity profile (Virk Reference Virk1975). We elaborate below on the solutions with respect to the Prandtl–von Kármán plot. In this representation, a ‘lower-branch’ solution is above the ‘upper branch’, because the former has higher bulk velocity for the same wall shear stress than the latter. With the exception of the LB solutions of P1 and P3, the maximum
 $Re$
at which a solution is shown on the bifurcation diagram represents the highest
 $Re$
at which a converged solution could be found. Obtaining solutions at higher
 $Re$
will require further refinements in techniques for solving (2.4).
The LBs of P1 and P3 become very close and parallel to the laminar solution as the Reynolds number increases. Their closeness to the laminar state indicates that they are very-low-drag states. These LB solutions have very weak spatial variations and Reynolds number dependence and have been successfully continued up to
 $Re_{{\it\tau}}\approx 300$
(corresponding to
 $Re_{c}\approx 40\,000$
). Regarding the UBs of the solution families, in the range where we have computed it, P1 has a similar level of drag (i.e. a similar bulk velocity for a given
 $Re_{{\it\tau}}$
) to Newtonian turbulence. The P3 UB, however, shows higher drag than Newtonian turbulence, displaying the highest drag level among the solutions found in the present study. The P2 solution branch appears to bifurcate off P1, a result that is confirmed below when we see that P2 has a broken
 ${\it\sigma}_{z}$
symmetry. The P5 solution family forms a closed loop (isola).
Let us now focus on the P4 solution family, which shows very intriguing behaviour with regard to Newtonian and viscoelastic turbulence. Figure 2(c) shows only the P4 solution family. Consider the UB (low-velocity) solution at the upper range of convergence
 $Re_{{\it\tau}}\approx 130$
. This solution branch has a mean velocity very close to that of Newtonian turbulence (the black dashed curve). As
 $Re$
decreases along this branch, the solution remains close to the Newtonian turbulence curve until it undergoes a turning point at
 $Re_{{\it\tau}}=67.32$
, beyond which the LB appears to approach the Virk MDR curve. This solution branch turns around again at
 $Re_{{\it\tau}}=88.7$
, forming another LB solution (which we call LB2). As we decrease the Reynolds number, the new branch reaches another bifurcation point at
 $Re_{{\it\tau}}=55.63$
, and we denote the solution beyond this point as UB2. Thus, there are three bifurcation points for the P4 solution family. Interestingly, the bulk velocities at the bifurcation points at
 $Re_{{\it\tau}}=55.63$
and
 $67.32$
are remarkably close to the Newtonian turbulence value, while the third bifurcation point at
 $Re_{{\it\tau}}=88.7$
is close to the Virk MDR value. Finally, above the turning point at
 $Re_{{\it\tau}}=88.7$
, a subharmonic – spatiotemporal period doubling – branch (SB) arises, which has doubled fundamental spatial periods in the
 $x$
and
 $z$
directions compared with the P4 solution family (i.e.
 $L_{x}$
becomes
 $2{\rm\pi}$
and
 $L_{z}$
becomes
 ${\rm\pi}$
), while the wave speed remains constant. Thus, at any point in the domain the temporal period of the velocity, as measured in the laboratory frame, doubles. The subharmonic solutions are indicated by solid symbols. This solution closely follows the MDR curve until
 $Re_{{\it\tau}}\approx 105$
, deviating from and then returning to it as
 $Re$
increases further.
Prior to proceeding to figure 2(d), it is worth mentioning the linear stability of the solutions. The leading eigenvalues of the solutions are computed in their symmetric subspace with Arnoldi iteration (Viswanath Reference Viswanath2007). The P1, P3 and P5 LB solutions have a single real unstable eigenvalue, while the P4 LB (P4-LB) solution has two real unstable eigenvalues. The P4-LB2 solution has three real unstable eigenvalues and the P4 SB (P4-SB) solution has three real and three complex conjugate unstable eigenvalues. Turning from the P4-LB to the P4-UB (or from P4-LB2 to P4-UB2), one real unstable eigenvalue goes complex immediately in a Takens–Bogdanov bifurcation (Guckenheimer & Holmes Reference Guckenheimer and Holmes1983), at which an eigenvalue associated with a saddle–node bifurcation collides with another eigenvalue. Therefore, just beyond their respective turning points, P4-UB and P4-UB2 have one real and one complex conjugate pair and two real and one complex conjugate pair of unstable eigenvalues respectively. The P1, P3 and P5 solutions also experience the Takens–Bogdanov bifurcation after crossing the LB to the UB. Interestingly, this behaviour has also been observed near turning points of pipe flow TWs (Pringle, Duguet & Kerswell Reference Pringle, Duguet and Kerswell2009; Mellibovsky & Eckhardt Reference Mellibovsky and Eckhardt2011) and thus seems to be rather generic for TWs in shear flows.
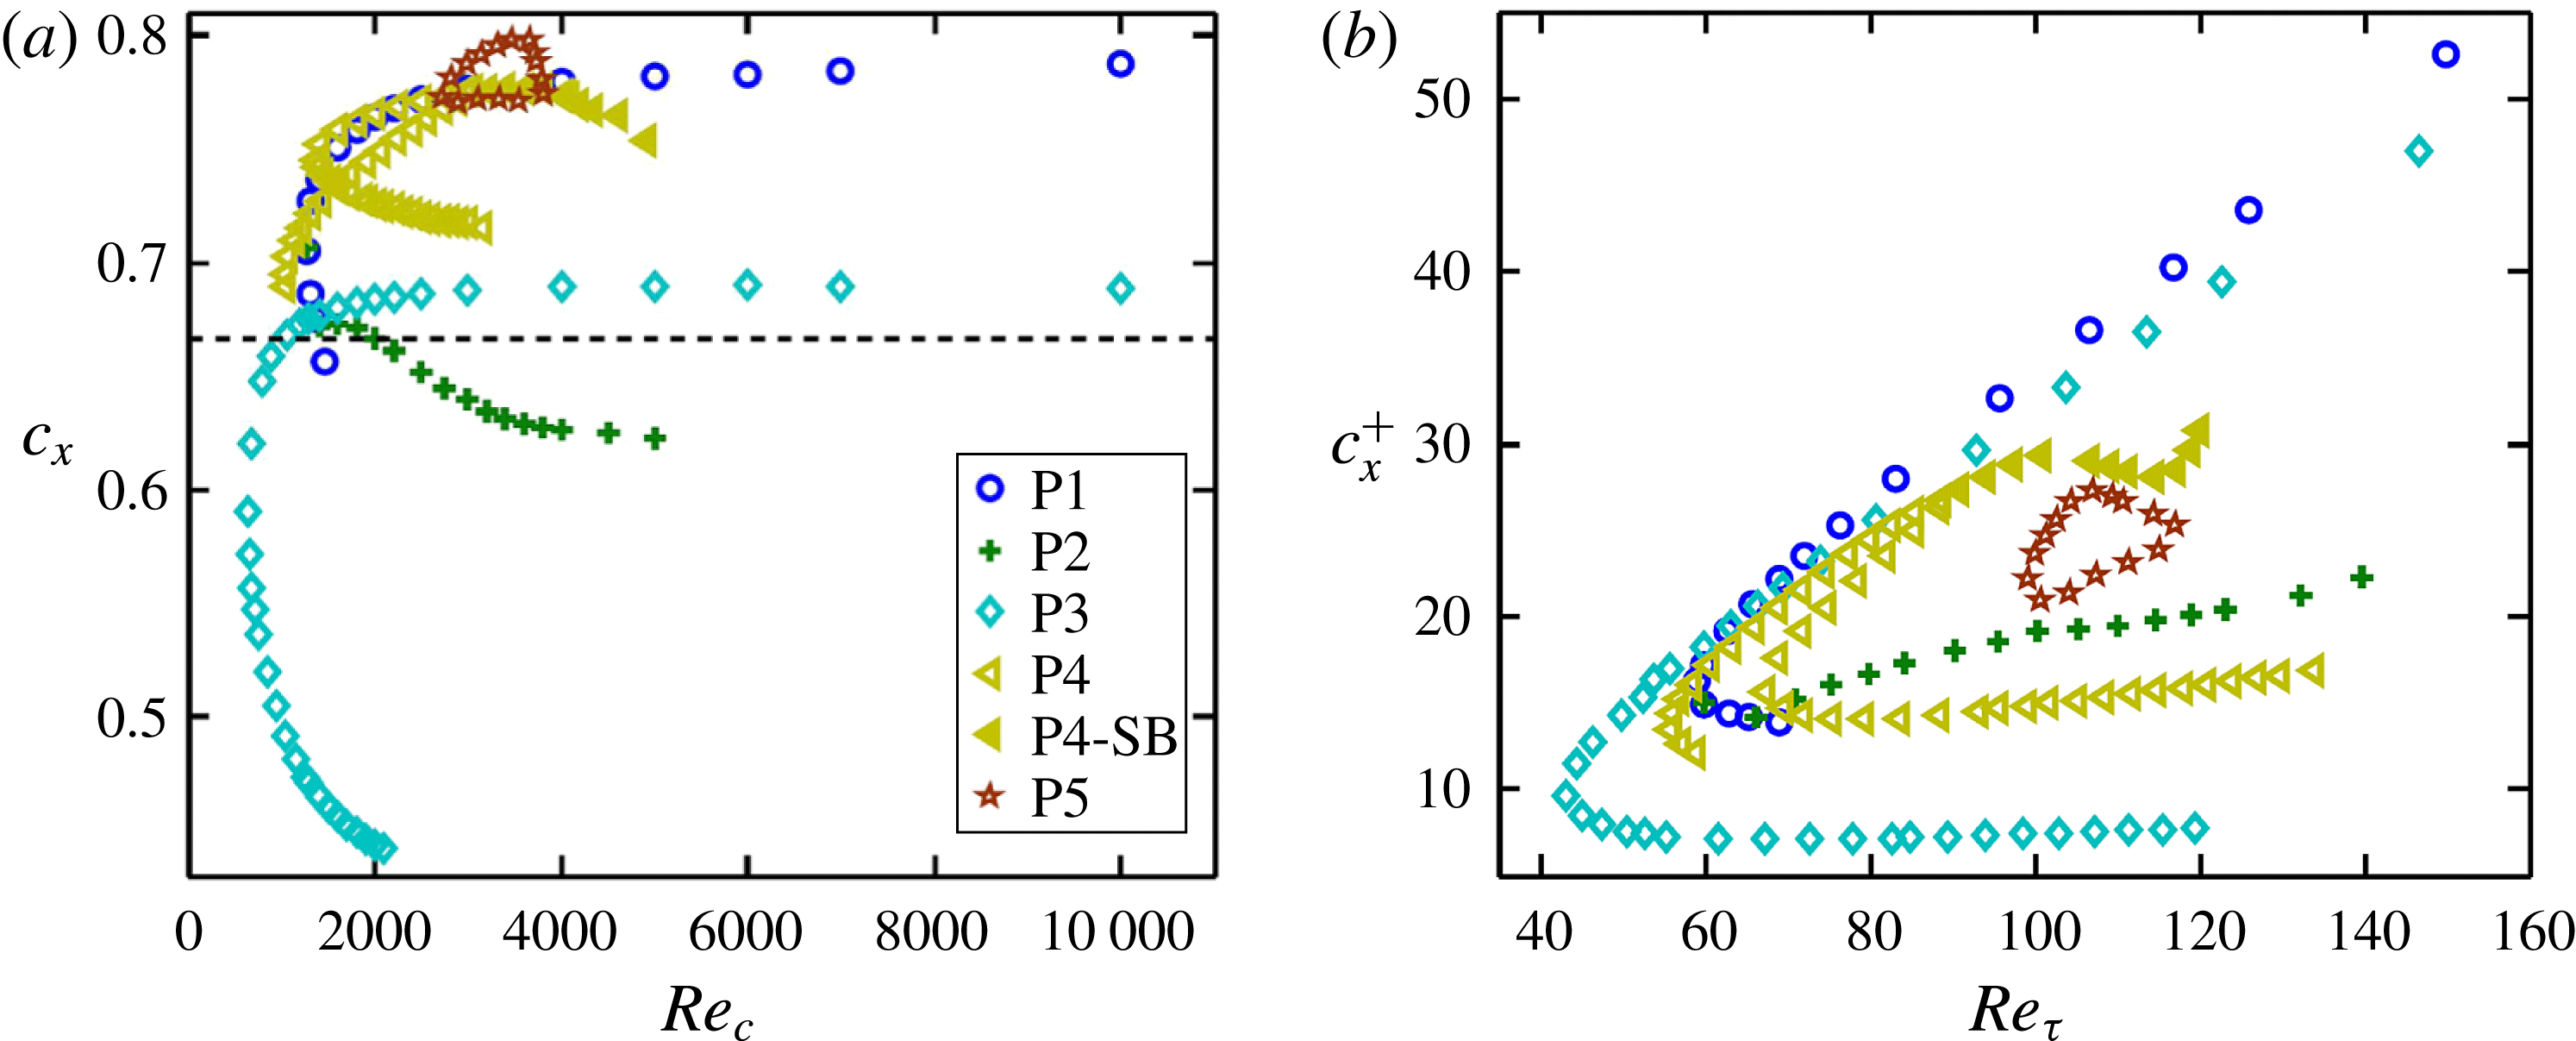
Wave speeds for the TWs as a function of the Reynolds number in (a) outer units and (b) inner units. In (a), the wave speeds are normalized by the laminar centreline velocity and the dashed line represents the laminar bulk velocity.

Figure 2(d) compares P1 and P3 with earlier TW solutions discovered by Waleffe (Reference Waleffe2001), Nagata & Deguchi (Reference Nagata and Deguchi2013) and Gibson & Brand (Reference Gibson and Brand2014) in the same geometry. The curves for the Waleffe and Nagata and Deguchi solutions are generated from figure 5 of Nagata & Deguchi (Reference Nagata and Deguchi2013), where the optimal wavelengths were used. Gibson and Brand’s two solutions, named TW1 and TW2 in their paper, have the same wavelengths as P3. The solution of Nagata and Deguchi, called MS-S in their paper, possesses
 ${\it\sigma}_{y}$
,
 ${\it\sigma}_{z}$
and
 $s_{1}$
symmetries, and the Waleffe solution lacks the
 ${\it\sigma}_{z}$
symmetry compared with the MS-S solution. The TW1 solution has the same symmetries as P1, while the
 ${\it\sigma}_{y}$
symmetry is lost in TW2. The bifurcation points of the P3, Waleffe and MS-S solutions are very close to each other. As shown, the P3-UB appears to be the highest-drag state. It should be noted that the Waleffe, MS-S and TW1 solutions were obtained by continuation from plane Couette to Poiseuille conditions, but TW2 was obtained in a similar manner to an edge tracking method using a velocity field from DNS as an initial guess. To the best of our knowledge, solutions similar to P4 and P5 have not previously been found.
Figure 3(a,b) shows the wave speed
 $c_{x}$
of the solutions as a function of the Reynolds number in outer and inner units. In general, the wave speed follows the same trend as the bulk velocity: in a given solution family, an LB solution propagates faster than a UB solution. In outer units in figure 3(a), the laminar bulk velocity is plotted with a dashed line. Most of the solutions have a larger wave speed than the laminar bulk velocity, indicating that they propagate forward when viewed in a reference frame moving at the laminar bulk velocity. The wave speeds of the P1 and P3 LB solutions appear to become constant with increasing Reynolds number, while those of their UB solutions decrease drastically. When plotted in inner units, the wave speed behaviour shows almost the same shape as the bulk velocity plot in figure 2.
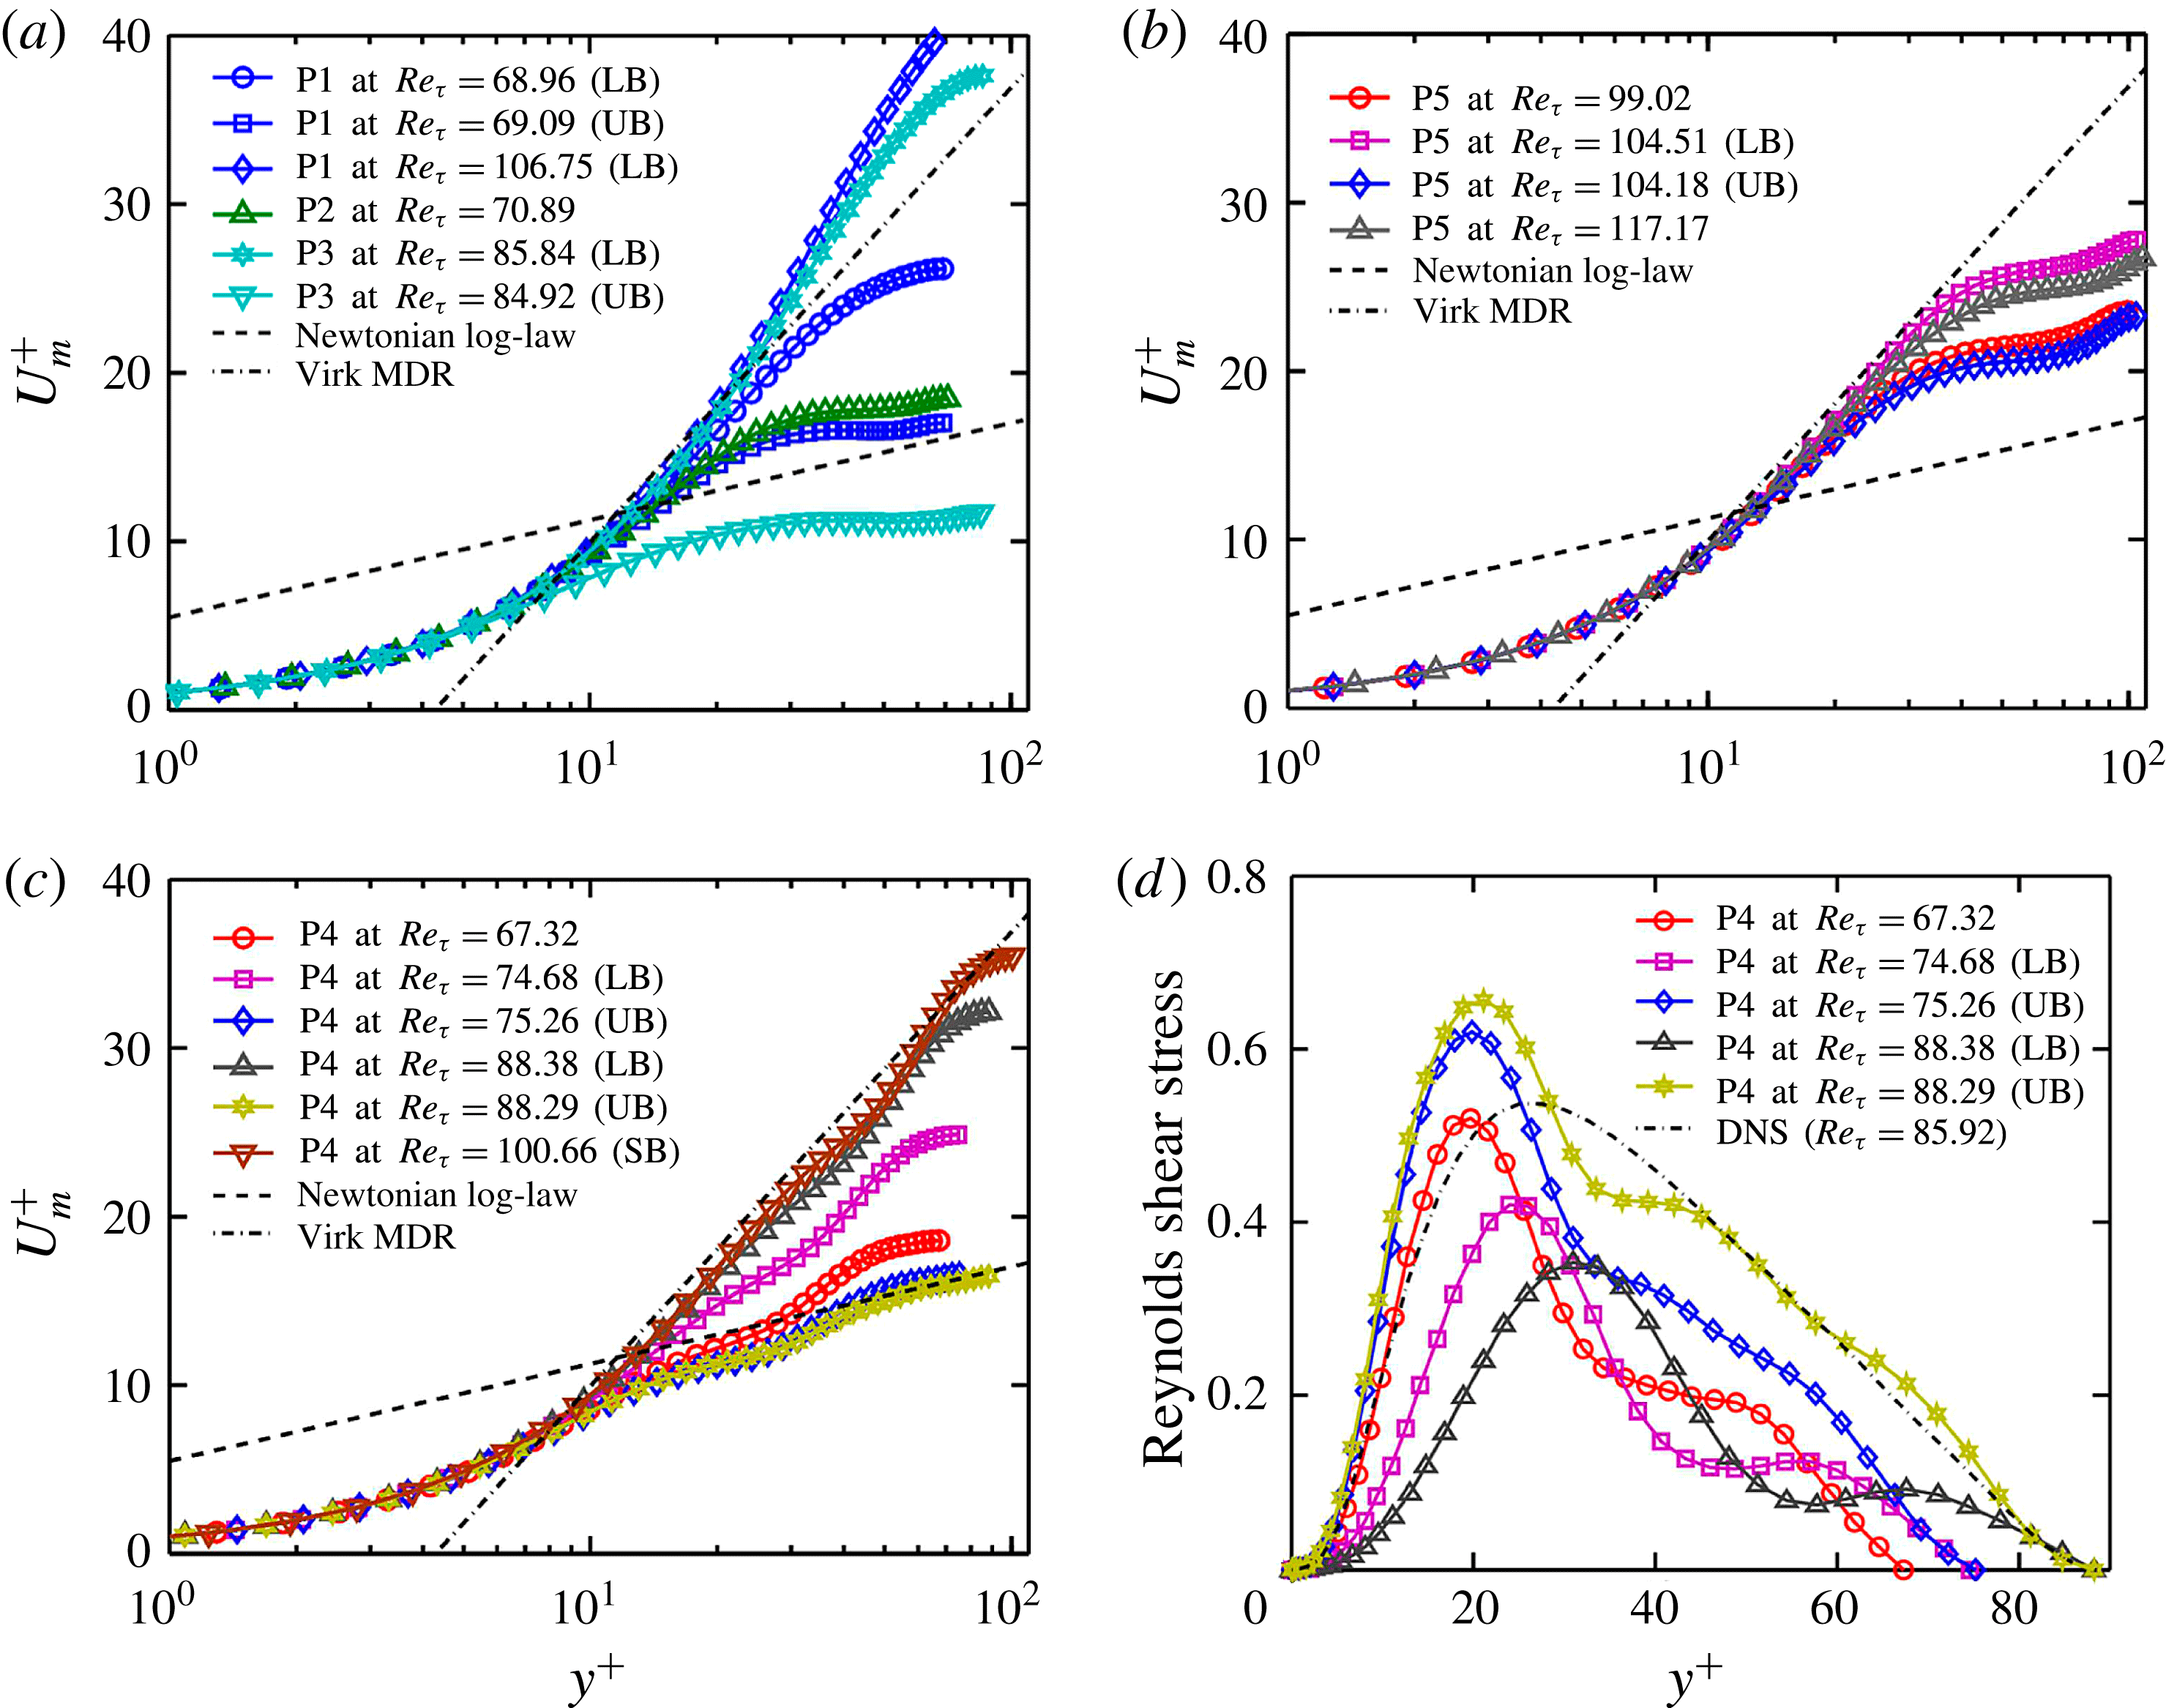
We now turn our attention to the mean velocity profiles
 $U_{m}^{+}(y^{+})$
. Figure 4(a) shows these for P1, P2 and P3. For comparison, we also plot the von Kármán log-law
 $U_{m}^{+}(y^{+})=2.5\ln y^{+}+5.5$
profile of Newtonian turbulence and the Virk log-law
 $U_{m}^{+}(y^{+})=11.7\ln y^{+}-17.0$
that approximates the mean velocity profile in the MDR regime. As expected from the average velocity results in figure 2(b), the LB velocity profiles for P1 and P3 are well above the Virk MDR profile for
 $Re_{{\it\tau}}>80$
and very close to the parabolic laminar profile. The highest-drag solution for P3-UB shows a mean velocity profile well below the von Kármán log-law profile. The velocity profile for P2 shows a similar character to the P1-UB and P3-UB profiles.
In figure 4(b), the mean velocity profiles for P5 are shown at its minimum and maximum Reynolds numbers, and at
 $Re_{{\it\tau}}\approx 104$
. In particular, the LB velocity profile at
 $Re_{{\it\tau}}=104.51$
very closely approaches the Virk MDR log-law in the range
 $15<y^{+}<45$
.
Mean velocity profiles for (a) P1, P2 and P3, (b) P5 and (c) P4, in comparison to the log-laws for Newtonian turbulence and Virk MDR. (d) Mean profiles of the Reynolds shear stress for the P4 solution family. The dot-dashed line is a time-average profile for long DNS trajectories.

Figure 4(c) shows mean velocity profiles for P4. Starting from its first bifurcation point at
 $Re_{{\it\tau}}=67.32$
, the UB and LB profiles seem to approach towards two distinct limits, the von Kármán and Virk MDR profiles respectively, as the Reynolds number is increased. In particular, the LB profile at
 $Re_{{\it\tau}}=88.38$
very closely approaches the Virk MDR log-law profile over a relatively wide range,
 $15<y^{+}<70$
. This LB profile is very similar to the conditionally sampled DNS velocity profile and the experimentally observed profile for Newtonian hibernating turbulence (Xi & Graham Reference Xi and Graham2012b
; Whalley et al.
Reference Whalley, Park, Kushwaha, Dennis, Graham and Poole2014). Meanwhile, the UB profile lies very close to the experimentally observed mean profile of Newtonian turbulent flows and approaches the von Kármán log-law profile at large
 $y^{+}$
, as does active turbulence. The SB profile is also presented for
 $Re_{{\it\tau}}=100.66$
, showing a similar shape to the LB. Hence, the UB, LB and SB of the P4 solution family may represent an envelope in state space encompassed by the mean profiles of both the Virk MDR and the classical Newtonian turbulence.
For the P4 solution family, we plot Reynolds shear stress profiles in figure 4(d), in comparison to the time-average Newtonian profile for long DNS trajectories. As the Reynolds number is increased, the Reynolds shear stress for LB solutions decreases, while the UB profile increases. Compared with the time-average Newtonian profile at
 $Re_{{\it\tau}}\approx 86$
, the reduction in the LB solution is substantial. Interestingly, the UB profile is slightly higher compared with the magnitudes of the Newtonian profile in
 $y^{+}<30$
, but it almost collapses onto the Newtonian profile for
 $y^{+}>45$
.
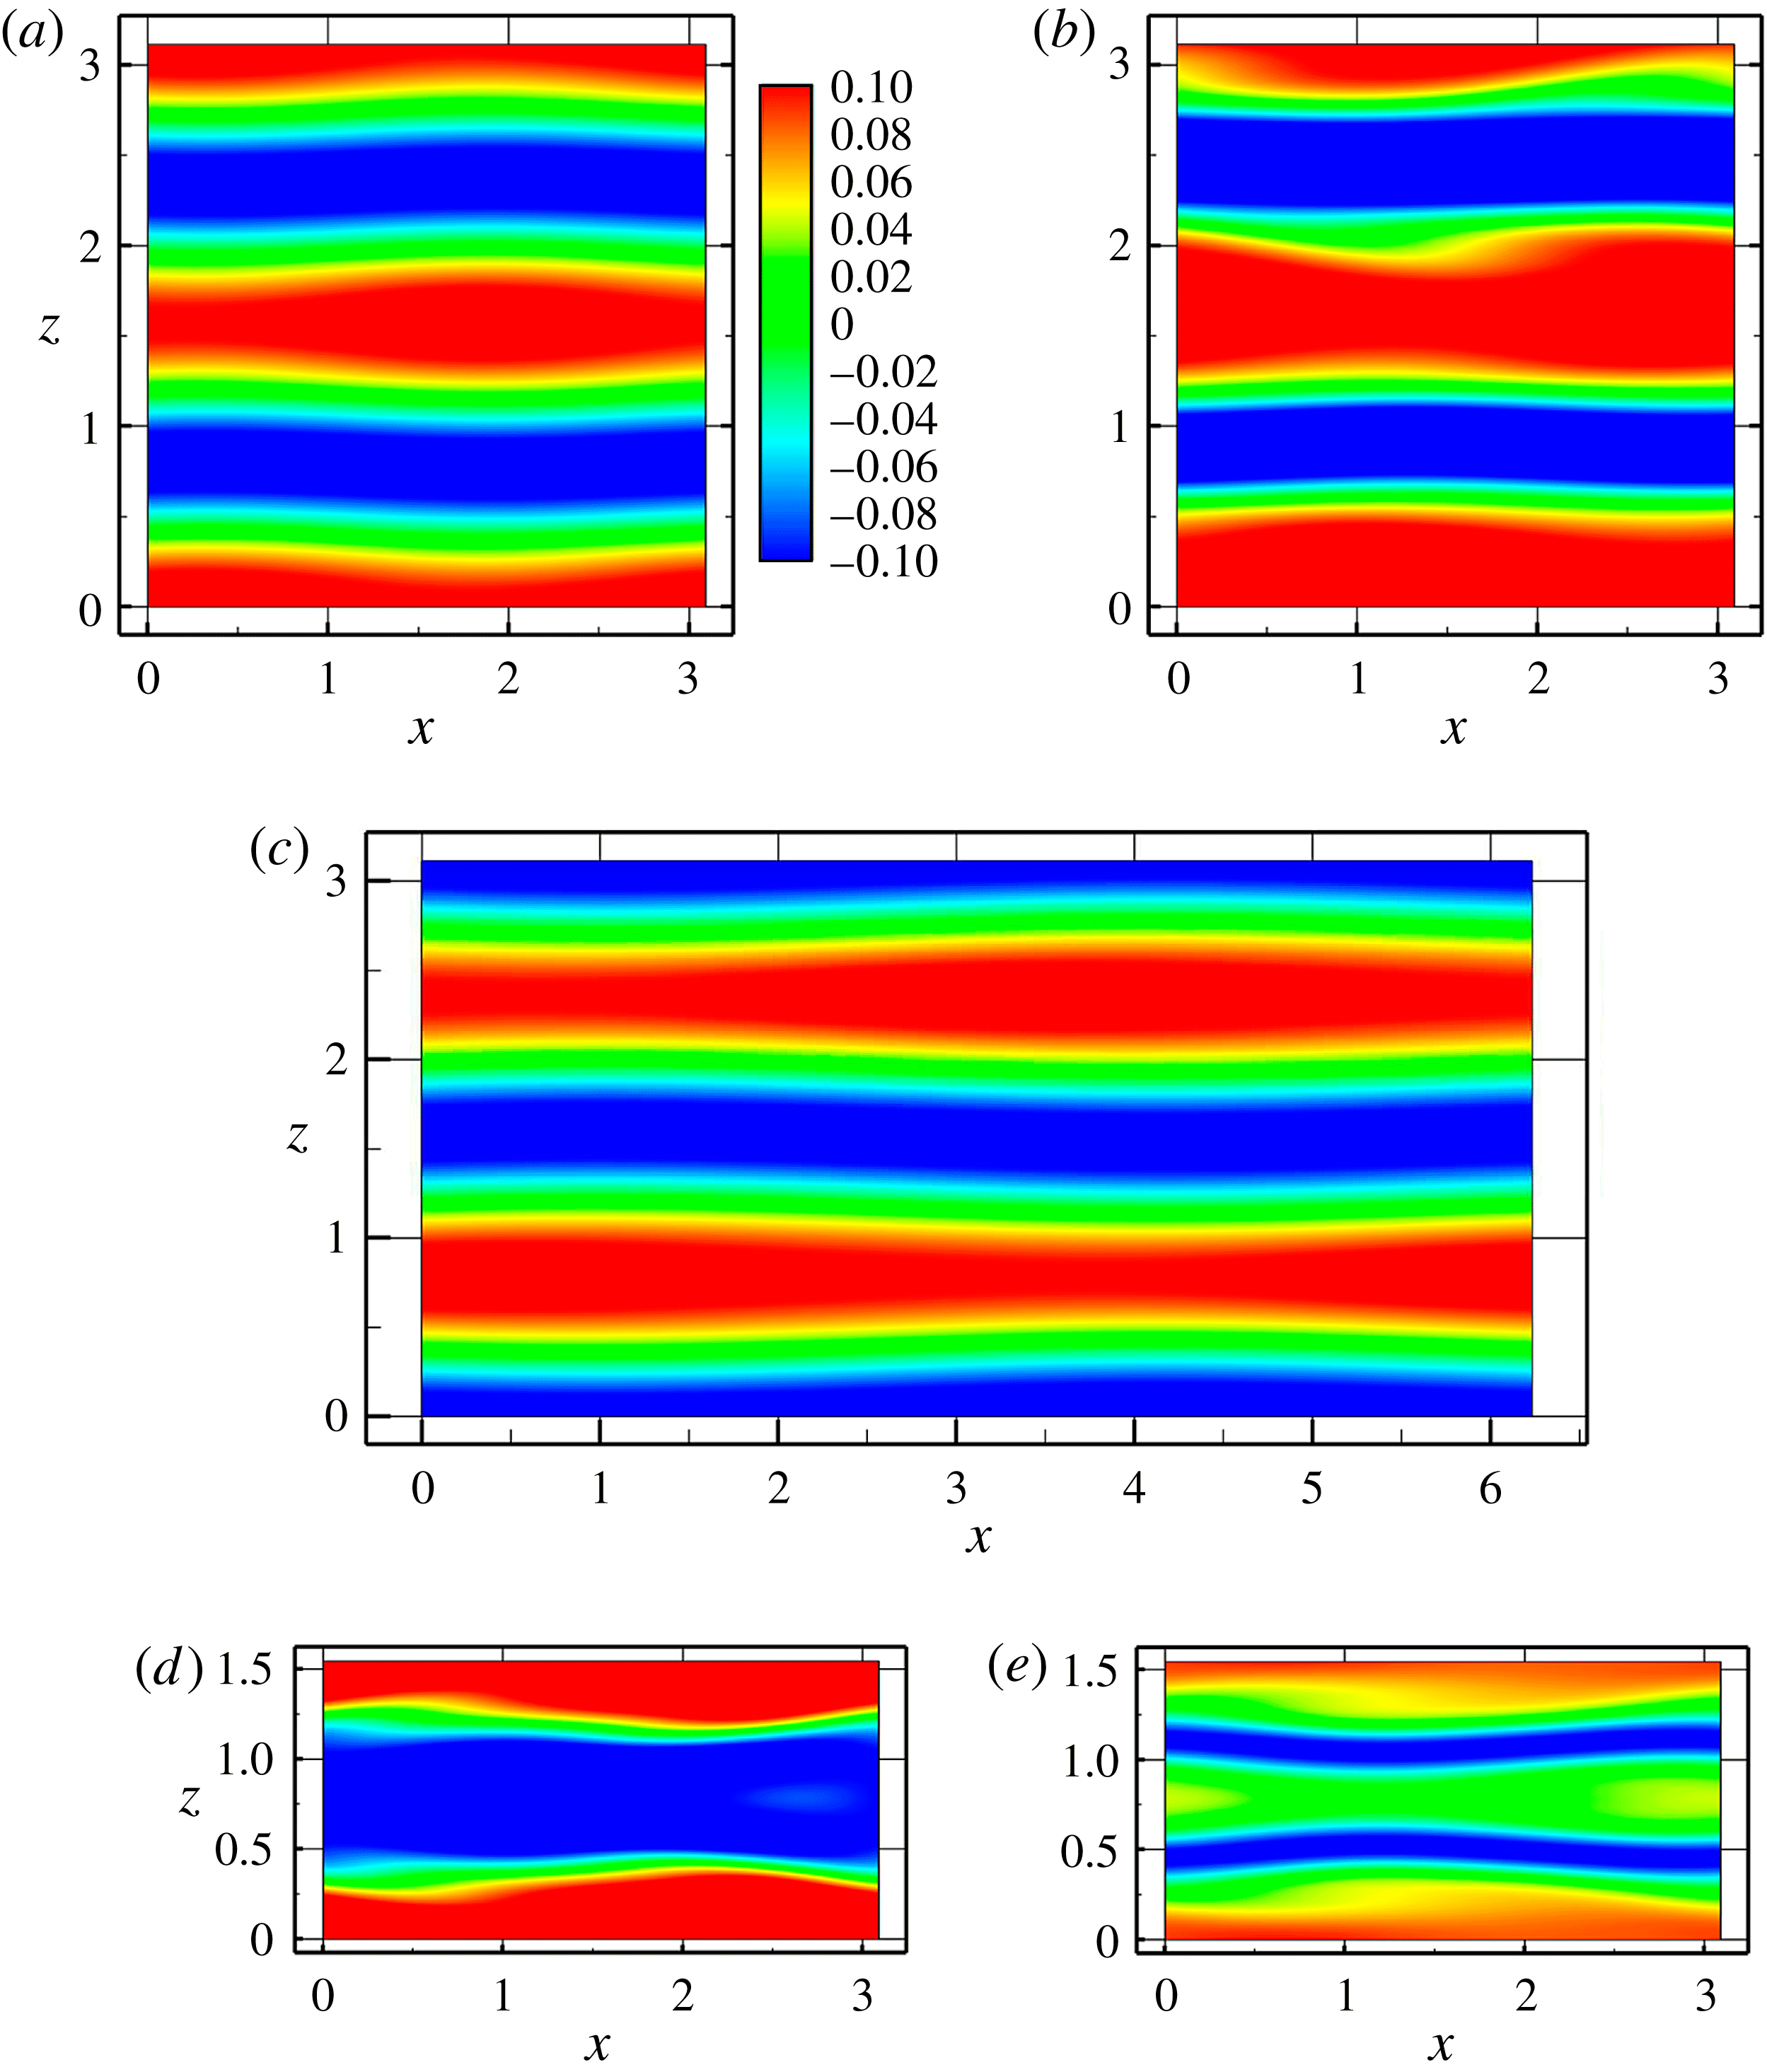
Contours of streamwise velocity fluctuation in the
 $x$
–
 $z$
plane at
 $y=-0.5$
for (a) P1, (b) P2, (c) P3, (d) P4 at
 $Re_{c}=1800$
and (e) P5 at
 $Re_{c}=3600$
. Lower-branch solutions are presented except for P2, for which there is only one branch. Blue and red indicate low- and high-speed streaks respectively.

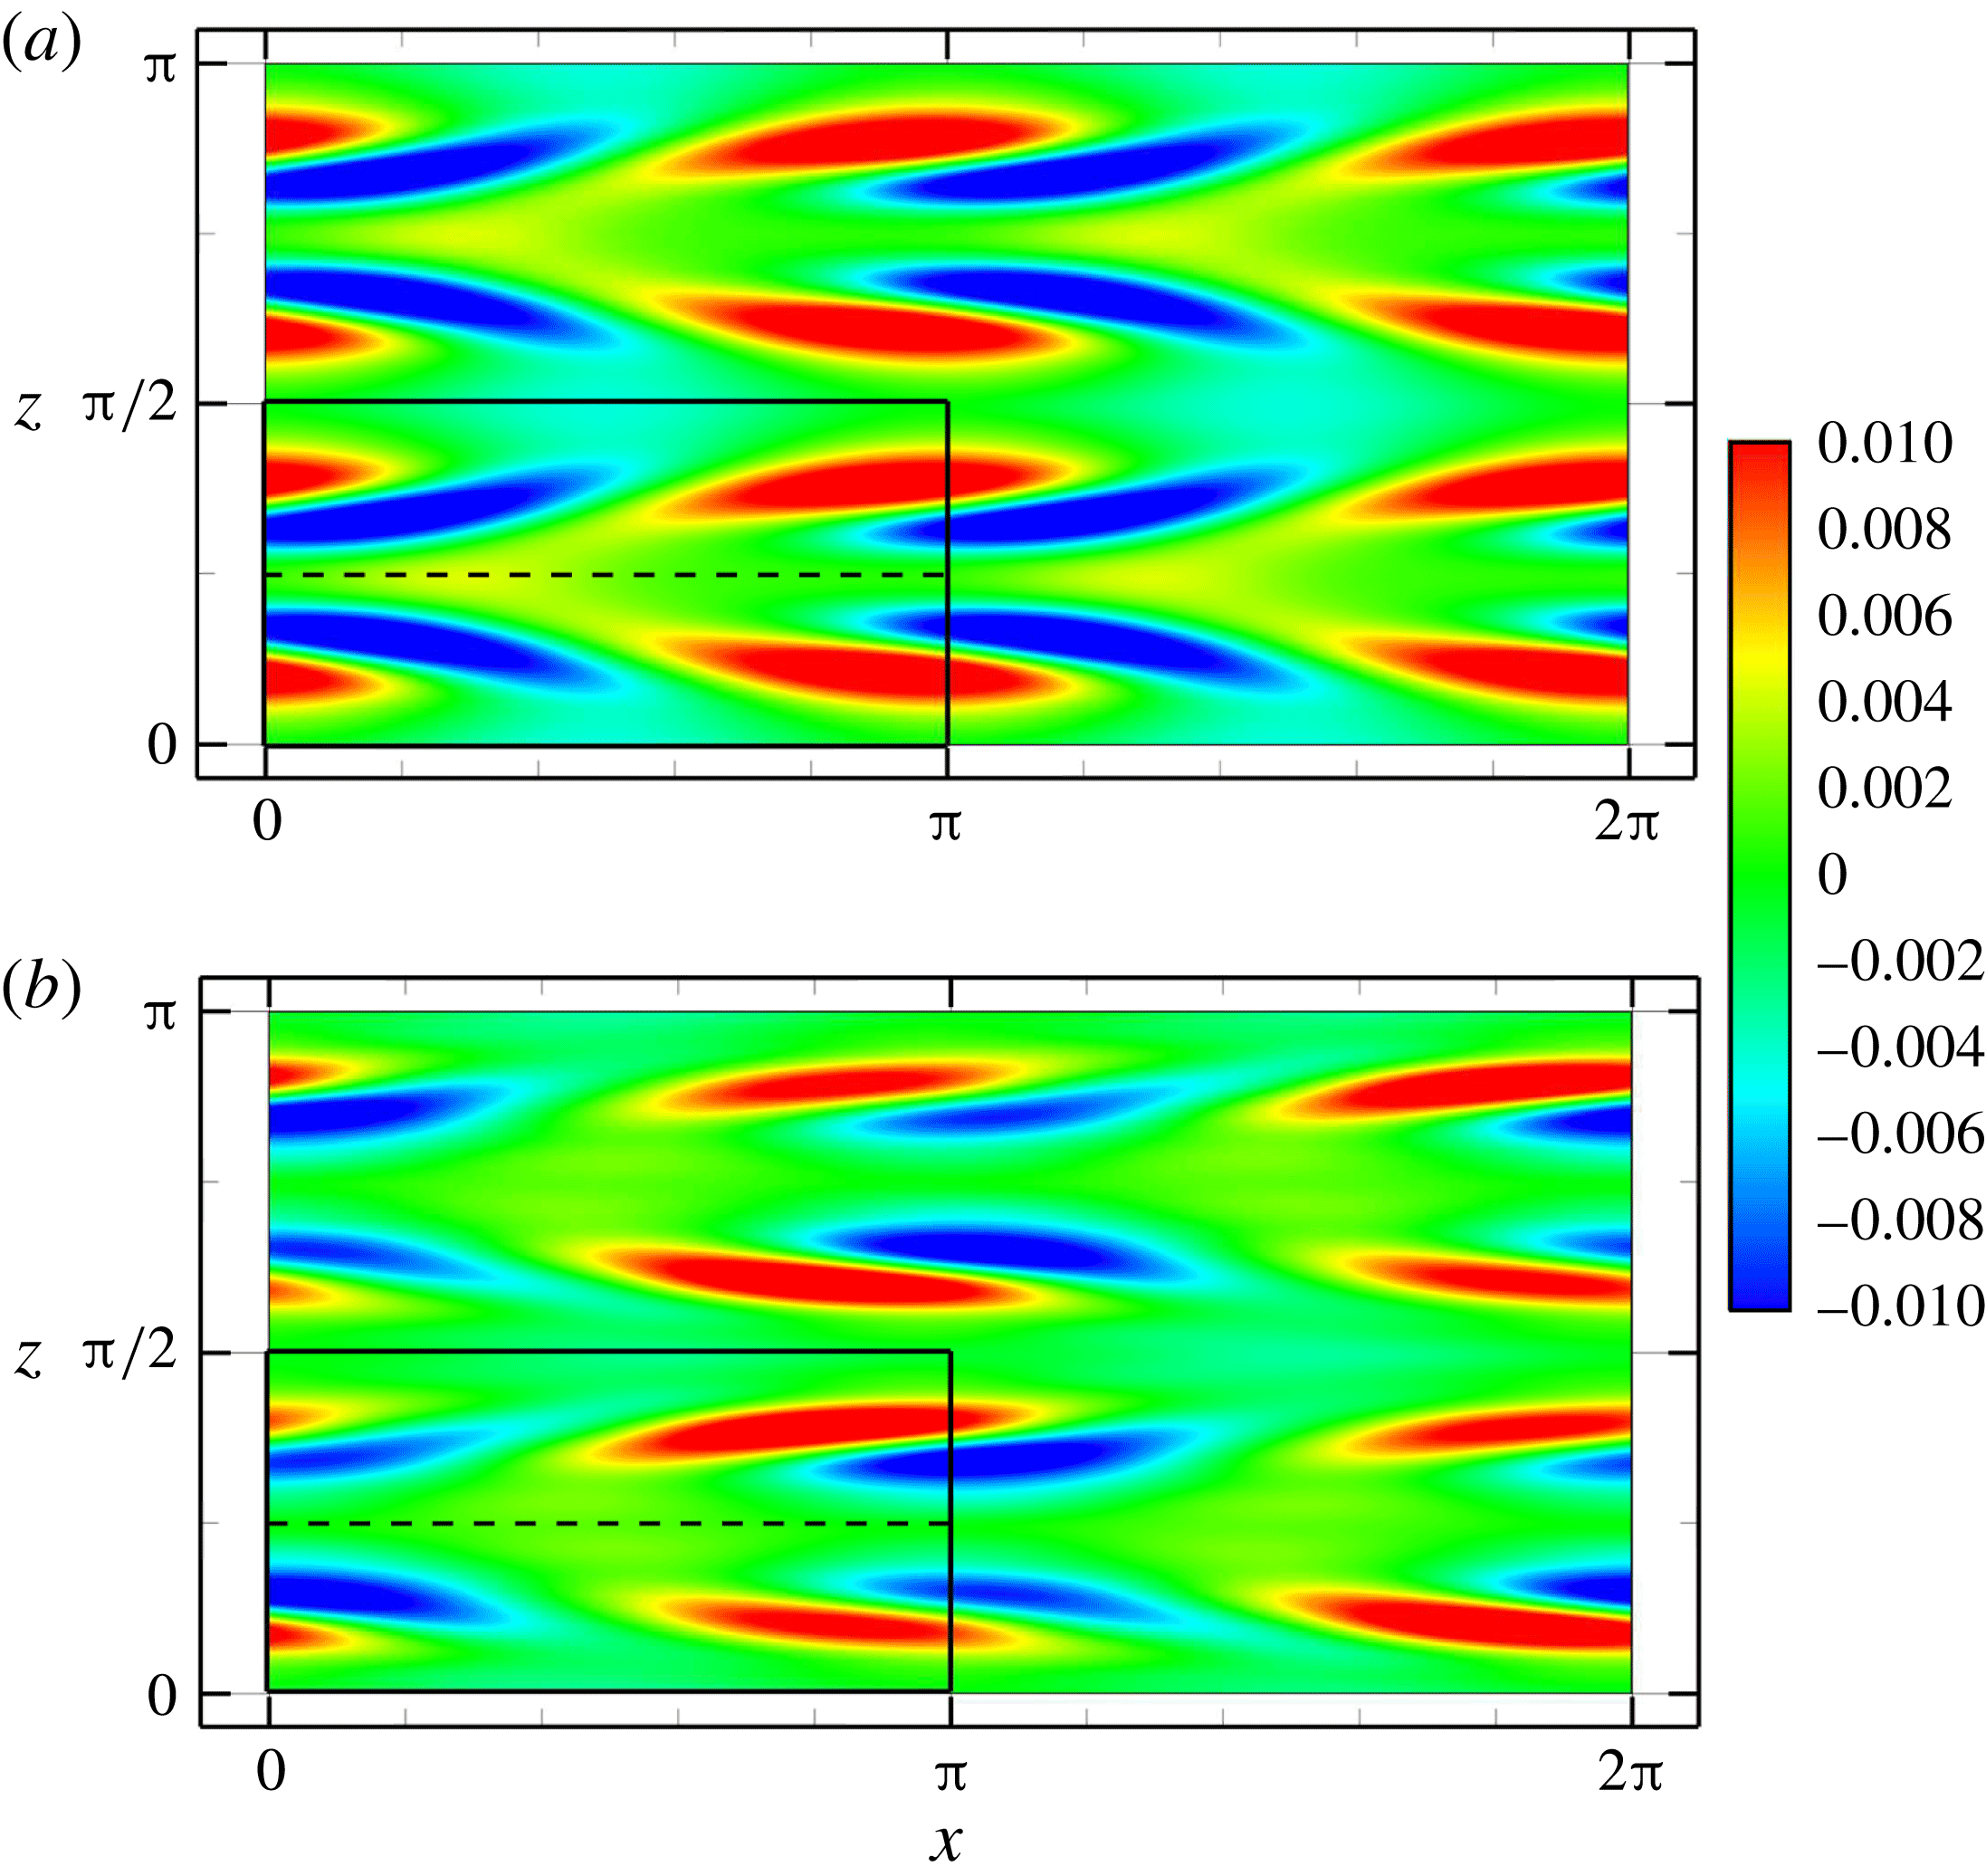
(a) The P4-LB solution at
 $Re_{c}=2750$
(two periods in
 $x$
and
 $z$
are shown) and (b) the SB solution at
 $Re_{c}=3800$
. Colour contours of the wall-normal velocity in the
 $x$
–
 $z$
plane at
 $y=-0.5$
are shown. The solid-outlined box at the lower left shows the size of the domain in which the P4 solutions are found. The SB solution has a broken mirror symmetry about the midplane of this box in the
 $z$
direction (dashed line), as well as a broken discrete translation symmetry in both the
 $x$
and
 $z$
directions – the solution in
 ${\rm\pi}<x<2{\rm\pi}$
is shifted by
 ${\rm\pi}$
in the
 $z$
direction from the solution in
 $0<x<{\rm\pi}$
.

Vortical structures of the TW solutions as illustrated by the swirling strength
 ${\it\lambda}_{ci}$
: (a) LB and (b) UB solutions for P1, (c) P2 solution, (d) LB and (e) UB solutions for P3, (f) LB and (g) UB solutions for P4, (h) LB and (i) UB solutions for P5; P5 is shown at
 $Re_{c}=3600$
, all others at
 $Re_{c}=1800$
. Only the bottom half-channel is shown due to the mirror symmetry with respect to the channel centre. The dark red tubes are isosurfaces at
 $2/3$
of the maximum swirling strength and the transparent blue isosurfaces indicate critical layer surfaces where the local streamwise velocity matches the wave speed. The maximum swirling strengths are (a) 0.09, (b) 0.17, (c) 0.17, (d) 0.06, (e) 0.61, (f ) 0.30, (g) 0.79, (h) 0.16 and (i) 0.23.

Now we examine the streak structures, as represented by the contours of the streamwise velocity fluctuations in the
 $x$
–
 $z$
plane at
 $y=-0.5$
; these are shown in figure 5. Except for P2, LB solutions are presented. The low-speed and high-speed streaks are denoted by negative (blue) and positive (red) fluctuations respectively. A subharmonic sinucose mode (Waleffe Reference Waleffe1997), which is a combination of sinusoidal for the low-speed streak and a varicose mode for the high-speed streak, is identified for P1, P3 and P5. A fundamental sinuous mode is observed for the P2 solution (figure 5
b), while P4 exhibits a fundamental varicose mode (figure 5
d). From a flow symmetry point of view, the
 ${\it\sigma}_{z}$
symmetry is clearly seen for P1, P4 and P5, whereas this symmetry is broken for P2 and P3. The
 ${\it\tau}_{xz}$
symmetry for P1 and P3 is also identified in figure 5(a,c).
To clearly illustrate the subharmonic bifurcation arising on the P4-LB around
 $Re_{c}=3070$
, we plot in figure 6(a,b) the wall-normal velocities on the
 $x$
–
 $z$
plane of solutions at
 $Re_{c}=2750$
and 3800. The fundamental spatial periods of the P4-LB solution are
 $L_{x}={\rm\pi}$
and
 $L_{z}={\rm\pi}/2$
; figure 6(a) shows two periods of this solution in each direction – the unit cell is the solid-outlined box at the lower left. In the SB solution, figure 6(b), mirror symmetry with respect to the
 $z$
direction midplane (dashed line) of the unit cell of P4 is broken, even though the
 ${\it\sigma}_{z}$
symmetry still holds for its own (larger) fundamental domain. In addition, the SB solution has a broken discrete (half-domain shift) translation symmetry in both the
 $x$
and
 $z$
directions: the solid-outlined box is not same as the solution in
 ${\rm\pi}<x<2{\rm\pi}$
and
 $0<z<{\rm\pi}/2$
or in
 $0<x<{\rm\pi}$
and
 ${\rm\pi}/2<z<{\rm\pi}$
.
The streak structure of a flow is closely related to the streamwise vortical structure. Figure 7 shows contours of swirling strength
 ${\it\lambda}_{ci}$
, the imaginary part of the complex conjugate eigenvalues of the velocity gradient tensor (Zhou et al.
Reference Zhou, Adrian, Balachandar and Kendall1999), in the bottom half of the channel. The contours represent
 $2/3$
of the maximum swirling strength for each solution, which is given in the caption. In a given solution family, LB solutions have weaker vortex strength than UB solutions. We also depict the critical layer surface, where the local streamwise velocity equals the wave speed,
 $u(x,y,z,t)=c_{x}$
(Maslowe Reference Maslowe1986; Hall & Sherwin Reference Hall and Sherwin2010). The P1- and P3-LB solutions, which have the subharmonic sinucose mode, show similar vortical structures. The vortex cores appear to expand between just above critical layer and the channel centre, whereas the vortex cores of the P1- and P3-UB solutions are located very close to the critical layer. The fundamental sinuous mode of P2 displays staggered vortices, which are also located close to the critical layer. The fundamental varicose mode of the P4-LB and -UB solutions displays different inclination angles of the vortex legs with respect to the wall: the vortex legs of the LB and UB solutions are inclined by approximately 20 and 40 degrees to the wall respectively. The vortex cores are also located around the critical layer. This vortical structure – which has the same symmetry as a hairpin but does not display a ‘head’ – is also observed for other TW solutions in the same geometry (Gibson & Brand Reference Gibson and Brand2014) and plane Couette flow (Itano & Generalis Reference Itano and Generalis2009; Deguchi & Nagata Reference Deguchi and Nagata2010).
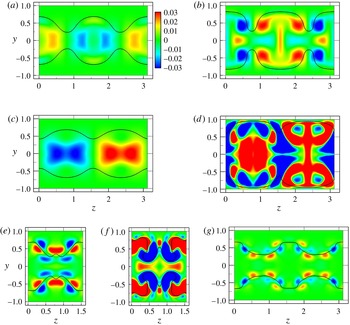
Contours of streamwise velocity deviations
 $u(x=x_{c},y,z,t)-U(y,z)$
in the
 $y$
–
 $z$
plane, where
 $U(y,z)$
is the streamwise-averaged streamwise velocity. The streamwise location
 $x_{c}$
is chosen to illustrate the distinguishing features of the deviation. The flow fields shown are (a) LB and (b) UB solutions for P1, (c) LB and (d) UB solutions for P3, (e) LB, (f) UB and (g) SB solutions for P4. Except for the SB solution, which is shown at
 $Re_{c}=3600$
, all solutions are at
 $Re_{c}=1800$
. The black line represents the critical layer in the
 $y{-}z$
plane at
 $x=x_{c}$
.

3.2. Travelling wave structure and critical layers
As described in the introduction, prior work has addressed the structure and mechanism of nonlinear TWs in the context of nonlinear critical layer dynamics, and in particular has noted the role that streamwise-wavy structures localized near the critical layer play in the self-sustaining process of at least one family of ECSs (Wang et al.
Reference Wang, Gibson and Waleffe2007; Hall & Sherwin Reference Hall and Sherwin2010). Therefore, it is of interest to illustrate the channel flow ECSs found here in relation to the critical layer position. In order to do so, in figure 8 we calculate velocity deviations
 $u(x=x_{c},y,z,0)-U(y,z)$
in the
 $y$
–
 $z$
plane of the P1, P3 and P4 LB and UB solutions along with the critical layer position (black thick line), where
 $u(x=x_{c},y,z,0)=c_{x}$
. Here,
 $U(y,z)$
is the streamwise-averaged streamwise velocity (not the streamwise- and spanwise-averaged velocity
 $U_{m}(y)$
). As the velocity deviation varies along the streamwise direction, a location
 $x_{c}$
in the streamwise direction is chosen so that the distinguishing features of the deviation are best illustrated. The full time dependence of these structures is shown in supplementary movies 1–7 available at http://dx.doi.org/10.1017/jfm.2015.554. The P1 and P3 LB solutions exhibit relatively strong deviations near the channel centre, as shown in figure 8(a,c) (and see supplementary movies 1 and 3), from which observation we may call them ‘core modes’. In particular, the P3 solution shows well-localized deviations near the channel centre. Upper-branch solutions exhibit stronger deviations throughout the channel height compared with LB solutions. In both cases, however, the fluctuations seem to be bounded between the top and bottom critical layers (also see accompanying online movies 2 and 4 in the supplementary material for figure 8(b) P1-UB and (d) P3-UB respectively).
The P4 solution shows a different structure. Figure 8(e–g) (and supplemental movies 5–7) shows the streamwise velocity deviations for its LB and UB solutions at
 $Re_{c}=1800$
and for an SB solution at
 $Re_{c}=3600$
. The deviations of the LB and SB solutions are highly localized very close to the critical layer, consistent with the Couette flow ECS results of Wang et al. (Reference Wang, Gibson and Waleffe2007) and Hall & Sherwin (Reference Hall and Sherwin2010). For the UB solutions, while strong deviations are observed across much of the channel, they are clearly organized by the critical layer. The clear organization of deviations around the critical layer suggests a connection to the critical layer dynamics, based on which this solution family may be called a ‘critical layer mode’. As seen in the vortical structures in figure 7(h,i), the structure of P5 is also strongest around the critical layer.
This distinction between core modes and critical layer modes does not seem to have been previously identified. The LB Couette (Wang et al. Reference Wang, Gibson and Waleffe2007; Hall & Sherwin Reference Hall and Sherwin2010; Blackburn et al. Reference Blackburn, Hall and Sherwin2013) and pipe (Viswanath Reference Viswanath2009) flow TWs studied previously would be classified as ‘critical layer’ rather than ‘core’ modes, and the mechanistic studies of Hall & Sherwin (Reference Hall and Sherwin2010) and Blackburn et al. (Reference Blackburn, Hall and Sherwin2013) are focused on critical layer modes.
In addition to movies for streamwise velocity deviations, there are additional accompanying online movies (8–17) in the supplementary material for the P1–P5 TW structures. These are shown in the
 $y$
–
 $z$
plane, where the streamwise velocity is represented by colour contours, wall-normal and spanwise velocities are shown by arrows and the critical layer is shown as a black curve.
3.3. Exact coherent states on the laminar–turbulent boundary
Some of the LB TW solutions in wall-bounded turbulent flows are embedded in the laminar–turbulent boundary (Skufca et al. Reference Skufca, Yorke and Eckhardt2006; Wang et al. Reference Wang, Gibson and Waleffe2007). If such solutions have only one unstable direction (Skufca et al. Reference Skufca, Yorke and Eckhardt2006), which indicates that they are stable with respect to perturbations on the boundary, they are edge states. By combining linear stability analysis of the nonlinear TW families with direct time integration of initial conditions perturbed along unstable directions of the TWs, we have determined whether the solutions live on the basic boundary and whether they are edge states. Specifically, an initial condition for a trajectory is generated by addition of a small perturbation along an unstable eigenfunction to an LB solution. Both positive and negative perturbations are considered, and if there is an unstable direction for which the trajectory starting on one side of the LB solution develops into turbulence, while the other decays directly to the laminar state, then the solution lives on the basin boundary. If, additionally, there is only one unstable eigenvalue, then the TW is attracting in all other directions besides its unstable one and is thus an edge state.
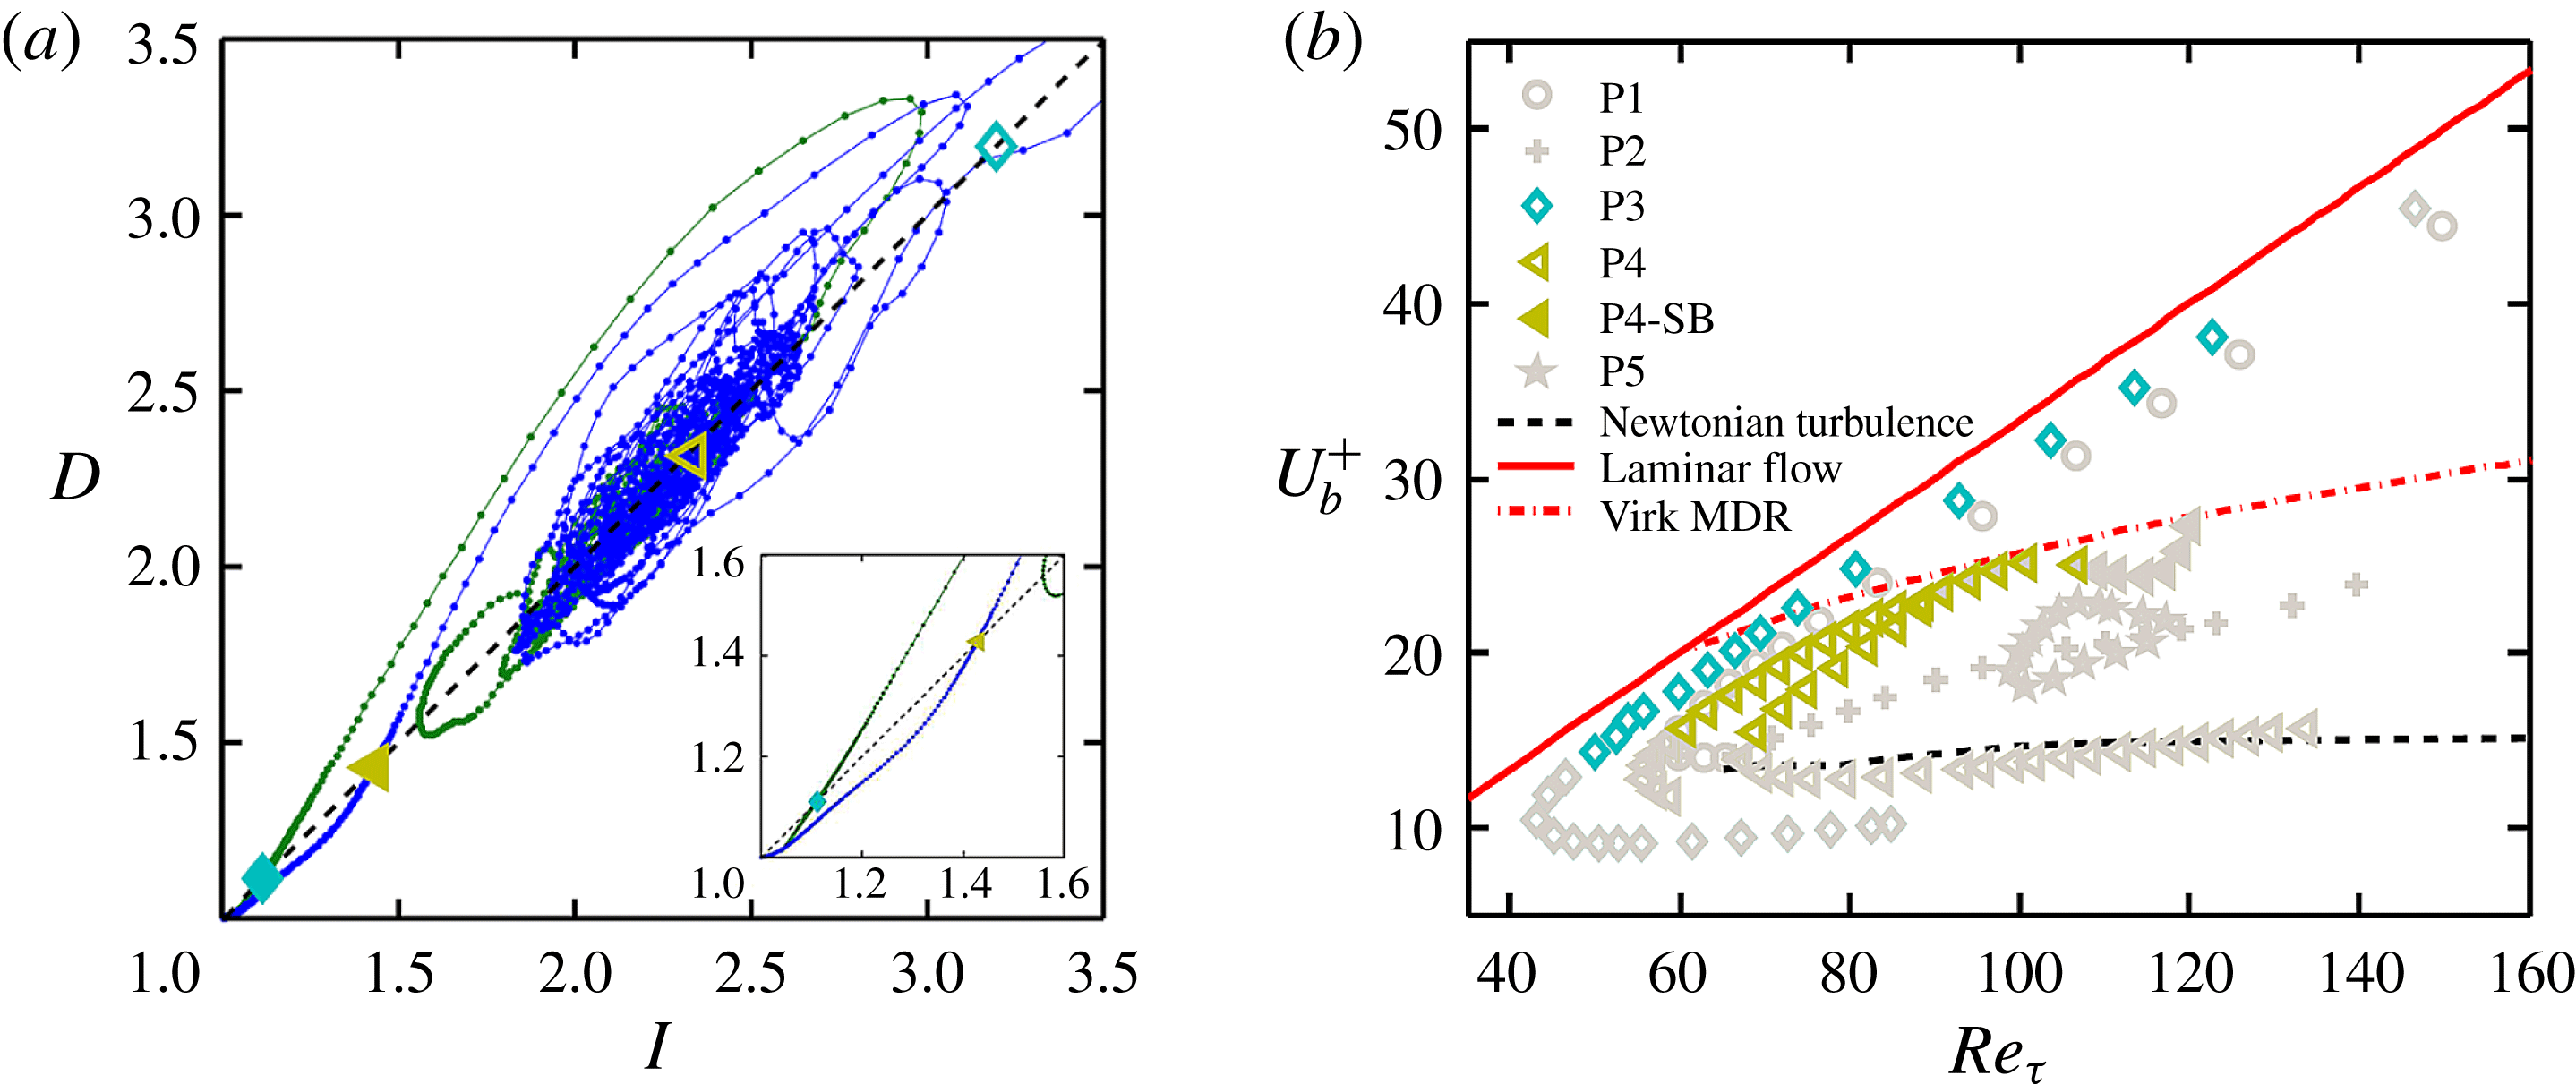
(a) Time evolutions in the energy input rate and dissipation rate for DNS trajectories starting from nonlinear TWs P3 (○) and P4 (♢) perturbed along an unstable eigendirection at
 $Re_{c}=1800$
. The solid and open symbols correspond to LB and UB states respectively. Along trajectories, the dot spacing is
 ${\rm\Delta}t=2$
. The laminar state is at
 $(1,1)$
. The dashed line represents
 $D=I$
. (b) Bifurcation diagram with solutions on the basin boundary shown in colour or darker symbols.

Figure 9(a) shows dynamical trajectories along the unstable directions for the P3- and P4-LB solutions at
 $Re_{c}=1800$
projected onto the plane of energy dissipation rate (
 $D$
) and energy input rate (
 $I$
),
 $$\begin{eqnarray}\displaystyle & \displaystyle D=\frac{1}{2L_{x}L_{z}}\int _{0}^{L_{z}}\int _{-1}^{1}\int _{0}^{L_{x}}(|\boldsymbol{{\rm\nabla}}u|^{2}+|\boldsymbol{{\rm\nabla}}v|^{2}+|\boldsymbol{{\rm\nabla}}w|^{2})\,\text{d}x\,\text{d}y\,\text{d}z, & \displaystyle\end{eqnarray}$$
 $$\begin{eqnarray}\displaystyle & \displaystyle I=\frac{1}{2L_{z}}\int _{0}^{L_{z}}\int _{-1}^{1}(pu|_{x=0}-pu|_{x=L_{x}})\,\text{d}y\,\text{d}z. & \displaystyle\end{eqnarray}$$
 $(1,1)$
. It should be recalled that the fundamental domain size is different between P3 and P4:
 $L_{x}=2{\rm\pi}$
and
 $L_{z}={\rm\pi}$
for P3 and
 $L_{x}={\rm\pi}$
and
 $L_{z}={\rm\pi}/2$
for P4. In both cases, one perturbation (the one that increases
 $I$
and
 $D$
) leads to turbulence and the other to laminar flow, indicating that these TWs are on the basin boundary for turbulent flow in their respective domains. Even though there are multiple unstable eigenvalues for the P4-LB and -SB, only one (real) unstable eigenvalue gives the aforementioned two types of trajectories of perturbations. Figure 9(b) shows the results of this analysis for the entire bifurcation diagram – the solutions shown in grey are not on the basin boundary while the others are. We find that only P3 and P4 display parameter ranges where they are on the boundary. For P3 this range is
 $50\lesssim Re_{{\it\tau}}\lesssim 123~(1200\lesssim Re_{c}\lesssim 5000)$
. For P4, both LB and SB solutions are found to lie on the basin boundary for their respective domains. The ranges are
 $69\lesssim Re_{{\it\tau}}\lesssim 88.7~(1600\lesssim Re_{c}\lesssim 3070)$
for P4-LB,
 $61\lesssim Re_{{\it\tau}}\lesssim 88.7~(1400\lesssim Re_{c}\lesssim 3070)$
for P4-LB2 and
 $88.9\lesssim Re_{{\it\tau}}\lesssim 107~(3080\lesssim Re_{c}\lesssim 4000)$
for P4-UB. Furthermore, since it is found that the P3-LB solutions have only one unstable eigenvalue in the symmetric subspace, they are indeed edge states in that space. Even though there is only one eigenfunction that gives rise to an escape scenario from the basin boundary for the P4-LB solutions, they have multiple unstable eigenvalues so are not edge states.
3.4. Connections between TW solutions and turbulent trajectories
One motivation for studying nonlinear TWs in shear flows is the idea that these states form the state-space skeleton of the turbulent dynamics. In this section, we address this issue, examining how closely the turbulent trajectories approach the TW solutions. We focus on the domain
 $L_{x}\times L_{y}\times L_{z}={\rm\pi}\times 2\times {\rm\pi}/2$
, the same box size as the P4 solution family. We choose
 $Re_{c}=1800~(Re_{{\it\tau}}=85)$
and perform simulations at constant mass flux. In contrast to the TW computations, these turbulence simulations are performed without imposing any symmetries on the flow. Comparisons are made with TWs that have the same
 $Re_{c}$
. Two methods of comparison are used: the first examines the probability distribution function for the instantaneous mean velocity profile and the second projects the state-space dynamics into three dimensions corresponding to physically meaningful averaged quantities.
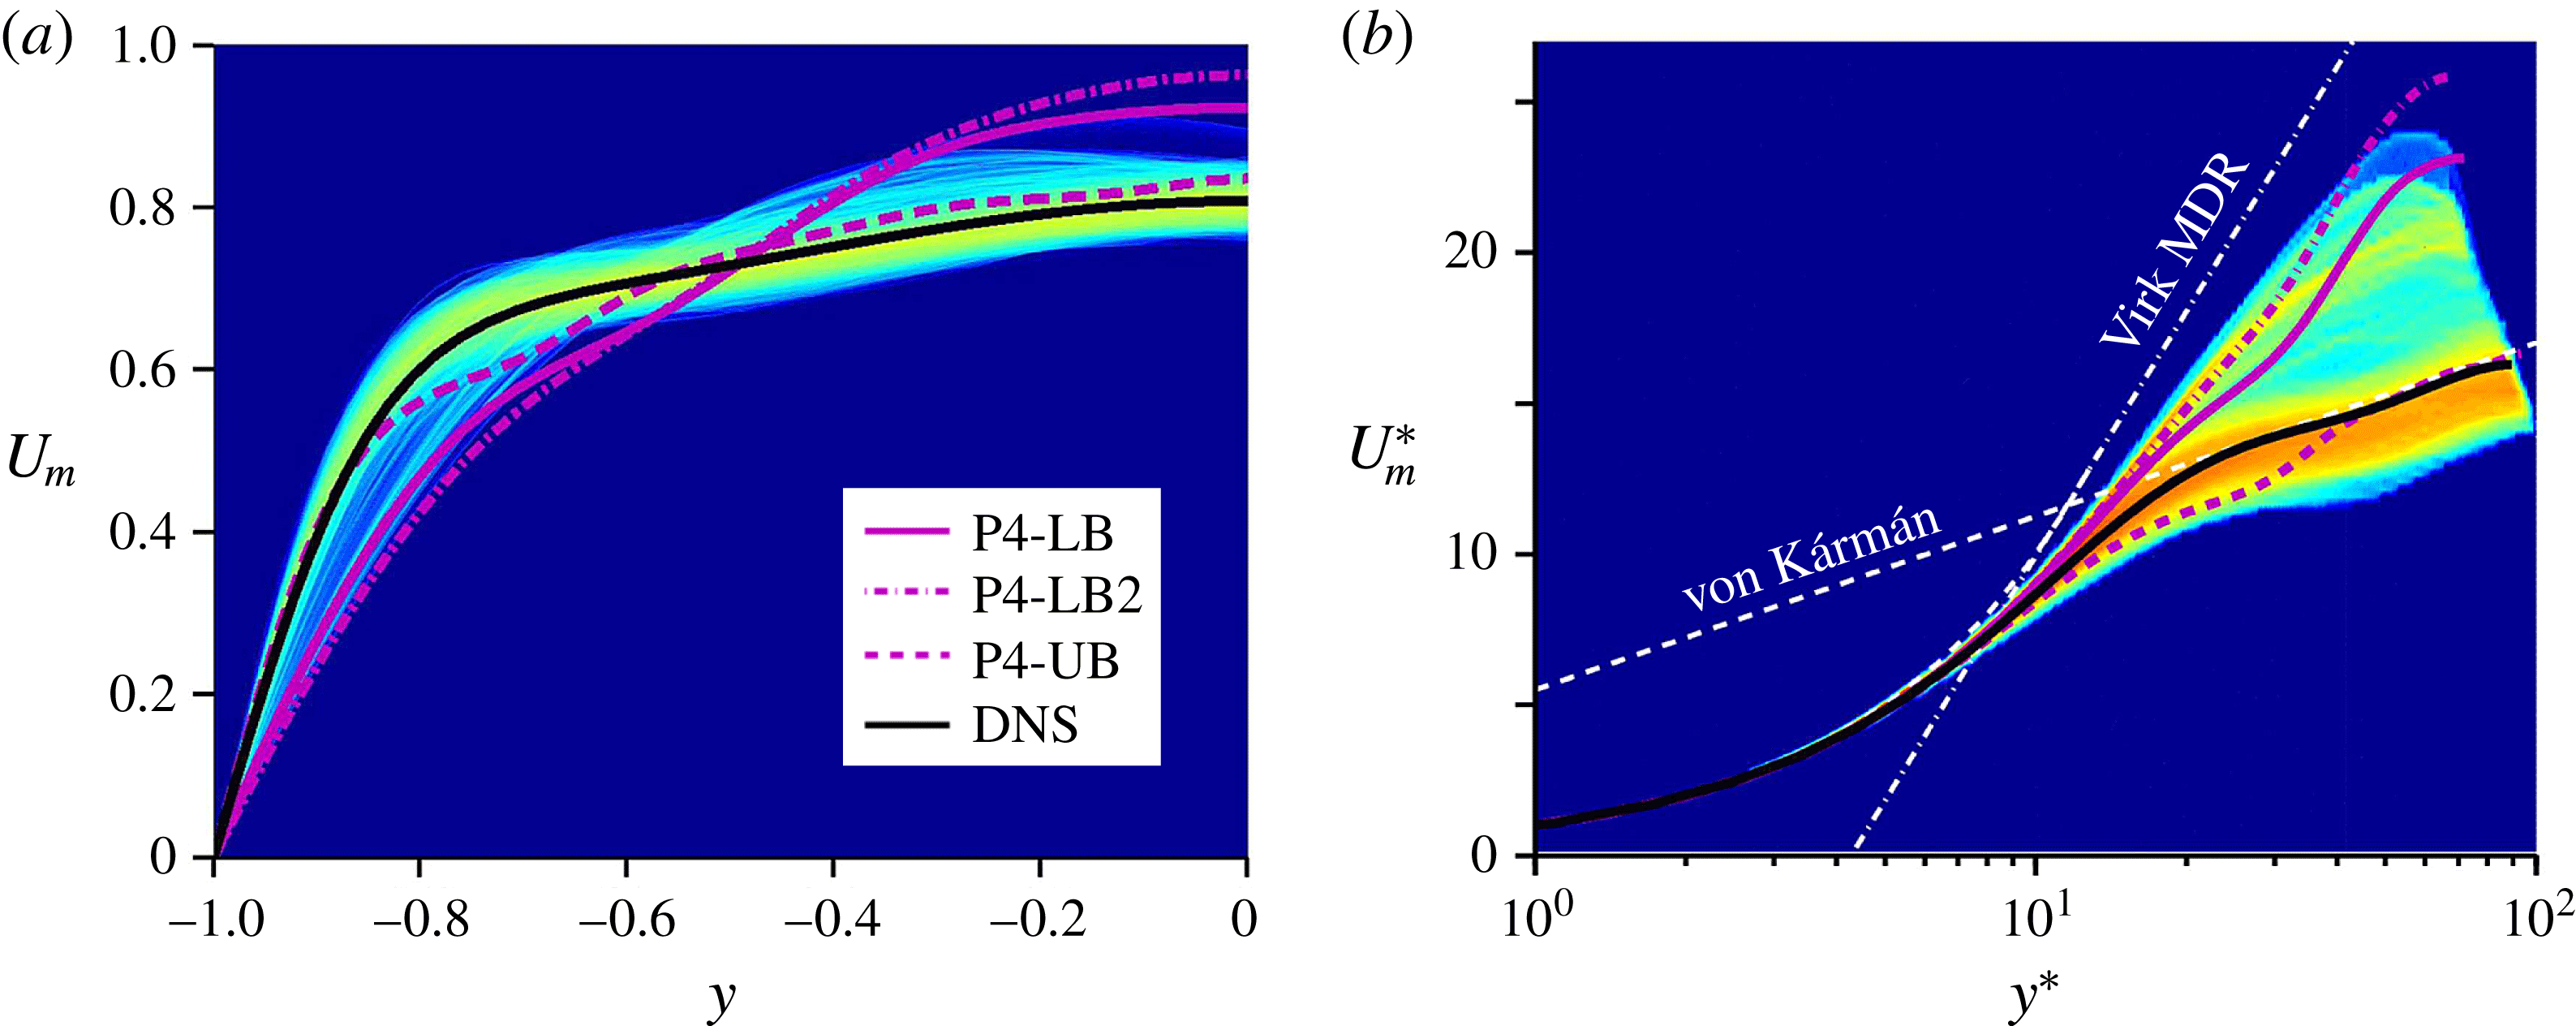
The probability density function of mean velocity profile from DNS, along with P4-LB, another LB (P4-LB2) and P4-UB solutions on (a) outer scaling and (b) ‘
 $\ast$
’ scaling (inner units based on instantaneous area-averaged wall shear stress). The black line is the time-averaged DNS velocity profile. A logarithmic scale is used, with blue indicating vanishing probability.

Figure 10(a,b) shows the probability density functions (PDFs), plotted on a logarithmic scale, for the mean velocity profiles at each wall-normal position
 $y$
(figure 10
a) or
 $y^{\ast }$
(figure 10
b) in DNS based on outer units and ‘
 $\ast$
’-scaling (instantaneous inner scales) respectively. The PDF is normalized so that the integral over the whole PDF equals 1. Using outer scaling (non-time-dependent scaling), it is difficult to compare a DNS trajectory to TW solutions because each TW has a different friction velocity. However, as highlighted by previous studies (Xi & Graham Reference Xi and Graham2012b
; Agostini & Leschziner Reference Agostini and Leschziner2014), the ‘
 $\ast$
’-scaling, which leads all profiles to collapse to the same curve near the wall, is the proper one to use for instantaneous quantities with which a TW solution can be directly compared with an instantaneous flow field. Here, we used DNS results for 40 000 time units to compute PDFs. According to Xi & Graham (Reference Xi and Graham2012b
) and our calculations, approximately 8–9 % of the total simulation time is spent near the Virk-like state. Thus, the data are sufficient to capture approaches to the Virk log-law in PDFs. In figure 10(a) we see that near the wall, the DNS velocity profile is very nearly bracketed between the P4-UB and -LB solutions, while deviations from these solutions become more prevalent near the centre. The same trend is apparent in the plot in instantaneous inner units, figure 10(b), which emphasizes the strong similarities in the near-wall behaviour as well as the transient approaches of the DNS mean velocity profile towards the P4-LB solutions. It appears that for
 $y^{\ast }\lesssim 30$
the P4 TWs form an approximate envelope for the PDF of the DNS mean velocity profile. Furthermore, relatively high probability regions (red) are observed around the von Kármán log-law and P4-UB solution. Interestingly, there is also a slightly high probability region (yellow) close to the P4-LB solutions.
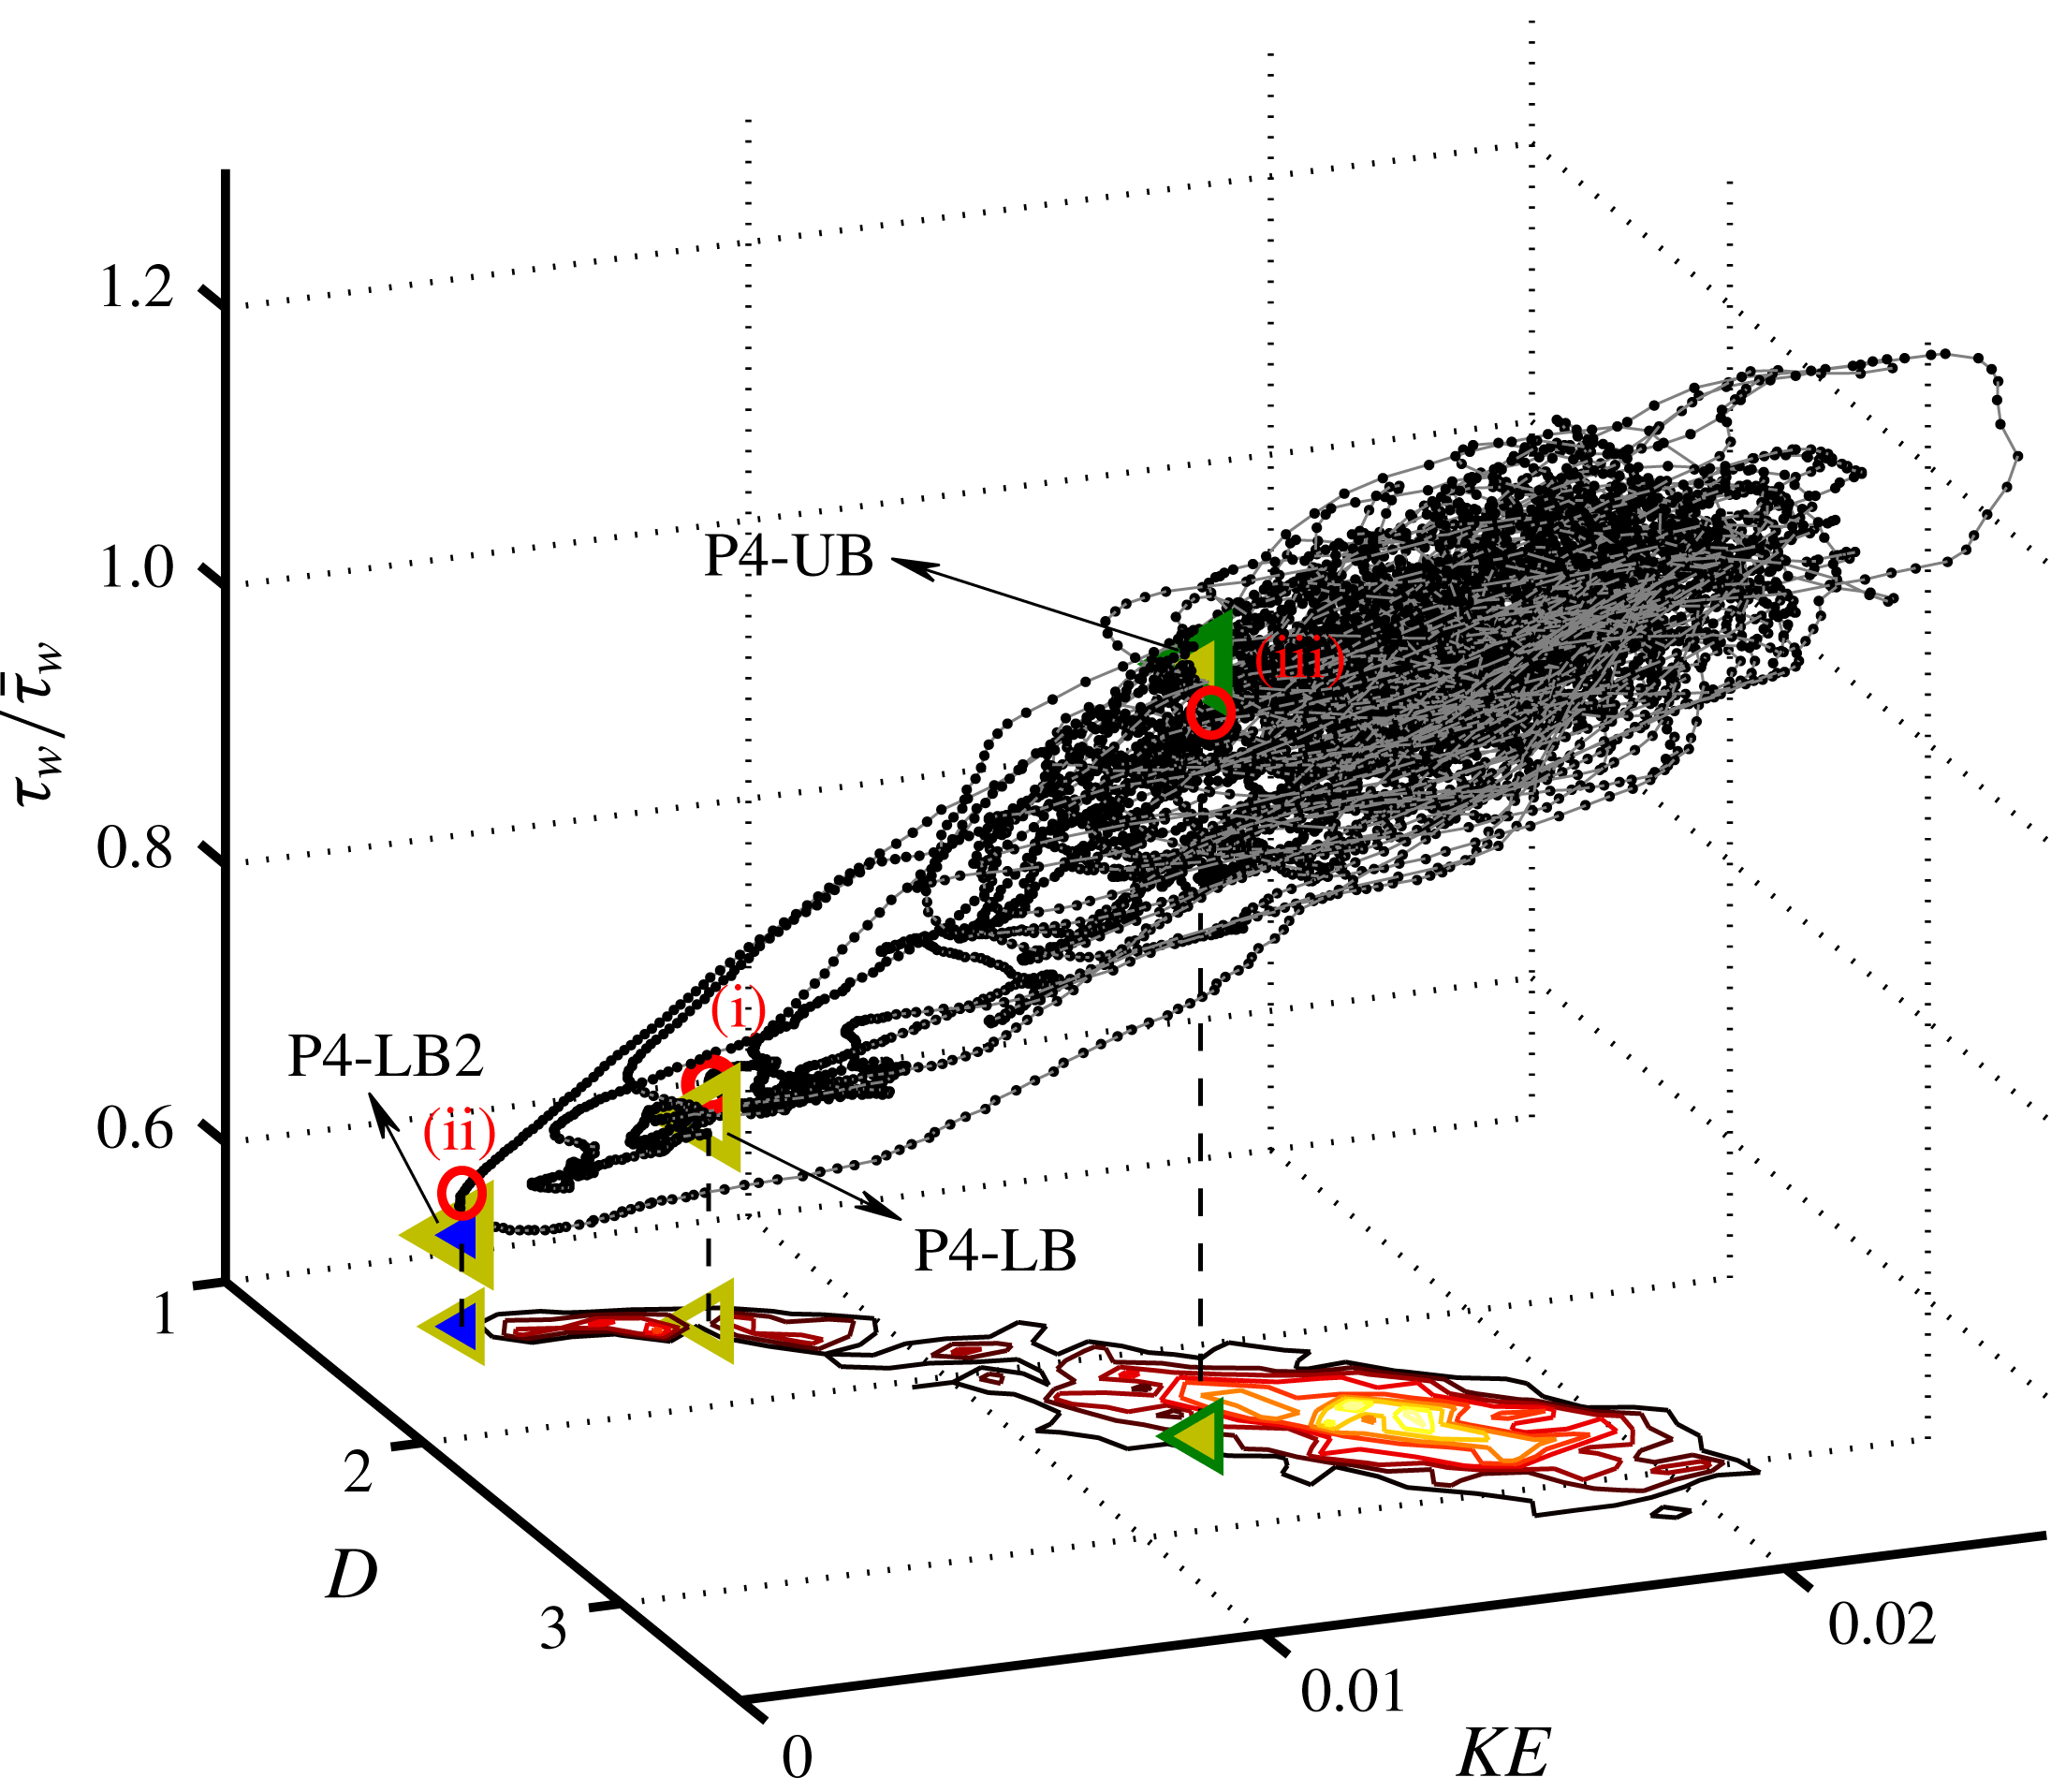
A state-space visualization of DNS trajectories, projected onto three dimensions: disturbance kinetic energy (KE), energy dissipation rate (D) and normalized instantaneous wall shear stress (
 ${\it\tau}_{w}/\bar{{\it\tau}}_{w}$
). The grey line indicates the turbulent trajectory, to which black dots are attached at intervals of
 $1h/U_{c}$
. A joint probability function of KE and D is shown at the bottom of the figure. The labelled symbols (◃) are P4 solutions. Points (i), (ii) and (iii) are the closest visits to P4-LB, P4-LB2 and P4-UB respectively. It should be noted that all quantities are calculated only for the bottom half of the channel.

Now we visualize the approach of turbulent trajectories to TW solutions in state space. To do so, we project turbulent trajectories onto a three-dimensional space using the following quantities: disturbance kinetic energy (KE), energy dissipation rate (D), and area-averaged instantaneous wall shear stress normalized by its mean value (
 ${\it\tau}_{w}/\bar{{\it\tau}}_{w}$
). The disturbance kinetic energy is defined as follows:
 $$\begin{eqnarray}\mathit{KE}=\frac{1}{L_{x}L_{z}}\int _{0}^{L_{z}}\int _{-1}^{0}\int _{0}^{L_{x}}\frac{1}{2}(\boldsymbol{u}-\boldsymbol{u}_{lam})^{2}\,\text{d}x\,\text{d}y\,\text{d}z,\end{eqnarray}$$
where
 $\boldsymbol{u}_{lam}$
is the parabolic laminar profile. Figure 11 shows a turbulent trajectory and the P4 TWs projected onto these three quantities, as well as the joint PDF of
 $KE$
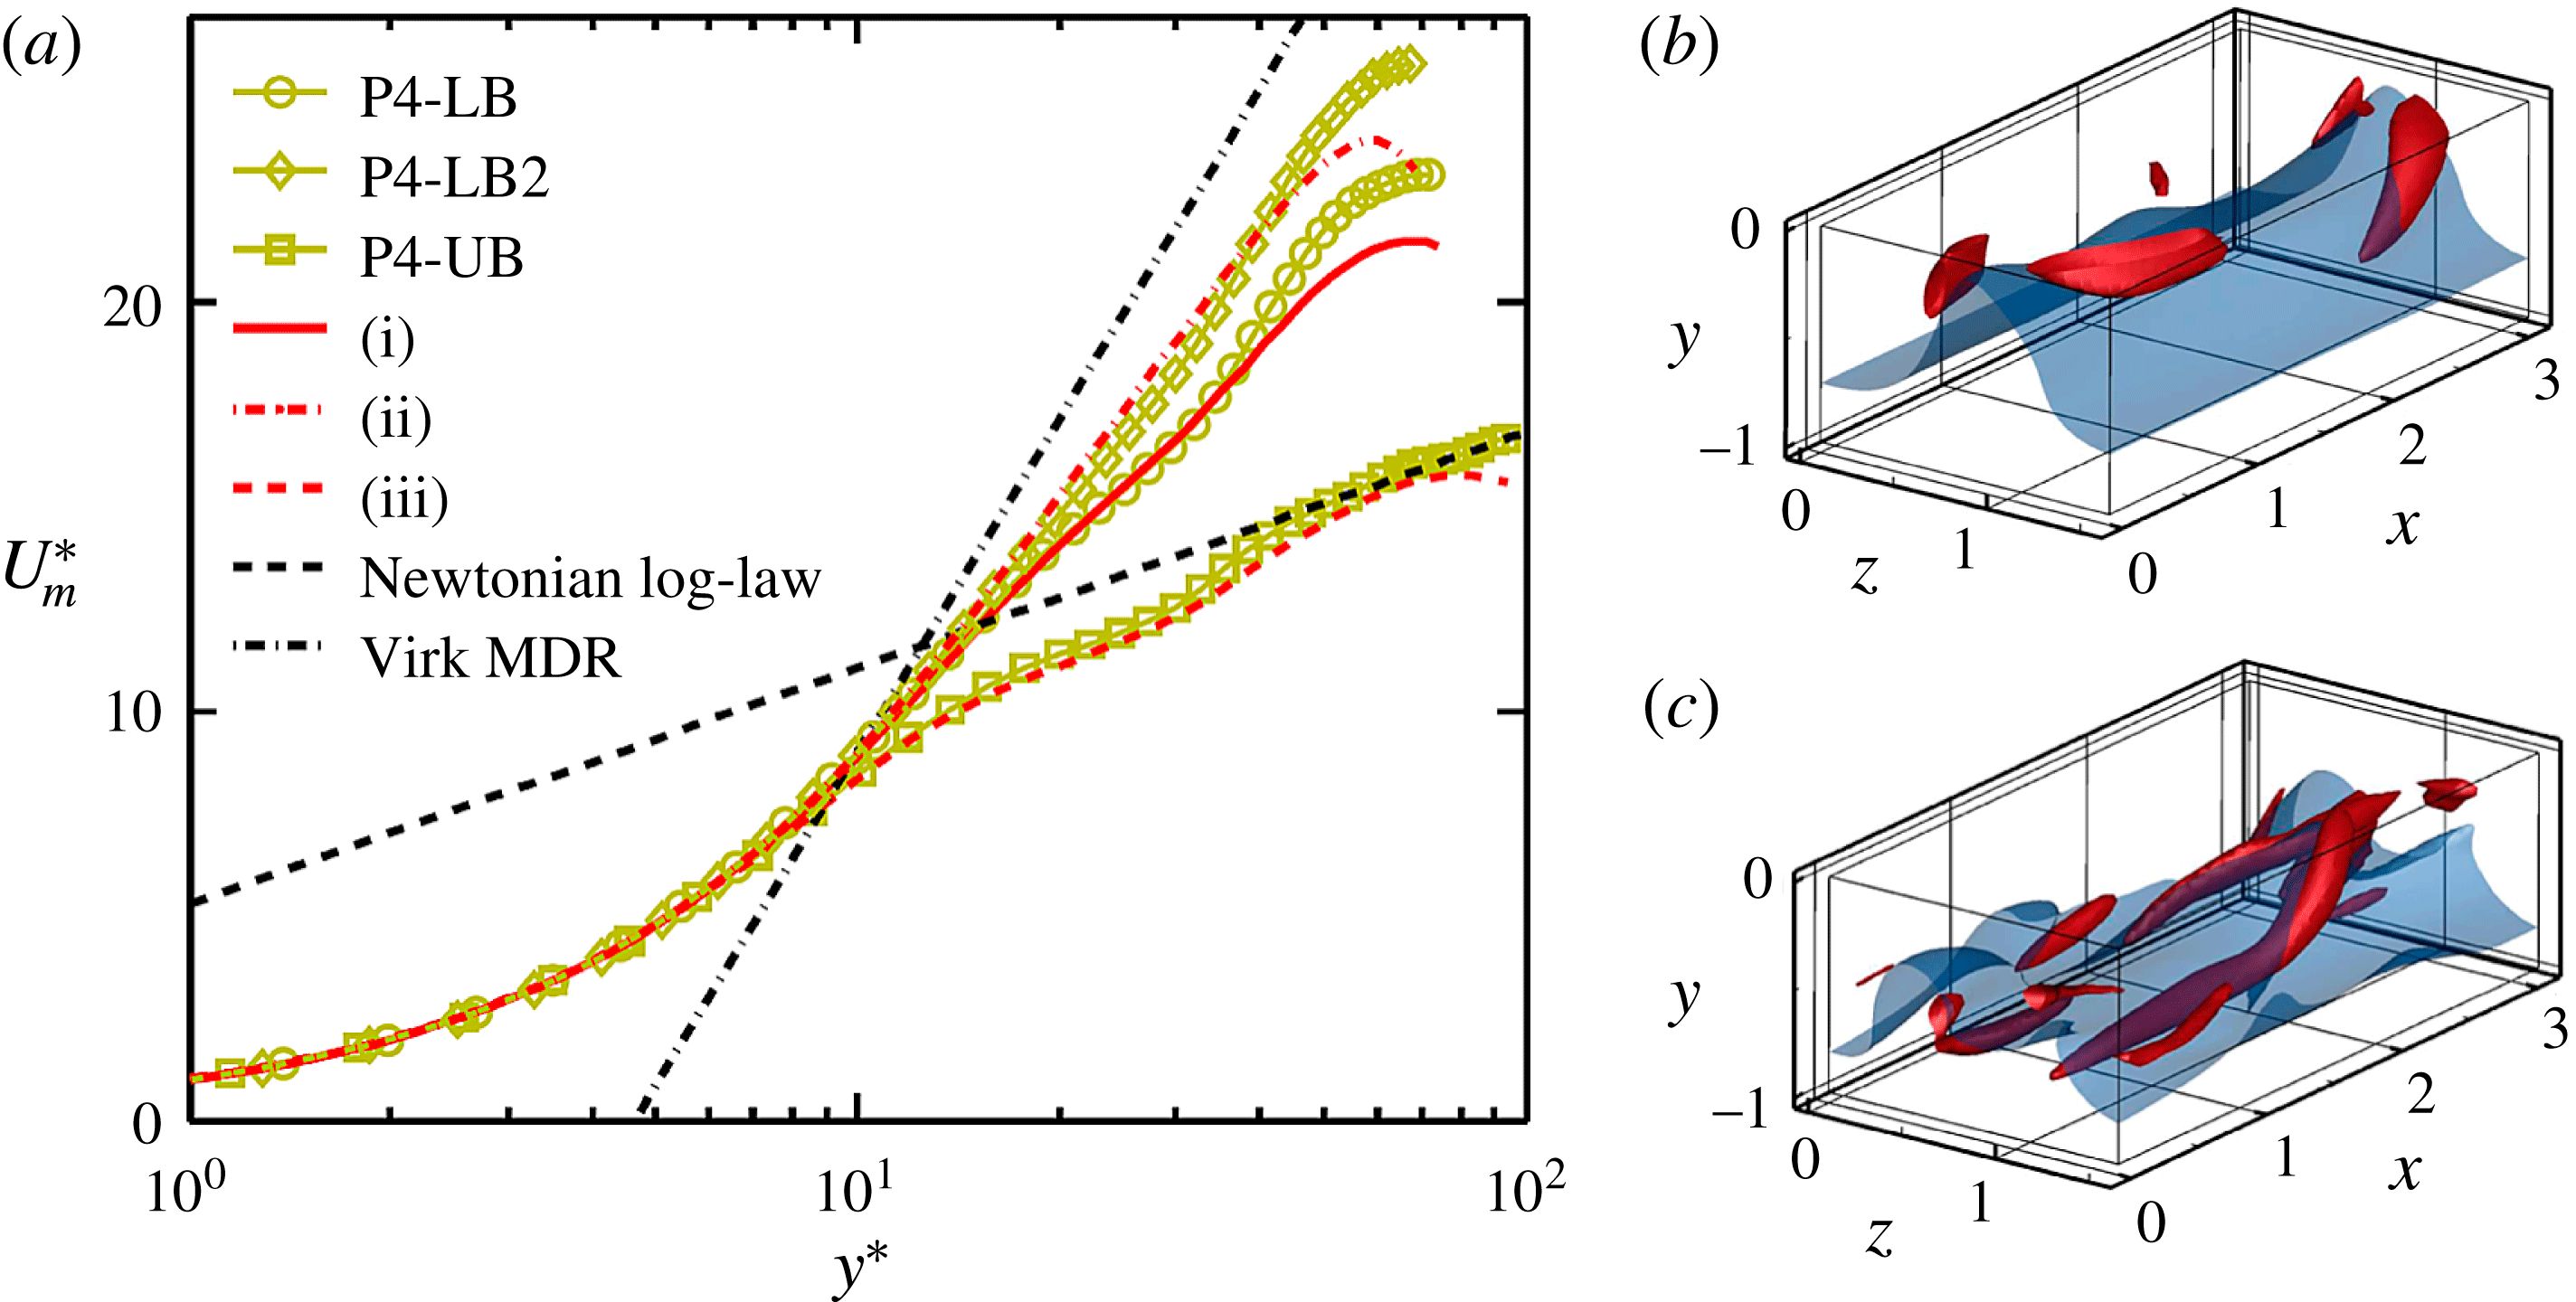
and D at the bottom of the figure. It should be noted that all quantities are only calculated for the bottom half of the domain. The dynamical trajectory spends most of its time within one core region of state space, which we can identify with normal or ‘active’ turbulence; the P4-UB solution is in this region, as also seen on the joint PDF. The trajectory occasionally escapes, however, from the active region, approaching the P4-LB solutions. During these excursions, some trajectories pass through the vicinity of P4-LB, approaching P4-LB2 very closely. When returning to the active region, the path strongly overshoots the core of these regions and might be considered as a turbulent burst. Similar observations on the relationship between invariant states and bursting events have been made for Couette flow (Kawahara & Kida Reference Kawahara and Kida2001) and channel flow (Toh & Itano Reference Toh and Itano2003). The closest visits to P4-LB, P4-LB2 and P4-UB are labelled as points (i)–(iii) respectively. The mean velocity profiles at these three instants and for the P4 TWs are plotted in figure 12(a). The profiles for instants (i) and (ii) appear to be very similar to the P4-LB and P4-LB2 solutions respectively, while instant (iii) has a similar profile to the P4-UB and the von Kármán mean profile. Flow structures for instants (i) and (iii) are visualized in figure 12(b,c), where to facilitate comparison we use the same vortex strength and critical layer isosurfaces as in figure 7(f) P4-LB and (g) P4-UB. It should be noted that flow structure for instant (ii) is very similar to that for instant (i), but shows weaker vortex motion. There is substantial similarity between the vortical and critical layer structures of the snapshots and the TWs. The critical layer for instant (i) shows weak streamwise variation and the vortex motions are seen to be localized around the critical layer, as also seen for P4-LB. Similarly, instant (iii) and P4-UB resemble one another, particularly with regard to their inclined vortical structures.
(a) Instantaneous mean velocity profiles for instants (i), (ii) and (iii), where the closest approaches to P4-LB, P4-LB2 and P4-UB solutions are observed respectively. (b–c) Flow structures at instants (i) and (iii).

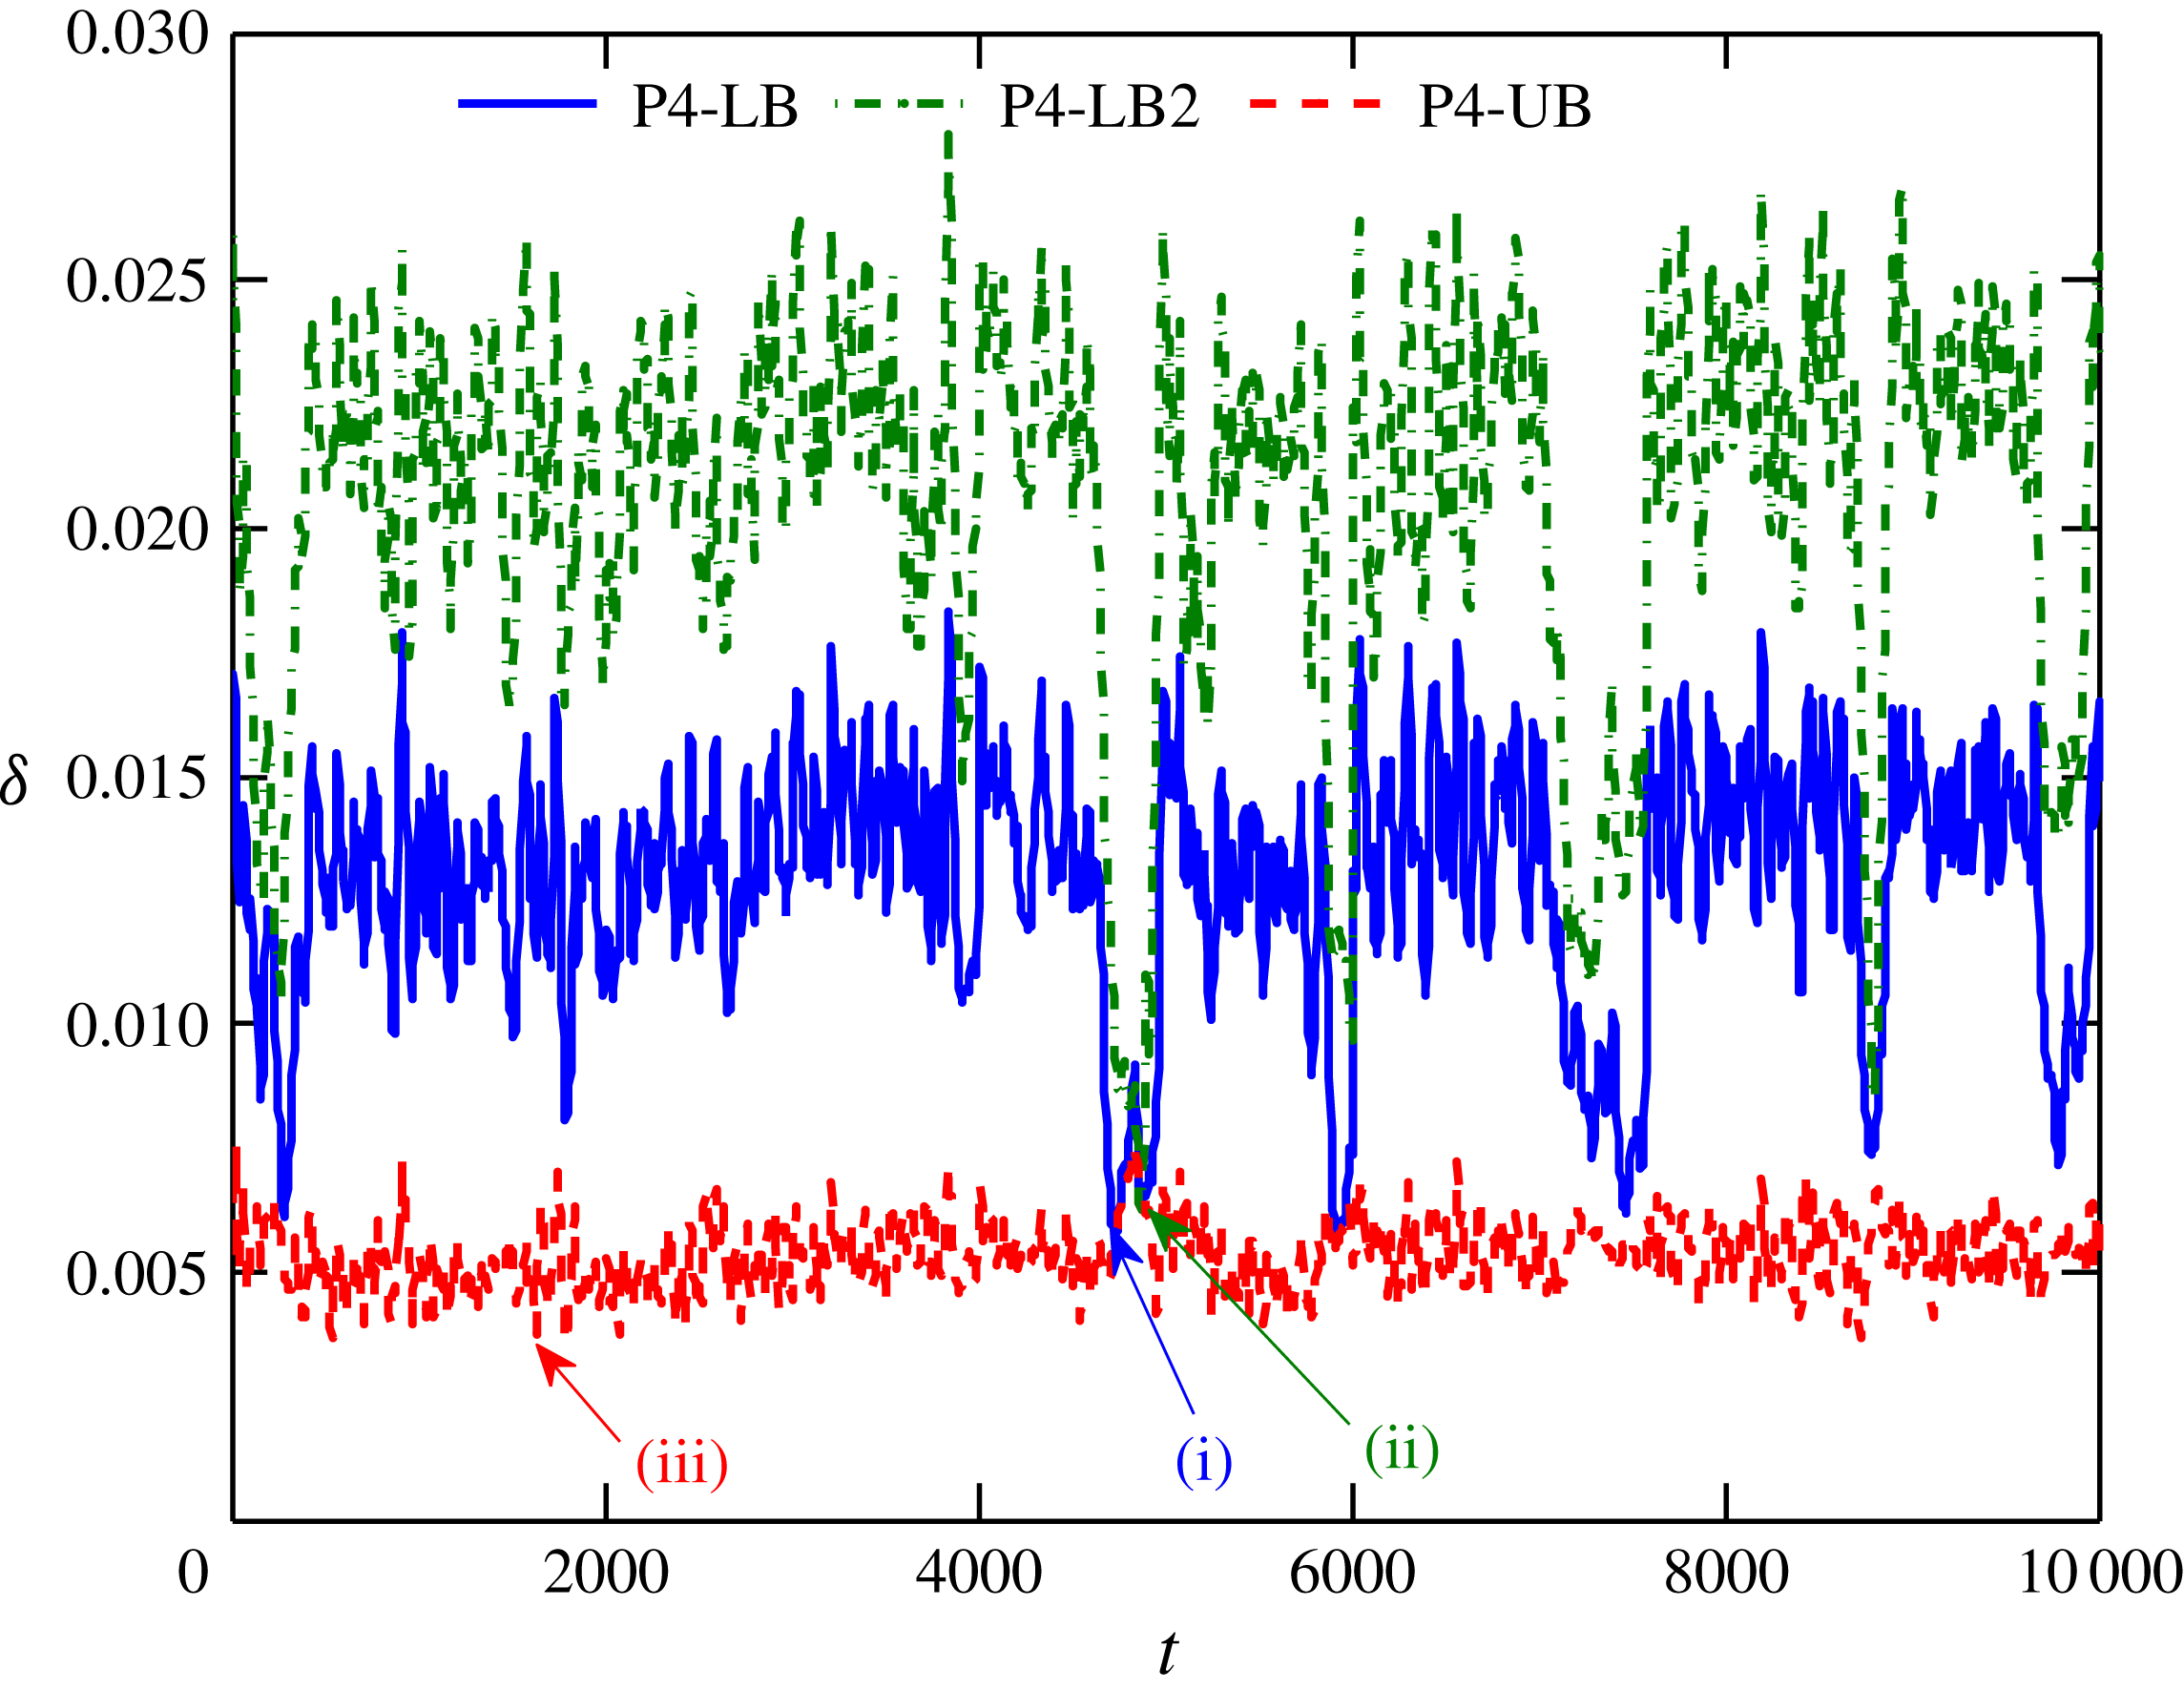
To further address the relationship between the DNS trajectories and TWs, we calculated a norm of the difference between a DNS velocity field
 $\boldsymbol{u}$
and a TW. Taking into account the arbitrary phase in
 $x$
and
 $z$
of the velocity fields, this distance, which we denote
 ${\it\delta}$
, is calculated as follows:
 $$\begin{eqnarray}{\it\delta}(t)=\min _{0\leqslant x_{0}<L_{x}}\min _{0\leqslant z_{0}<L_{z}}\Vert \boldsymbol{u}(x+x_{0},y,z+z_{0},t)-\boldsymbol{u}_{\mathit{TW}}(x,y,z)\Vert ,\end{eqnarray}$$
where
 $x_{0}$
and
 $z_{0}$
are phaseshifts in the
 $x$
and
 $z$
directions respectively. Time series of
 ${\it\delta}(t)$
computed for the P4 solution family are shown in figure 13. The distances between P4-LB and instant (i), P4-LB2 and instant (ii), and P4-UB and instant (iii) are
 $5.7\times 10^{-3}$
,
 $6.2\times 10^{-3}$
and
 $3.5\times 10^{-3}$
respectively. These values are comparable to distances at the points of the closest visits to TWs for pipe flow (Viswanath & Cvitanovic Reference Viswanath and Cvitanovic2009) and to equilibria for Couette flow (Halcrow et al.
Reference Halcrow, Gibson, Cvitanovic and Viswanath2009), which are of order
 $O(10^{-3})$
. Thus, the closeness of turbulent trajectories to P4 TWs is identified using full velocity fields for minimal channel flow.
The state-space picture that clearly shows close approaches to multiple TW solutions and the closeness to the TW solutions using full velocity fields has yet to be reported in the channel flow literature. Furthermore, it must be emphasized that these multiple TWs belong to the same solution family.
Distances
 ${\it\delta}$
between a DNS trajectory and P4 TW solutions. Instants (i), (ii) and (iii) are the closest visits to P4-LB, P4-LB2 and P4-UB respectively, indicated in figure 11.

These results confirm the hypothesis posed in prior work (Xi & Graham Reference Xi and Graham2010b
,Reference Xi and Graham
a
, Reference Xi and Graham2012b
; Graham Reference Graham2014) that the ‘active’ and ‘hibernating’ phases of minimal channel turbulence correspond to time intervals where the trajectory is close to UB and LB TWs respectively. Finally, returning to the bifurcation diagram, we recall that there are also two UB P4 solutions, but we were only successful in computing one of them over a broad range of
 $Re_{c}$
. We might speculate that if the second UB solution could be found at the
 $Re_{c}$
at which we have performed the DNS it would also lie in the core active turbulence region.
4. Conclusion
We have computed five new families of nonlinear TW solutions, denoted P1–P5, in Newtonian plane Poiseuille flow. As the Reynolds number is increased, the P1- and P3-LB solutions become close and parallel to the laminar solution branch, indicating that they are very-low-drag states. The P2 solution branch results from a symmetry-breaking bifurcation from P1. The P5 solution family forms a closed loop (isola). Most interestingly, the P4 solution family shows very intriguing behaviour in terms of mean properties as the Reynolds number is increased. The average velocities of the LB and UB appear to approach the Virk MDR profile observed in viscoelastic turbulence and the classical Newtonian (von Kármán) profiles respectively. The former observation adds to the set of results in which mean velocity profiles close to the Virk profile are found in Newtonian flow (Kerswell et al.
Reference Kerswell, Obrist and Schmid2003; Bandyopadhyay Reference Bandyopadhyay2006; Xi & Graham Reference Xi and Graham2010a
,Reference Xi and Graham
b
; Dubief et al.
Reference Dubief, White, Shaqfeh and Terrapon2011; Xi & Graham Reference Xi and Graham2012a
,Reference Xi and Graham
b
). On the LB, a subharmonic bifurcation arises around
 $Re_{{\it\tau}}\approx 90$
, giving rise to spatiotemporal period doubling.
The structures and symmetries of the various solution families are described. The fluctuations of the P1 and P3 solutions are largest near the channel centre, so we have denoted them as core modes, while the P4 and P5 solutions display fluctuations localized around the critical layer, so we call them critical layer modes. Over a range of Reynolds numbers the P3- and P4-LB solutions are embedded in the laminar–turbulent boundary.
Finally, we addressed the issue of how closely the turbulent trajectories approach the TW solutions, focusing on the P4 family. In prior work (Xi & Graham Reference Xi and Graham2010b ,Reference Xi and Graham a , Reference Xi and Graham2012b ; Graham Reference Graham2014) it was hypothesized that ‘active’ and ‘hibernating’ phases of minimal channel turbulence correspond to time intervals where the trajectory is close to UB and LB TWs respectively. The present results corroborate this hypothesis. The turbulent trajectory spends most of its time within a region of state space that can be identified as normal or ‘active’ turbulence; the P4-UB solution is in this region, while the hibernating intervals are approaches to the P4-LB solutions.
Acknowledgements
The authors thank K. Deguchi, J. Gibson, R. Kerswell and M. Nagata for illuminating discussions and especially K. Deguchi and J. Gibson for providing their TW solutions. This work has been supported by the Air Force Office of Scientific Research through grants FA9550-11-1-0094 and FA9550-15-1-0062 (Flow Interactions and Control Program) and by the National Science Foundation through grants CBET-1066223 and CBET-1510291 (Fluid Dynamics program). The DNS code used here was developed and distributed by J. Gibson at the University of New Hampshire.
Supplementary movies
Supplementary movies are available at http://dx.doi.org/10.1017/jfm.2015.554.