

Introduction
European ‘cave art’ forms the most robust set of visual culture for exploring the early evolution of human visual systems. At present an apparently non-figurative phase of body-extension art (hand stencils, finger dots and lines) predates U-Th minimum ages of ~64000 bp, at least in three Iberian caves, and maximum and minimum ages place a period of similar art between 45,000 and 43,000 bp (Hoffmann et al. Reference Hoffmann, Standish and García-Diez2018a); we note that there are detractors who have criticized the former minimum age, mainly due to perceived errors in sampling strategy and hence relevance of dated calcites to the underlying art, and an apparent incompatibility with the existing archaeological record which as yet presents little evidence elsewhere for visual culture (see Aubert et al. Reference Aubert, Brumm and Huntley2018; Slimak et al. Reference Slimak, Fietzke, Geneste and Ontañón2018: but also see replies from Hoffmann et al. Reference Hoffmann, Standish and García-Diez2018b,Reference Hoffmann, Standish and García-Diezc; Reference Hoffmann, Standish and García-Diez2019, who point out the errors of such critiques). Figurative art in Europe—overwhelmingly dominated by prey animals such as horse, bovids and cervids—appears after ~37000 cal. bp in our estimation, based on a parsimonious interpretation of the few existing dated examples in western Europe and their associated precision/errors (Hodgson & Pettitt Reference Hodgson and Pettitt2018). Formally speaking, the latter relates to the Early, Mid and Late Upper Palaeolithic and to the visual culture of Homo sapiens, persisting in fits and starts until near the end of the Upper Palaeolithic around the Pleistocene–Holocene transition (Bahn Reference Bahn2016; Hodgson & Pettitt Reference Hodgson and Pettitt2018; Pettitt Reference Pettitt, Cummings, Jordan and Zvelebil2014; Reference Pettitt, Dowd and Hensey2016). Upper Palaeolithic cave art—produced by spitting, finger painting, brush painting, drawing and low-relief sculpture—comprises a wide variety of themes, such as solitary and grouped herbivores and carnivores, geometric signs, finger flutings (drawn lines left by fingers on soft clay), hand stencils and prints and, rarely, anthropomorphs (Bahn & Vertut Reference Bahn and Vertut1997; Vialou Reference Vialou1998; White Reference White2003). Here, however, we are concerned with its dominant element—naturalistic drawings/paintings of quadrupedal mammals on walls and ceilings of the Mid and Late Upper Palaeolithic (~30,000–14,000 bp). These are most abundant in southern France and the Iberian peninsula (especially northern Spain), with other continental European examples in Italy, Germany, the Czech Republic, the United Kingdom and Russia (Bahn Reference Bahn2016), Croatia (Ruiz-Redondo et al. Reference Ruiz-Redondo, Komšo, Maidagan, Moro-Abadía, González-Morales, Jaubert and Karavanić2019) and, further afield, in Egypt (Huyge et al. Reference Huyge, Aubert, Barnard, Claes, Darnell, De Dapper and Therasse2007) and Indonesia (Aubert et al. Reference Aubert, Brumm, Ramli, Sutikna, Saptomo, Hakim and Dosseto2014). Unlike Palaeolithic images in the open air (e.g. Portugal's Côa Valley; Spain's Siega Verde; Germany's Hunsrück (Bahn Reference Bahn1995; Baptista Reference Baptista2009; Batarda Fernandes et al. Reference Batarda Fernandes, Reis, Escudero Remirez and Vázquez Marcos2017; Welker Reference Welker2016), where colouring might not necessarily have been an essential element as multiple carving techniques were employed to highlight images, probably to achieve long-standing visibility in open landscape where pigments would otherwise fade (see Zilhão et al .Reference Zilhão, Aubry, Carvalho, Baptista, Gomes and Meireles1997), these images can be preserved remarkably well in the relatively stable microclimates of deep caves.
It is well known that the natural features of cave walls (grooves, cracks, rock edges, concavities and convexities) were frequently utilized as constituent parts of animal representations, either to define parts of their outline, or to add volume to muscular areas of their body (e.g. Alcalde del Río et al. Reference Alcalde del Río, Breuil and Sierra1911; Breuil Reference Breuil1952; Lemozi Reference Lemozi1929; Leroi-Gourhan Reference Leroi-Gourhan1992). This deliberate incorporation of cave topography into early figurative image making—or rather the visual psychology underlying it—has featured strongly in recent hypotheses about the origins and early development of art (e.g. Brot Reference Brot and Clottes2012; Groenen Reference Groenen2000; Hodgson Reference Hodgson2000; Reference Hodgson2003; Reference Hodgson2008; Hodgson & Pettitt Reference Hodgson and Pettitt2018; Ogawa Reference Ogawa, Heyd and Clegg2005). Additionally, the shadows cast by topographic features seem also to have been constituent parts of images (Groenen Reference Groenen2000; Pettitt Reference Pettitt, Dowd and Hensey2016; Pettitt et al. Reference Pettitt, Sakamoto, Lelushko, Papadopoulos and Moyes2017). The physical nature of the cave wall will obviously affect viewing activity. Unlike images on a flat surface, undulating cave walls will distort images’ appearance whenever viewers change their viewing position (e.g. Aujoulat Reference Aujoulat2005; Groenen Reference Groenen2000; Leroi-Gourhan Reference Leroi-Gourhan1968), a distorting effect which seems to have been deliberate in the ‘animation’ of some images (Azéma Reference Azéma2008). It seems, therefore, that cave walls often played an integral role in the creation and, in particular, viewing of images, and hence that ‘cave art’ was actually a system that integrated the artist/viewer and their physical environment in a two-way relationship that was constantly changing (Lorblanchet Reference Lorblanchet1995; Pleniér Reference Plénier1971; Sauvet & Tosello Reference Sauvet, Tosello, Sacco and Sauvet1998). This relationship corresponds to the principles of modern ‘installation art’ (Sakamoto Reference Sakamoto2014.).
‘Viewpoint’ in cave art has been discussed frequently, from different perspectives, e.g. the plurality of horizontal axes (Criado Boado & Penedo Romero Reference Criado Boado and Penedo Romero1993); anamorphosis (Aujoulat Reference Aujoulat1985; Groenen Reference Groenen2000); and the shared gaze (Geneste et al. Reference Geneste, Hordé, Tanet and Dagen2004). Selection of different viewing distances will also alter the viewer's perception of specific images (Bourdier Reference Bourdier2013; Bourdier et al. Reference Bourdier, Fuentes, Pinçon and Baleux2017). Anamorphosis in particular is directly related to the issue of multiple viewpoints, as it appears distorted in frontal view but resolves into proper proportions only from a specific viewpoint. Anamorphosis has been identified in a number of caves in different European regions, e.g. Lascaux (Aujoulat Reference Aujoulat1985; Reference Aujoulat2005; Surre Reference Surre1992), Cougnac (Groenen Reference Groenen2000; Lorblanchet Reference Lorblanchet1989), Tito Bustillo (Aujoulat Reference Aujoulat1985), the Réseau Clastres at Niaux (Clottes & Simonnet Reference Clottes and Simonnet1990). Most famously, the red cow depicted on a corner of the ceiling of Lascaux's Axial Gallery appears to viewers in proper proportion only when they look up at the cow from a frontal viewing position, while this naturalistic harmony is gradually disturbed as the viewpoint elevates and approaches to the actual height at which the artist worked (Surre Reference Surre1992). An anamorphic herbivore in Cognac was placed on a wall at the height of standing viewers, but it appears deformed when viewed from this height, only achieving naturalistic form when the viewer crouches down and looks up (Groenen Reference Groenen2000). Thus, the presence of anamorphosis in cave art supports the notion that an ideal viewpoint was actually shared between artists and viewers (Gittins & Pettitt Reference Gittins and Pettitt2017), and viewing such images naturally involved the awareness of different viewpoints. Accordingly, it seems safe to argue that Upper Palaeolithic artists were aware of the plurality of viewpoints in cave art.
As noted above, the mutual relationship between the artist's/viewer's and the cave's environment allows us to draw an analogy between some cave art and modern ‘installation art’. Installation art is an expressional format in contemporary art which aims to provide us with different multisensory experiences that complement those of quotidian life (Bishop Reference Bishop2005; Reiss Reference Reiss1999). Its defining feature is to force viewers to interact with an artistically constructed space; while conventional fine art requires audiences to be a passive recipient of visual information transmitted from artworks such as paintings and sculptures, installation art rejects such a one-way relationship (Bishop Reference Bishop2005; Reiss Reference Reiss1999). In this sense, the novel environment of a cave's interior will enhance the viewers’ multisensorial engagement with the space and the art created therein. The novel constraints of caves, such as the morphology of their surface, and the play of darkness and shadows as participants throw light on their surfaces, create certain types of image, fleetingly and constantly in flux. Cave art can, therefore, be considered as an interactive device where the viewers themselves can directly influence their own perception of the art (Sakamoto Reference Sakamoto2014). We believe that we can make sense of a number of Upper Palaeolithic cave art images by interpreting them in this manner.
In order to function, the viewer (who may or may not be the artist) will become physically installed into the multi-sensorial environment (in this case a cave), and hence will actively ‘participate’ in its ‘art’ by moving around. Viewers could be solitary or in groups; the physical constraints of the cave and the limitations of their light sources will have a direct effect on their mobility and hence perception of the art. Their relationship to the art will constantly be in flux; images appear, grow, shrink, animate, change form and change their relationship with the viewer as the physical position is constantly redefined, essentially in similar manner to the behaviour of real animals in the open landscape, although in this case in a way that the viewer controls (see the definition of installation art: Bishop Reference Bishop2005; Reiss Reference Reiss1999). Add to this the difficulty—even danger—of navigating complex caves in low light and the result is a profound sensory experience (Arias Reference Arias2009; Arias & Ontañon Reference Arias, Ontañón, Bergsvik and Skeates2012). We are concerned here with exploring how such an installed, interactive participation in art may have occurred in the Upper Palaeolithic. Our hypotheses arise out of logical concerns (e.g. Hodgson Reference Hodgson2000; Reference Hodgson2003; Reference Hodgson2008; Hodgson & Pettitt Reference Hodgson and Pettitt2018) and both detailed qualitative observations (e.g. Brot Reference Brot and Clottes2012; Lorblanchet Reference Lorblanchet2010; Ogawa Reference Ogawa, Heyd and Clegg2005) and quantitative analysis (e.g. Bourdier et al. Reference Bourdier, Fuentes, Pinçon and Baleux2017; Jouteau et al. Reference Jouteau, Feruglio, Bourdier, Camus, Ferrier, Santos and Jaubert2019; Lorblanchet Reference Lorblanchet2001; Pettitt et al. Reference Pettitt, Castillejo, Arias, Peredo and Harrison2014; Pleniér Reference Plénier1971; Sauvet & Tosello Reference Sauvet, Tosello, Sacco and Sauvet1998). We especially emphasize the importance of the quantification of the subject as ‘the art panels … are packed with detailed quantitative information … waiting to be unpacked’ (Pastoors & Weniger Reference Pastoors and Weniger2011, 19). With regard to distortion and altimetric information on the cave wall, the phenomenon remains unstudied quantitatively.
Here, we undertake the quantification of the active role of cave walls in image-making and viewing by the installed participant, using 54 Late Upper Palaeolithic (Solutrean and/or Magdalenian) images from three Cantabrian caves (Covalanas, El Pendo and El Castillo). We introduce a novel use for photogrammetry and 3D modelling in order to document the morphology of these caves’ walls and the relationship of specific examples of art with them. We seek specifically to define terms such as ‘suggestive’ features and concave and convex ‘surfaces’. To an extent these are relative, and we need to get to grips with this in a quantification of distortion: if a concavity abuts a convexity, we need to establish exactly how each relates to an image created over them, as well as their relationship to any adjacent topographically ‘neutral’ areas. In order to do this, we need to establish how elevation levels differ across an image. In order to do this, we classify each image's topography into three levels (low = concavity; medium = neutral/flat; high = convexity). We present this methodology first, before proceeding to a delineation of exactly how this creates distortion at different viewing angles which can be reconstructed by rotating our 3D models. Defined distorting features are then explored statistically using methodologically rigid criteria and any resulting trends outlined. Our conclusions suggest that distortion was an integral part of animating an image, the whole functioning as part of human installation.
Fieldwork
Covalanas, El Pendo and El Castillo caves are close neighbours and share a number of culturally diagnostic artistic characteristics, such as outlining by red dots, and the predominance of a specific image (particularly red deer) which is widely found in the region's caves. The similarities are in fact striking enough to have led Apellaniz (Reference Apellániz1978) and Straus (Reference Straus1987) to suggest that they were produced by a limited number of artists of the ‘Ramales school’. Each cave differs in form, however: Covalanas is a narrow, corridor-like hollow; El Pendo is mainly an enormous chamber with a high ceiling, although there is a narrow decorated area at its deepest point; and El Castillo consists of multiple halls and connecting passages. We were interested in whether these differing internal structures had an impact on the artistic interactions with them. The archaeological content of each contrasts further. El Castillo was inhabited relatively continuously through the Upper Palaeolithic (and beforehand), probably serving in some periods at least as a seasonal aggregation focus (Conkey Reference Conkey1987). El Pendo's repeated occupation seems to have occurred on a seasonal basis, particularly as a winter shelter (Pike-Tay et al. Reference Pike-Tay, Cabrera Valdés and Bernaldo de Quirós1999). By contrast, Covalanas shows no evidence for human occupation, suggesting that it was only used for artistic activity (Bahn Reference Bahn2007, 152). We are further interested as to whether such distinct uses affected the caves’ art.
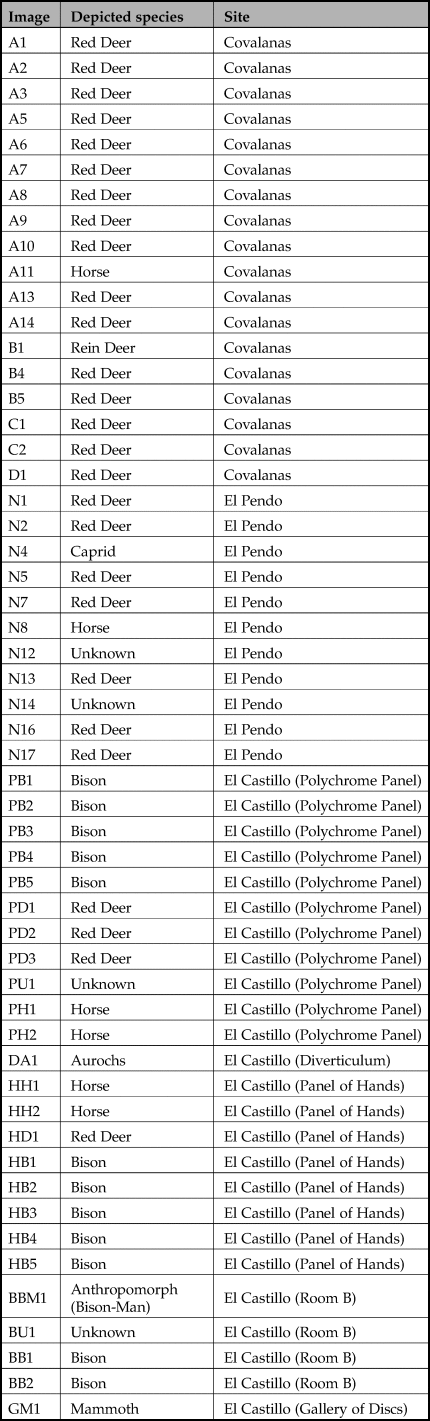
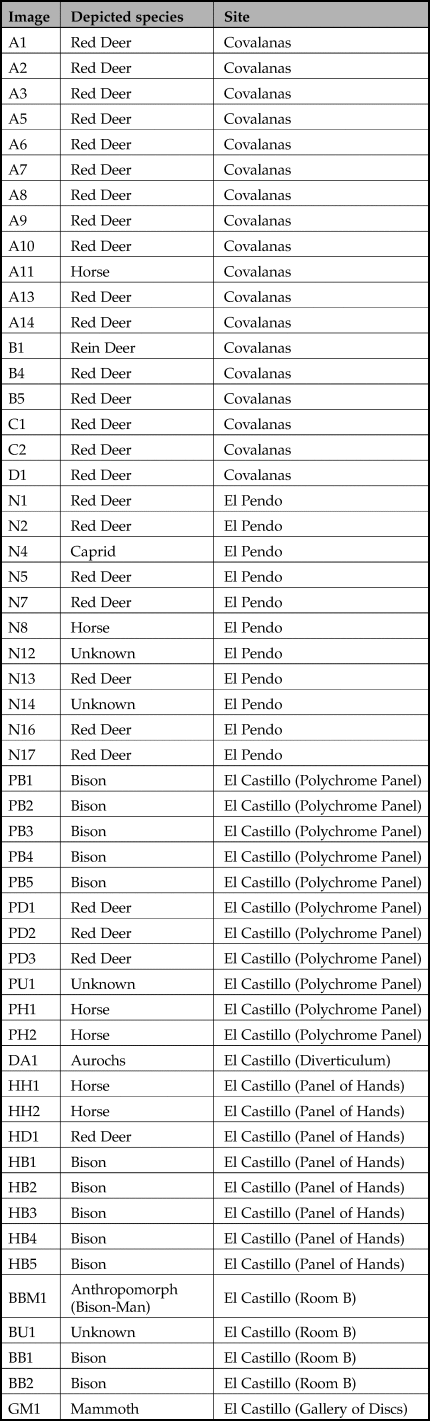
To an extent, our sample is therefore biased; we use largely complete animal depictions from three Cantabrian caves. We considered conditions of accessibility and visibility; for the latter reason, engravings and severely weathered images were excluded from the our sample list. We are not, therefore, suggesting that our conclusions apply to all cave art in all periods. We do believe, however, that the 54 figurative images we studied (Covalanas = 18; El Pendo = 11; El Castillo = 25), deriving from major Upper Palaeolithic decorated caves, demonstrate the importance of installation at three important sites. Our selection was guided by accessibility, preservation and visibility (ease of study). Cervids dominate (27 Red deer, one Reindeer), followed by Bison (12), Horse (6), unidentified Herbivore (4), Aurochs (1), Caprid (1), Mammoth (1) and one Anthropomorph. For the images in Covalanas and El Pendo cave, we used the management system in the work of Moure Romanillo et al. (Reference Moure Romanillo, Morales and Sainz1990) and Montes Barquin (Reference Montes Barquin, Sainz and Llamosas2001), respectively (see Table 1). We employed our own system for El Castillo, based on image location. Our 54 images do not form a chronologically coherent set. Those in Covalanas and El Pendo are believed to be effectively contemporaneous (Solutrean: Straus et al. Reference Straus, Morales, Martı´nez and Garcı´a-Gelabert2002). Our El Castillo samples are also chronologically diverse; although most are undated, some of the red pigment images have been attributed to the Solutrean or earlier (García-Diez et al. Reference García-Diez, Garrido, Hoffmann, Pettitt, Pike and Zilhão2015) and some of its black images to the Magdalenian (Valladas et al. Reference Valladas, Tisnerat-Laborde and Cachier2001). We recognize, therefore, that our samples may represent dynamic change over time, but as our aim is simply to inspect elements of mutuality between the cave medium and art, we make no claims that could be adversely affected by chronological imprecision.
The 54 images examined in this study. For the images in Covalanas and El Pendo we refer to the classification system used by Moure Romanillo et al. (Reference Moure Romanillo, Morales and Sainz1990) and Montes Barquin (Reference Montes Barquin, Sainz and Llamosas2001) respectively. We employed our own system for El Castillo, based on image location.
Methodology
First, a 3D digital photogrammetric model was created for each image. Photogrammetry allows us to generate 3D models through the combination of a series of overlapping photographs taken of a subject from different angles, reproducing various information on their surface such as depth geometry, texture and colour (see Chodoronek Reference Chodoronek2015; Katz & Friess Reference Katz and Friess2014; Robert et al. Reference Robert, Petrognani and Lesvignes2016; Westoby et al. Reference Westoby, Brasington, Glasser, Hambrey and Reynolds2012). Recent advances in photogrammetric ‘Structure-from-Motion’ (SfM) techniques have revolutionized the method, as it dispenses with having to input much information manually and instead simulates parameters such as 3D scene geometry and camera position digitally (Westoby et al. Reference Westoby, Brasington, Glasser, Hambrey and Reynolds2012), and its accuracy has been demonstrated by many researchers who focus on a number of varied objects possessing unique surface features (e.g. human crania: Katz & Friess Reference Katz and Friess2014; a Cycladic female figurine: Koutsoudis et al. Reference Koutsoudis, Vidmar and Arnaoutoglou2013). This method has also been used in the study of Palaeolithic art, with demonstrable efficiency and accuracy (e.g. Feruglio et al. Reference Feruglio, Dutailly, Ballade, Vergnieux and Delevoie2015; Fritz et al. Reference Fritz, Wills and Tosello2016).
We used a Canon 1200D digital camera with an EFS 18–55mm lens secured on a tripod. Flashlights were used in the caves where electric lights were not installed. We used Agisoft Metashape software for 3D modelling. Metashape enables us to create highly accurate 3D models (for the application of Metashape to archaeology, see e.g. Kersten & Lindstaedt Reference Kersten, Lindstaedt, Ioannides, Fritsch, Leissner, Davies, Remondino and Caffo2012; Koutsoudis et al. Reference Koutsoudis, Vidmar and Arnaoutoglou2013). It has been used to record various cultural heritage subjects (e.g. rock art: Plisson & Zotkina Reference Plisson and Zotkina2015; artefacts: Nabil & Saleh Reference Nabil and Saleh2014; and underwater structures: McCarthy & Benjamin Reference McCarthy and Benjamin2014). In the first stage of Metashape data processing (producing sparse clouds), users select quality settings from lowest, low, medium, high to ultrahigh. Higher quality requires more processing time and more spec in a computer to process the data, but such ‘high’ level quality is always desirable for academic recording in order to maximize the model's accuracy (Chodoronek Reference Chodoronek2015). Next, dense point clouds are generated, using the same high-quality settings for all models. For a limited number of images (the average number of images used for generating a model is 58), we needed to downsize quality to medium due to the amount of data to be processed with existing computational capacity (Chodoronek Reference Chodoronek2015), but to mitigate this we increased the number of individual photographs contributing to these models as suggested by Westoby et al. (Reference Westoby, Brasington, Glasser, Hambrey and Reynolds2012). Metashape additionally contains a calibration programme for the camera lens which generates certain parameters that will equalize the distortion caused by the lens. By inputting such parameters into the settings of our Metashape models, we were able to increase their accuracy. We then exported our models to Photoshop CC (Version 17.0.1) for further analysis.
Analysis
Procedure
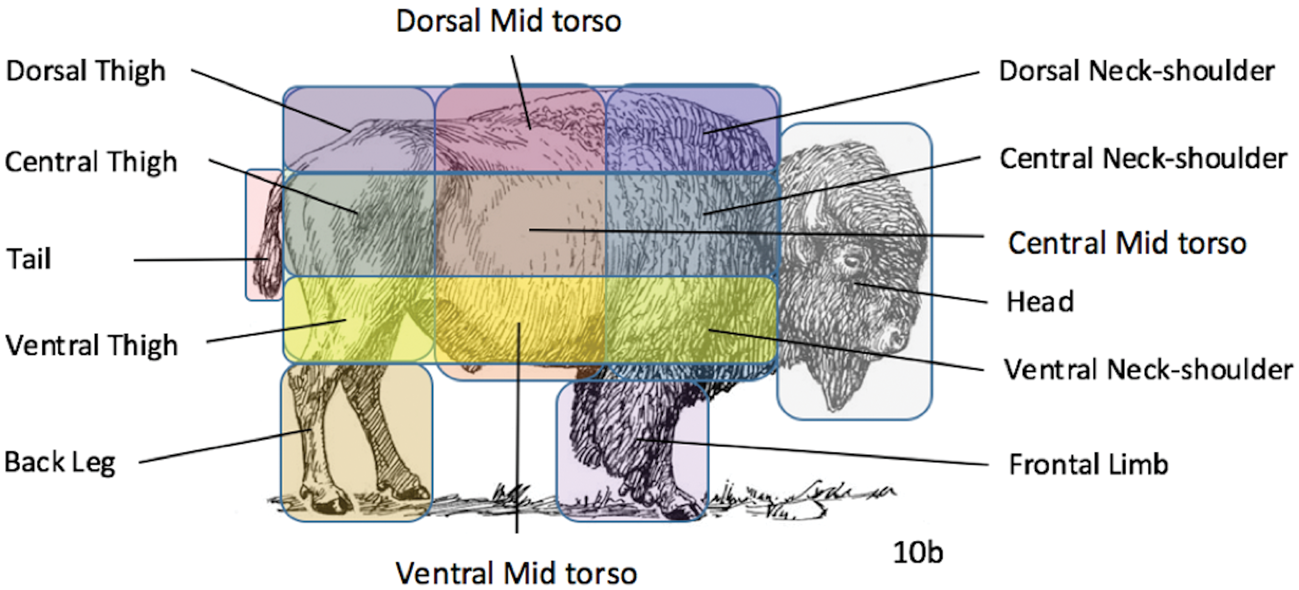
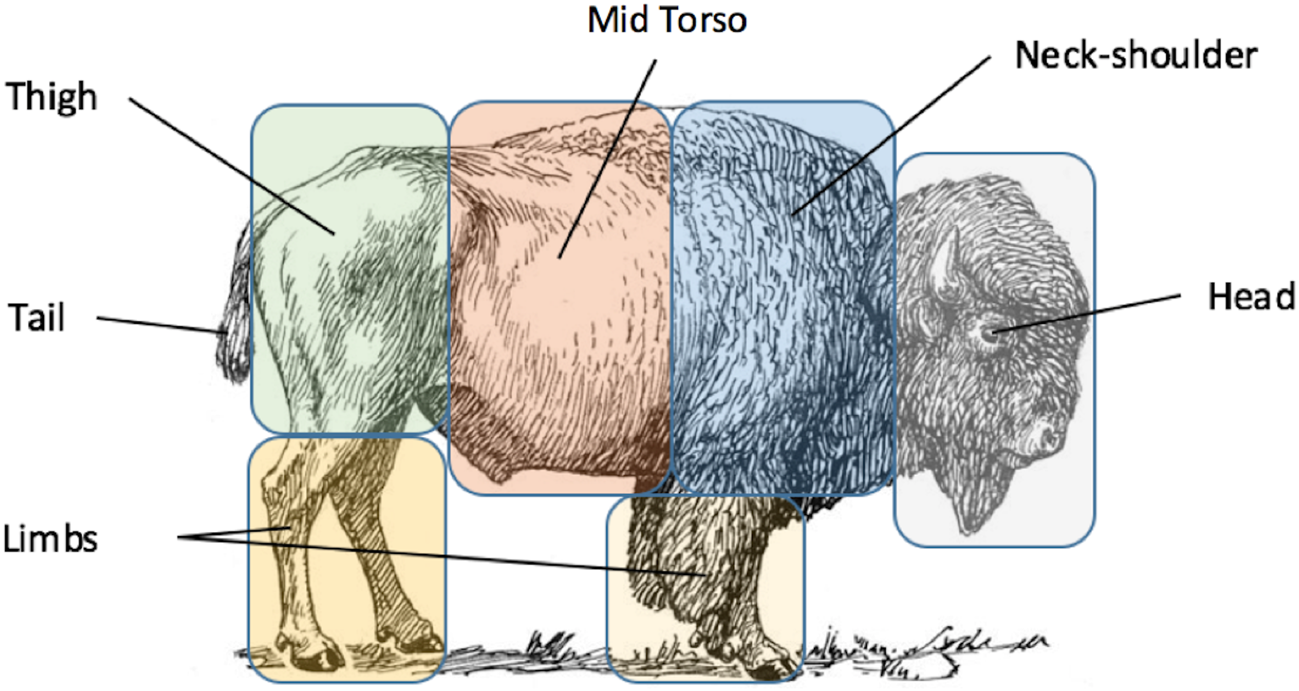
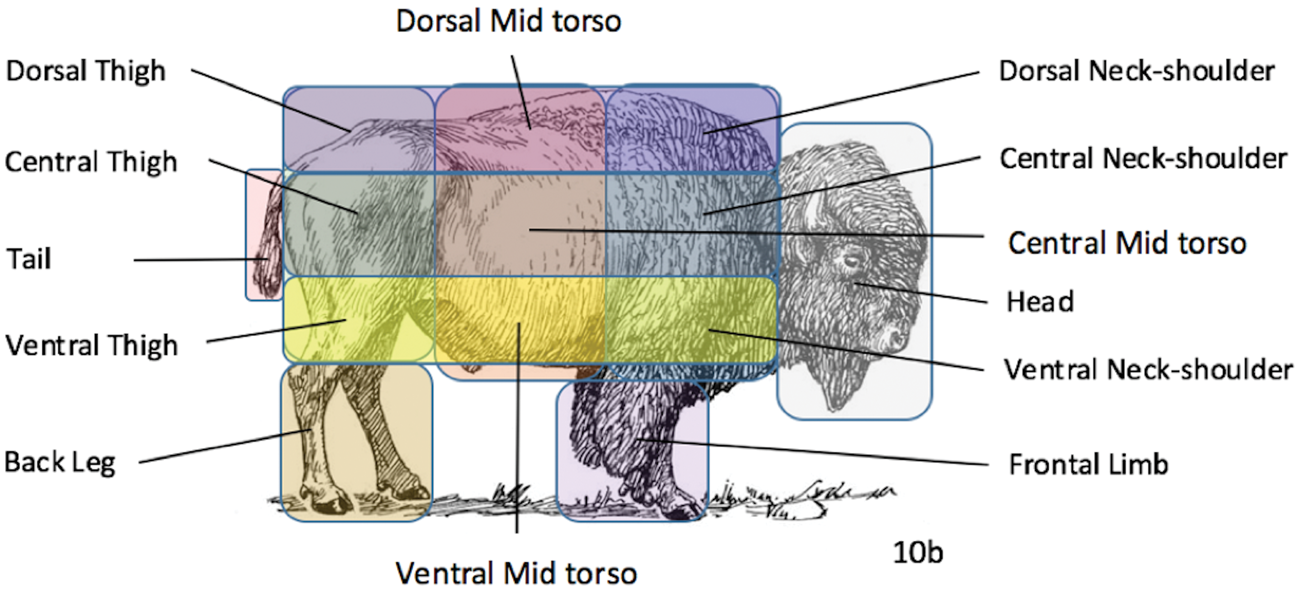
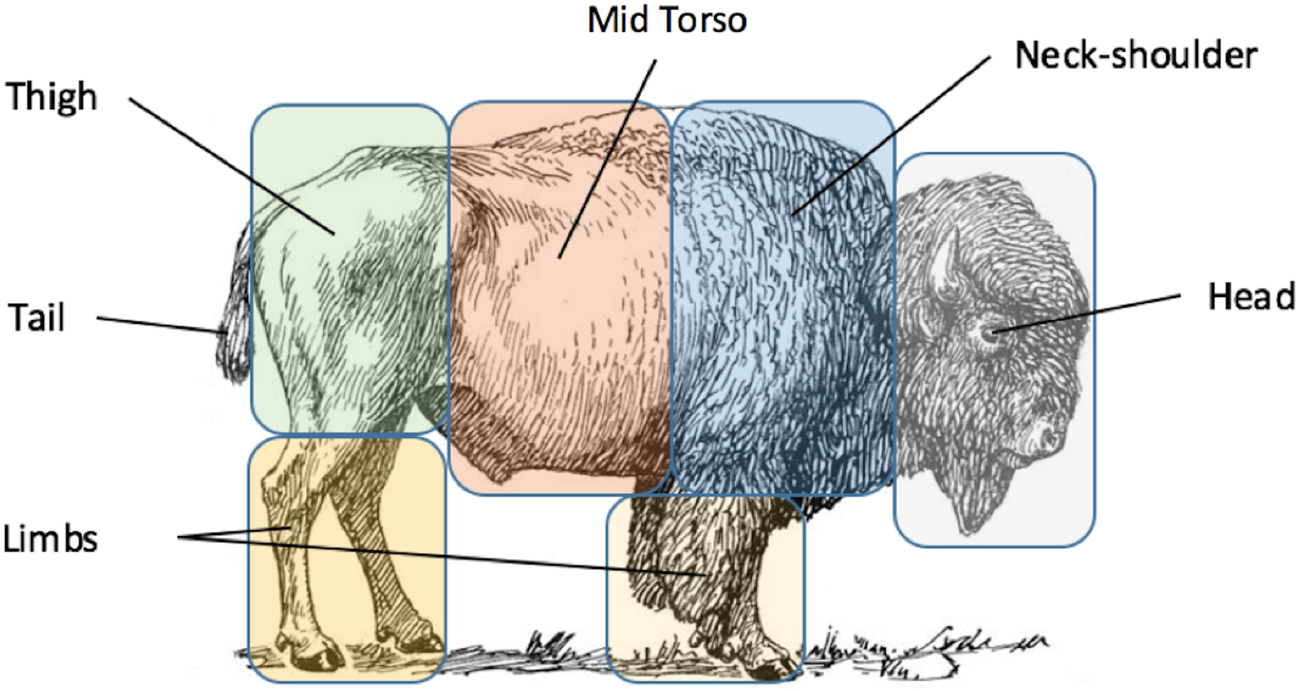
For each image, we express the topographic elevation of 13 distinct body parts at three levels (High, Medium, Low). These 13 sections are: head, neck-shoulder, mid-torso, thigh, front leg, rear leg and tail; the neck-shoulder, mid-torso and thigh parts were further subdivided into three, along their dorsal, central and ventral areas (Fig. 1). The neck and shoulders were treated as the same unit because the distinction of these parts is not conspicuous in many animal species. Our division between parts was determined on best estimation; body shapes are usually significantly diverse, despite possessing a naturalistic and ‘life-like’ form, but some possess a disproportionally large mid-torso and others a relatively small thigh.
The 13 body sections (head, neck-shoulder, mid-torso, thigh, front leg, rear leg and tail) used in the analysis. The neck-shoulder, mid-torso and thigh parts were further subdivided into three, along with their dorsal, central and ventral areas. (Basic image from https://commons.wikimedia.org/wiki/File:Bison_(PSF).jpg)
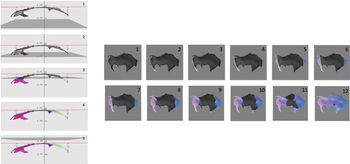
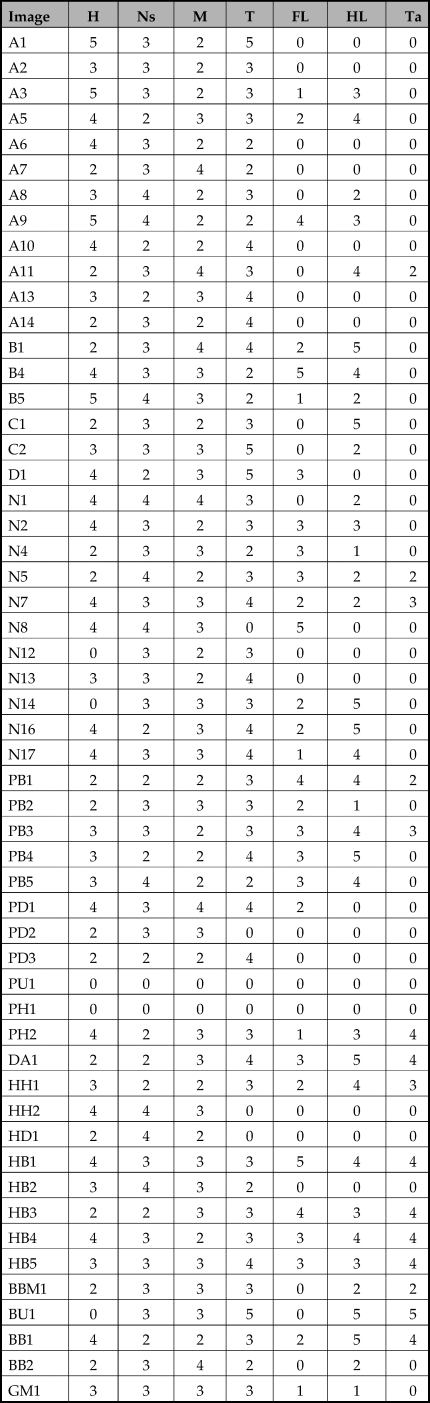
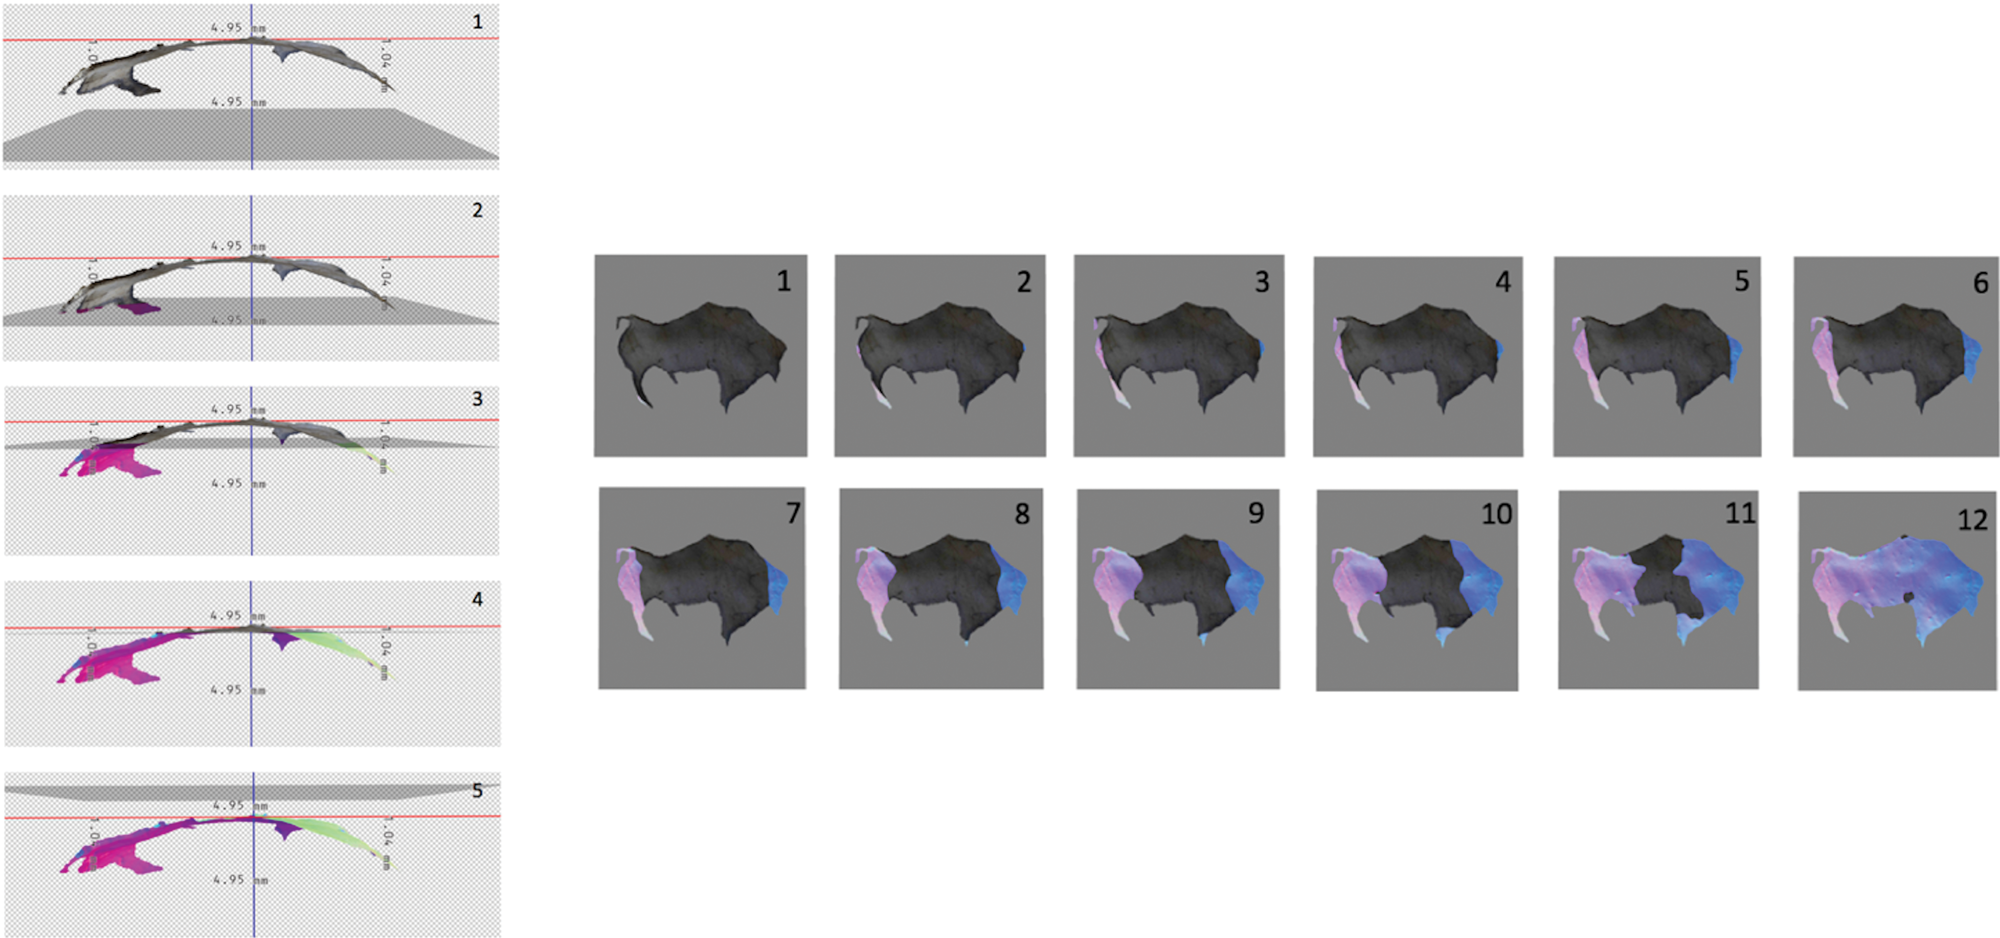
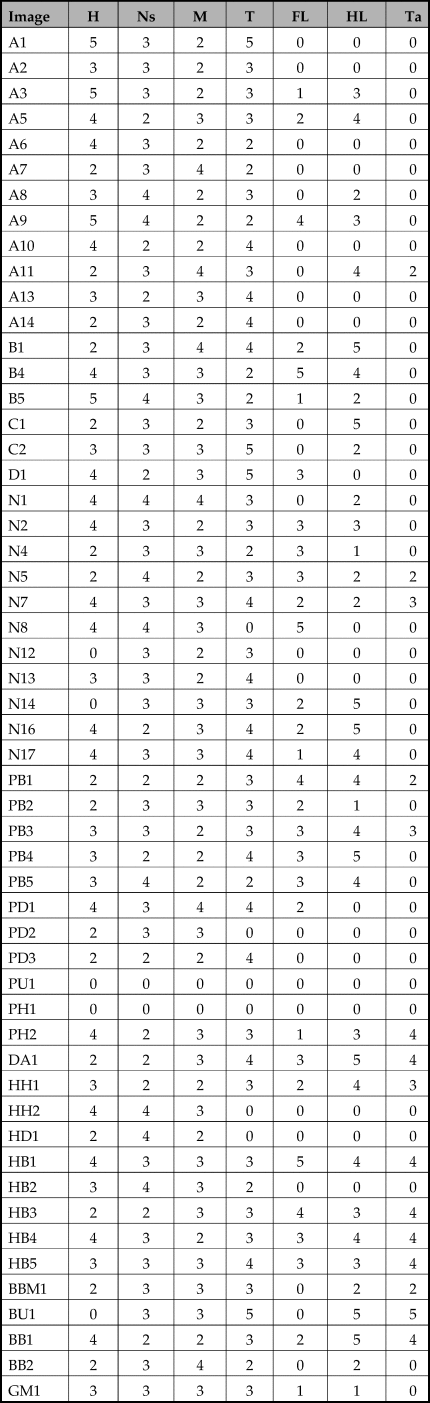
Following this, images were extracted from 3D models in terms of their outline contour and their topographic condition assessed for each body part. A cross-section layer was set horizontally across the models in Photoshop so that the models passed through it, in order to assess the elevation of each part. The cross-sectional layer can be placed anywhere in the 3D digital space and the elevation of body parts relative to it expressed in different colours by applying a Normals filter (Fig. 2). We employed a simple coding system to describe the elevation of each body part. We expressed the elevations of each image in terms of its distinct body parts figuratively. Our figures break down the specific parts of each image into a set of cross-sectional layers or sections (see numbers 1–12 in Figure 2), the precise number of which will differ for each image depending on the height of its elevations. Hence, a subtly differing image will have relatively few layers, whereas a profoundly differing image will have a high number. For the basic description, the elevation level of a body part was defined when more than half of that part passed the cross-sectional layer at a particular level (according to best estimation) and was numerically expressed by coded points of 1 to 5 (5 = Extra High: 4 = High: 3 = Medium: 2 = Low: 1 = Extra Low). The resulting data table thus codes for the topographic composition of each image, complementing each figurative representation. In this phase the dorsal, central and ventral regions of an image were united in order to simplify the data, i.e. component parts of the neck-shoulder, the middle and the thigh were treated as a single body part. To determine the elevation level of these united parts, the average value of each component area (1–5) was used, rounding to the nearest level. The resulting data table (Table 2) was subsequently used to ascertain whether a strong correlation exists between a specific body part and a specific topographic condition.
Cross-sectional layers of image (BB1). Figures on the left (numbered 1–5) illustrate how the cross-sectional layer passes a model (seen vertically). By inputting parameters, the cross-sectional layer (the grey layer in the figures) gradually proceeds towards a model (1–2). Accordingly, the 3D model starts passing through the layer from its highest area in elevation (2–3) and its lowest at the end (4–5). Figures on the right (numbered 1–12) show different elevation levels. As body parts pass the layer, the dark area changes into a bright colour. Bright areas denote higher elevation than those which remain dark.
Elevation levels (5 = Extra high: 4 = High: 3 = Medium: 2 = Low: 1 = Extra low: 0 = N/A) and corresponding body parts (H = Head; Ns = Neck-shoulder; M = Mid-torso; T = Thigh. FL = Front leg; HL = Hind Leg; Ta = Tail).
Distortion
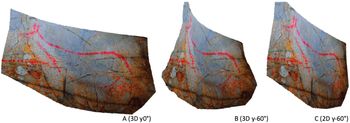
To analyse distortion, images were divided into six body parts (head, neck-shoulder, mid torso, thigh, leg and tail: Fig. 3). Secondly, 3D models were viewed from different angles in Photoshop in order to identify body sections which appeared remarkably distorted. Once an obvious distortion was detected, it was recorded to body part. Subsequently, we coded and compared differences in the appearance of images when they are viewed from multiple viewpoints. We did this by horizontally rotating the 3D models. One cannot forget the direct influence that different lighting conditions will have on image's visibility, and how this in turn will affect the viewer's perception. We did not simulate this lighting–image relationship because our primary concern here is to observe the specific nature of the distortion. We took into account the height of each image from the original Pleistocene cave floor (negligible changes except in El Pendo, where we can reconstruct the cave's original floor some 150–200 cm lower than today: Montes Barquin et al. Reference Montes Barquin, Gonzalez, Laguna and Luque1998). 3D models of images at high levels were tilted in the X-axis based on their heights so as to simulate how those images appear when viewers must look up to view them. In the case of El Pendo, the models were fixed as a preset in the position of X30°. We then compared the appearance of images viewed from the front and sides in order to detect any obvious distortions. We confirmed deformations when the outline of body parts is apparently deformed (twisted, bent, contracted: Fig. 4, see A–B). Additionally, we performed similar experiments for images drawn on a flat surface; we also rotated images fixed on 2D surface in 3D computational space by the same procedure as the above 3D simulation, and compared the difference in appearance between the two (Fig. 4, B–C). By such a comparative analysis we were able to isolate the distortions caused by topographic intervention from those caused simply by perspective.
The seven main body sections (head, neck-shoulder, mid-torso, thigh, front leg, rear leg and tail).
3D photogrammetric model of cervid A1 from frontal (direct) position (A), left oblique (B), and 2D model seen from the left (C). We identified images as being distorted when the outline of the body is twisted, bent, or contracted. By comparing the 3D to the 2D model, we were able to isolate the distortions caused by topographic intervention from those caused by simply by the viewer's perspective.

Results
Topography and image
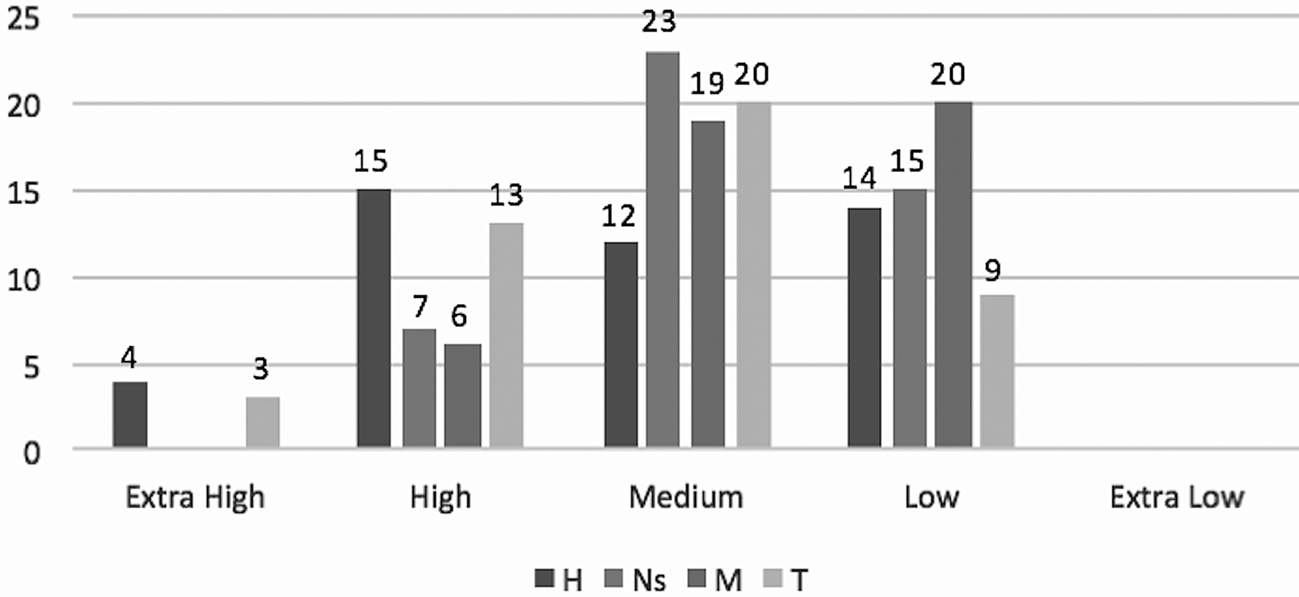
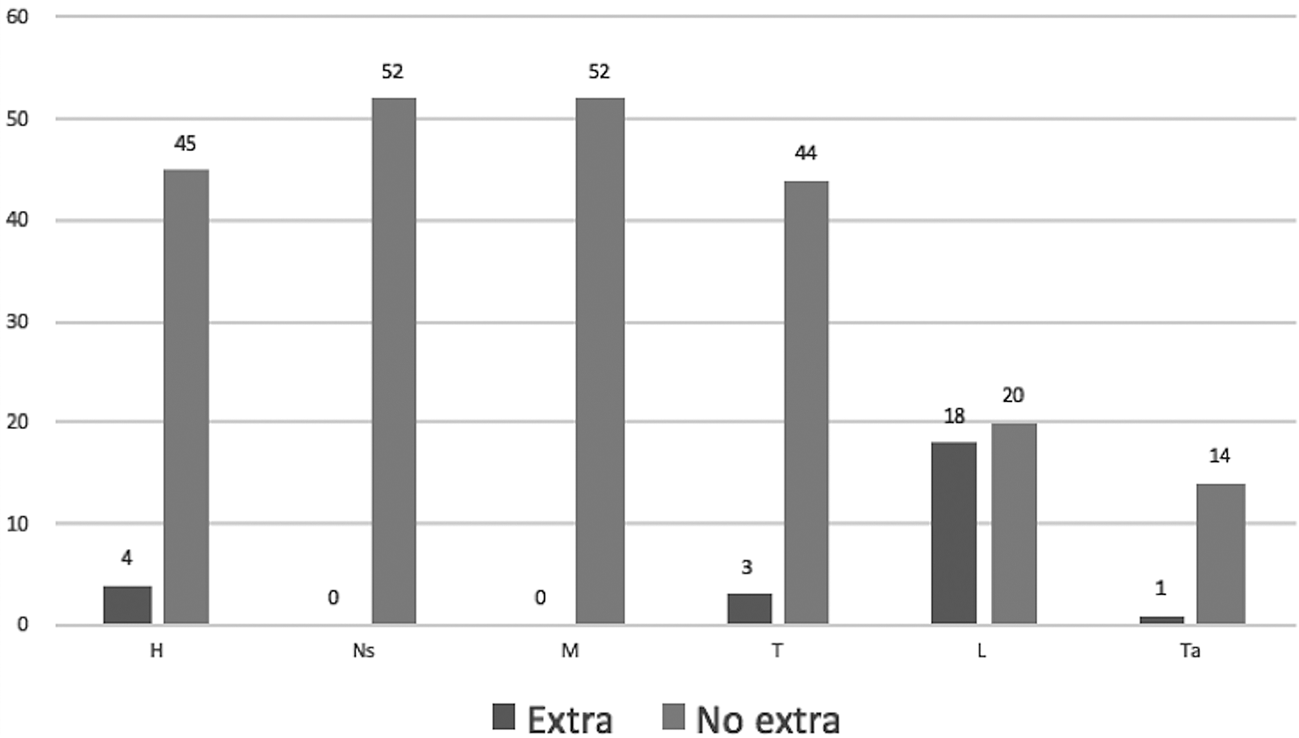
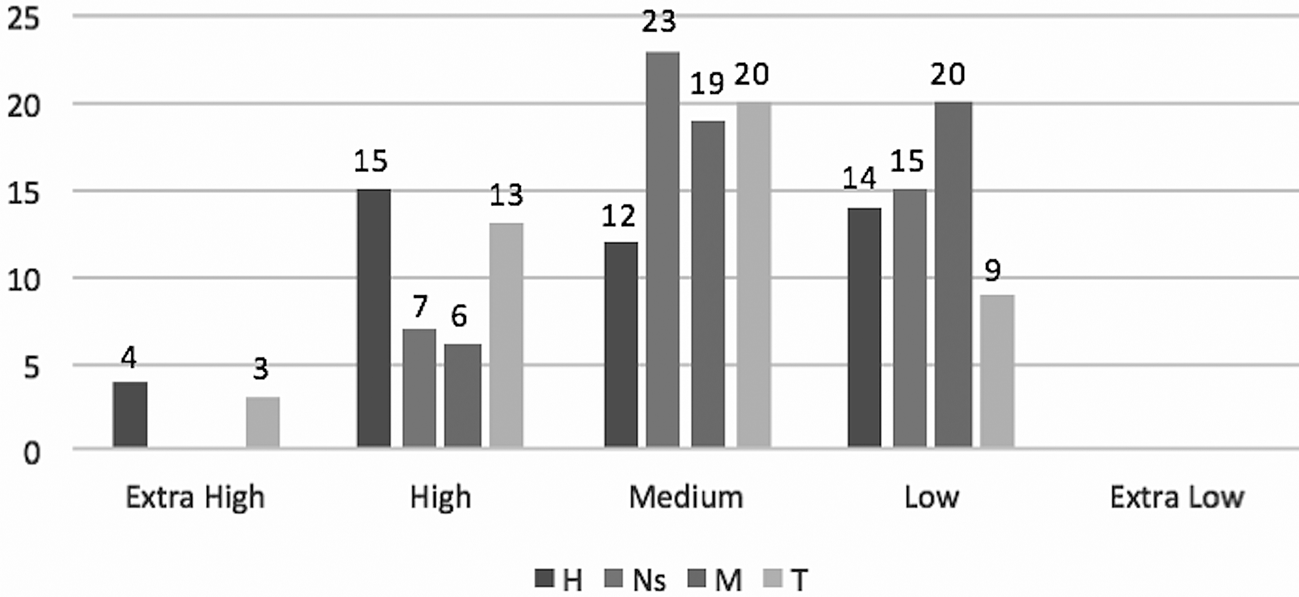
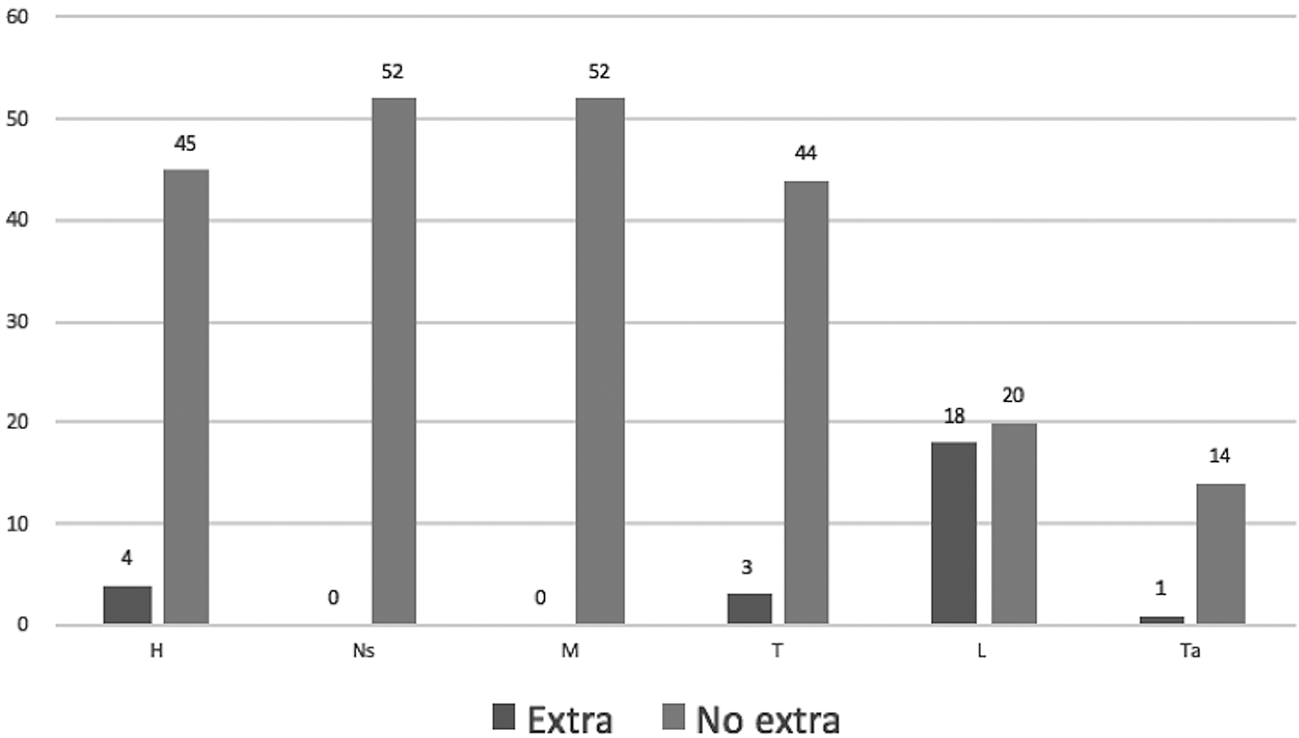
Forty-five of our sample of 54 images can be considered to be complete, i.e. possess every one of our body parts excepting the extremities of the legs/tail which are often missing in cave art (Covalanas = 18; El Pendo = 8; El Castillo = 19). We were able to detect six types of topographic relationships among these. Interestingly, each of the three caves displayed the same trends. Figure 5 shows the distribution of each body section (head, neck, mid-torso, thigh) by elevation level. We also calculated the sum of the elevation point based on this distribution (5 = Extra High; 4 = High; 3 = Medium; 2 = Low; 1 = Extra Low) for each section; the higher points correspond to higher elevation. Accordingly, it can be seen that the thigh (145 points) and head (144) are more frequently placed on an area of higher elevation than the neck-shoulder (127) and middle torso (121). Clear patterns also appear even in the leg. Figure 6 demonstrates the distribution of extra and non-extra elevation levels by body section (the data are derived from 54 images). The leg (front and rear) tends to be located on extra high or low levels much more frequently than the other body parts (n = 18, 47 per cent).
Number of images by elevation levels and corresponding body parts (H = Head; Ns = Neck-shoulder; M = Mid-torso; T = Thigh. Data derived from 45 images). The head and thigh are frequently placed on areas of higher elevation levels, while the neck-shoulder and middle part tend to be found on lower levels.
Distribution of extra and non-extra elevation levels by body section (H = Head; Ns = Neck-shoulder; M = Mid-torso; T = Thigh; L = Leg; Ta = Tail. Data derived from 54 images). The legs tend to be located on Extra high or low levels much more frequently than the other body parts (18 images = 44 per cent).
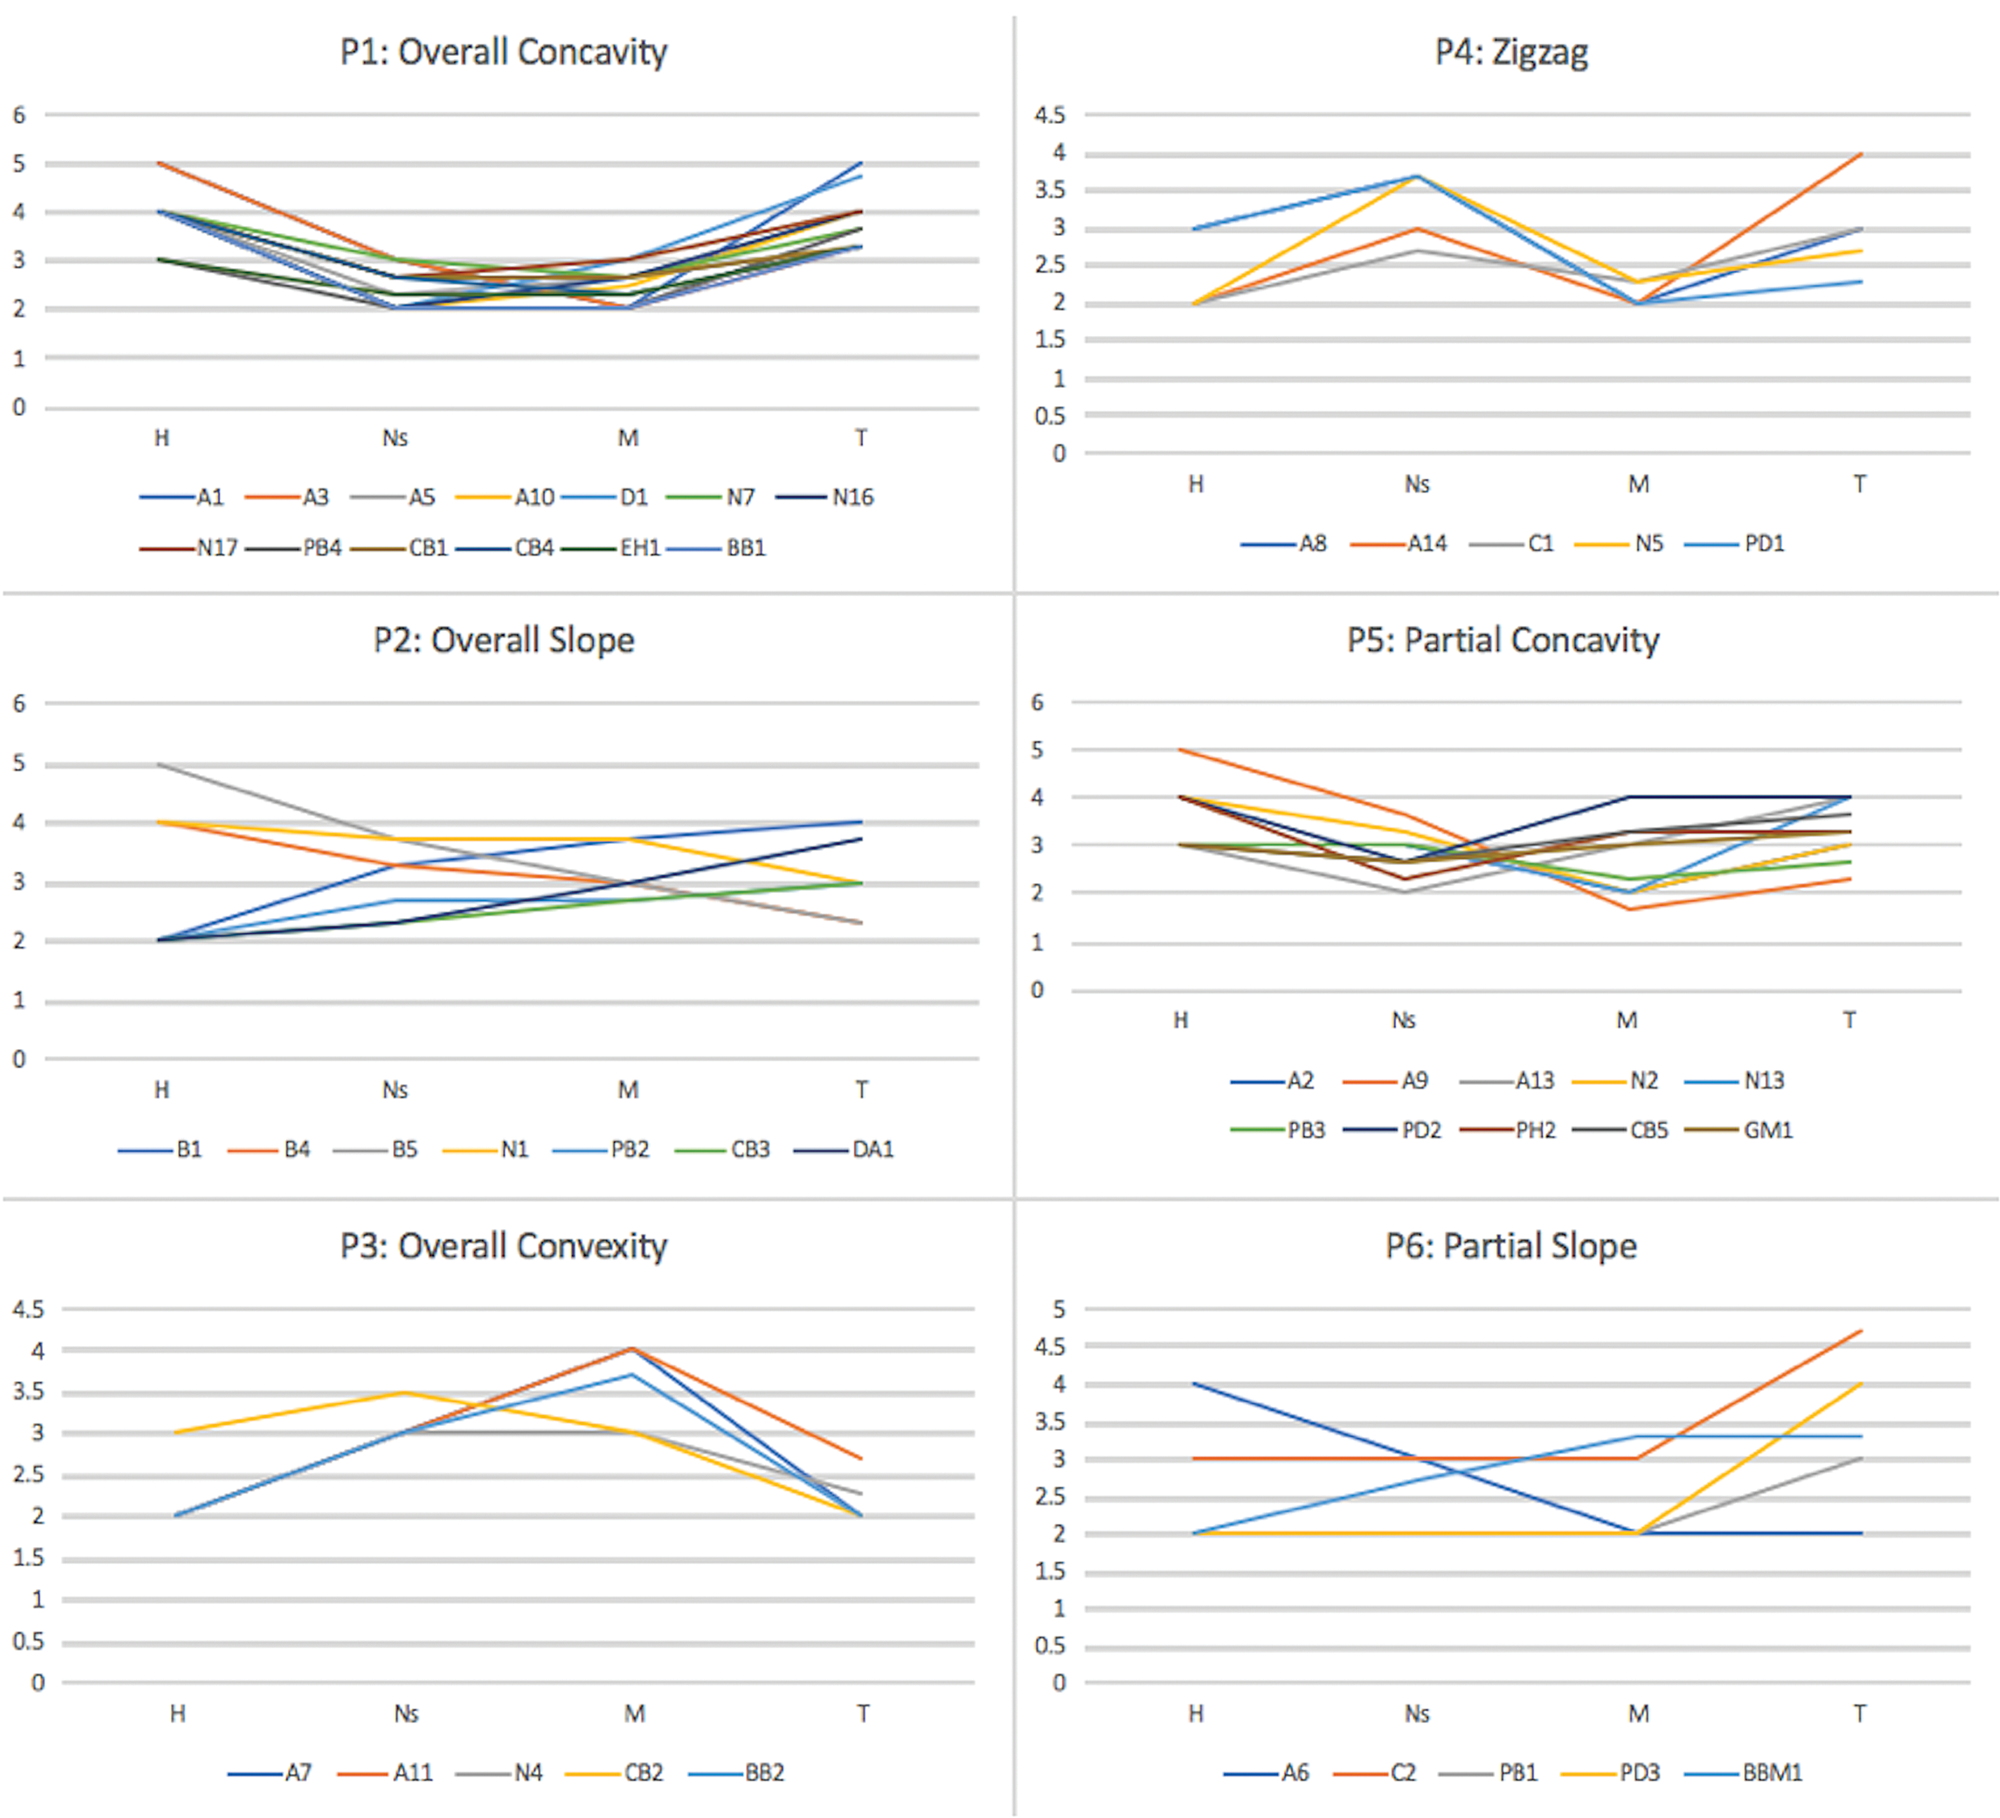
We have also expressed the topography of each image as a line graph, showing the elevation levels of the head, neck-shoulder, mid-torso and thigh so that the shape of the graph schematically represents the topographic condition (Fig. 7). We detected six topographic patterns:
• Pattern 1 (P1): Overall concavity. The elevation of both neck-shoulder and mid-torso is lower than that of both head and thigh.
• Pattern 2 (P2): Overall slope. The elevation of both neck-shoulder and mid-torso is lower than either head or thigh but higher than either head or thigh. At the same time, the elevation does not fluctuate between these four body parts.
• Pattern 3 (P3): Overall convexity. The elevation of both neck-shoulder and mid-torso is higher than that of both head and thigh.
• Pattern 4 (P4): Zigzag. The elevation constantly fluctuates between the four body parts.
• Pattern 5 (P5): Partial concavity. The elevation of either neck-shoulder or mid-torso is lower than that of both head and thigh.
• Pattern 6 (P6): Partial slope. The elevation of both or either neck-shoulder or mid-torso is same as that of either head or thigh but at the same time higher or lower than either head or thigh.
Line graphs representing the topography of specific images. Six patterns have been identified among the sample of 45 images. The most common pattern is Overall Concavity (13 images = 29 per cent). The next most common is Partial Concavity (10 = 22 per cent), then Overall Slope (7 = 16 per cent). Meanwhile, Overall Convexity, Zigzag and Partial Slope are represented by five images each (11 per cent).
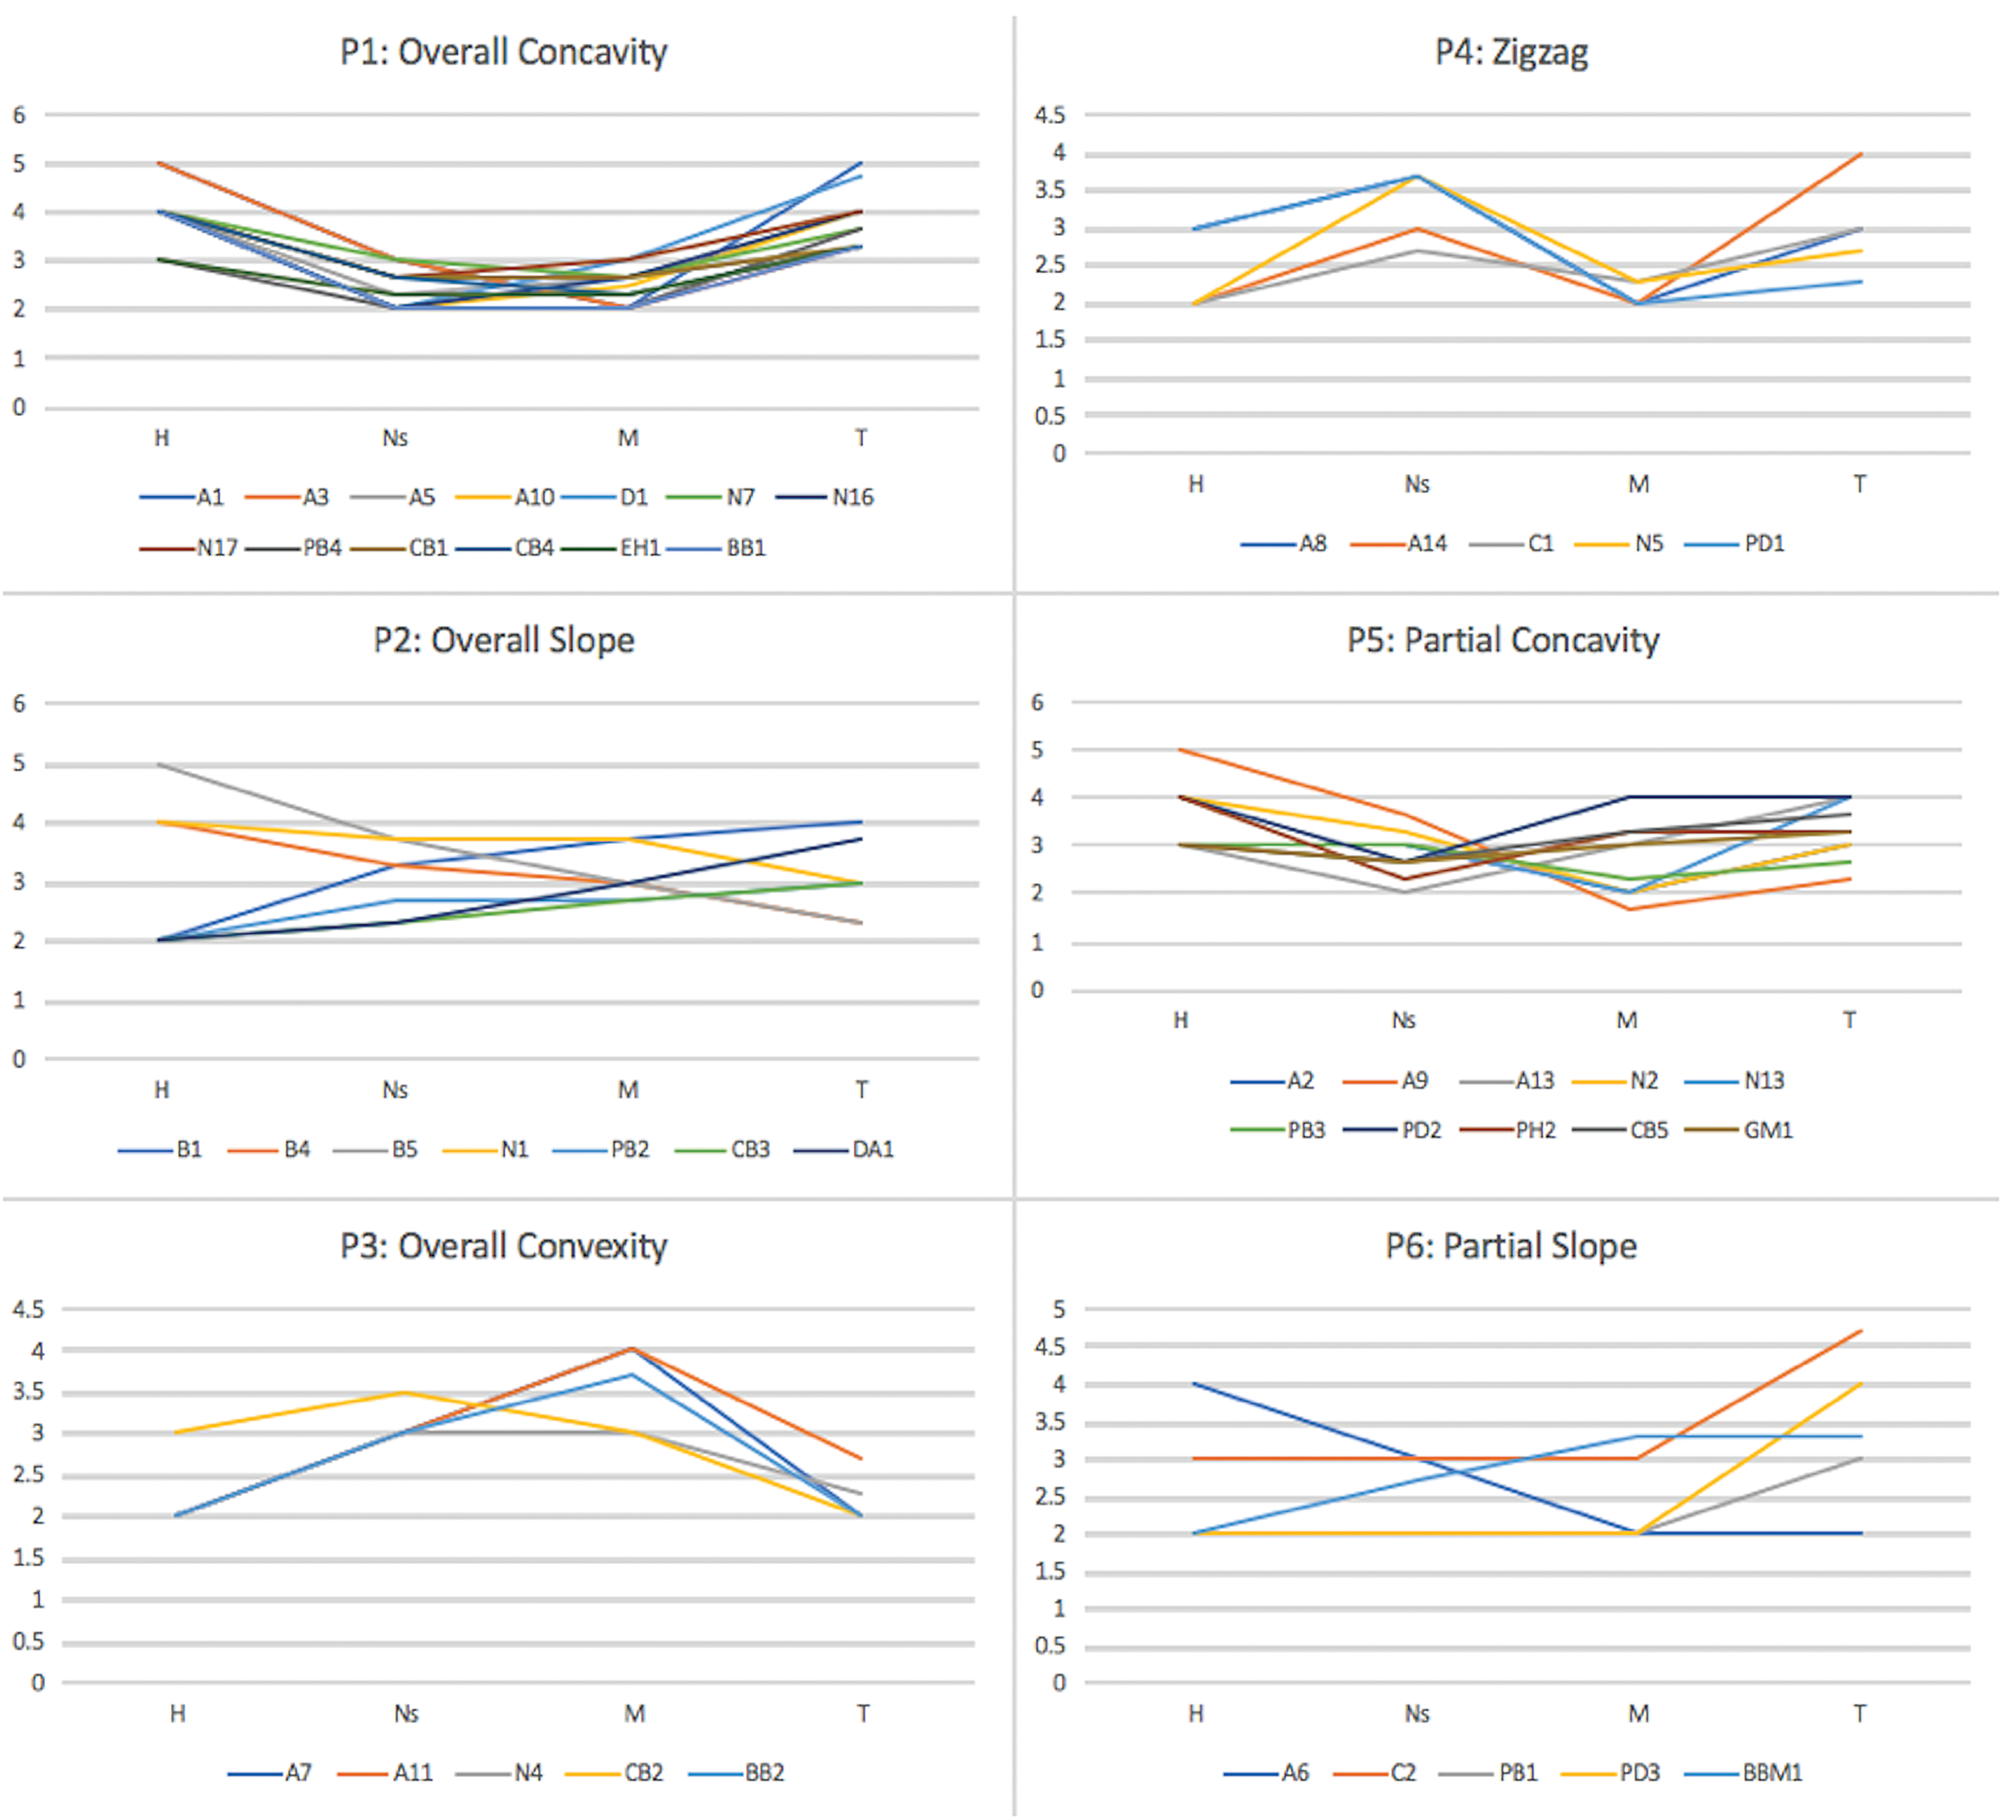
P1 is the predominant topographic pattern (13 images = 29 per cent), followed by P5 (10 images = 22 per cent); P5 topography also contains a concave feature. This number accounts for over half of the total, which is significantly higher than the rest of the types (P2: 7 = 16 per cent, P3: 5 = 11 per cent, P4: 5 = 11 per cent and P6: 5 = 11 per cent). We can conclude from this that >50 per cent of images had their fronts and rears (i.e. heads and rumps) placed on locations with a higher elevation than the surrounding areas, irrespective of any other patterning visible. It is important to note that this was not dictated by the cave topography: if artists wanted to avoid this effect, they could simply have depicted the image at a smaller scale or used a flatter section of wall. The fact that they did not suggests this was a deliberate fitting of the image to topography, and that the latter probably dictated the images scale. This observation may go some way to explaining why the scale of images in Palaeolithic cave art can vary so much, even within the same cave.
Results
Distortion of images
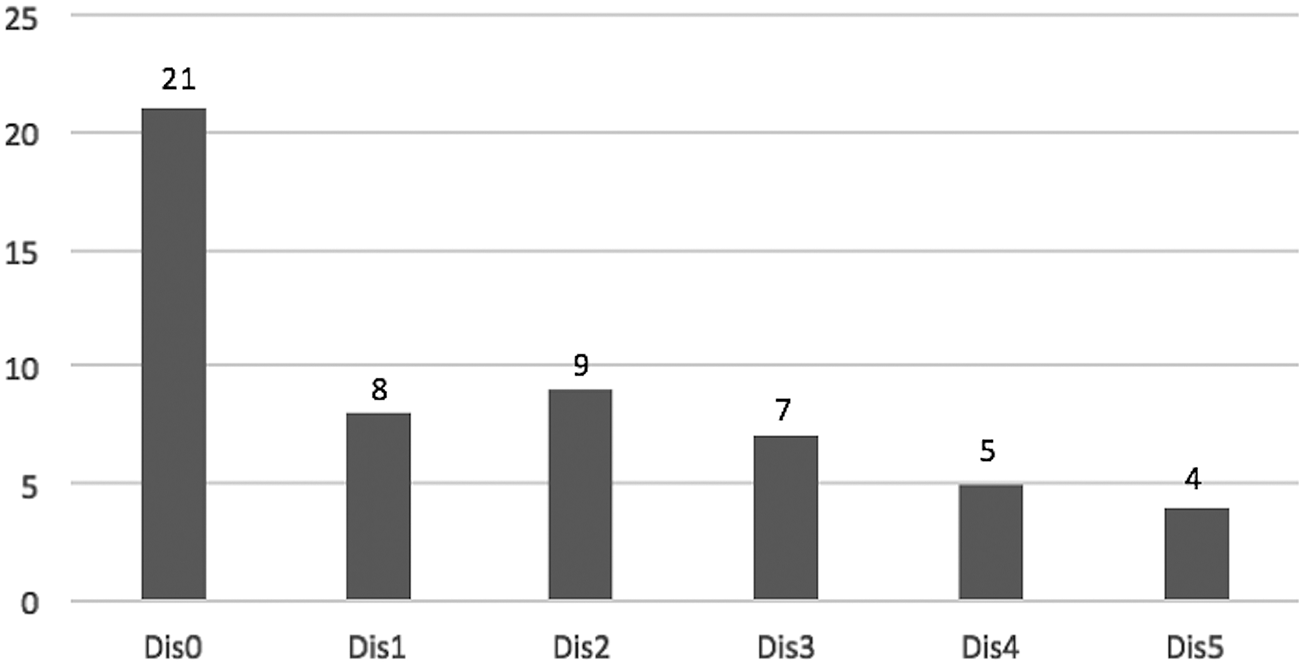
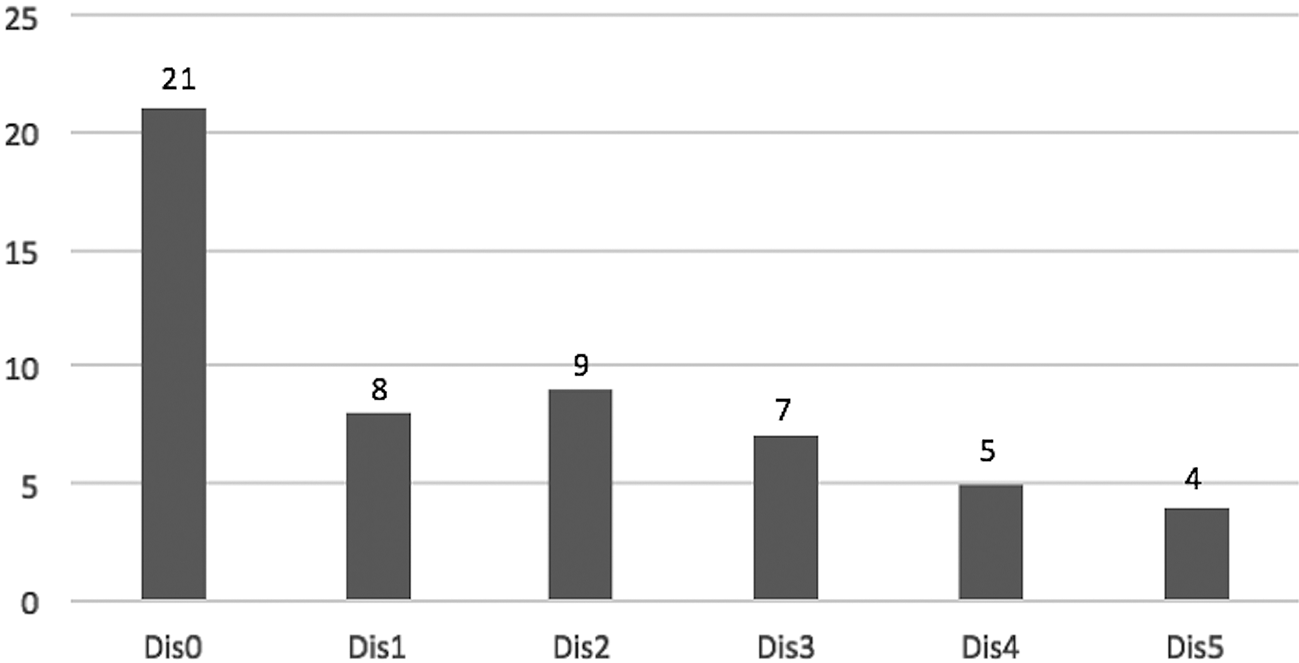
We were able to confirm distortion on 33 of our 54 images (61 per cent), which suggests they were relatively frequent phenomena in Covalanas, El Pendo and El Castillo (Fig. 8). Of these, 25 (nearly 50 per cent) have distortion on more than one body part, and appear noticeably deformed. The ratio of distortion differs between the three caves: in El Pendo most images are deformed (10/11 images = 91 per cent); in Covalanas distortion occurs in 11/18 (61 per cent), and in El Castillo distortion is least visible at 12/25 (48 per cent). This difference may be accounted for by the way in which images are depicted in each cave. In Covalanas and El Pendo, they are depicted on a single panel, or at least adjacent areas whose topography is homogenously undulating. If the surface within a particular area sustains undulation of a degree sufficient to cause distortion, all images distributed in the area will also be distortable to the same degree. In El Castillo, by contrast, our images derive from several distinct areas, between which the nature of the wall varies noticeably, including some walls which are significantly featureless. Such a lack of consistency in topography, therefore, is reflected in our results. Distortion is not observed on 21 images (39 per cent), and presumably two factors are in operation in these undistorted figures. First, 12 of them are incomplete, missing a large part of the body: the ventral section is absent from A2, A6, A7, A13, A14, PU1, CB2; the posterior side is not depicted in PB5; only the face is presented for N13, PD3, PH1, ED1. Therefore, the relatively limited body area available for observation reduces the overall chance of distortion. Secondly, the depth for these undistorted 21 images (average 4.7 cm) is noticeably lower than those with distortion (average 11.5 cm); they have been created on a surface that is almost flat. In such cases, images presumably served ‘simpler’ visual functions rather than as cues for viewer interaction.
Number of images by frequency of distortion (Dis = Distortion. Data derived from 54 images). We confirmed distortion on 33 images (61 per cent). 25 images (nearly 50 per cent) have distortion on more than one body section.
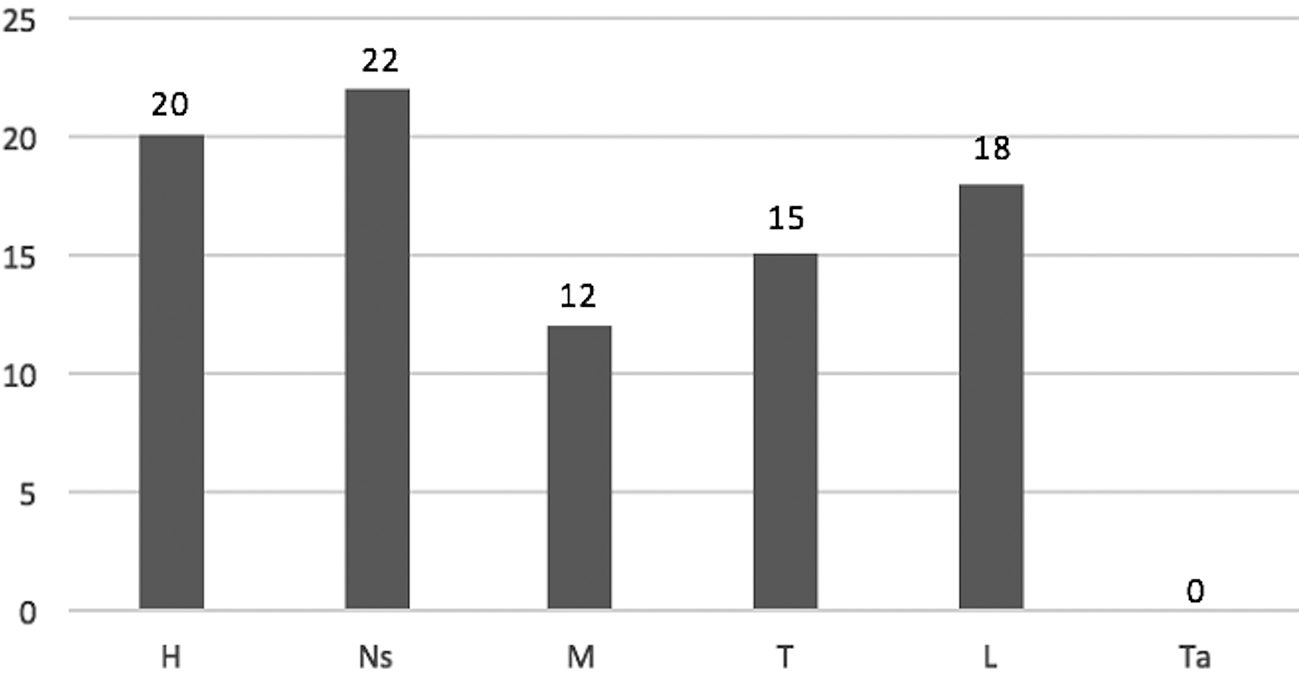
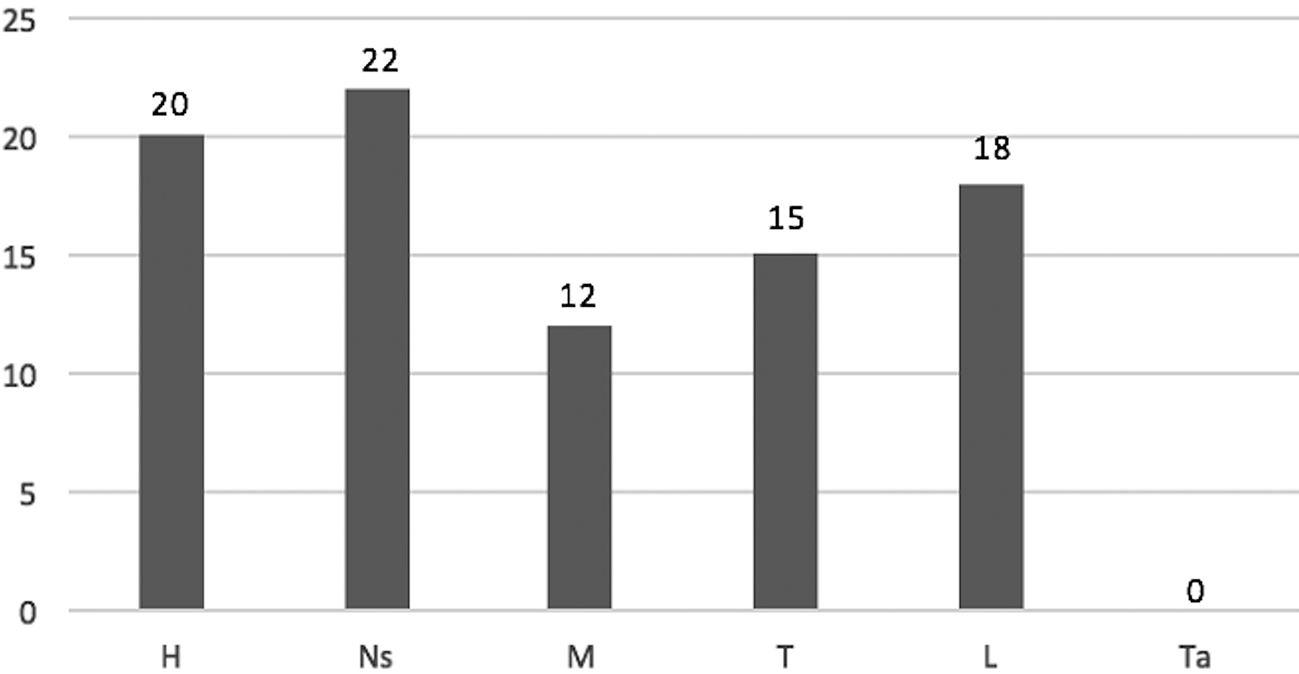
The three caves reveal a meaningful trend between the locations of distortion one ach image. As illustrated in Figure 9, distortions mostly occurred on the head (22/87 cases = 25 per cent), neck-shoulder (23 per cent) and legs (21 per cent), whereas the thigh (17 per cent) and mid-torso (14 per cent) were less frequently deformed. No distortion was found on the tail. Although our results suggest a general trend, the specific value for legs and neck-shoulder varies cave by cave. In Covalanas we were able to confirm only four cases of deformation on the legs, while in the other caves legs are far more likely to have been deformed. This is probably due to the fact that legs are absent in eight images in Covalanas, however, and the ratio (distortions of limbs/number of images = 4/10 = 40 per cent) is in fact the second highest among all body sections (head: 39 per cent; neck-shoulder: 44 per cent; mid-torso: 22 per cent; thigh: 33 per cent; tail: 0 per cent). Therefore, it can be considered that the legs are highly distortable here, as in Covalanas. Additionally, the inconsistency for the neck-shoulder is particularly noteworthy because the result depends on the dominant motif in each cave; in El Castillo, where bison is the most frequent image, the frequency of distortion for the neck-shoulder was the third lowest. By contrast, this section is the most commonly distorted in Covalanas and El Pendo, in both of which red deer is by far the dominant motif. Bison display much less of a clear boundary between the head and neck than deer, and the distortion on the neck-shoulder in bison is not as clearly confirmable as in deer. For this reason, the unclear boundary between the head and neck makes the perception of distortion difficult, resulting in its low frequency in El Castillo. Overall, the head, neck (except in the case of bison), mid-torso and legs exhibit a certain level of consistency: while the head, neck and legs are commonly distorted in the three case studies, the mid-torso tends to be static. To our understanding, distortions occur when a large elevational gap (low or high) is found in a single body section (thus, the part appears distorted) or between two adjacent areas (e.g. higher head-neck in comparison with the central area of the body will be distorted). We note that the anatomical areas that are most likely to be distorted, therefore, are those that are most mobile on the real animal. Given this, it seems hard to assume that allocating most distortion-causing topographic setting to these mobile sections was simply random. We note the fact that the tail of mammals is also highly mobile (see Azéma Reference Azéma2010), although we did not confirm any distortions of the tail in our samples. One might initially think that this contradicts our interpretation, but it is probably due to the fact that images including a tail are not particularly common among our target caves (n = 15, 28 per cent); the distortion is invisible as the section is depicted much smaller than the others in most figures; and the topography of the tail is not conspicuously high/low in comparison with surrounding areas.
Number of distortions by body part (H = Head: Ns = Neck-shoulder: M = Mid-torso, T = Thigh, L = Limbs and Ta = Tail. Data derived from 54 images). Distortions dominantly occur on the head (20 = 23 per cent), neck-shoulder (22 = 25 per cent), and legs (18 = 21 per cent). The thigh (15 = 17 per cent) and mid-torso (12 = 14 per cent) were less frequently distorted. No distortion was found on tails.
Discussion
Topography
We hypothesize that the frequent selection of areas of concave topography for image making that we have identified in El Castillo, El Pendo and Covalanas reflects not a random association, but intentional selection by Palaeo-artists for the placement of specific body parts. The undulating surfaces of a cave wall can, of course, be used in a similar way to low-relief sculpture, i.e. to convey volume and thereby naturalism to images (Bahn Reference Bahn2016; Leroi-Gourhan Reference Leroi-Gourhan1968). BBM1 (known as Bison-man) in El Castillo epitomizes such a ‘sculptural’ image: although BBM1 is classified as P6 (Partial slope), the subtle undulation of its body (neck-shoulder, mid-torso, thigh) is reminiscent of a real mammal once its topography is carefully examined. At the same time, the undulation on the hind leg corresponds to the way that human legs appear. Also, since the entire body of BBM1 is located on a slight convexity whose elevation especially rises from the mid-torso to the thigh, for viewers this ‘Bison-man’ no longer appears as a 2D image, but in low relief. Such a sculptural effect can also be seen in C2, N16, PB2 and BU1, which all possess large thigh convexities. This body part is noticeably elevated as a result of such an arrangement. Accordingly, the elevation of the thigh appears to represent the rise of a muscle.
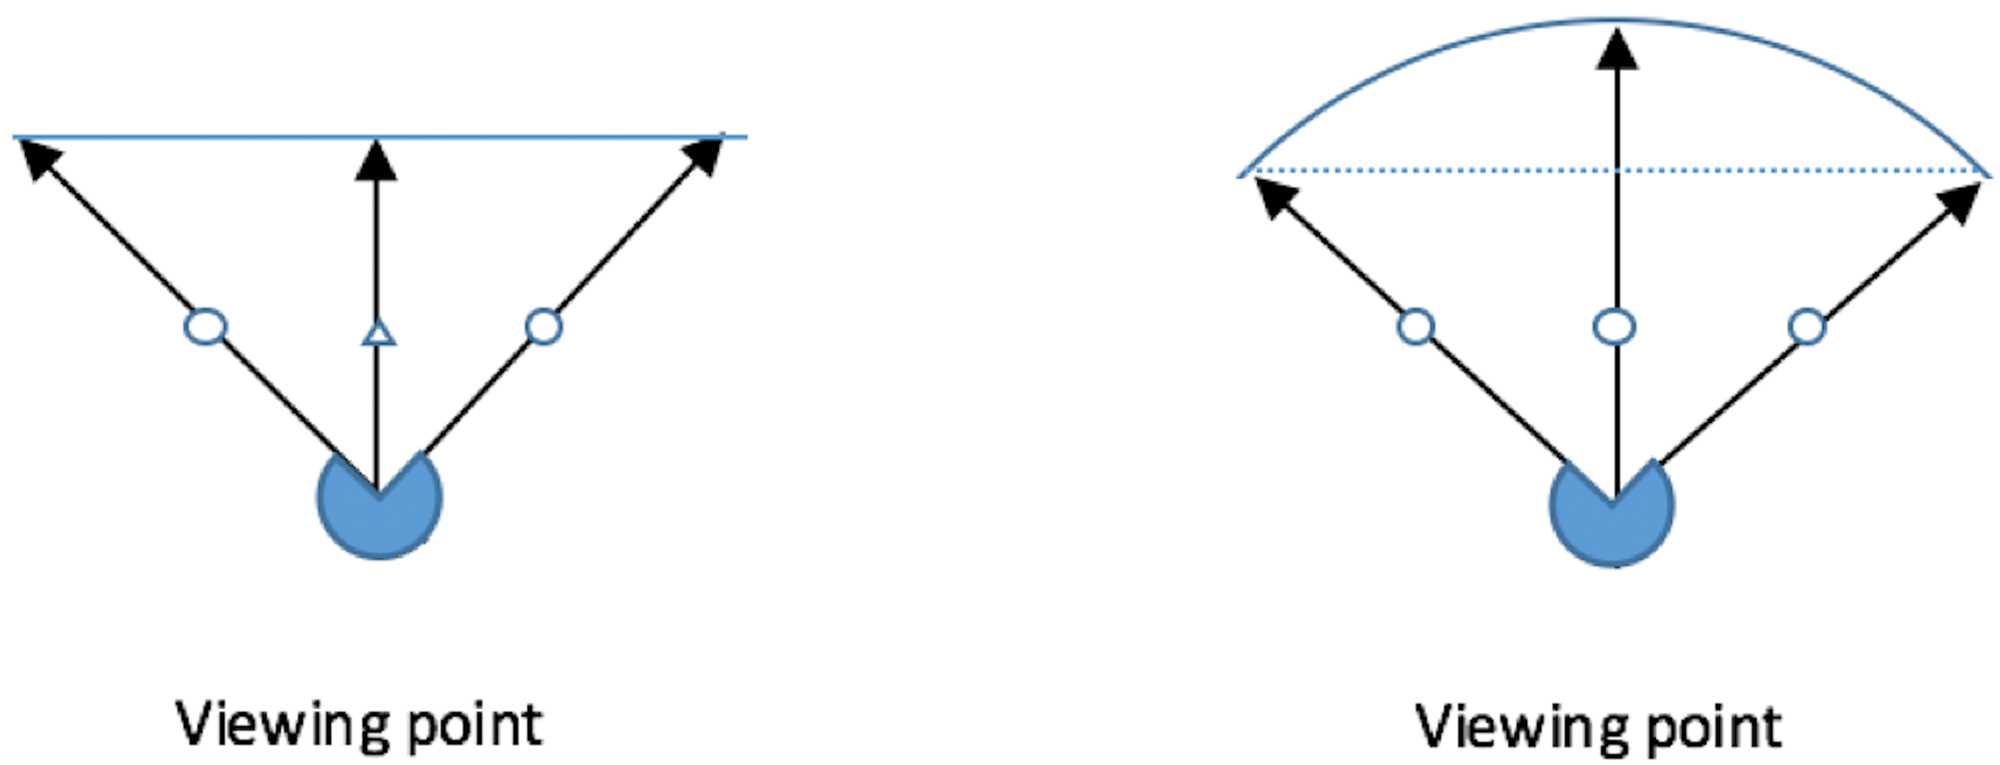
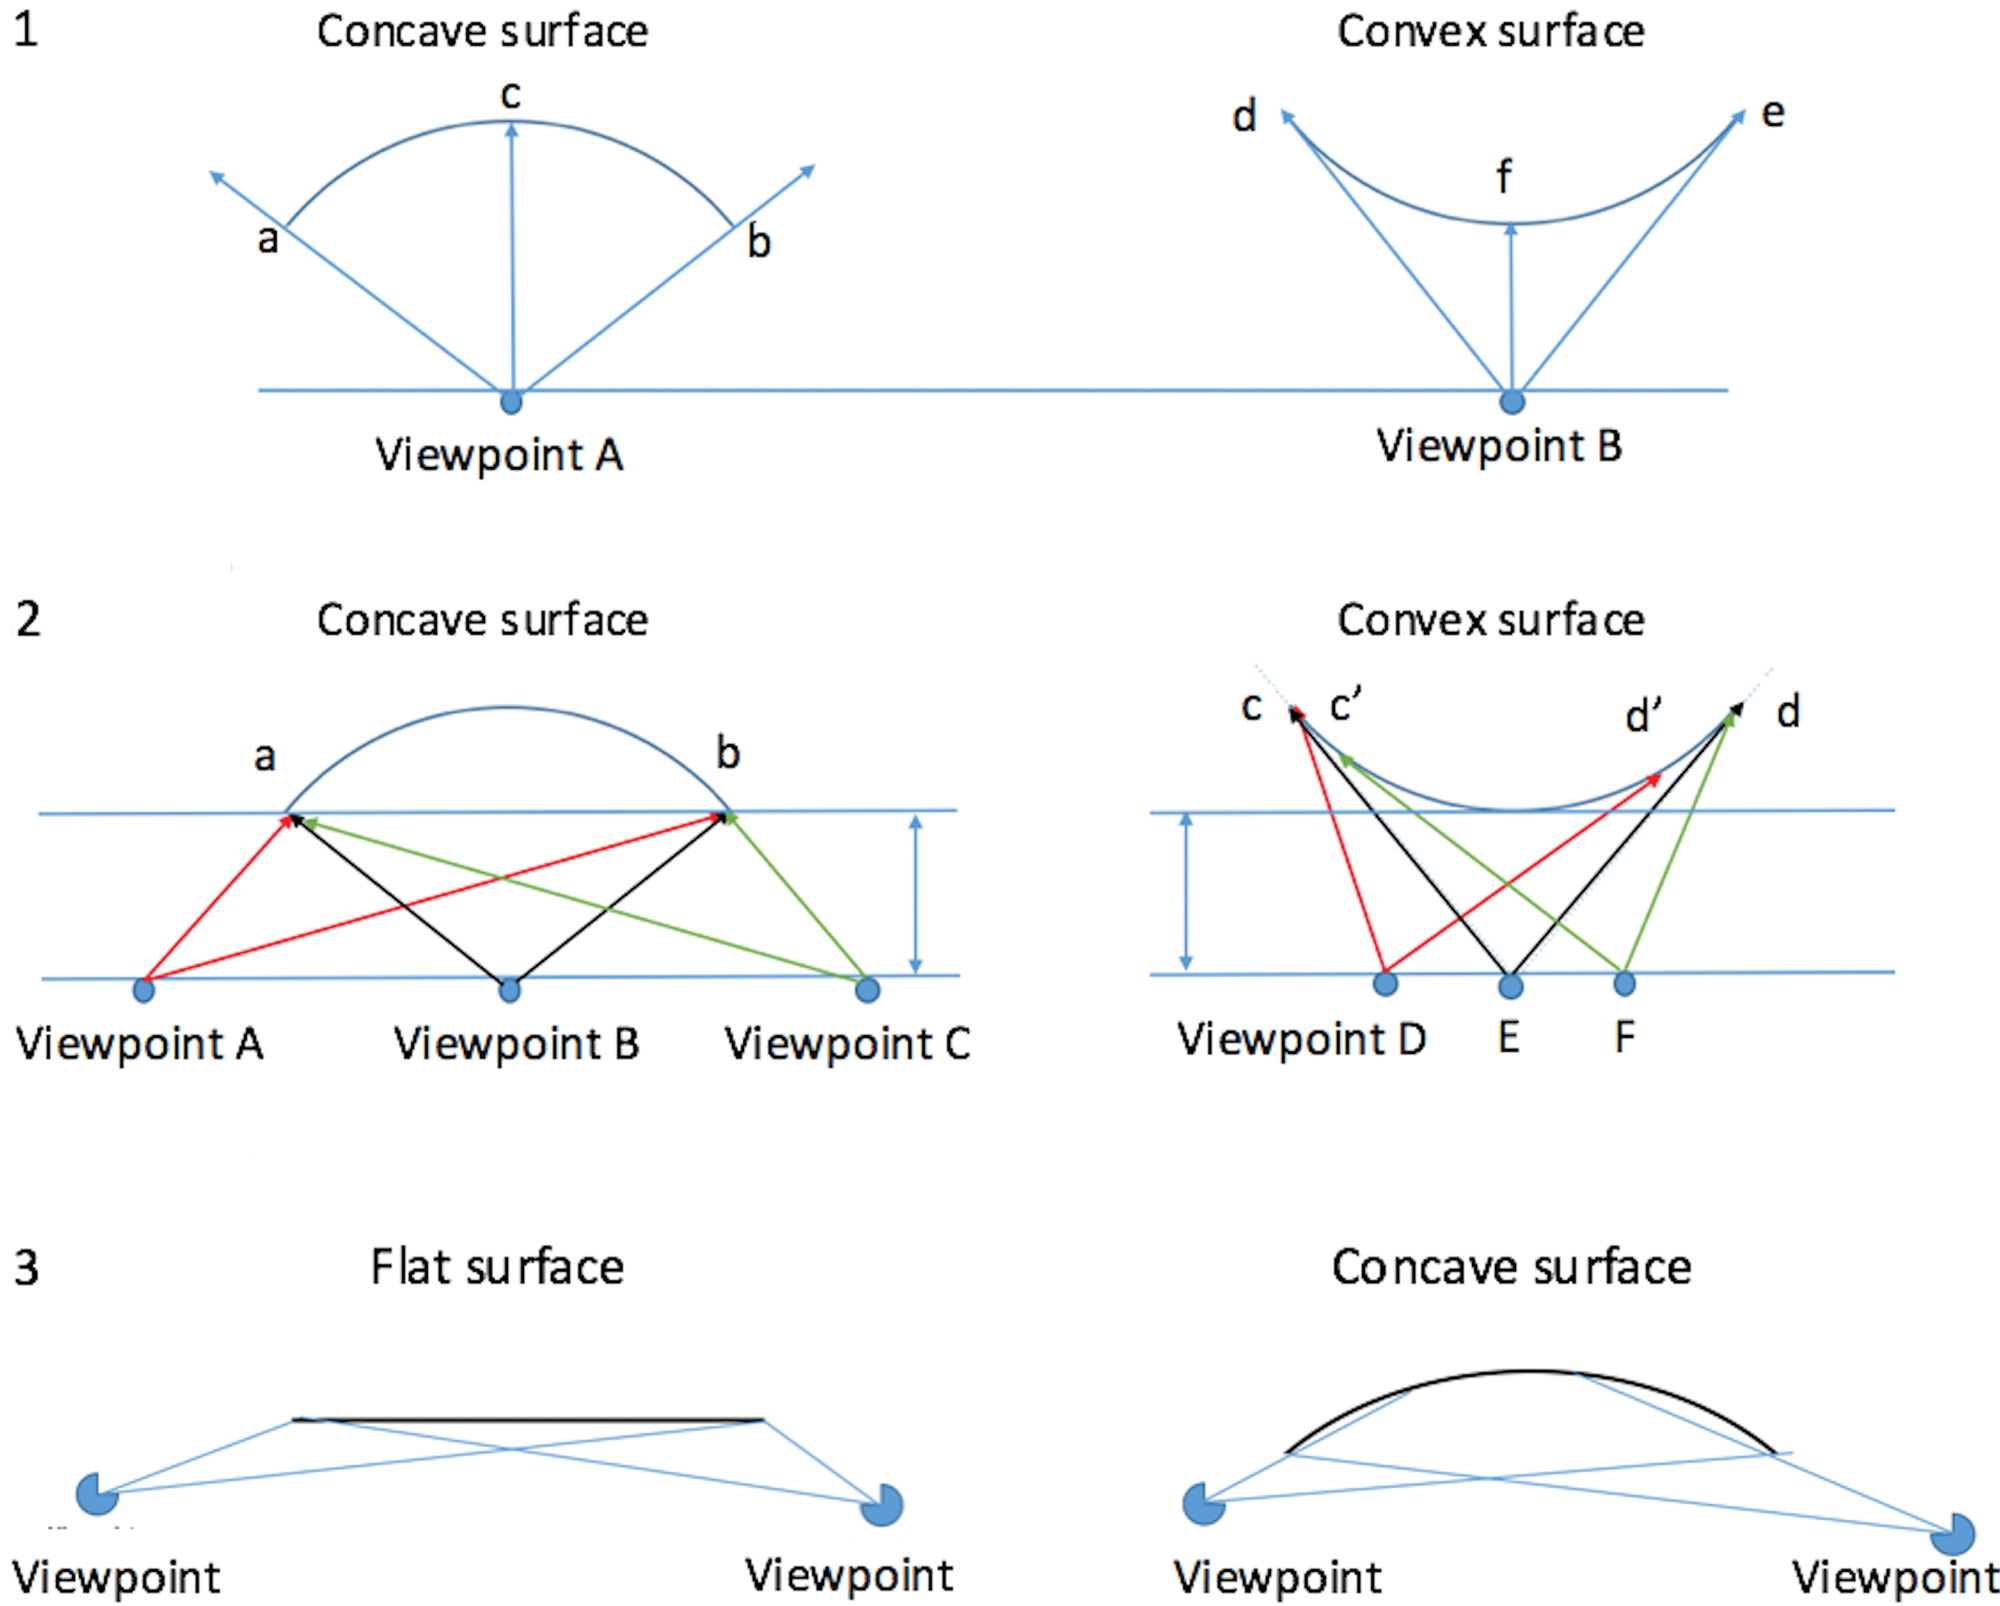
But by elaborating further on this specific use of topography, we can recognize its further uses. As for the dominant use of the overall concavity, the bottom (i.e. lowest part) of the concavity is relatively flat compared to its outer edges or ‘rims’. This feature is actually advantageous for viewing the images. When a viewer sees an image on a flat surface from a frontal viewpoint, the image is inevitably distorted to both sides, albeit often in limited extent. The imbalance in the distance between a viewpoint at the image's centre and at its edges results in the centre appearing to be relatively larger than its sides (Ahn et al. Reference Ahn, Jin, Kwon and Yun2014: see Fig. 10). By contrast, when viewers stand in front of an image on a moderately concave surface, the imbalance is corrected. Consequently, the image will appear less distorted to a viewer in frontal position (Ahn et al. Reference Ahn, Jin, Kwon and Yun2014). This correction is particularly beneficial in a cave's dark environment, where image resolution may be difficult enough already. The light sources available for cave exploration in the Upper Palaeolithic were limited to hearths, torches and stone lamps (de Beaune Reference de Beaune, Lejeune and Welté2004; Pettitt Reference Pettitt, Dowd and Hensey2016; Pettitt et al. Reference Pettitt, Sakamoto, Lelushko, Papadopoulos and Moyes2017). The visibility obtained by such sources would have been limited to within a range of 4 m diameter (Pastoors & Weniger Reference Pastoors and Weniger2011), that is, 2 m radius. In such a profoundly dark environment, viewers must necessarily view images at very close range in order to capture them in clear vision and to resolve their identity. With a flat surface, the closer the viewing-distance the more noticeable the distortion caused will be, as the inequality in the distance between the three points (viewpoint, image edges and centre) grows larger than when it is viewed from a distance. Depicting images on concave surfaces is, therefore, a simple way to mitigate distortion in the dark environments which exaggerate these effects.
The merit of using overall concave surfaces. Viewers experience less distorted images, as concavities equalize the imbalance in the distance between a viewpoint at the image's centre and its edges.
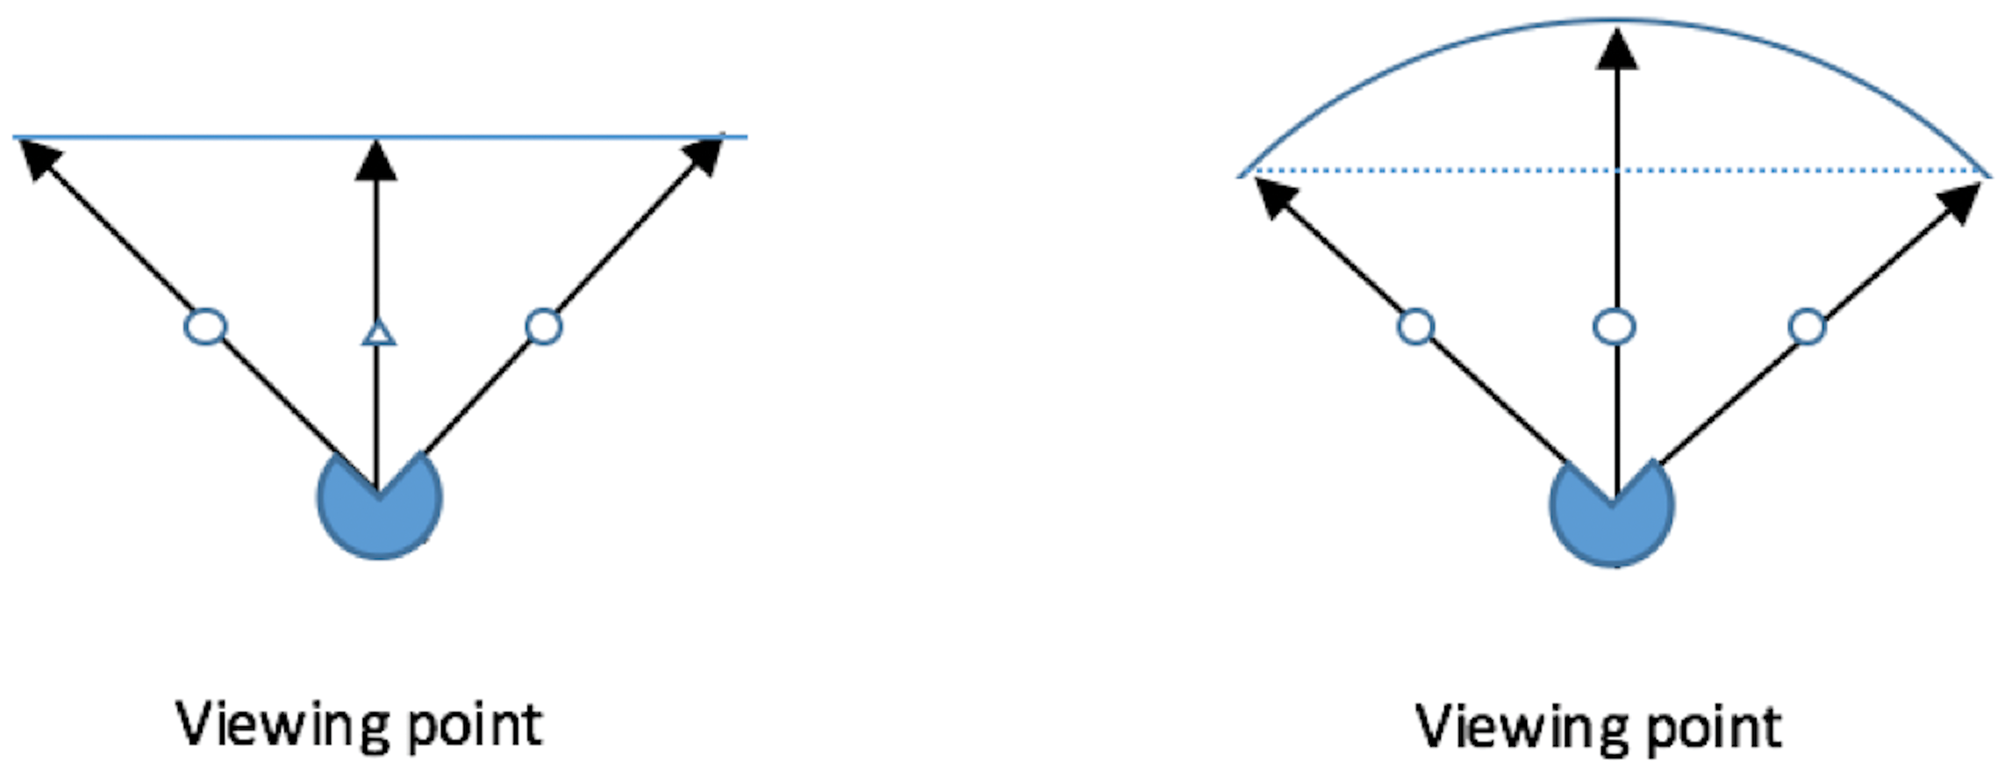
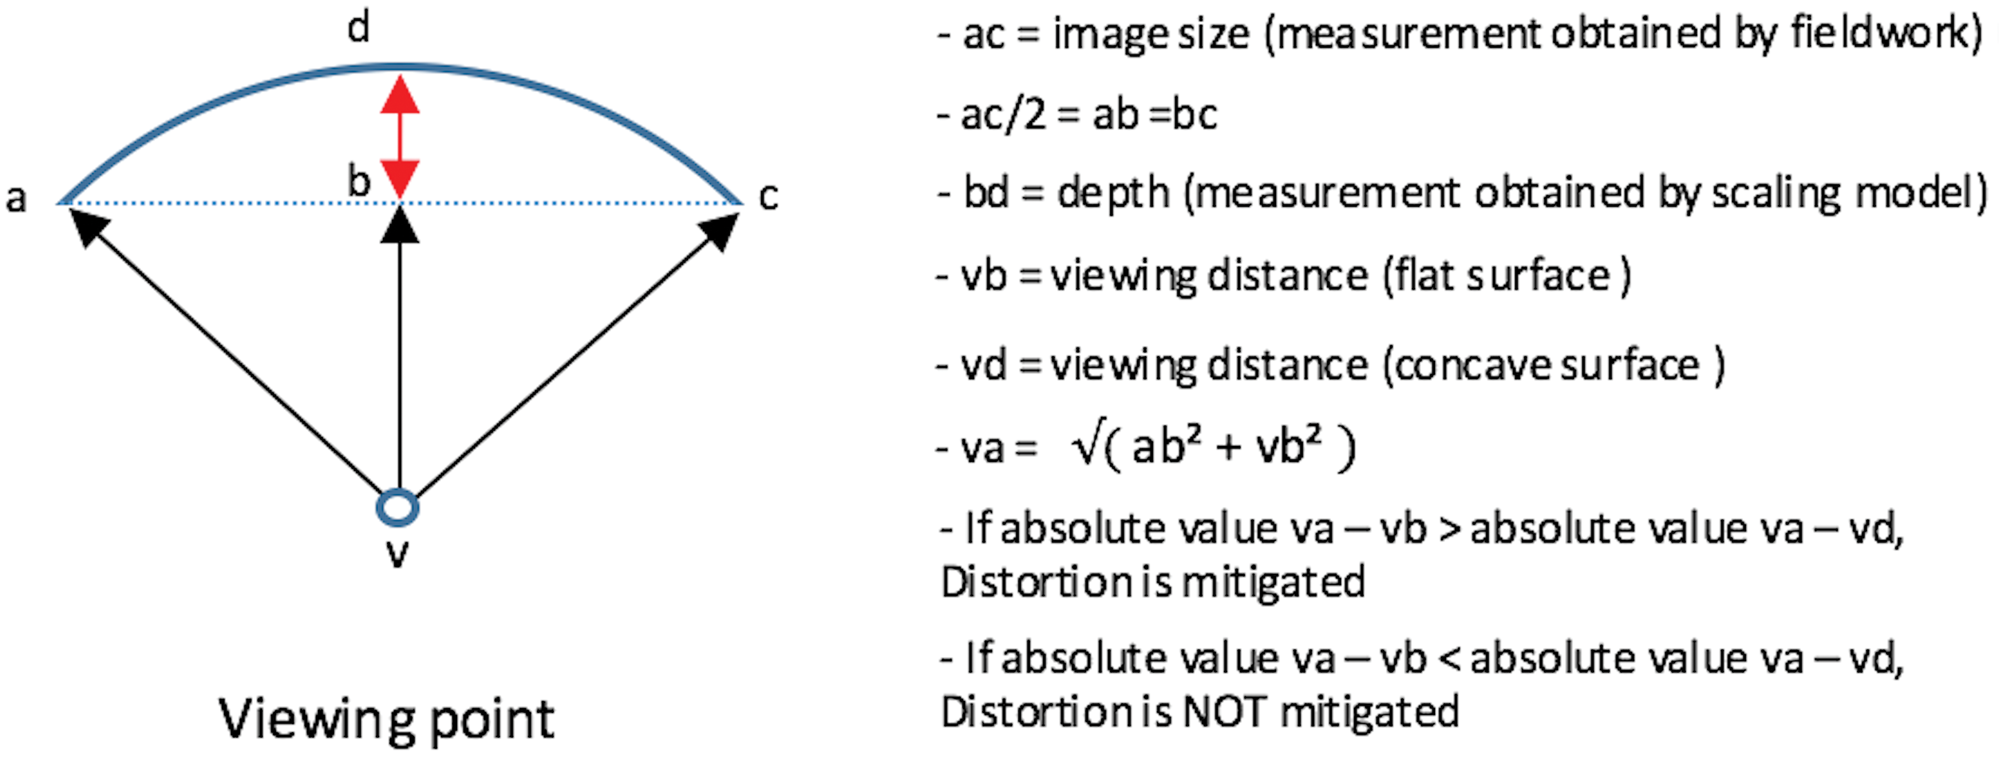
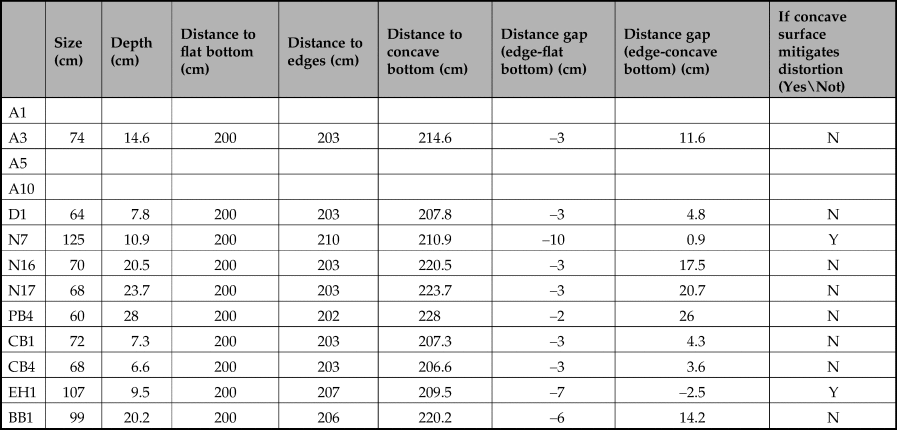
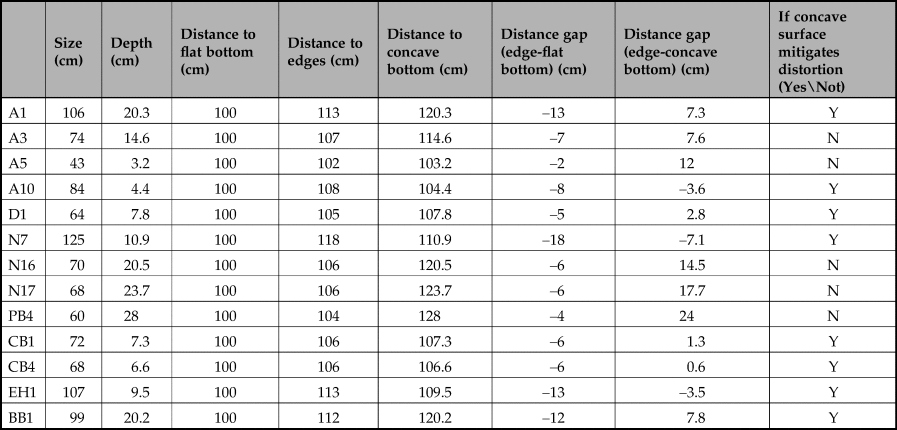
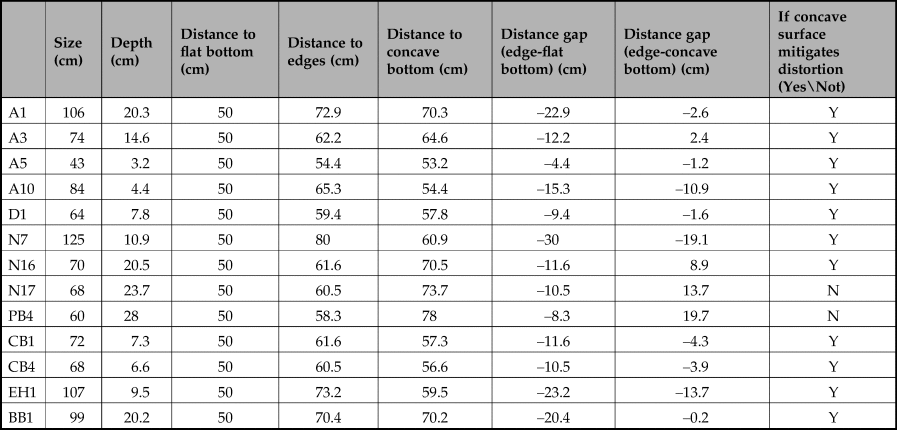
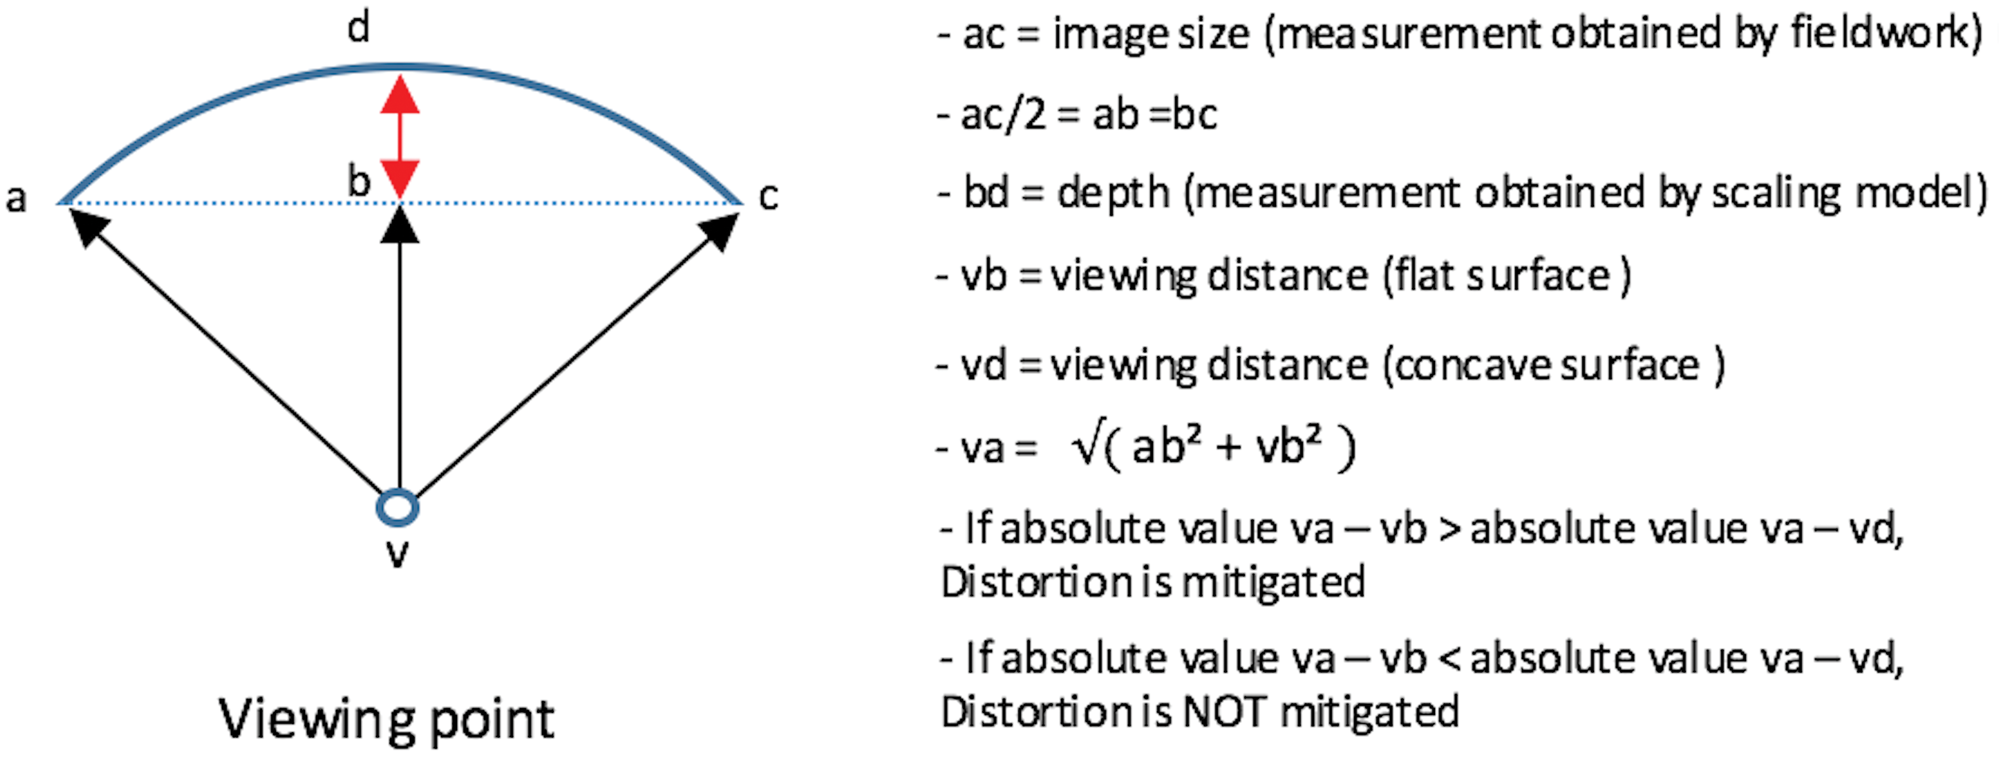
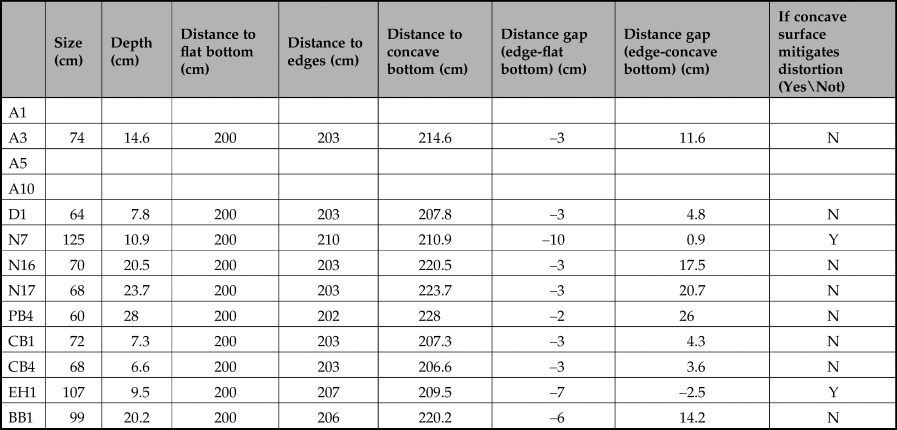
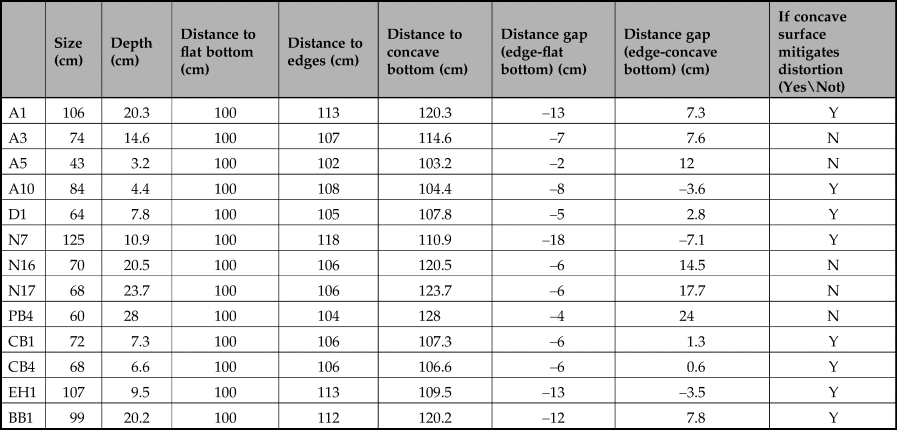
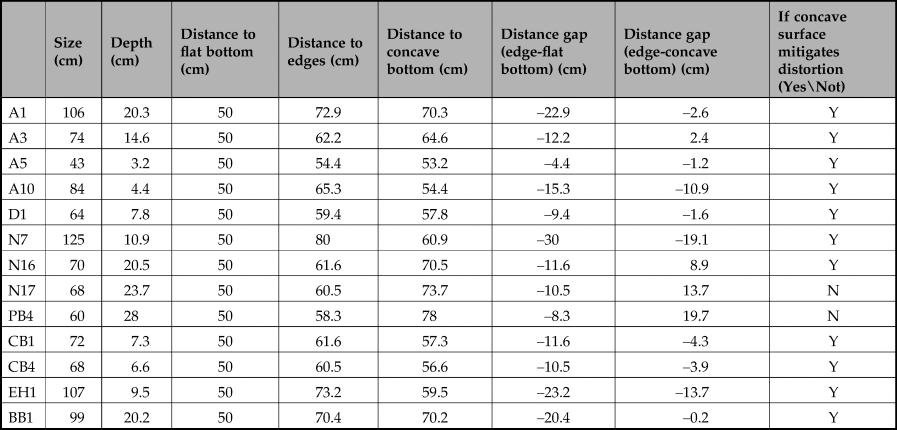
To confirm whether or not this benefit is applicable to our 13 images identified as being of P1 type, we set viewing points at three different distances from the frontal viewing position (200 cm, 100 cm and 50 cm), considering images as being on a flat surface. We also calculated the distance from the viewer to each edge, based on the length of the image and the resulting viewing distances. Thirdly, we modified the viewing distance for each scale to account for concavity. Finally, we compared the gaps in distance between viewpoint–edge and viewpoint–centre (flat) and between viewpoint–edge and viewpoint–centre (concave). If the gap is closer to 0, the distance is reduced, and distortion is correspondingly mitigated. If the additional viewing length created by adding the depth of concavity to the viewing length results in a closer match between the viewing length to centre and edge, we can conclude that the concavity is assisting image recognition by reducing distortion (see Fig. 11). Tables 3–5 show the results. When the viewing distance is set at 200 cm, distortion is mitigated on only two images (N7 and EH1: see Table 3); however, distortion is mitigated on a further six images (A1, A10, D1, CB1, CB4, and BB1) if the viewing position is set at 100 cm (Table 4); distortion is also mitigated on A3, A5, and N16 when their viewing position is set at 50 cm (Table 5). Thus, 11 images benefit from the distortion-mitigating effects of concavity within the viewing range of 200–50 cm. An active (i.e. mobile) viewer, therefore, could self-mitigate the effects of distortion by simply changing their perspective on each image.
Principal elements illustrating whether or not distortion on 13 images (P1) are to be mitigated. We set viewing points at three different distances from the frontal viewing position (200 cm, 100 cm and 50 cm).
Whether or not the concave surface mitigates the distortion when viewers see images from the distance of 200 cm. Only N7 and EH1 appear less distorted in this setting (A1, A5 and A10 are eliminated because the minimum viewing distance for them is around 1m due to environmental restriction).
When viewers see images from the distance of 100 cm. In addition to N7 and EH1, six images (A1, A10, D1, CB1, CB4 and BB1) become less distorted.
When viewers see images from the distance of 50 cm. Distortion is also eased on A3, A5, and N16. Thus, a total of 11 images is subjected to the benefit of using overall concave within the viewing range of 200–50 cm. Accordingly, viewers can see images without distortion as they adjust the viewing distance within this range.
The significance of this benefit can be highlighted by comparing the case of the overall convexity. Figure 12.1 illustrates a difference in a viewer's experience between viewing an image on both an overall concavity and overall convexity at the same distance; the size of the two topographies is assumed to be the same. Unlike the concavity which equalizes the distance of viewpoint–centre (A-c) and that of viewpoint–edges (A-a and A-b), the overall convexity exaggerates the inequality in the distance between viewpoint–centre (B-f) and viewpoint–edge (B-d and B-e) because the centre of the topography is located closer to the viewer. In the case of the convex wall, the image appears noticeably distorted as the central area is perceived to be disproportionally large. Concavities and convexities may also function to define (restrict or enlarge) the range of the image that is immediately visible. Figure 12.2 shows the concave and convex surface and their viewing range where viewers can see an image in its entirety (i.e. lacking any unseen areas); both the viewing distance and the size of the topographies are same. With a convex surface, however, as soon as the viewer moves to the left (to Viewpoint D), the right edge of the image (d) becomes hidden by convex surface (d’), and therefore the viewer fails to see the entire image. Similarly, from Viewpoint F, the left edge of the image (c) is not visible because of the masking topography of (c’). A viewer can see a whole image within a concavity without topographic overlap from a wider viewing-range as no topographic features obstacle the viewer's sight. In short: in order to be able to view a figure in its entirety on a concavity, viewers can select from a broader range of viewpoints, whereas viewers of images on convexities have to remain in approximately frontal view in order to do so. That said, images on a convex wall always appear more deformed than those on concave surfaces. We suggest that these simple factors explain the dominance of concavities and rarity of convexities as surfaces for image making in our sample caves. Concave walls were preferably selected over convexities and flat surfaces as they provided viewers with wider choices of positioning and consequently clearer image resolution.
(1) Viewing an image on an overall concavity (left) and an overall convexity (right) from the same distance. Viewers perceive an image as more distorted on the convexity as the imbalance in viewing distance between viewpoint, centre and edges is disproportionally large. (2) Comparison of the viewing range which allows viewers to see an image in its entirety between a concave (left) and convex surface (right). On concavities, viewers can select a broader range of viewpoints from which to view the complete image, whereas viewers of images on convexities have to remain in approximately frontal view to do so without distortion. (3) Another merit of using concavities. Elevating edges are more likely to face viewers when images are viewed from the sides, while flat surfaces generate an acute angle between the surface and a viewer. The use of the overall concavity may have functioned to reduce the chance that images went unnoticed as the viewer passed by.

In addition, we do not claim only an ‘audience-oriented’ explanation here. The use of the concave-shaped medium is also advantageous for two reasons. First, artists must have been the prime audience if images were intended to be viewed. The clearer image resolution is important for artists during their production as it would allow them to grasp better what they are depicting. Secondly, the concave surface offers the artist an easier working environment; for example, an artist standing in close proximity to a large concavity should experience more of a sense of being ‘surrounded’ by the wall while depicting an image within/around it. In such a case, the artist's movement should be more limited than with working on overall convexities, because they can only rotate their body along the curve of the wall in order to reach the concavity's sides. At the same time, we must admit the limits of our interpretation: it does not seem to work for those images created in hidden areas. We assume that this is because such examples of ‘private art’ were not meant to be viewed (Bahn Reference Bahn, Pastoors and Weniger2003; Reference Bahn and Insoll2011) and were, therefore, produced for different purpose.
Additionally, a wide viewing range will potentially allow the accommodation of multiple viewers. If images on an overall concavity are more likely to be viewed in their entirety from different angles, multiple viewers simultaneously standing in different positions may perceive the same image in effectively the same shape. To put this another way, the condition provides multiple viewers with improved shared vision. Whether or not the creation of cave art was a more significant act than its subsequent viewing has been one of the most debated issues in its study (see Bahn Reference Bahn, Pastoors and Weniger2003 and Reference Bahn and Insoll2011). It has been argued that some caves’ interiors were modified specifically in order to obtain a better visibility of their images (e.g. Candamo & Cougnac caves: Bahn Reference Bahn and Insoll2011, 351), whereas a number of images have been assumed to have been ‘private’ due to their hidden nature and the difficulty of access to their locations (e.g. extremely narrow corridors in Fronsac and La Pasiega; high shafts in Bernifal; isolated chambers in Le Combarelles: Bahn Reference Bahn and Insoll2011, 351). In El Castillo, El Pendo and Covalanas, however, the frequent use of concavities and their demonstrable mitigating effects on image resolution suggests that in these caves the art was meant to be viewed, and possibly that the viewing involved more than one viewer at any one time.
We would not expect to have found this patterning if the simple act of creation of an image was the most or only important element. Nor would we expect the systematic use of raised areas of cave walls for specific anatomical elements if the nature of the ‘canvas’ was unimportant. But why was this aide to resolution necessary? We suggest that it heightened the noticeability of images in the cave environment and by so doing reduced the risk that viewers passed by images without being aware of their existence. Since the surface of P1 type elevates from the centre to both sides, the elevated edges are more likely to face viewers when these images are viewed either from the left or right (Fig. 12.3). Therefore, viewers passing by these images at oblique angles may notice images more easily on walls of this type. This bilateralism is lost, or images appear more distorted, on walls that are flatter or convex, and in such cases viewers are more likely to miss the images.
Distortion of images
In order to interpret our observations, we will compare them with the actions of real animals. As quadrupedal mammals move, their head, neck and legs are the most moving/dynamic body parts, and the movement of the torso less conspicuous. Quadrupeds regularly swing their head and neck either vertically or horizontally as they move, eat and survey their surroundings, and when they locomote their legs appear to be continuously in motion. The movement of the main body (shoulder, mid-torso, thigh) is relatively static, unless they are taking a significant action such as kicking or looking backwards, each of which involves the contraction of the thigh and the mid-torso. Our results, therefore seem compatible with what one might expect in the real, animated animal. A process of deformation can additionally be perceived on the real animal as viewers move to within a certain range, with some animals appearing to shake their head and neck (as with A1, B4, N4, N17, etc.) or to stretch and shrink their neck (as with B5, N5, N7, N14, etc.). The orientation of legs can change noticeably, as again in many images (e.g. A9, B5, N4, CB1, BB1). We suggest that our results, therefore, further support the hypothesis that animation was a fundamental characteristic of at least mid and late Upper Palaeolithic imagery both in caves (Azéma Reference Azéma2008; Azéma & Rivère Reference Azéma and Rivère2012) and open-air settings (Luís & Fernandes Reference Luís and Fernandes2010).
While it seems sensible to confirm the plurality of viewpoints in our examples, the issue of deformation must be considered further. The examples of anamorphic images reported from both French and Spanish caves show that the principles of anamorphosis were widely shared at least across the Franco-Cantabrian region. This principle requires a mutual agreement between artists and viewers about the natural (i.e. ‘proper’) proportion of animals and how these are affected by viewing position. As Groenen (Reference Groenen2000, 104) noted, anamorphosis should ‘allow us to find the ideal position for an observer’. The ‘ideal position’ is, in fact, crucial: if such an ‘ideal position’ was shared as a ‘community of gazes’ (Geneste et al. Reference Geneste, Hordé, Tanet and Dagen2004, 74), the opposite notion, namely a ‘non-ideal position’ must also have been recognized. Hence, establishing an ideal viewing position would require the establishment of a certain set of proportions for the image of concern. Ideal views are, therefore, established on the basis of an interaction of proportion and viewing position, and confirming the use of the concept in the Palaeolithic is dependent on demonstrating both.
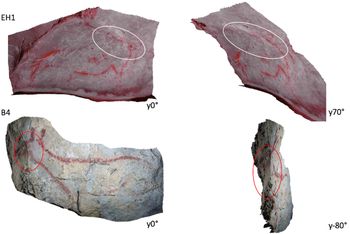
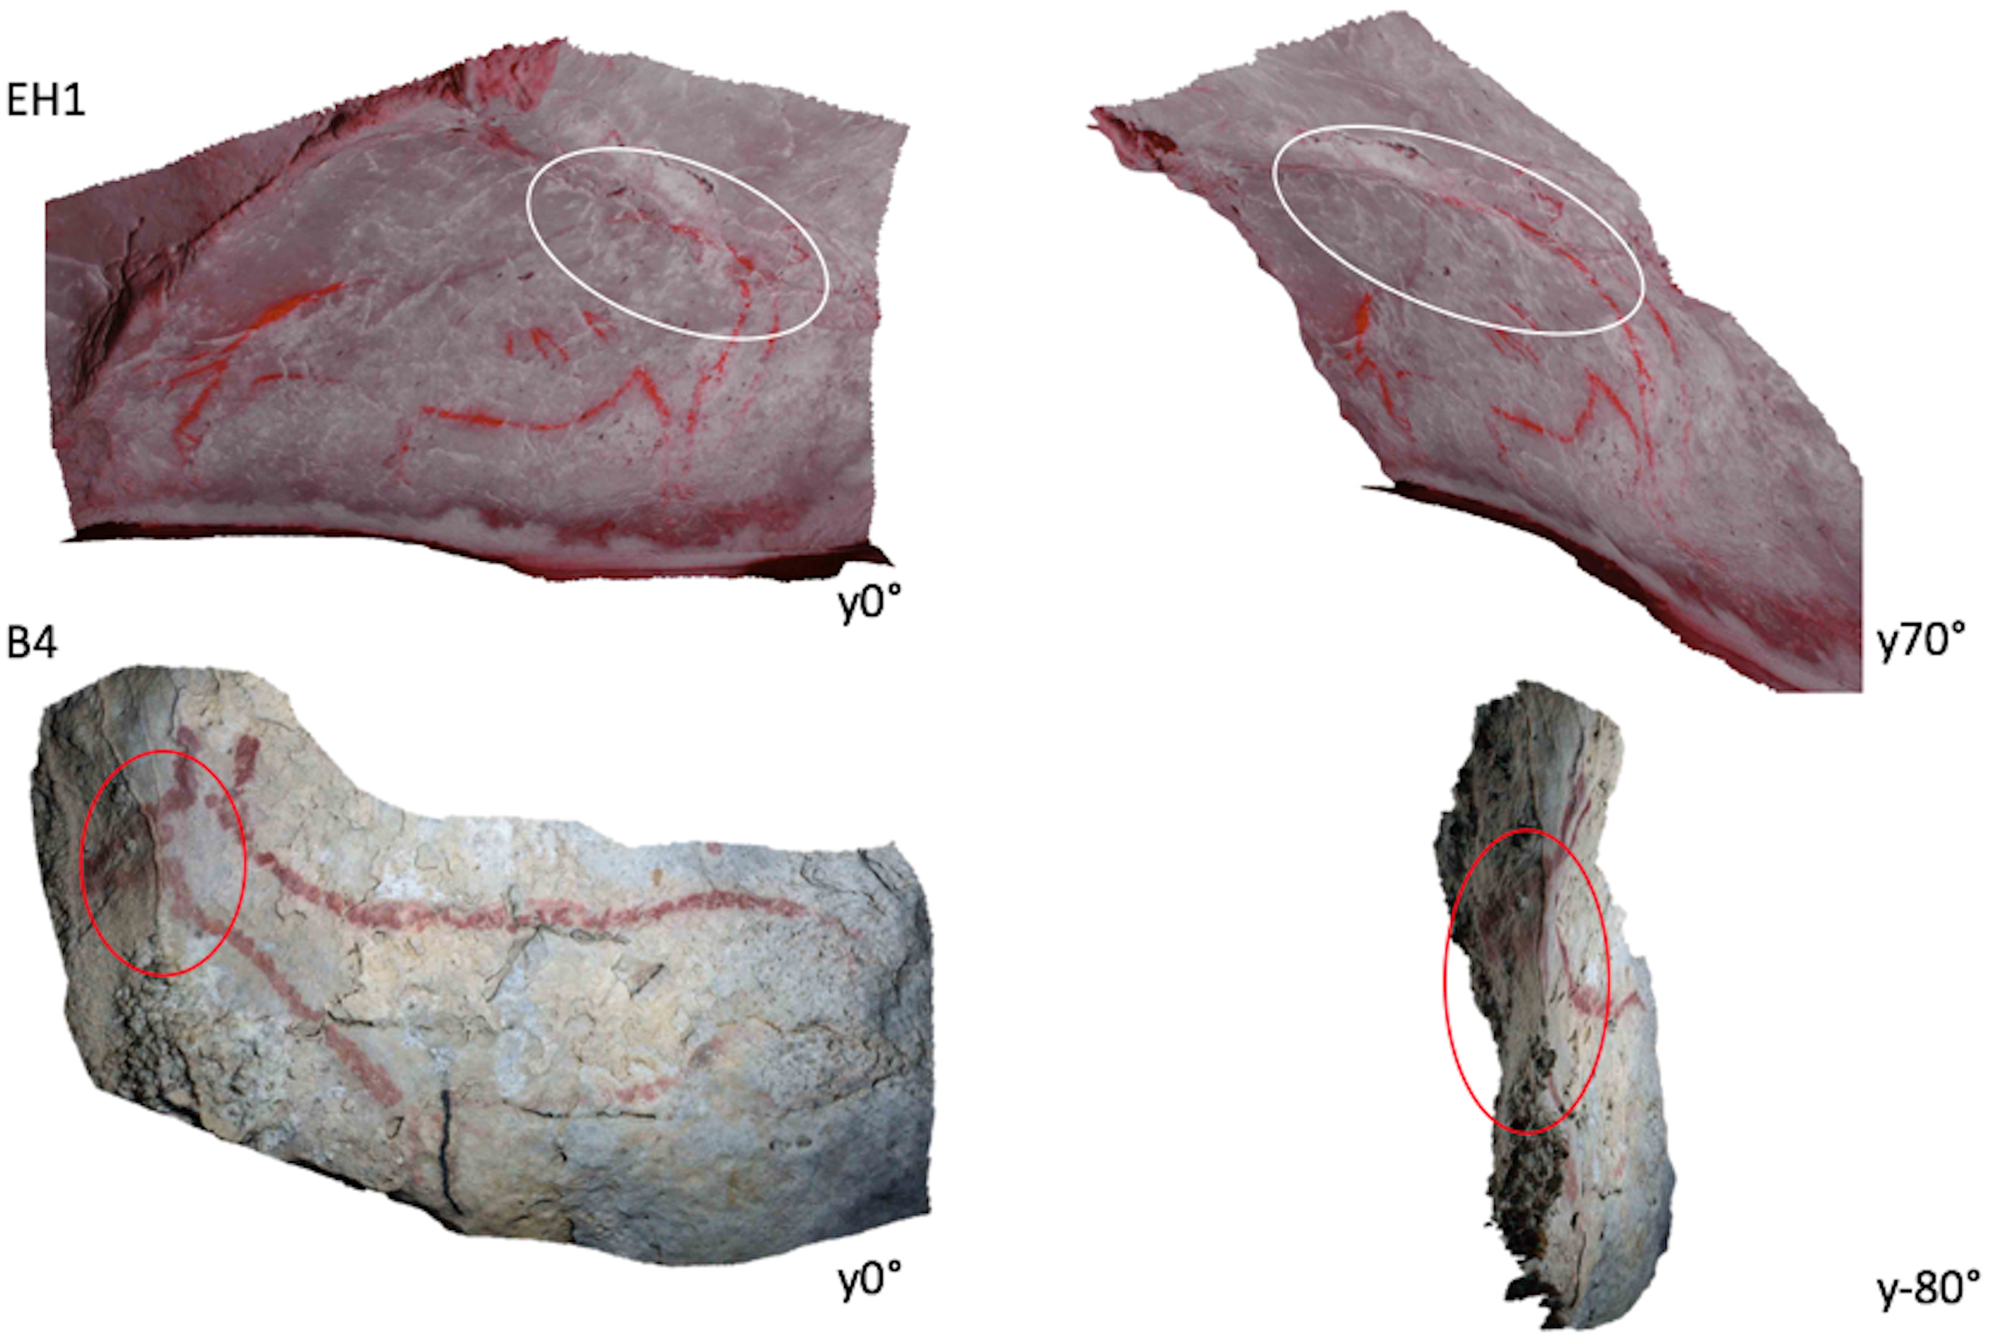
We believe that we can demonstrate the plurality of viewpoints here. B4 (Covalanas), EH1 and BB1 (El Castillo) are images where natural lines have been unusually integrated into their outline. Despite their normal proportions when viewed from the frontal position, natural lines which exist around or on the images become part of their outline once the viewpoint moves to one side (Fig. 13). With B4 and EH1, in both cases ridges are located on a particular position (B4 = face; EH1 = rump) at places where they could actually present an obstacle for viewing; their positioning could have been better and hence the artists could have avoided this possible issue if they had created them to view only from a frontal perspective. These lines perfectly overlap on the animals’ outlines when seen from a specific position, and it therefore seems reasonable to presume that these compositions were deliberately positioned in this way. A cervid in Covalanas—not examined here due to inaccessibility—also represents a plurality of viewpoint: it is located in a narrow area behind the panel for B1 and B4–5, visible only when a viewer looks up from the main passage (Pizzato Reference Pizzato2013).
Examples of unusual integration (EH1 and B4). Despite their normal proportions when viewed from the frontal position, natural lines which exist around or on the images become part of their outline once the viewpoint moves to one side.
With all of our examples, the animal's proper proportions are only resolved when the image is viewed from a frontal perspective. The degree of distortion will increase as the viewpoint moves from side to side; in this sense, the ‘ideal viewpoint’ for all images is located to their front. Viewers were, of course, not always introduced to the images from frontal view; in most cases the navigation through these caves would entail encountering them from side view. In Covalanas, for example, images are fixed on both walls of a narrow passage; all of its images will, therefore, be viewed from their edge except for B4 and A3 which are located at the corner of a bending path. Viewers navigating their way through this cave would, therefore, first encounter an image in its distorted state; its appearance resolving into ‘proper’ shape only as the viewer proceeds. Finally, as they continue past, the image will once again distort. This deformation process will be repeated for each image except for B4 and A3; distorted encounter–resolution–distorted separation. The same applies at El Pendo, where all of the analysed images are located on an 8 m wide panel. Although recent studies suggest that lighting systems (multiple spots for fixed lamps) could illuminate the entirety of this large panel at one time (see Medina Alcaide et al. Reference Medina-Alcaide, Cristo, Romero, Sanchidrián and Clottes2012; Reference Medina-Alcaide, Cabalín, Laserna, Sanchidrián, Torres, Intxaurbe and Romero2019), whether or not Palaeolithic people employed such a lighting system to view ‘the frieze’ in El Pendo is unknown. If it was not the case for El Pendo, in order to ‘read’ such a wide visual space with limited illumination, viewers must have moved along the wall from one end to the other to view its images in succession. With regard to El Castillo, viewing starts from a direct position more often than in our other caves, due to the spatially diverse conditions in this cave. In its Polychrome Panel, located at a corner of the cave wall on the north side of Room A, perception begins directly in frontal view of its images, hence without distortion. CB3 and EH1 also present a frontal view first, as they were positioned to face viewers who were moving towards the interior of the cave. In some cases, however, viewers could begin to resolve images as soon as they saw their edges. BB1 and BB2 are located on a side wall in a passage connecting rooms B and C, and when first encountered they are perceived from the left side of their body. The same is true for GM1: viewers who proceed into the Gallery of Discs will begin to resolve GM1 from its edge. Hence, as for images in particular spatial conditions, viewing must start from the side of the images. In such cases, Palaeolithic viewers must have experienced these images in deformed state.
Thus, Upper Palaeolithic viewers must have been aware of the plurality of viewpoints and concomitant distortion of images. It is, therefore, difficult to maintain the view that they were unaware of the deforming process in the head, neck and legs. This forms the premise of our hypothesis of viewing interaction, and hence, installation. Remember that the issue is whether or not the nature of distortion is intentionally embedded in the viewer–art relationship, and the selection of specific topographic conditions suggests the intention of Palaeolithic artists/viewers.
We noted above that legs were far more likely to be located at extra-elevation levels than other body parts; 18 images (33 per cent) contain the limbs either on extra-low or extra-high walls, much higher than other elements. Four images additionally place the thighs on extra-elevation levels, and three place the head on the highly concave/convex surface. Extra-elevations are not used for the neck-shoulder and mid-torso, by contrast. We can understand this correlation of limbs and extra-elevations once deliberate distortion is taken into account, simply as placing a body part on a remarkably convex/concave surface is the ideal way to cause a distortion. Limbs are the narrowest outlined area of the animal, and are therefore the element on which viewers are most likely to perceive a distortion. Once such a narrow limb is depicted on a highly undulating topography, the degree of distortion on it will become far more conspicuous. We can see this in N14, N16, B5, PB4, CB1 and BB1, where the elevational gap (i.e. profundity) considerably changes the apparent direction of the legs. As viewers move from side to side while viewing these images, the legs of the animals appear to be constantly bending forwards and backwards. Given the distortable nature of the leg, and such high levels of distortion, the high rate of correspondence between the legs and extra-elevation levels must, we suggest, reflect the specific intention of the artists.
Conclusions
We believe that our results add further strength to hypotheses that Palaeolithic artists deliberately placed images in certain places and on particular topographies for a number of reasons relating to the context of the use of the cave and its art; and that the movement, positioning and vision of those participants who were intended to view the art were as important as the physical art itself (for studies suggesting a participative/interactive nature of cave art, see e.g. Azéma & Rivère Reference Azéma and Rivère2012; Criado Boado & Penedo Romero Reference Criado Boado and Penedo Romero1993; Hodgson & Pettitt Reference Hodgson and Pettitt2018; Sakamoto Reference Sakamoto2014). We believe that these interactions, demonstrated through the principles of volume and distortion, reflect the principles of installation art in the contemporary world, and hence that at least the examples we have selected from three Cantabrian caves can be regarded as elements in a wider, multi-sensory installation art. In caves, explorers are constantly stimulated with multisensorial elements, coming under strong psychological encouragement to interact with the environment. As a result, they become embodied in the cave environment, and viewers of the art, therefore, stop being simply passive receivers of visual information and instead transform into active participants. Such active participation is the core of the theory of cave-installation art. By focusing on the action–reaction relationship between humans and their environmental context, we have explored the background topographic conditions of Upper Palaeolithic images and the manner and effects of distortion on them and we propose here that they formed formal ways of creating an active, animated art that required attention and interaction from the integrated viewer or participant in whatever activities they formed part of.
We analysed 54 animal depictions in the caves of Covalanas, El Pendo and El Castillo. Our analysis of 3D photogrammetric models of these resulted in a significant degree of consistency between them in most aspects of our resulting observations. This consistency suggests that specific regulations regarding both production and post-production phases of cave art were in existence here and at this time, reflecting shared notions between humans in the Upper Palaeolithic and therefore in terms of their intentionality. The use of cave wall for image-making was, therefore, not randomly practised; instead, the artists must, at least to a degree, have followed rules aimed at optimizing the production/effect and resolvability of cave art. Our main conclusions are as follows.
Topography and images
We detect six types of basic topography; overall concavity, overall slope, overall convexity, zigzag, partial concavity and partial slope. The most common of these is overall concavity (n = 13, 29 per cent), followed by partial concavity (10, 22 per cent). Concavities are the most common wall morphologies integrated with art; convexities were clearly not preferred (5, 11 per cent). This result is universally seen among the three caves. Moreover, there is a clear relationship between cave topography and specific parts of images: elevation levels for heads and thighs tend to be higher than those for neck-shoulder and middle sections. (The sum of the elevation point = heads 144; neck-shoulder 127; mid-torso 121; thighs 145).
As an explanation for the selective use of concave media, we suggest that they a) maximize the visibility/resolution of images in a dark space, as one elevated edge will constantly face viewers encountering the image from the side; b) offer an ideal viewing experience to viewers standing directly in front of the image, by mitigating distortion; c) allow viewers to select viewpoints from a broader range, and d) potentially accommodate multiple viewers. The compatibility of all four factors may be responsible for the predominant selection of overall concave backgrounds for image making.
Additionally, topography was used to add 3D volume to images. Clearly convex surfaces were occasionally used for the shoulders and thighs. In such cases, the artists probably aimed to express the volume of the muscles. Such figures achieve better realism and appear more ‘sculptural’ than 2D images.
Distortion of images
Remarkable distortions were identified in over half of the images examined (n = 33; 69 per cent). The frequency was exceptionally high in El Pendo (91 per cent) and Covalanas (61 per cent), where entire images were located on a single panel or panels in an adjacent area. Distortion processes appear to have been used as a form of animation by viewers, and this animation was perceptively conspicuous. We do not claim, however, that all images are interactive; we do find a number of images without any detectable distortion. In such cases, these images perhaps functioned ‘only’ as visual information, or functioned otherwise in an unknown way.
The most frequently deformed body parts are the head (25 per cent), neck (23 per cent) and limbs (21 per cent); by contrast, the thigh (17 per cent) and mid-torso (14 per cent) are mainly static. Sections where distortion occurs, however, differ slightly according to the anatomical characteristics of the depicted animals. Those with a distinguishable neck (e.g. cervids) are more likely to be deformed at their neck than those without a clear distinction between head and neck (e.g. bison). Given this, the narrower the outlined part of the image is, the more distortion is noticeable. This principle explains the unique topographic condition of the legs: the body section is most likely allocated to extra-elevation levels (extra high, extra low) because this allocation effectively causes distortion to legs and therefore enhances viewing-interaction. These most distortable areas (head, neck and limbs) correspond to those parts of real animals that are most often in motion. Based on this correspondence, at least among the three caves we have studied, we may hypothesize that Palaeolithic artists deliberately embedded distortions into images, so that when viewers moved around, these static images could be transformed into moving figures as if they were alive.
Needless to say, there are many elements of the cave-art repertoire that remain to be studied. In order to enrich and develop the installational aspects of cave art with further objective detail, we must also look into the relationship between humans and other multisensory properties; the effect of light on interaction, for example, and its impact on both image making and image viewing. We will need to develop specific methodologies in order to approach these points, as well as criteria for their assessment in an empirical way. By so doing, these will lead us to a more comprehensive understanding of the interactive, multisensorial and site-specific nature of cave art. Obviously one cannot generalize from the three case-studies discussed here that these are universal phenomena. How chronologically and geographically variable are they, for example? We have to admit that there is still a very long way to go. We hope, though, that this study has taken a step forward to understanding the interactive nature of cave art.
Acknowledgements
This paper is based on the doctoral research of T. Sakamoto, under the primary supervision of P. Pettitt and with the collaboration of R. Ontañon-Peredo. Mark White is thanked for his secondary supervision of the thesis. We are grateful to Alistair Pike and Peter Rowley-Conwy for acting as examiners for the thesis, and for their helpful suggestions towards its final form. We are also grateful for the kind help of Raúl Gutiérrez Rodríguez and Marcos García-Diez for supporting the fieldwork on which this is based. TS was financially supported by a Durham University Postgraduate Publication Bursary and by the Gilchrist Educational Trust. We are grateful to two anonymous referees for helping to improve the draft, and particularly for their close engagement with it.