1. Introduction
It is well established that speech sounds produced by non-native speakers deviate from those produced by native speakers in different respects such as phonemic, intonation, and semantic levels (Flege, Reference Flege1995), resulting in lower-than-native intelligibility. Speech intelligibility of non-native speakers depends on many factors, including speaker factors, e.g., native language (L1), age of the second language (L2) acquisition, and age of arrival in the L2-speaking country, and listening conditions, e.g., quiet and noisy backgrounds. In quiet listening conditions, non-native speakers with high proficiency were able to produce L2 speech sounds with high intelligibility comparable to native speakers, although foreign accents were detectable (Rogers, Dalby & Nishi, 2004). On the other hand, in adverse listening conditions, non-native speech communication became less effective (Mayo, Florentine & Buus, 1997; Nábélék & Donahue, 1984). Non-native speakers’ speech intelligibility was significantly more degraded than native speakers’ under noise conditions (Munro, Reference Munro1998; Rogers et al., Reference Rogers, Dalby and Nishi2004; van Wijingaarden, 2001; Wilson & Spaulding, Reference Wilson and Spaulding2010). The aim of this study was therefore to investigate the degradation of American English vowel intelligibility in speech-shaped (SS) noise for Chinese and Korean native speakers.
Munro (Reference Munro1998) examined the intelligibility of English sentences produced by English and Chinese native speakers in quiet and multi-talker babble with a signal-to-noise ratio (SNR) at 8 dB. Expectedly, the Chinese speakers whose foreign accents ranged from moderate to strong showed lower intelligibility than native speakers in quiet and noise. Moreover, the reduction in sentence intelligibility in noise compared to that in quiet was 9% greater for non-native speakers than for native speakers. Van Wijingaarden (2001) reported that intelligibility of Dutch vowels, consonants, and sentences was lower for non-native speakers in SS noise than for native speakers, especially when SNR was negative. Rogers et al. (Reference Rogers, Dalby and Nishi2004) found that Chinese-accented speakers with high English proficiency showed similar intelligibility of phonetically-balanced sentences in quiet compared to native speakers (only a 7% difference). However, the difference in speech intelligibility between native and non-native speakers with high proficiency became greater as speech was presented in more adverse listening conditions (>20% difference). The differential effects of noise on speech intelligibility between native and non-native speakers may be due to the fact that non-native speakers had difficulty in producing all the phonetic and prosodic cues of L2 speech, which might be critical to the redundancy and robustness of L2 speech sounds (Rogers et al., Reference Rogers, Dalby and Nishi2004). Wilson and Spaulding (Reference Wilson and Spaulding2010) reported that the English speech comprehension accuracy of Korean native speakers with high intelligibility dropped more from quiet to noisy listening conditions (i.e., 5 dB SNR) than that of English native speakers. Speech sounds produced by non-native speakers were not only less intelligible, but also took a longer time to be processed by native listeners in any listening condition (Munro & Derwing, Reference Munro and Derwing1995; Wilson & Spaulding, Reference Wilson and Spaulding2010). This might indicate that more effortful processing was required for foreign-accented speech, resulting in lower comprehension and less processing efficiency than that for native speech in quiet and noisy conditions.
Although English sentence intelligibility of non-native speakers has been measured by previous studies (Munro, Reference Munro1998; Rogers et al., Reference Rogers, Dalby and Nishi2004), English vowel intelligibility of non-native speakers in noise has not been documented. Jin, Liu and Kamdar (2009) found that vowel intelligibility in quiet for Chinese and Korean native speakers varied broadly from 40% to above 90%, suggesting non-native speakers’ difficulty in vowel production. As a follow-up, the present study investigated how noise affected vowel intelligibility of native and non-native speakers.
Psychometric functions of vowel intelligibility in SS noise for a native speaker were examined by O'Brien, Woodall and Liu (2009). To equalize vowel audibility in noise, they presented vowels at the sensation level, i.e., the level above the lowest level of vowels that were audible. Results showed that the overall intelligibility of American English vowels produced by a young female English native speaker increased at a rate of 5–11% per dB across vowel categories with the vowel sensation level in SS noise. Given that acoustic cues of American English vowels of non-native speakers significantly differed from those of native speakers (Chen, Robb, Gilbert & Lerman, 2001; Jin et al., Reference Jin, Liu and Kamdar2009), it is expected that some parameters of psychometric functions, such as slopes, are different between native and non-native speakers. In addition, the psychometric functions may be also dependent on English proficiency level for non-native speakers (Rogers et al., Reference Rogers, Dalby and Nishi2004). Thus, the present study investigated the effects of noise on vowel intelligibility for non-native speakers whose English intelligibility in quiet significantly differed. It is hypothesized that the degree of noise effects on vowel intelligibility and speech processing time varies, depending on language background as well as the L2 intelligibility of non-native speakers.
2. Vowel inventory
Although researchers have conflicting opinions with regard to the Mandarin Chinese vowel inventory, the vowel system generally includes six monophthongs (Duanmu, 2008), /i, y, u, ə, ˠ, a/. Among the twelve American English vowels (/i, ɪ, e, ɛ, æ, ʌ,  , ɑ, ɔ, o, u, ʊ/) in the present study, /i, u/ have phonetically similar peers in Mandarin and /i, e, , ɑ, o/ show allophonic variants of Mandarin phonemes, while there are neither phonetic counterparts nor allophonic variants of Mandarin vowels for the other five English vowels, /ɛ, æ, ʌ, ɔ, ʊ/. It should be noted that the phonetic comparisons across the languages are for monophthongs in this study, while some English monophthongs like /ɛ/ have an allophonic variant in Mandarin diphthongs like /iɛ/. The Korean language has ten vowels, /i, e, ɛ, y, ø, ʌ, ɑ, o, ɨ, u/. Among the twelve English vowels, the vowels /i, e, ɛ, ʌ, ɑ, o, u/ have phonetically similar counterparts in Korean, while the other five do not (Yang, Reference Yang1996).
3. Method
3.1 Speakers
As in our earlier study of vowel intelligibility in quiet conditions (Jin et al., Reference Jin, Liu and Kamdar2009), 96 speakers were divided into seven groups: English-native, Chinese-native with low (<70%; CL), medium (70–80%; CM), and high (≥80%; CH) vowel intelligibility, and Korean-native with low (<70%; KL), medium (70–80%; KM), and high (≥80%; KH) vowel intelligibility. Vowel intelligibility was measured as scores (in percentage) of vowel sounds that were accurately identified, for example, the intelligibility score of the vowel /æ/ at 96.8% for the CL speakers indicated that the /æ/ vowel produced by the CL speakers were accurately perceived at 96.8%. In the present study, two speakers, one male and one female, were chosen from each of the five groups: EN, CL, CH, KL, and KH. The non-native speakers acquired their formal school-based English education in their home countries (China or Korea) at the age of 11–12 years and their US residency was less than five years. All speakers were between 20 to 30 years old and had normal hearing sensitivity with pure-tone thresholds ≤ 15 dB HL (ANSI, 2004) at octave intervals between 250 Hz and 8000 Hz. They also reported normal speech functions.
3.2 Stimuli
Twelve American English vowels /i, ɪ, e, ɛ, æ, ʌ, , ɑ, ɔ, o, u, ʊ/ were used as speech stimuli. Vowel stimuli were recorded in the syllable context of /hVd/ produced by the five groups of speakers. Selection of the /hVd/ context was to facilitate the comparison with previous studies of American English vowels (Chen et al., Reference Chen, Robb, Gilbert and Lerman2001; Hillenbrand, Getty, Clark & Weeler, 1995), although the /hVd/ context does not exist in Mandarin Chinese and Korean. Only vowels in isolation with an equalized duration of 170 ms were selected for intelligibility measures in the present study. These vowels in isolation were edited by removing the onset and offset formant transitions of the syllable with the central vowel nucleus remaining. Vowels were presented in quiet as well as in SS noise with sensation levels from 0 to 10 dB based on the individual listener's vowel detection thresholds for each vowel. These detection thresholds were measured by Liu and Jin (Reference Liu and Jin2011). The selection of the sensation levels instead of the SNRs was to equalize the audibility across all the twelve vowels.
3.3 Noise
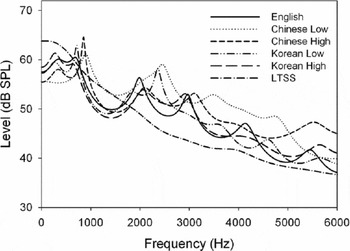
Speech-shaped noise, used as the masker, has been known as an effective masking noise for speech due to its similarity to the spectra of speech signals. The SS noise, presented at 70 dB SPL, was generated from Gaussian noise that was shaped by a filter with an average spectrum of 12-talker babble (Kalikow, Stevens & Elliot, 1977). Figure 1 shows the linear predictive coding (LPC) spectra of the SS noise and the /ɛ/ vowels at 70 dB SPL, produced by the female speakers in the native and non-native groups.
Linear predictive coding (LPC) spectra of the vowel /ɛ/ produced by the five female speakers and SS noise at 70 dB SPL using 16 LPC coefficients with the sampling frequency at 12,207 Hz.

3.4 Listeners
Seven native listeners of American English between the ages of 20 and 28 years participated in vowel intelligibility measures. Listeners were undergraduate and graduate students at The University of Texas at Austin and were from Texas. They had normal hearing sensitivity corresponding to pure-tone thresholds ≤15 dB HL (ANSI, 2004) at octave intervals between 250 Hz and 8000 Hz. They were paid for their participation.
3.5 Stimulus generation
Digital stimuli sampled at 12,207 Hz were presented via ER-2 insert earphones to the right ears of listeners, who were seated in a sound-treated IAC booth. Signal and noise presentation was controlled by TDT (Tucker–Davis Technologies) modules, including a 16-bit real-time processor, a signal mixer, and a headphone buffer. Vowel sounds were presented temporally in the middle of the 400 ms SS noise. Vowel stimuli and SS noise had 10 ms rise-fall ramps. The sound-pressures level of speech and noise were calibrated in the NBS-9A 2-c3 coupler by a Larson–Davis sound-level meter (Model 2800) with the linear weighting band. The software Sykofizx® was used to manipulate the procedure.
3.6 Procedures
For the vowel intelligibility experiment, vowel sounds were presented in quiet and in SS noise at a 0–10 dB sensation level (SL) based on the detection thresholds measured before this study (Liu & Jin, Reference Liu and Jin2011; see their Figure 3) with a step size of 2 dB for each listener. For example, given the detection threshold of the vowel /æ/ for the female EN speaker was 56.3 dB SPL, the sensation level of 2 dB indicated that the vowel /æ/ of the female EN speaker was presented at 58.3 dB SPL (56.3+2 dB SPL). After each vowel-plus-noise presentation, the listener's task was to indicate which vowel was heard by pressing one of twelve labeled buttons through a response interface on a computer monitor. Before data collection began, listeners were trained with a 15-minute session of vowel identification in a quiet listening condition to familiarize them with the experimental procedure using a female English native speaker who was not included in the five groups of speakers above. Feedback was provided to indicate the correct response in each trial during the training session while no feedback was provided during the test sessions.
Under each condition (a given speaker and a given SL), vowel intelligibility was measured in one block of 240 trials, in which twelve vowels were presented 20 times each in a random order. Thus, for each listener, vowel intelligibility in percent correctness was based on these 20 judgments for each vowel at each sensation level. In addition to vowel intelligibility, the processing time of the vowel intelligibility measure was also measured as the latency of the listener's response following the vowel presentation for each trial in Sykofizx®. For a given vowel at a given SL for a given speaker, the processing time was based on the average of the 20 repetitions. Short breaks were provided between blocks and all test conditions in vowel intelligibility were completed in ten sessions with each session lasting about 1.5–2 hours. The presentation order of the ten selected speakers and the order of the SLs were randomized. Within a given block (condition), however, the speaker and SL were fixed.
A sigmoidal model was used to fit the psychometric function of vowel identification for each vowel using the following formula:
 \[
{\rm Percent \ correct } = {\rm y}_0 + {\rm a }/{\rm }(1 + \exp {\rm }( - ({\rm SL } - {\rm x}_0)/b)),
\]
4. Results
4.1 Vowel intelligibility in quiet
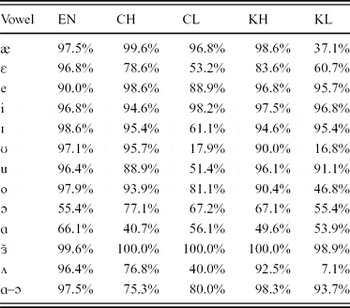
Average vowel intelligibility over the twelve vowel categories in the quiet condition for each speaker group is shown in Table 1. For statistical purposes, the raw intelligibility scores were transformed to the rationalized arcsine units (RAU; Studebaker, Reference Studebaker1985). A three-factor (speaker group × gender × vowel category) repeated-measures analysis of variance (ANOVA) with the RAUs as the dependent variable suggested that vowel intelligibility was significantly affected by speaker group (F(4,24) = 47.844, p < .05) and vowel category (F(11,66) = 12.758, p < .05), but not by speaker gender (F(1,6) = 0.323, p = .590). All of the two-way and three-way interaction effects of the three factors were significant (all ps < .05). To examine the main effect of speaker language group for each vowel, a two-way repeated-measures ANOVA (speaker group × gender) was conducted for each vowel. Results showed that there were significant effects of the speaker group for the seven vowels /ɪ, ɛ, æ, ʌ, o, u, ʊ/, but not for the other five vowels /i, e, , ɑ, ɔ/. Post-hoc Tukey tests showed that for each of the seven vowels with significant effects of speaker group, the vowel intelligibility of the EN speakers did not significantly differ from the CH and KH speakers, but was significantly greater than the CL and/or KL speakers. In addition, there were no significant differences in intelligibility between Korean and Chinese speakers with the same intelligibility group (p > .05).
Vowel intelligibility in quiet for each of the five language groups: English-native (EN), Chinese-native with high intelligibility (CH) and low intelligibility (CL), and Korean-native with high intelligibility (KH) and low intelligibility (KL).

Another three-factor (speaker group × gender × vowel category) repeated-measures ANOVA with the processing time as the dependent variable indicated that the processing time was significantly affected by speaker group (F(4,24) = 3.196, p < .05) and vowel category (F(6,60) = 11.731, p < .05), but not by speaker gender (F(1,6) = 0.756, p > .05). All of the two-way and three-way interaction effects were significant (all ps < .05), except the interactions of speaker gender and speaker group or vowel category (both ps > .05). Post-hoc Tukey tests suggested that the processing time for the EN and CH speakers was significantly shorter than the CL and KL speakers (all ps < .05).
4.2 Vowel intelligibility in noise
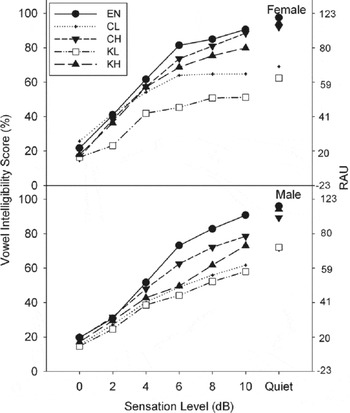
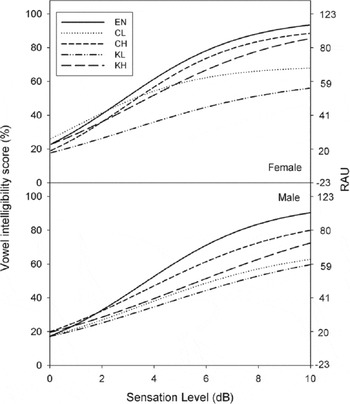
Figure 2 illustrates average vowel intelligibility over the twelve vowels and the seven listeners as a function of SLs for the ten speakers (upper panel: female speakers; lower panel: male speakers). Vowel intelligibility expectedly increased with SL for each speaker; however, given the same SL, vowel intelligibility differed markedly across speaker groups. For example, at 6 dB SL, the average vowel intelligibility was 75.4% for the EN female speaker, but only 42.8% and 62.5% for the KL and KH female speakers, and only 61.1% and 70.3% for the CL and CH female speakers. A four-factor (speaker group × gender × vowel category × SL) repeated-measures ANOVA with the RAUs as the dependent variable suggested that vowel intelligibility was significantly affected by speaker group (F(4,24) = 6.269, p < .05), speaker gender (F(1,6) = 6.394, p < .05), vowel category (F(11,66) = 8.845, p < .05), and SL (F(5,30) = 34.369, p < .05). In addition, all of the two-way, three-way, and four-way interaction effects of these four factors were significant (all ps < .05) except for the two-factor interaction of speaker group and gender, and the three-factor interaction of speaker group, gender, and SL (both ps > .05).
Vowel intelligibility (percent correct on the left and RAU on the right) in SS noise as a function of SLs for female (upper) and male (lower) speakers. Vowel intelligibility in quiet is plotted at the right side of the figure.

To investigate the main effects of speaker group on vowel intelligibility in noise, three-factor (speaker group × speaker gender × vowel) repeated-measures ANOVAs were conducted on each SL from 0 to 10 dB. Overall, there was a significant effect of speaker group on vowel intelligibility for all the SL conditions (all ps < .05) except the 0 dB SL condition (F(4,24) = 2.367, p = .081). Specifically, post-hoc Tukey tests showed that the EN speakers did not have significantly higher vowel intelligibility than any group of the non-native speakers for the noisy condition of 2 dB SL (p > .05), but did have significantly higher intelligibility than only the KL speakers for the 4 dB SL condition (p < .05). In addition, the EN speakers showed significantly greater intelligibility than all of the non-native speakers (all ps < .05) except for the CH speakers (p > .05) for the 6, 8, and 10 dB SL conditions. Among the four non-native groups, at the 4 dB SL condition, the CH speakers had significantly higher scores than the KL speakers, while at the 6 dB SL condition, the CH speakers showed significantly higher scores than the other three groups of non-native speakers (all ps < .05). At the 8 dB SL condition, the CH and KH speakers had better intelligibility than their peers in the KL and CL groups (all ps < .05), while at the 10 dB SL condition, the intelligibility scores followed the order with significance (all ps < .05) from the CH, the KH, then the CL to the KL speakers. These results suggested that the effects of SS noise on vowel intelligibility depended on speaker group and SL. Although the Chinese and Korean speakers in the same intelligibility groups (high or low) did not differ from each other in their vowel intelligibility in quiet, the intelligibility of the Korean speakers appeared to be affected more by noise than that of the Chinese speakers, especially under relatively high SL (i.e., 6–10 dB) conditions.
Because non-native speakers showed great variability of vowel intelligibility across vowel categories in quiet (i.e., some vowels were much more intelligible than others), it is important to examine the effects of speaker group on intelligibility of each vowel category. A two-way (speaker group × gender) repeated-measures ANOVA was conducted for each vowel category under each listening condition. Overall, there was no significant effect of speaker group on intelligibility for the vowels /, ɑ, ɔ/ at each listening condition (all ps > .05), possibly due to high intelligibility for // and low intelligibility for /ɑ/ and /ɔ/ across all the speaker groups in the quiet condition. For the other vowels, no significant effects of speaker group were found for most vowels at 0 and 2 dB SLs, while significant effects of speaker group were found for most vowels at 4, 6, 8, and 10 dB SLs and in the quiet condition. These results show that, when acoustic cues of vowel sounds such as vowel formants were available above the masking noise, listeners depended on these cues to identify vowels, resulting in different intelligibility across vowel categories and speakers. However, at barely audible levels in which those cues were not available due to noise masking, vowel intelligibility relied primarily on a guessing strategy.
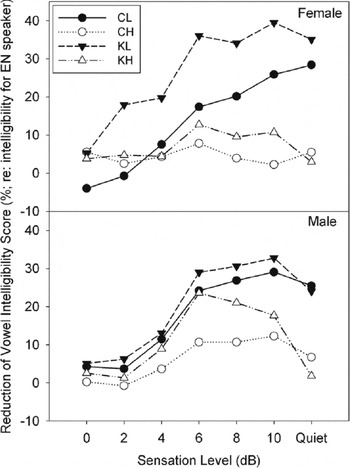
Compared to the native speakers, vowel intelligibility was lower for the non-native speakers in almost all the SL conditions. Moreover, the gap in vowel intelligibility between native and non-native speakers was dependent on the SL. As shown in Figure 3, the gap increased from the quiet to high SL (i.e., 6–10 dB) conditions for five of the eight non-native speakers and dropped to near zero at low SL conditions (0 dB SL).
Reduction of vowel intelligibility for non-native speakers (relative to vowel intelligibility of native speakers) in each listening condition.

Analysis of confusion matrices for each speaker group across the listening conditions showed that vowels were generally confused with their adjacent counterparts in the vowel space (see Figures 6 and 7 below) for native and non-native speakers. A greater number of vowels served as the confusions and a higher percentage of confusions occurred for non-native speakers than native speakers in a given SL. For example, at the 6 dB SL condition, the vowel /ɪ/ was confused with /ɛ/ with 40% by the native female speaker, but was confused with /e/ (32%) and /ɛ/ (18%) by the KL female speaker and with /e/ (36%) and /i/ (17%) by the KH female speaker. More vowels were added to the confusion list for each vowel as the SL decreased. At 0 dB SL, confusion vowels were distributed to a broad range regardless of the speaker's group, implying that listeners may have guessed the vowel identity in this barely audible situation.
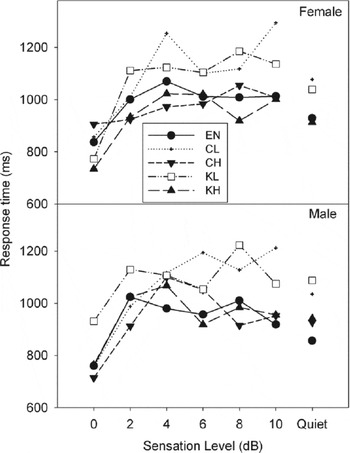
The processing time to identify vowel category in noise was plotted for each speaker group as a function of listening conditions in Figure 4. A four-factor (speaker group × speaker gender × vowel category × sensation level) repeated-measures ANOVA suggested that the processing time of vowel intelligibility was significantly affected by speaker group (F(4,24) = 3.239, p < .05), vowel category (F(11,66) = 9.861, p < .05), and sensation level (F(5,30) = 3.116, p < .05), but not by speaker gender (F(1,6) = 0.438, p > .05). In addition, the two-way interaction effects of speaker group and vowel category, speaker group and sensation level, and vowel category and sensation level were significant, as was the three-way interaction of speaker group, speaker gender, and vowel category (all ps < .05), while the other multiple-way interaction effects were not (all ps > .05).
Response time of vowel intelligibility in quiet and noisy conditions for each speaker (top: female; bottom: male).

To investigate the main effects of speaker group on the processing time for vowel identification in noise, three-factor (speaker group × gender × vowel) repeated-measures ANOVAs were conducted on each SL. A significant effect of speaker group was found only for the SL of 6, 8 and 10 dB (6 dB: F(4,24) = 3.138, p < .05; 8 dB: F(4,24) = 3.271, p < .05; 10 dB: F(4,24) = 4.338, p < .05), but not for the other SL conditions. Post-hoc Tukey tests suggested that at 10 dB SL, the processing time was significantly shorter for the EN, CH, and KH speakers than for the CL and KL speakers, while at 6 and 8 dB SL, the processing time was significantly shorter for EN speakers than for CL and KL speakers (all ps < .05). Moreover, a significant interaction effect of speaker group and vowel category was found for the SL of 6, 8, and 10 dB (all ps < .05). To reveal the main effect of speaker group on the processing time of each vowel, two-way (speaker group × speaker gender) repeated-measures ANOVAs were conducted for each vowel under each listening condition. No significant effect of speaker language group was found for any vowel category at the SL of 0, 2, and 4 dB, while at the SL of 6, 8, and 10 dB, a significant effect of speaker language group was reported for the vowels that had relatively low intelligibility for non-native speakers such as /u/ and /ʌ/. Post-hoc Tukey tests suggested that the processing time to identify these vowels produced by non-native speakers with low intelligibility were significantly longer than the processing time to identify those spoken by native speakers (all ps < .05).
4.3 Psychometric functions of vowel intelligibility
Percent correct of vowel intelligibility was used to compute the sigmoidal model of psychometric functions for each vowel of each speaker for individual listeners. The slope of the dynamic range of the psychometric functions was then computed as the slope between the 30% and 70% data points of the sigmoidal function. When the sigmoidal model did not fit the data, e.g. the /ʌ/ vowel for the KL speakers who had intelligibility relatively flat (below 20%) over all the listening conditions for most of the seven listeners, the slope was assigned at 0 percent/dB. A three-factor (speaker group × gender × vowel category) repeated-measures ANOVA with the slope of the psychometric functions as the dependent variable was conducted. Results suggested that the slope was significantly affected by speaker group (F(4,24) = 6.385, p < .05) and vowel category (F(11,66) = 4.6374, p < .05), but not by speaker gender (F(1,6) = 0.0008, p = .978). All of the two-factor and three-factor interaction effects were significant (all ps < .05) except for the two-factor interaction of speaker group and gender (F(4,24) = 0.995, p = .429). Post-hoc Tukey tests showed that the EN, CH, and KH groups had significantly greater slopes than the CL and KL groups (all ps < .05), whereas there was no significant difference between the Chinese and Korean speakers with the same intelligibility (all ps > .05). As shown in Figure 5, the slope of the dynamic range of the psychometric functions of average vowel intelligibility over the twelve vowel categories was 7% per dB for the EN speakers, 6–7% for the CH and KH speakers, and 4% for the CL and KL speakers.
Fitness functions of vowel intelligibility in SS noise for each speaker (top: female; bottom: male) based on the sigmoidal model.

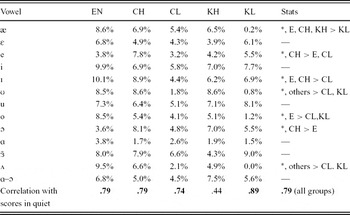
To examine the main effect of speaker group on the slopes of vowel intelligibility function in noise for each vowel category, a two-way (speaker group × speaker gender) repeated-measure ANOVA with the slopes as the dependent variable was conducted for each vowel. As shown in Table 2, there were significant effects of speaker group on the slopes for the seven vowels, /ɪ, e, æ, ʌ, ɔ, o, ʊ/ (all ps < .05), but not for the other five vowels, /i, ɛ, , ɑ, u/ (all ps > .05). No significant effects of speaker gender were found for any of the twelve vowels (all ps > .05). Post-hoc Tukey tests showed that for the seven vowels with significant effects of speaker group, the EN speakers had significantly steeper slopes than the KL and CL speakers for /ɪ, æ, ʌ, o, ʊ/ and shallower slopes than the CH speakers for /e, ɔ/ (all ps < .05). The CH and KH speakers had significantly steeper psychometric functions than their CL and KL peers for these seven vowels except the vowel /o/ (all ps < .05). In addition, significant relationships between intelligibility in quiet and slopes of psychometric functions in SS noise were found for each group of speakers and across all five groups except for the KH group (all ps < .05; see the last row of Table 2), indicating higher vowel intelligibility in quiet, and steeper psychometric functions of vowel intelligibility in noise.
Slopes of vowel intelligibility function (% per dB) in SS noise for each vowel (row) and speaker language group (column). The last column shows results of two-way (speaker group × gender) repeated-measures ANOVAs. The symbol * indicates significant effects of speaker group on slopes followed by results of post-hoc Tukey tests, while the symbol — indicates no significant effect of speaker group. The last row shows the Pearson correlations between vowel intelligibility in quiet (Table 1) and slopes of vowel intelligibility functions in SS noise with the bold numbers indicating significant correlation (p < .05).

EN = English-native; CH = Chinese-native with high intelligibility; CL = Chinese-native with low intelligibility; KH = Korean-native with high intelligibility; KL = Korean-native with low intelligibility
4.4 Effects of the listeners’ dialect on vowel intelligibility
Because all of the listeners were Texans, who typically have difficulty to discriminate the vowels /ɑ/ and /ɔ/, the intelligibility scores for the two vowels in quiet were below 70%, possibly affected by the listeners’ dialect besides the speakers’ intelligibility. Thus, additional data analyses were conducted by combining the intelligibilities of the two vowels into one. Overall, the combined intelligibility became markedly higher in the quiet and noisy conditions, i.e., above 90% for most of the speakers in quiet as shown in the last row of Table 1 above. Two-factor (speaker group × gender) repeated-measure ANOVAs with intelligibility scores of /ɑ–ɔ/ as the dependent variable were run for the SL from 0 to 10 dB, and in the quiet condition, respectively. Results indicated that there were no significant effects of the speaker group for most of the listening conditions. Moreover, the combined /ɑ–ɔ/ was primarily misidentified with /o/ and /ʌ/ at the 4 dB SLs. At lower SLs, the combination was confused with a greater number of vowels. A two-factor (speaker group × gender) ANOVA with the slope of the psychometric function as a dependent variable for the combined /ɑ–ɔ/ suggested that there was no significant effect of speaker group (F(4,24) = 2.138, p > .05).
5. Discussion
5.1 Vowel intelligibility in quiet for native and non-native speakers
As shown in Table 1 above, in quiet, the EN speakers exhibited significantly greater intelligibility (90.7% on average) than the CL (67.6%) and KL (63.0%), but did not significantly differ from the CH (86.7%) and KH (88.1%). Selection of these non-native speakers was based on their vowel intelligibility in quiet (Jin et al., Reference Jin, Liu and Kamdar2009). Out of the five vowels /ɛ, æ, ʌ, ɔ, ʊ/ without phonetic counterparts or allophonic variants of Mandarin vowels, four (/ɛ, ʌ, ɔ, ʊ/), had low intelligibility for the CL speakers (<70%). For the seven remaining vowels with phonetic counterparts or allophonic variants in Mandarin, /e, i, o, / had high intelligibility for both CH and CL speakers. For Korean speakers, out of the five vowels with no phonetic peers in Korean, /æ, ʊ, ɔ/ had low intelligibility, while for the seven English vowels /i, e, ɛ, ʌ, ɑ, o, u/ that have phonetically similar counterparts in Korean, /i, e, u/ showed high intelligibility. These results are partially consistent with the second language learning models such as the perceptual assimilation model (Best, Reference Best1995). However, it should be noted that some English vowels that had no phonetic counterparts in Chinese or Korean received high scores for non-native speakers like /æ/ for Chinese and // for Korean. These results indicated that intelligibility of English vowels for non-native speakers depended not only on whether the vowel has a phonetic peer in L1, but more importantly, on whether a prototype of the English vowel can be built distinctively from other English vowels. The formation of a distinctive L2 prototype is affected by the phonetic system of non-native speakers’ L1.
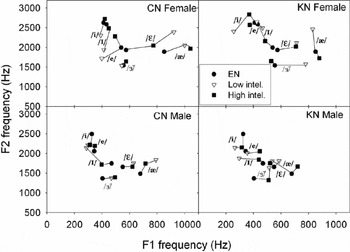
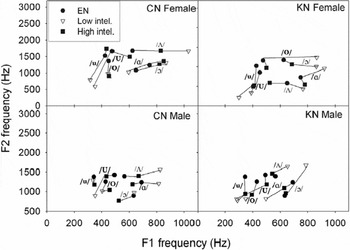
In the case of the vowels /æ, ɛ/ with no phonetic peers in Mandarin monophthongs, however, for the Chinese speakers, the intelligibility rate of the vowel /æ/ was significantly greater than that of the vowel /ɛ/ (see Table 1 above). In addition, the vowel /ɛ/ was markedly confused with /æ/ whereas the vowel /æ/ was not confused with /ɛ/, implying that the prototype of /ɛ/ for Chinese speakers approached the prototype of /æ/. As shown in Figure 6, the vowel /ɛ/ was located close to /æ/ and was distant from /e/ for Chinese speakers (especially the CL speakers), while /ɛ/ was located in the middle between /æ/ and /e/ for EN speakers. These results suggest that when producing /æ/ and /ɛ/, Chinese speakers attempted to produce them so as to be distinguishable from the vowel /e/, which has an allophonic variant in Mandarin monophthongs and which is also close to the two vowels. Such productions of /æ, ɛ/ made them distant from /e/, however, also pushed /ɛ/ toward /æ/, thus resulting in low-to-medium intelligibility for /ɛ/ (i.e., /æ/-like production) and high intelligibility for /æ/. On the other hand, the vowel /æ/ has no phonetic peers in Korean, while /ɛ/ does. When producing them, /ɛ/ appeared to play the prototype role for both vowels, such that /ɛ/ had higher intelligibility scores than /æ/, especially for the KL speakers. Similarly, although the vowel // does not have a phonetic peer in Korean, it is relatively distinctive from other English vowels (see Figure 6), resulting in a high intelligibility for Korean native speakers. Another example is the vowels /u/ and /ʊ/ that were confused with each other among both CL and KL speakers. The English vowel /u/ has a phonetic peer in Mandarin Chinese and Korean, while the vowel /ʊ/ does not. Thus, CL and KL speakers seemed to use /u/ as the prototype for both vowels and produced two vowels ambiguously for identification. As shown in Figure 7, the two vowels were located more closely for the CL and KL speakers than for the CH, KH, and EN speakers.
Central-nucleus F1 and F2 frequencies of the five front vowels and the central vowel /ɜ/ in Hz for each speaker: upper left – CN females, upper right – KN females, lower left – CN male, and lower right – KN males.
Note: The F1 and F2 frequencies of the EN female (the two upper panels) and male (the two lower panels) are plotted twice. The data points representing the F1 and F2 frequency of the same vowel category for the three groups are connected by solid lines.

Central-nucleus F1 and F2 frequencies of the five back vowels and the central vowel /ʌ/ in Hz for each speaker: upper left – CN females, upper right – KN females, lower left – CN male, and lower right – KN males.
Note: The F1 and F2 frequencies of the EN female (the two upper panels) and male (the two lower panels) are plotted twice. The data points representing the F1 and F2 frequency of the same vowel category for the three groups are connected by solid lines.

5.2 Effects of SS noise on vowel intelligibility for native and non-native speakers
As shown in Figure 3 above, at higher SLs (above 4 dB), the difference in vowel intelligibility between non-native and native speakers was greater in noise than that in quiet for most of the non-native speakers, indicating a greater impact of noise on vowel intelligibility of non-native speakers than on that of native speakers. On the other hand, at low SLs such as 0 and 2 dB SL, vowel intelligibility of native and non-native speakers merged to similar values, suggesting that listeners might use a guessing strategy in very difficult listening conditions. The different degrees of noise effects on vowel intelligibility were present not only for the native and non-native speakers, but also for the two groups of non-native speakers. For example, compared to the quiet condition, vowel intelligibility in high SL conditions (such as 10 dB SL) was significantly lower for the Korean speakers, but not for English and Chinese speakers, suggesting that the differences in noise effects might be associated with the speaker's language background.
The slopes of vowel intelligibility in SS noise for the EN, CH, and KH speakers were significantly greater than those for the CL and KL speakers. As shown in Table 2 above, better intelligibility in quiet, steeper slopes of psychometric functions was demonstrated. Because the intelligibility of all the speakers was almost the same at 0 dB SL, better intelligibility in quiet provided a higher ceiling score, resulting in a greater dynamic range and thus a steeper slope. For non-native speakers, the slope of vowel intelligibility was associated with the intelligibility in quiet rather than whether the English vowel was peered with a Chinese or Korean vowel. For instance, for the five English vowels without phonetic peers in Chinese, /ɛ, ʌ, ɔ, ʊ/ with low intelligibility in quiet had shallower slopes than /æ/, which had high intelligibility in quiet. Steeper psychometric functions of vowel intelligibility for Dutch native speakers than Dutch non-native speakers were also reported by van Wijingaarden (2001).
It should also be noted that the findings in the present study were partially consistent with, but somewhat different from, other studies (Munro, Reference Munro1998; Rogers et al., Reference Rogers, Dalby and Nishi2004). Both Munro (Reference Munro1998) and Rogers et al. (Reference Rogers, Dalby and Nishi2004) reported that English sentence intelligibility degraded in noise for non-native speakers more than for native speakers, consistent with the findings of the present study. Moreover, non-native speakers with high proficiency gave steeper slopes of psychometric functions of sentence intelligibility than non-native speakers with low proficiency (Rogers et al., Reference Rogers, Dalby and Nishi2004), also similar to the results of this study. However, their finding that the psychometric functions of sentence intelligibility for native speakers were shallower than for non-native speakers with high proficiency was different from the findings of this study, namely that the two groups of speakers showed similar slopes of psychometric functions of vowel intelligibility. Two possibilities may account for such differences. First, the three SNRs used in Rogers et al.'s study (2004) did not cover a full dynamic range (e.g., no floor performance), while six SLs in the present study provided a relatively comprehensive dynamic range. Second, speech materials were quite different in the two studies. The complexity of sentences used in Rogers et al.'s study (2004) due to their phonetic, semantic, and prosodic cues may make their intelligibility differ markedly from vowel intelligibility in this study.
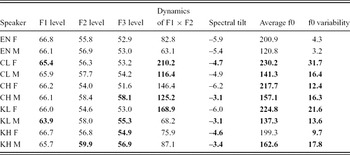
The differential noise effects on speech intelligibility between native and non-native speakers found in the present and previous studies (Munro, Reference Munro1998; Rogers et al., Reference Rogers, Dalby and Nishi2004; van Wijingaarden, 2001) might be due to the differences in acoustic features, cognitive demands, and the listening experience of native listeners when listening to these speakers. First, acoustic differences of vowels produced by native and non-native speakers may account for the different noise effects. Table 3 illustrates several acoustic features of vowels for the native and non-native speakers such as formant amplitude, temporal dynamics of F1 and F2 frequency, peak-to-valley contrasts of formants, spectral tilt, and temporal variability of f0 contours. The temporal dynamic of F1 and F2 was defined as the pattern of formant frequency change that occurred at 20% and 80% of vowel duration (Hillenbrand et al., Reference Hillenbrand, Getty, Clark and Weeler1995). In this study, it was measured by calculating the distance between the point at 20% and 80% of vowel duration in the F1 × F2 space. While spectral tilt was defined as the amplitude difference between F1 and F3 in dB/octave, f0 variability was computed as the standard deviation of the f0 contour over the vowel duration. The non-native speakers showed significantly greater variability of f0 contours and more temporal dynamics of F1 and F2 frequency than their native peers. The temporal dynamics of F1 and F2 frequency have been demonstrated to be critical in vowel perception (e.g., vowel inherent spectral change; Nearey, Reference Nearey1989) such that the greater temporal dynamics for non-native speakers may negatively affect their vowel intelligibility and result in lower vowel intelligibility in noise at 4–10 dB SLs.
Average level of F1, F2 and F3 (dB SPL), dynamics of F1 and F2 frequency (Hz), spectral tilt of vowel spectra (dB/oct), average f0 (Hz), and f0 variability (Hz) over the twelve vowel categories for each speaker. The numbers in bold indicate a significant difference between non-native and native speakers with the same gender (two-tailed t-test, p < .05). The acoustic features were computed based on the LPC spectra of vowel sounds presented at 70 dB SPL. The dynamics of F1 and F2 frequency were computed as the distance in the F1 × F2 space between the 20% and 80% of vowel duration. Spectral tilt was defined as the amplitude difference between F1 and F3 in dB/octave. f0 variability was computed as the standard deviation of the f0 contour over the vowel duration.

EN = English-native; CL = Chinese-native with low intelligibility; CH = Chinese-native with high intelligibility; KL = Korean-native with low intelligibility; KH = Korean-native with high intelligibility; bold indicates a significant difference between the non-native speaker group and the native group of the same gender.
Secondly, processing non-native produced speech may also require more time and higher cognitive demands, especially in noise (Rogers et al., Reference Rogers, Dalby and Nishi2004; Wilson & Spaulding, Reference Wilson and Spaulding2010). Wilson and Spaulding (Reference Wilson and Spaulding2010) indicated that English native listeners needed more processing time to recognize speech produced by Korean native speakers with low intelligibility than to recognize speech produced by native speakers and Korean native speakers with high intelligibility in the conditions of quiet and relatively high SNRs. In other words, the processing of speech sounds produced by non-native speakers, especially those with low intelligibility, required greater time and effort at medium and high SLs in this study. A further possibility to account for the different noise effects between native and non-native speakers may be due to the listeners’ language experience. That is, English native listeners who lack experience listening to non-native speakers are not able to find the best listening strategy in noisy environments, resulting in difficulty understanding non-native speakers. When native listeners were trained in listening to foreign-accented speech, their speech perception for non-native speakers was significantly improved (Bradlow & Bent, Reference Bradlow and Bent2008), indicating the importance of listening experience on speech intelligibility. The speech perception system has a flexible capability to adapt to natural variations, such as changes in dialect or accented speech (Clarke & Garrett, Reference Clarke and Garrett2004). Such adaptation typically alters pre-lexical processing, which is less stable and less robust than lexical processing (Eisner & McQueen, Reference Eisner and McQueen2005; Sebastián-Gallés, Vera-Constan, Larsson, Costa, & Deco, 2009). Based on their results, it can be assumed that when foreign-accented vowels were presented, the native listeners in the present study were likely to rely on pre-lexical processing, which is less robust and more vulnerable in noise, for their judgment on vowel identity.
In summary, the differential noise effects on vowel intelligibility between native and non-native speakers are possibly due to the differences in acoustic features (e.g., temporal variability seen in spectrograms), cognitive processing time and effort, and listeners’ language experience. However, these factors may be associated with each other. Greater processing time and effort needed for perceiving non-native speakers’ speech could be caused by acoustic deviations of their speech from native-producing speech. More research is needed to reveal the relationships among these factors.
5.3 Processing time for identifying vowels of native and non-native speakers
The present study suggested that in the quiet and high SL conditions, greater processing time was required for foreign-accented vowels with low intelligibility compared to vowels produced by native speakers and non-native speakers with high intelligibility. These results were consistent with the previous studies using sentences as speech stimuli (Munro, Reference Munro1998; Munro & Derwing, Reference Munro and Derwing1995; Wilson & Spaulding, Reference Wilson and Spaulding2010). In high SL and quiet conditions, acoustic deviations in foreign-accented speech may be relatively easily perceived by native listeners, which in turn results in longer processing time and greater cognitive efforts. On the other hand, at low SLs, the processing time was quite similar across both native and non-native speaker groups. This may be due to the fact that at low SLs, the SNR was too low for listeners to perceive speech sounds regardless of speaker groups. More research is needed to examine the relationship between the amount of foreign accent which affects acoustic properties of non-native speech and the time needed for processing such stimuli.
5.4 Practical implications
More negative effects of noise interference on vowel intelligibility were found for non-native speakers, even those with high intelligibility, than for native speakers (see Figure 3 above). One reason for this might have been that the native listeners were not able to use the cues of vowel stimuli produced by the non-native speakers in an adverse listening condition as efficiently as they use the cues of vowels generated by the native speakers. Thus, to improve native listeners’ perception of non-native speakers, the presence of noise in a training program may help improve their ability to listen to and perceive foreign-accented speech in noise. The findings in this study indicate that the second language educator and clinicians of accent reduction may need to receive more training in listening in noise background to improve communication with non-native speakers, specifically given that daily human conversations frequently occur in noisy environments.