Introduction
Irrigation is becoming an essential component of farming in many areas of the world. But demands on agricultural water supplies are likely to increase over time as alternative nonfarm uses of water continue to grow. At the same time climate change is expected to reduce the water supplies and consequently the irrigation water availability. If irrigated agriculture is to expand in order to meet growing demands for food, then new irrigation practices and tools must be developed for more efficient water use. Precision irrigation offers this promise (Vellidis et al., Reference Vellidis, Tucker, Perry, Reckford, Butts, Henry, Liakos, Hill and Edwards2013). However water use efficiency is ultimately determined by management. A good management requires collection of accurate data and very quick data analysis.
Precision irrigation and irrigation decision support tools
During the last decade ground water is depleting at an alarming rate in many agriculture areas. Thus, different decision support tools have been developed and applied in the most intensive agriculture areas in the world from the early 90’s. Smith, (Reference Smith1992) described the CropWat which estimates the crop water demands under different irrigation strategies. It utilizes the Penman-Monteith equation to calculate the crop evapotranspiration and a crop growth model to estimate growth and yield in conjunction with the evapotranspiration. Steduto et al. (Reference Steduto, Hsiao, Raes and Fereres2009) developed the AquaCrop model, which calculates the yield productivity in relation with the amount of water used. However, the model is complicated and uses several data such as air temperature, reference evapotranspiration, soil evaporation, stomatal conductance, water productivity coefficient, and many other indices. The great concern about the environmental consequences of farming activities led to the development of the Hydrologic (Richards et al., Reference Richards, Bange and Johnston2008) model. The aim of this model was the evaluation of the economic and environmental aspects of several irrigation methods, the increase of the water use efficiency in cotton as well as the optimization of cotton yield. Thysen and Detlefsen, (Reference Thysen and Detlefsen2006) developed the PlanteInfo Irrigation manager. This manager was utilizing a crop and water model while it was able to download weather data. The downloading of weather data and remote-sensing images were essential for IrriSatSMS (Car et al., Reference Car, Christen, Hornbuckle and Moore2012) as well. The IrriSatSMS was manipulating weather data, crop coefficient (Kc) measurements and data from satellite images on a computer server in order to calculate the daily water balance. Additionally, a website was also a part of the system where the computer server was visualizing the results. Another decision support tool is the CropSyst model (Stockle et al., Reference Stockle, Donatelli and Nelson2003), which recommends the optimum allocation of water use in pear orchards based on the plant water potential. The calculation of the plant water potential was estimated from the tree transpiration by using Ohm’s law analogy. The WaterSense (Inman-Bamber et al., Reference Inman-Bamber, Attard, Verrall, Webb and Baillie2007) is another decision support tool which was developed to optimize the yield with a given soil type, precipitation and irrigation events. For better yield optimization, it uses crop models and algorithms to identify optimal irrigation strategies.
One efficient irrigation application system is the center pivot equipped with VRI system. Usually, a VRI system allows farmers to define custom Irrigation Management Zones (IMZs) and to load them into the VRI controller. After that the system irrigates the field in accordance with the imported zones. The different rates of irrigation are achieved due to sprinklers ability to turn on and off or pulse at the precise speed. This sprinkler ability is an advantage for the system because the sprinklers are used more efficiently and can be turned off over drains, tracks, crops and wet areas. Also the ability of the system to lower the application rates reduces runoff and leaching at the high risk areas. Finally, the fact that the VRI system can be programmed to irrigate a specific part of a field corresponds to the decrease of the power consumption.
This paper describes a study which was conducted to evaluate the performance of a linked dynamic VRI system driven by real-time soil moisture data from the University of Georgia Smart Sensor Array (UGA SSA). The study was conducted in two commercial peanut fields. Two different irrigation strategies (UGA SSA and the original version of Irrigator Pro) were used to schedule irrigation.
Material and Methods
The experiment was carried out in a 91 ha commercial field in 2015 and a 118 ha commercial field in 2016. Both fields are located in the area of Leary of Georgia, USA and they were planted with peanuts. Initially the fields were divided into IMZs by using electric conductivity and elevation data. The IMZs were delineated by using the EZZone software (Lowrance et al., Reference Lowrance, Fountas, Liakos and Vellidis2016). This software is a free online resource for delineating Agricultural Management Zones from univariate georeferenced data. After IMZ delineation, the fields were divided into alternating conventional irrigation and dynamic VRI strips (six strips in 2015 and eight strips in 2016) with each strip 120 rows wide in 2015 and 162 rows wide in 2016. In 2015 in three of the six strips, irrigation scheduling was based on Irrigator Pro recommendations and water applied uniformly. The other three strips were divided into IMZs which were irrigated individually based on UGA SSA recommendations (Figure 1). The experimental design in 2016 was the same as in 2015 but the Irrigator Pro recommendations were applied uniformly in four strips while the other four strips were irrigated individually based on the UGA SSA recommendations. After planting, at least one UGA SSA node was installed in each of the IMZs depending on the size of the zone and the within variability of elevation and electrical conductivity (totally 23 nodes in 2015 and 30 nodes in 2016). Every node consisted of three soil moisture sensors (Watermarks®) which were measuring the soil moisture at three different depths (0.1 m, 0.2 m and 0.4 m). The UGA SSA control system which was installed in the field consists of a wireless soil moisture sensing array with a high density of sensor nodes and a web-based user interface. A detailed description of the UGA SSA system was presented by Liakos et al. (Reference Liakos, Vellidis, Tucker, Lowrance and Liang2015).
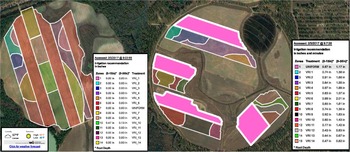
The UGA SSA webpage where the irrigation recommendations are presented. Farmers have to select one of the two irrigation recommendations provided by the UGA SSA webpage based on the root zone length, a) irrigation recommendations for 2015 and b) irrigation recommendations for 2016.

UGA SSA irrigation recommendations
The UGA SSA system was developed to monitor the soil moisture variability within the fields. However the web-based user interface of the UGA SSA offers irrigation recommendations (Figure 1). As it was mentioned above the EZZone software was used to delineate irrigation management zones. At least one UGA SSA node was installed in every zone depending on the size of the zone and the within variability. Soil water tension readings of each zone were converted into volumetric water content expressed in inches by applying a modified Van Genuchten model which was described by Liang et al. Reference Liang, Liakos, Wendroth and Vellidis2016.
The UGA SSA irrigation recommendations are presented in a window which displays an aerial image of the field (Figure 1). The aerial image is overlaid by the layer including the delineated IMZs. On the right side of the window, a legend presents the irrigation recommendations for each irrigation zone individually. Irrigation recommendations are provided for shallow rooted (up to 0.38 m) and deeper rooted (up to 0.76 m) crops or for immature and mature crops. This is necessary because different volumes of irrigation water are required to replenish a shallow versus a deep soil profile. For easy visualization, if an IMZ is clicked then all the area polygons which belong at the same zone are highlighted as well as the irrigation recommendation in the legend as shown in Figure 1. The same effect is achieved by clicking on an irrigation recommendation on the legend.
Irrigator Pro for peanuts
Irrigator Pro is a computerized expert system designed to manage peanut irrigation and pest management decisions. The version of Irrigator Pro used in this study uses precipitation and soil and ambient temperature to make irrigation decisions. It is widely used in the southeastern USA by consultants and some farmers to schedule irrigation. It is used regularly by the grower who cooperated with us in this study.
Irrigation scheduling and VRI system
The pivots used at the experiment were well maintained pivots equipped with the Farmscan VRI (Advanced Ag Systems Inc., Dothan, Alabama, USA) system. The VRI system consisted of solenoid valves which allowed different water flow in each pivot zone. The Farmscan 7000 series VRI controller (Advanced Ag Systems Inc., Dothan, Alabama, USA) allowed for the remote download of prescription maps via a cellular modem. Prescription maps were routinely remotely downloaded to the VRI controller.
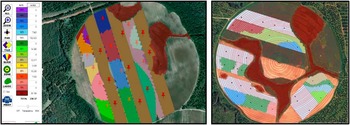
During the growing season of the first year of the experiment, at the beginning of each week, Irrigator Pro recommendations and UGA SSA recommendations were applied to the strips. At standard application rates, it took three days or longer for the pivot to make a complete circle due to the big size of the field. Because of this, new prescription maps were downloaded every morning while the pivot was operating to account for changing conditions within the field. At the end of each week the results were evaluated. The prescription maps were developed using the Irrigation Manager software version 2.1.0.11 (Control the Rain, Claremont, Australia). This user friendly software allows users to select the field areas where the irrigation should take place. Additionally, users can choose the desired irrigation rates for each selected area (Figure 2).
Irrigation Manager Environment. Each color represents a specific irrigation rate. The picture at the left shows a prescription map used in 2015 while the prescription map at the right used in 2016. The red circles on the 2016 prescription map represent the variable rate pivot zones. Based on the previous experience, users should draw the pivot zones to increase the accuracy of the prescription maps.

The evaluation of VRI performance was done by rain gauges. In 2015 nine rain gauges were installed randomly in ten irrigation zones while in 2016 twenty one rain gauges were installed. A rain gage was installed in each VRI zone adjacent to the UGA SSA node. At least one rain gage was installed in each of the uniform strips. More rain gauges were installed in 2016 because the field was bigger in size and to better monitor the performance of the VRI system.
Results and discussion
Irrigator Pro soil moisture data vs UGA SSA soil moisture data
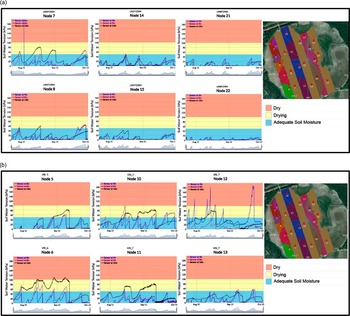
One of the options of the UGA SSA website is to present the soil water tension data in the form of time-series graphs (Figures 3 and 4). In this view, users can monitor the hourly soil moisture variability of the three different depths in real time from the installation date onwards. To help farmers interpret the data, a color-coded background of blue, yellow, and red is used. The soil water tension range for the blue area is 0 kPa to 50 kPa indicating adequate soil moisture for most crops, for the yellow area 50 kPa to 100 kPa indicating drying soils, and for the red area 100 kPa to 200 kPa indicating dry soils. The soil water tension range, of each color was selected based on the authors’ experience and may be different for places with different climate and soil types.
2015 soil moisture data representation with graphs a) the zones where the nodes were installed were irrigated based on the Irrigator Pro, b) the zones where the nodes were installed were irrigated based on the UGA SSA recommendations.

2016 soil moisture data representation with graphs a) the zones where the nodes were installed were irrigated based on the Irrigator Pro, b) the zones where the nodes were installed were irrigated based on the UGA SSA recommendations.

UGA SSA vs Irrigator Pro
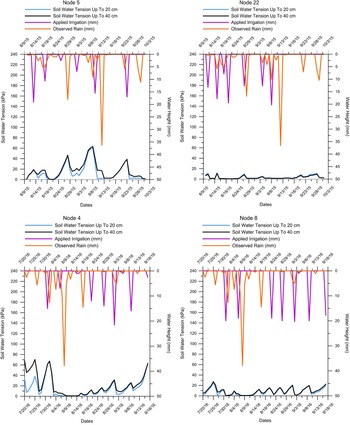
The comparison of the two strategies is crucial to understand how each irrigation scheduling tool works. The use of rain gauges was proved beneficial to the evaluation of the strategies since it gave a clear view of the recommended irrigation events. Figure 5 shows four graphs and each graph represents different soil moisture conditions in 2015 and 2016. Node #5 was installed in 2015 in an irrigation management zone which received irrigation based on the UGA SSA recommendations with VRI tehnology. Node #22 was installed also in 2015 in a strip which was irrigated uniformly based on the Irrigator Pro recommendations. It is obvious at the figures that at the UGA SSA the range of the soil water tension is from 0 kPa to 60 kPa.
Example of the comparison between the two irrigation strategies. In both graphs the blue and black lines represent the weighted average of two shallow sensors and the three sensors respectively. a) The strip where node #5 and node #4 were installed received irrigation water based on UGA SSA recommendations. b) The area where node #22 and node #8 were installed received irrigation water uniformly based on Irrigator Pro recommendations.

On the other hand, the soil water tension of the Irrigator Pro case ranges between 0 kPa and 17 kPa. Node 22 received 4.1in of irrigation water from the beginning of the growing season until the middle it while node 5 received 2.8 in throughout the growing season. Moreover node #4 and node #8 were installed in 2016 at the a the strips where UGA SSA and Irrigator Pro recommendations were applied respectively. Node #4 received 91.4 mm of irrigation while node #8 137.1 mm. In both cases the range of the soil moisture tension was approximatelly 10 kPa more than in 2015. The range of the soil mositure between the two irrigation treatments proved that the Irrigator Pro tends to keep the soil profile wet throughout the growing season. However, UGA SSA keeps the soil profile wet enough without stressing the plants and recommends irrigation only when the plants need watering. A more careful look at the observed irrigation is making clear that in both years there was no difference at the number of the irrigation events. However the events took place in different periods. This means the UGA SSA recommends less water that Irrigator Pro according to the plants’ need for irrigation.
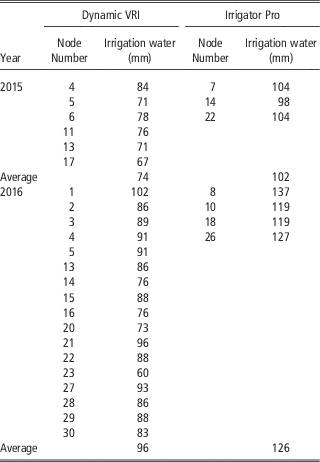
The analysis of the irrigation data of both years of the research showed significant differences at the recommended water allocations between the two irrigation strategies (Table 1). In 2015 the average water allocations of UGA SSA recommendations is 74.4 mm while the average water allocations of the Irrigator Pro is 101.9 mm. This means that the Irrigator Pro suggested 27.5 mm (average) more water allocations than UGA SSA. Considering that farmers pay USD 1.02 for every mm of water per hectare, if the farmer applied Dynamic VRI throughout the field, then he would saved 2502 mm (25025 m3) of water and USD 2552 in 2015 and 3540 mm of water (35400 m3) and USD 3611 in 2016.
UGA SSA and Irrigator Pro irrigation recommendations for the two study years.

Conclusions
Dynamic VRI has great potential to increase the water use efficiency. Monitoring soil moisture is very important to avoid water stressing crops. Additionally the integration of the UGA SSA with the decision support tool enables the system to make fast irrigation calculations and consequently accurate high definition irrigation prescription maps.
The use of strips to compare irrigation scheduling strategies gave the opportunity to evaluate the UGA SSA recommendations. The results showed that UGA SSA recommends less water allocations than the Irrigator Pro. The UGA SSA can be beneficial for the farmers because it helps them to make decisions about the water allocations they should use in variable rates and understand better the spatial variability of soil moisture conditions.
Acknowledgements
We thank Mr. Adam McLendon of McLendon Acres for allowing us to work in his field and engaging with us during this study. Funding for this study was provided by the National Peanut Board through the Southern Peanut Research Initiative and the Georgia Peanut Commission. Support for the development of the UGA SSA was provided by the Georgia Cotton Commission, Cotton Incorporated, the USDA-NRCS Conservation Innovation Grant (CIG) Program through the Flint River Soil and Water Conservation District, and by Hatch and State funds allocated to the Georgia Agricultural Experiment Stations. The authors would like to acknowledge Marcus Cofield, Herman Henry, Rodney Hill, Anna Orfanou, and Dimitris Pavlou for their contributions to the project.