Introduction
With the dawn of new scanning techniques and the emerging capacity for computer-aided three-dimensional (3D) reconstruction and visualization of arthropods’ skeletal and muscular structures, insight in phylogeny and functional physiology of small-sized insects, arachnids, and other arthropods increased significantly. Those techniques allow 3D visualizations even for species that became extinct eons ago, if fossil preservation is exceptionally good (e.g., Sutton, Reference Sutton2008; Pohl et al., Reference Pohl, Wipfler, Grimaldi, Beckmann and Beutel2010; Garwood and Dunlop, Reference Garwood and Dunlop2014).
3D visualization techniques are also widely used to animate a broad variety of creatures, fictional or real, for the film and television industry, and arthropod-like beings are animated and implemented in more or less realistic fashion. This is perfectly acceptable as long as those cinematic works are clearly recognizable as fictional and therefore cannot be misunderstood as showing behavior and movements similar to those of real animals. It is questionable when virtual behavior and movements that are shown in documentary films create the impression that arthropods move and behave in certain ways (e.g., Fröschl et al., Reference Fröschl, Handschuh, Erlach, Schwaha, Goldammer, Fragner and Walzl2014; Guo et al., Reference Guo, Chang, Yang, Wang and Zhang2014), in particular as movement dynamics of arthropods with a vast variety of body plans are still scarcely understood. Trying to deduce body dynamics, energetics, and resultant behavioral and ecological constraints with such overly simplified approaches is problematic since they do not sufficiently account for fundamental physical, physiological, behavioral, and ecological constraints. This is especially true for depictions referring to extinct and cryptic species whose locomotor skills cannot be verified directly. There is clear evidence that movement and behavior depend on more than anatomical constraints and seemingly plausible assumptions alone (e.g., Dickinson et al., Reference Dickinson, Farley, Full, Koehl, Kram and Lehman2000; Patek et al., Reference Patek, Dudek. and Rosario2011; Ache and Matheson, Reference Ache and Matheson2012). On the contrary, reliable assessments require reasonable assumptions, which account for, in addition to morphological constraints, at least some of the following parameters: internal and external forces, energetics, metabolism, actuator characteristics, whole body movement, habitat topography, leg coordination, locomotion stability, and scaling effects.
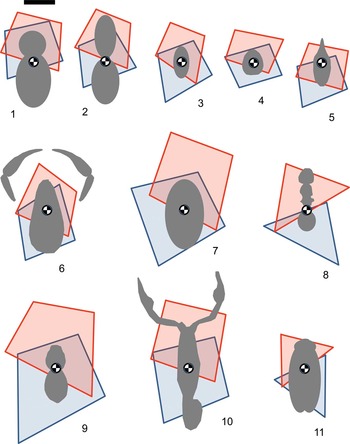
In this paper, we will focus on locomotion in arachnids since many of the orders are characterized by four pairs of walking legs, which seem to represent an intermediate state between low leg numbers that facilitate the exploitation of elastic mechanisms, and real poly-pedal locomotion, which prevents the reuse of movement energy in consecutive strides. Some of the first land-colonizing animals were arachnids. They have an extraordinarily long fossil record and exhibit a couple of significantly differing locomotor systems. Though examinations of arachnids‘ locomotor systems are still fragmentary, it is well known that some groups use only three of the characteristic four pairs of walking legs to propel themselves, while others use all four pairs. Sometimes even the pedipalps take over propulsive tasks (Fig. 1.2). However, even within these fundamental body plans, the functioning of the legs can vary considerably. While some orders are characterized by a specific hydraulic mechanism to extend some major leg joints, the same joints are extended by muscles or elastic transarticulate sclerites in other orders (Shultz, Reference Shultz1989; Sensenig and Shultz, Reference Sensenig and Shultz2003).
Approximate positions of the animals’ centers of mass (COM) projected into the (supposed) supporting polygons of the legs in contact with the ground. The depicted polygons are only valid if the animals coordinate their legs in alternating sets. Red polygons show the touch-down positions of the set of legs made up by the legs L1, R2, L3, and R4 (counted from anterior to posterior, L and R indicate left and right, respectively). Blue polygons represent the take-off positions of the alternating set of legs (R1, L2, R3, L4). The insects depicted in 8 and 11 lack L4 and R4. Palpigrades use their palps instead of the 1st pair of legs for locomotion. (1) Trigonotarbid after Garwood and Dunlop (Reference Garwood and Dunlop2014); (2) Palpigrade; (3) Teneriffiid mite after Wu et al. (Reference Wu, Wright, Whitaker and Ahn2010); (4) Trombidid mite (own observations); (5) Gamasid mite (own observations); (6) Pseudoscorpion; (7) Cyphophthalmid harvestman; (8) The ant Formica polyctena after Reinhardt et al. (Reference Reinhardt, Weihmann and Blickhan2009); (9) The vagrant spider Ancylometes concolor after Weihmann (Reference Weihmann2007); (10) The scorpion Buthus australis after Manton (Reference Manton1952); (11) The cockroach Blaberus discoidalis from Dickinson et al. (Reference Dickinson, Farley, Full, Koehl, Kram and Lehman2000). Scale bar is about: 1 mm in (1–5); 13 mm in (9, 10); 2 mm in (6, 7); 5 mm in (8); and 10 mm in (11). COM positions in 2–7 were estimated from the centroid of the contours shown, i.e. similar to the method Garwood and Dunlop (Reference Garwood and Dunlop2014) used for trigonotarbids (1). Leg positions at touch-down and take-off in 2, 3, 6, and 7 were estimated from gross anatomy. According to Garwood and Dunlop (2014), trigonotarbids differ from all other species in having a short relative stride length, which results in anterior take-off positions of the legs. Their COM does not cross the center of the polygons and therefore the maximum stability margin of the polygons (Ting et al., Reference Ting, Blickhan and Full1994) is not exploited. Color figure available online.

Methods and results
Arthropod movement studies are relatively rare. Within the available body of literature, insects and crustaceans make up the vast majority, while studies focusing on arachnids are rare exceptions. Within the available literature covering arachnid locomotion, examinations of small species with body lengths of only a few millimeters are virtually not existent. Although we primarily intended to only review existing examinations, to fill some obvious gaps we had to conduct some original research as well that focused on leg coordination and body dynamics in octopedal running animals.
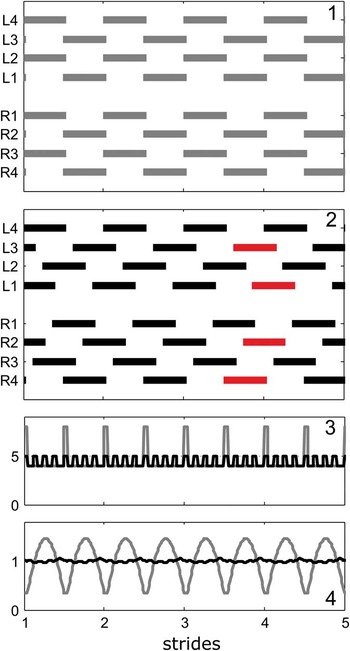
As a start, we chose a synthetic, numerical approach to create stepping patterns of a generalized octopedal arthropod and resulting ground-force interferences (Fig. 2). As we were particularly interested in faster locomotion, the fundamental pattern of leg coordination was assumed to consist of two sets of legs alternating with each other. The sets consisted of diagonally adjacent legs (i.e., L1, R2, L3, R4 and R1, L2, R3, L4) counted from anterior to posterior with L and R indicating left and right, respectively. The duty factors of all legs were set to 0.55 and the contralateral phase shift of the 4th legs to 0.5. The duty factor is defined as the duration of the contact phase of a certain leg divided by the duration of this leg’s whole stride. The phase shift is defined by the occurrence of the touchdown of a certain leg within the stride of another (i.e., the ratio between the time interval between the two touchdowns and the stride duration of the target leg) (Ward and Humphreys, Reference Ward and Humphreys1981; Weihmann, Reference Weihmann2013). Ground reaction forces were modeled assuming that each leg applies a force of a half sine wave shape (Blickhan, Reference Blickhan1989; Full et al., Reference Full, Blickhan and Ting1991) with the same amplitude. The mean of the applied forces was set equal to the body weight (Fig. 2.4).
Synthetic stepping patterns of an octopedal arthropod and resulting ground-force interferences. (1) Contact (bars) and swing phases of the left legs (L1–L4, counted from anterior to posterior) and right legs (R1–R4) over 4 cycles of the 4th left leg (L4). The duty factor is set to 0.55, the contralateral phase shift of the 4th legs to 0.5 and the ipsilateral phase shift between the adjacent legs to 0.5 (i.e., two sets of legs [L1, R2, L3, R4 and R1, L2, R3, L4] alternate with each other). (2) Stepping pattern with the same duty factor (0.55) and contralateral phase shift (0.5), but a different ipsilateral phase shift of 0.37 (i.e., the coordination of ipsilateral legs follows a metachronal wave pattern). In this eight-legged arthropod, ipsilateral phase shifts of 0.37 result in minimum force amplitudes (see Fig. 2.4). Red bars indicate a temporally distributed contact of the set of legs consisting of L1, R2, L3 and R4. (3) Sum of legs in contact with the ground (gray: alternating tetrapod pattern according to 2.1; black: metachronal wave pattern according to 2.2). (4) Fluctuations of vertical ground-reaction forces assuming that each leg applies a force of half sine wave shape (Blickhan, Reference Blickhan1989; Full et al., Reference Full, Blickhan and Ting1991) and the mean of the applied forces is equal to the body weight (gray: according to 2.1; black: according to 2.2). Note the much higher fluctuations of ground-reaction forces with strictly alternating sets of legs. Color figure available online.

Phase shifts of 0.5 between adjacent ipsilateral legs resulted in exactly alternating sets of legs (Fig. 2.1). If ipsilateral phase shifts were set to lower or larger values, synchronicity of the sets of legs decreased and interference effects of the ground forces could result in markedly lower ground-force oscillations (Fig. 2.4), which, in turn, directly determine the kinematics of the center of mass (COM). Phase shifts as low as 0.37 or as high as 0.63 effectively resulted in metachronal coordination patterns with temporally overlapping activities of the supposed sets of legs (i.e., metachronal leg coordination.) (Fig. 2.2).
In a quick-movement study (Fig. 3), as a next step, we chose a high-speed kinematics approach and focused on mites with body lengths of about 1 mm because of the aggravating lack of data at this size scale. We videotaped a gamasid (about 1.3 mm body length) and a trombidid (0.8 mm body length) mite found on a cherry tree in Cambridge UK. Both were examined in the lab by using a Phantom V7 high-speed camera recording at 1000 images per second at a room temperature of about 23°C. We allowed the animals to run freely on a white plastic dish. The field of view was illuminated by two cold-light gooseneck lamps and provided a spatial resolution of about 23 pixels per mm (See Supplemental Data for example video sequences).
Exemplary gait patterns of two mite species; contact (bars) and swing phases of the left legs (L1–L4, counted from anterior to posterior) and right legs (R1–R4) over 4 cycles of the 4th left leg (L4). (1) A gamasid mite (inset) running at 8.1 mm·s–1 with duty factors of about 0.72 and ipsilateral phase shifts between adjacent legs of about 0.49; (2) a trombidid mite (inset) running at about 34 mm·s–1 with duty factors of about 0.57 and ipsilateral phase shifts of about 0.53; (3) a trombidid mite running at about 42 mm·s–1 with duty factors of about 0.54 and ipsilateral phase shifts of about 0.59. Red bars indicate a temporally distributed contact of the set of legs consisting of L1, R2, L3 and R4 (inset in 3.2). Color figure available online.

The gamasid mite ran uniformly at speeds of about 8.1±0.25 mm·s–1 with a stride frequency of 13.1±0.56s–1, a duty factor of 0.72±0.03 and ipsilateral phase shifts of 0.49±0.04 (Fig. 3.1). The trombidid mite showed some variability with regard to running speeds; a slower and a fast run were analyzed. The running speed of the slower run (Fig. 3.2) was about 33.8 mm·s–1, the stride frequency was 30.6±1.8 s–1, the duty factor was about 0.57±0.04 and ipsilateral phase shifts were about 0.53±0.05. The quickest running speed (Fig. 3.3) we could record was 41.5±3.4 mm·s–1, at this speed the stride frequency was 36.4±2.8 s–1, the duty factor was 0.54±0.03 and the ipsilateral phase shift was as high as 0.59±0.05.
Consequently, the coordination patterns of the gamasid run and the slower trombidid run were fairly alternating with relatively high duty factors. The fast trombidid run, in turn, was characterized by low duty factors and held phase shifts close to those predicted by the model approach for minimum ground-force fluctuations (cp. Fig. 2.4). For gait pattern schematics (Figs. 2.1, 2.2, and 3.1–3.3) we chose a line-up of the legs, starting with the first pair from the center line to the sides. According to this order, the sets of legs formed increasingly bent crescent-shaped patterns when ipsilateral phase shifts increased (Figs. 2.2, 3.3).
Discussion
Conflicting tasks and redundancy within locomotor apparatuses
In biology, function determines the structure and form of anatomical features. Here, the term ‘function’ is not restricted to mechanical demands. To some extent function can be deduced by a thorough assessment of structure and form, though functional units primarily used for mechanical tasks such as mouthparts or walking legs rarely implement only one exclusive task. On the contrary, the range of functions typically includes several synergistic or even opposing tasks. Many arachnid orders, including whip spiders, whip scorpions, scorpions, solifuges, harvestmen, and others, show a distinct division of labor among primarily sensory appendages, walking legs, and/or limbs specialized for prey and food acquisition. In contrast to these orders, the locomotor apparatus of vagrant spiders (i.e., the four pairs of walking legs attached to the ventral part of the prosoma) apparently covers all locomotor tasks such as accelerated and steady locomotion, climbing, and jumping on the variety of substrates of their habitat (e.g., Ehlers, Reference Ehlers1939; Parry and Brown, Reference Parry and Brown1959b; Barth, Reference Barth2002; Weihmann et al., Reference Weihmann, Karner, Full and Blickhan2010; Weihmann et al., Reference Weihmann, Günther and Blickhan2012). Ranging in size from a few mm to a few cm, middle to late Palaeozoic trigonotarbids had a roughly spider-like appearance with four similarly long pairs of walking legs (Garwood and Dunlop, Reference Garwood and Dunlop2014). At least superficially, their general body plan is similar to that of vagrant spiders or large mites suggesting equally broad applications of the walking legs. Characterized by a good fossil record in coal measures und other sedimentary rocks, which cover the period from about 420 to 290 million years ago (Gradstein and Ogg, Reference Gradstein and Ogg2004; Dunlop and Brauckmann, Reference Dunlop and Brauckmann2006), they were one of the dominating terrestrial arthropod groups at the time.
Systematic examinations of intrinsic adaptations of the leg architecture are not available for spiders and other arachnids, especially with regard to main motion requirements. In insects all walking legs show a strong division of labor, even during continuous level locomotion. This is often clearly reflected in the anatomy of the walking legs as well as activation patterns of the driving muscles. In generalist walkers like ants (Reinhardt et al., Reference Reinhardt, Weihmann and Blickhan2009), specialist runners like cockroaches (Full et al., Reference Full, Blickhan and Ting1991), and specialist climbers like stick insects (Cruse, Reference Cruse1976), anteriorly directed front legs almost exclusively brake during ground contact while posteriorly directed hind legs generate the major part of the propulsive ground forces. It has been shown that leg and muscle functions also strongly depend on substrate inclination (Schmitt and Bonnono, Reference Schmitt and Bonnono2009; Günther and Weihmann, Reference Günther and Weihmann2011). Results of examinations that focus only on level locomotion are therefore prone to being over-interpreted. In vagrant spiders, typically all four leg pairs are anatomically very similar, exceptions include single taxa such as crab spiders (Parry and Brown, Reference Parry and Brown1959a; Prange, Reference Prange1977; Ruhland and Rathmayer, Reference Ruhland and Rathmayer1978; Ferdinand, Reference Ferdinand1981; Clarke, Reference Clarke1986). However, even for species with similar leg anatomy, it is not yet known whether muscle properties determined for one leg pair are similar to those of other leg pairs too (Maier et al., Reference Maier, Root and Seyfarth1987; Weihmann et al., Reference Weihmann, Siebert and Blickhan2009; Siebert et al., Reference Siebert, Weihmann, Rode and Blickhan2010).
In spiders, the walking legs also represent a major part of the prey-capture apparatus complemented by pedipalps and chelicerae (Melchers, Reference Melchers1967; Rovner, Reference Rovner1980; Hill, Reference Hill2006; Weihmann et al., Reference Weihmann, Karner, Full and Blickhan2010). Both tasks, locomotion and prey capture, for which locomotion is often a prerequisite for successful prey capture, require different physiological and morphological conditions in order to achieve optimum performance (see Goyens et al., Reference Goyens, Dirckx, Aerts and Davidowitz2015 for a similar relation). As a consequence, a number of morphological and physiological parameters influencing different tasks can be individually optimized in different leg pairs according to requirements of one of the tasks. However, the system might even be optimized for a third task as the array of different mechano-sensors distributed over the legs’ surface provides a major part of the spiders’ perceptive system (Barth, Reference Barth2002).
To fulfill all these requirements, biological systems, including the locomotor apparatus, are usually highly over-determined. The sum of involved muscles, skeletal segments, and joints provides many more degrees of freedom than necessary to perform any given task (e.g., Burden, Reference Burden2014; De Groote et al., Reference De Groote, Jonkers and Duysens2014). Variable neural control, thus, allows for spatial and temporal variability of single leg movements as well as inter-limb coordination without necessarily affecting the COM dynamics significantly. Inherent mechanical and neuronal stochastic variations even increase the variability of movement sequences and dynamics. Thus, anatomical features are rarely optimized for just one specific task, and anatomical structures can often fulfill specific tasks in different ways. Drawing direct inferences from anatomical structures alone, therefore, does not provide a reliable picture with regard to a specific behavior of interest.
Locomotion patterns and comparability of locomotion in terrestrial arthropods
Terrestrial arthropods with only a couple of propulsive leg pairs, like insects and arachnids, mainly use two locomotion patterns: slow locomotion, relying largely on neural control, and fast locomotion which is mainly determined by muscle dynamics and mechanical properties of the locomotor system (Cruse et al., Reference Cruse, Dürr and Schmitz2007). While slow arthropod locomotion is characterized by a metachronal coordination of ipsilateral legs (Wendler, Reference Wendler1964; Wilson, Reference Wilson1967), in many insect species two sets of synchronized legs alternate with each other during faster locomotion (Fig. 2). Both patterns benefit from the generally sprawled position of arthropod legs providing considerable static stability (Manton, Reference Manton1952; Ting et al., Reference Ting, Blickhan and Full1994; Weihmann, Reference Weihmann2013). Leg coordination, however, must serve at least two basic demands. First, generated changes in body momentum provide motion of the center of mass in space as the primary goal. These changes are caused by tuned application of forces from single legs to the ground. Second, coordination patterns must prevent perturbing interferences of adjacent legs. With an increasing number of homonomous walking legs, the second demand gains predominance since even slightly imprecise coordination adds up and prevents proper ground force application (Weihmann, Reference Weihmann2013), this way jeopardizing the primary goal.
Typically, moving cautiously in unpredictable terrain is characterized by relatively high and fast locomotion by significantly lower duty factors (Cruse et al., Reference Cruse, Dürr and Schmitz2007; Sponberg and Full, Reference Sponberg and Full2008). Nevertheless, even in fast-moving insect species, such as cockroaches and ants, with very strictly alternating sets of legs, the legs of a set are never completely in phase (Hughes, Reference Hughes1952; Wahl et al., Reference Wahl, Pfeffer and Wittlinger2015). The synchronization between legs seems to be even lower in other fast-moving arthropods, such as crabs and spiders (Blickhan and Full, Reference Blickhan and Full1987; Spagna et al., Reference Spagna, Valdivia and Mohan2011; Weihmann, Reference Weihmann2013), and in insects that are not specifically adapted to fast terrestrial locomotion (Mendes et al., Reference Mendes, Bartos, Akay, Márka and Mann2013; Goyens et al., Reference Goyens, Dirckx, Aerts and Davidowitz2015). In some fast-moving species, leg synchronicity is seemingly generally low (Spagna et al., Reference Spagna, Valdivia and Mohan2011) or is reduced when running at maximum speed.
The trombidid mite examined here is probably a good example for the latter. While running with alternating sets of legs at medium speeds (Fig. 3.2), their leg synchronization decreased at maximum running velocity (Fig. 3.3). This decrease is the result of increased phase shifts between the ipsilateral legs and leads presumably to lower fluctuations of the COM (Fig. 2.4). This is particularly useful if the natural frequency of supposed elastic mechanisms cannot be further tuned to match the stride frequency of the legs, but can also foster the controllability of the locomotion (see below). Hence, medium running speeds are characterized by alternating sets of legs and relatively high duty factors, whereas the synchronicity of sets of legs at high-speed runs with low duty factors is reduced.
Stability in arthropod locomotion
Striving for locomotion stability is one of the main factors determining the dynamics and kinematics of animal locomotion (Blickhan et al. 2007). It is important to note that dynamic stability and static stability originate from different mechanisms. Dynamic stability will be addressed later in a specific paragraph. Static stability is based on geometric properties of the system and depends on the position of the COM relative to the legs’ points of contact with the ground. If the position of the COM projected onto a level surface is within the polygon spanned by the legs in contact with the ground, an animal is statically stable. The further away from the polygon’s edges the COM is, the more stable and less susceptible to perturbations an animal is (Ting et al., Reference Ting, Blickhan and Full1994).
At the beginning of the stance phase of locomotion patterns characterized by alternating sets of legs, animals usually place their legs such that the COM is in the posterior part of the supporting polygon (Fig. 1). The advancing COM subsequently passes the center of the polygon, at which point overall vertical ground-reaction forces normally reach maximum values. At the end of the stance phase, the COM is typically situated in the anterior part of the supporting polygon and ground forces are close to zero again.
In a recent study, Garwood and Dunlop (Reference Garwood and Dunlop2014) reported an attempt to reconstruct the locomotion of exceptionally well-preserved small specimens (leg lengths of about 2 mm; opisthosomal width of about 1 mm) of a trigonotarbid species found in the Rhynie cherts of Scotland. These long-extinct arachnids seem to be characterized by a relatively voluminous opisthosoma, shifting the COM significantly in the posterior direction (Fig. 1.1). Assuming that the opisthosoma did not touch the surface during level locomotion, the rearward-shifted COM and the limited range of their walking legs, however, prevent the typical posterior-anterior transgression of the COM through the center of the supporting polygon (Fig. 1). In contrast to all other species depicted in Figure 1, these trigonotarbids therefore were not able to exploit the maximum static stability, which is usually inherent in patterns with alternating sets of legs. Even though the COM is within the polygon for the whole stride and the locomotion should be statically stable, the COM might have been close to the edge of the polygon for most of the stride, and thus susceptible for larger internal or external perturbations. This holds true unless anterior legs would generate adhesive normal forces (i.e., attach to the surface and pull to create an opposing torque). Pulling forces normal to the substrate, however, are typical only for climbing (Reinhardt et al., Reference Reinhardt, Weihmann and Blickhan2009). To prevent stumbling on level substrates, presumably, they therefore applied temporally overlapping sets of alternating legs, as found for gamasid and trombidid mites running with medium speeds, rather than the proposed strict alternation with duty factors as low as 0.5. With duty factors of 0.5, legs are only in contact with the surface during exactly half of the stride. With perfectly synchronized alternating sets of legs, a duty factor of 0.5 marks the boundary between locomotion with (duty factor <0.5) and without (duty factor ≥0.5) a phase in which the animal is completely airborne. Therefore, changes of the duty factor can significantly affect locomotion stability. In small arthropod species with a bulky opisthosoma, mean values of duty factors are usually well above the critical value of 0.5, even at higher running speeds. Moreover, these species do not seem to optimize for perfect leg synchronization within the alternating sets (Wosnitza et al., Reference Wosnitza, Bockemühl, Dübbert, Scholz and Büschges2013). The mites examined in the current study did not have particularly bulky opisthosomata and still did not employ duty factors as low as 0.5, even if running at speeds of up to 50 body lengths per second (Fig. 3). In these mites, high running speeds with low duty factors seem to be colligated with reduced synchronicity of the sets of legs, whereas highly synchronized sets of legs concur with duty factors considerably higher than 0.5.
The bulky opisthosoma and the small size of the trigonotarbids examined by Garwood and Dunlop (Reference Garwood and Dunlop2014) as well as the specific paleo-environment of the Rhynie cherts (Fayers and Trewin, Reference Fayers and Trewin2003) indicate a lifestyle similar to extant ground- and moss-dwelling mites (i.e., representatives of the mesofauna). Given the unpredictable structural stability of typically cluttered and rugged soil environments (Günther and Weihmann, Reference Günther and Weihmann2012), in their natural habitats most arthropods of the soil surface and its upper layers should rarely move at their principally attainable maximum speed. Striving for controlled and aimed locomotion they probably minimize the risk of falling and getting stuck. Controlled polypedal locomotion, however, is characterized by metachronal rather than alternating leg coordination (see also the animated material provided in Fröschl et al., Reference Fröschl, Handschuh, Erlach, Schwaha, Goldammer, Fragner and Walzl2014).
Overlapping stance phases of consecutively active legs provide an important contribution to quasi-static stability (Zollikofer, Reference Zollikofer1994; Moll et al., Reference Moll, Roces and Federle2013). Moreover, a permanent rearward-shift of the COM caused by a voluminous opisthosoma is comparable to imposing added weights away from the COM in load-carrying arthropods. Leaf-cutting ants whose stability was challenged by large food items dragged their hind feet over the ground after the retraction of the leg was already finished (Moll et al., Reference Moll, Roces and Federle2013). Similar dragging of hind legs was also frequently observed in fast-running spiders (e.g. Moffett and Doell, Reference Moffett and Doell1980; Ward and Humphreys, Reference Ward and Humphreys1981; Weihmann, Reference Weihmann2013) and spiders with bulky opisthosomata (Jacobi-Kleemann, Reference Jacobi-Kleemann1953). In these species, leg dragging contributes to an increase of the supporting polygon and locomotion stability. Hind-leg dragging, therefore, seems to be a general attempt to counteract torques induced by rearward shifted COM.
Low duty factors and higher relative variability among the legs prevent guaranteed static stability. In fast locomotion, inertia gains impact and the locomotor apparatus of arthropods provides dynamic stabilization. Dynamic stability emerges from the interplay of all parts of the locomotor system. It is the result of all interactions within the moving body and between body and environment. Dynamic stability, thus, depends on all properties and constraints that affect mechanical forces. The determining parts of this dynamic interplay are the walking legs themselves with their specific coordination, segmentation (Biewener, Reference Biewener1990; Seyfarth et al., Reference Seyfarth, Günther and Blickhan2001; Günther et al., Reference Günther, Keppler, Seyfarth and Blickhan2004; Fischer and Blickhan, Reference Fischer and Blickhan2006), and numbers, the leg joints providing specific degrees of freedom, stiffness, and damping coefficients, and the muscles and tendons with specific elastic properties, activation dynamics, fiber architectures, fiber-type compositions, force-length and force-velocity relationships. From the perspective of movement control, dynamic stability depends on superposed contributions from self-stability (Ringrose, Reference Ringrose1997), feed-forward and feedback control. Self-stability is induced by passive mechanical properties in combination with rheonomic constraints provided by pre-set adjustments, such as increased muscle tension and co-contractions or erection of leg spines (Spagna et al., Reference Spagna, Goldman, Lin, Koditschek and Full2007). For a detailed definition of self-stability see Grimmer et al. (Reference Grimmer, Ernst, Günther and Blickhan2008), but see also Blickhan et al. (Reference Blickhan, Seyfarth, Geyer, Grimmer, Wagner and Günther2007). Self-stability allows for locomotion over obstacles of considerable height and lateral perturbations without requiring a constant flow of neural information (e.g., Schmitt and Holmes, Reference Schmitt and Holmes2000; Seyfarth et al., Reference Seyfarth, Geyer, Günther and Blickhan2002; Geyer et al., Reference Geyer, Seyfarth and Blickhan2005; Endlein and Federle, Reference Endlein and Federle2008; Sponberg and Full, Reference Sponberg and Full2008); that is, with zero control effort (Haeufle et al., Reference Haeufle, Günther, Wunner and Schmitt2014). Central neural control mechanisms only have to intervene if thresholds are exceeded. Specific local feedback loops within the legs (Geyer et al., Reference Geyer, Seyfarth and Blickhan2003; Cruse et al., Reference Cruse, Dürr and Schmitz2007; Ijspeert, Reference Ijspeert2008) may also support dynamic stability. At high running speeds and stride frequencies with low duty factors, the trombidid mite examined here changed from an alternating to a metachronal leg coordination pattern with decreased synchronicity within the sets of legs. As a result, the increased temporal distribution caused considerable temporal overlaps of the consecutive sets, although duty factors were low. Consequently, the number of legs on the ground (Fig. 2.3) and static stability are increased for the major part of the gait cycle. Additionally, accelerations affecting the trajectory of the body are reduced (Fig. 2.4). In this way, providing a stabilizing feed-forward mechanism, high-speed metachronal leg coordination might increase the dynamic stability of mites and other fast-running arthropods. However, given the extraordinary complexity of self-stability and related self-organization phenomena, it is extremely difficult to predict locomotor dynamics in rugged environments.
Body size
Body size is a major determinant of preferred gaits and locomotion in general. Arachnids cover a wide range of body sizes, from microscopic mites up to enormous spiders and scorpions. So far, proper movement studies regarding continuous terrestrial locomotion exist for scorpions, a couple of larger and smaller vagrant and web-dwelling spiders, and harvestmen (e.g., Ehlers, Reference Ehlers1939; Jacobi-Kleemann, Reference Jacobi-Kleemann1953; Wilson, Reference Wilson1967; Bowerman, Reference Bowerman1975; Fröhlich, Reference Fröhlich1978; Moffett and Doell, Reference Moffett and Doell1980; Ferdinand, Reference Ferdinand1981; Ward and Humphreys, Reference Ward and Humphreys1981; Brüssel, Reference Brüssel1987; Shultz, Reference Shultz1987; Sens, Reference Sens1996; Sensenig and Shultz, Reference Sensenig and Shultz2006; Weihmann, Reference Weihmann2007; Biancardi et al., Reference Biancardi, Fabrica, Polero, Loss and Minetti2011; Spagna et al., Reference Spagna, Valdivia and Mohan2011; Weihmann, Reference Weihmann2013). Out of this range, the two smallest species with a mean body length (length of prosoma and opisthosoma) of about 7.3 mm were extraordinarily fast funnel-web spiders (Spagna et al., Reference Spagna, Valdivia and Mohan2011). Examinations regarding smaller species are not available in the literature. However, animals of different size are subject to different living conditions because inertia, ground forces, air resistance, and habitat topography change non-linearly with size (e.g., Alexander, Reference Alexander1977; Full and Koehl, Reference Full and Koehl1992; Blickhan and Full, Reference Blickhan and Full1993; Biewener, Reference Biewener2003; Spagna et al., Reference Spagna, Goldman, Lin, Koditschek and Full2007). Moreover, passive forces of the leg muscles might become relatively larger if compared with gravitational forces in smaller animals (Hooper et al., Reference Hooper, Guschlbauer, Blumel, Rosenbaum, Gruhn, Akay and Buschges2009; Ache and Matheson, Reference Ache and Matheson2012); resultant damping of the leg joints in turn is likely to affect leg movements and running dynamics significantly. Accordingly, movement criteria and locomotion patterns cannot simply be extrapolated from much larger species to minute soil organisms like mites or other small arachnids.
Energetics
The energetics of locomotion is another important optimization criterion affecting leg coordination, body dynamics, and control mechanisms. Alternating tripodal or quadrupedal sets of legs resulting in bouncing gaits with locomotion dynamics similar to spring mass models (Blickhan and Full, Reference Blickhan and Full1993; Full and Koditschek, Reference Full and Koditschek1999) primarily seem to be advantageous for species that usually move relatively fast for a sustained period of time and on relatively smooth and solid ground. Effective employment of energy-saving mechanisms such as elastic joint structures (see below) often requires specific loading conditions, for which the direction of the gravitational force plays an important role (Dudek and Full, Reference Dudek and Full2006). These specific loading conditions are not met on steep slopes or in rugged environments. Moreover, most energy-saving mechanisms involved in arthropod locomotion provide relatively low percentages of energy recovery (Patek et al., Reference Patek, Dudek. and Rosario2011). Their impact only becomes significant if a movement is repeated many times.
When considering extinct or cryptic species, traces and trace fossils can help to reconstruct kinematics and potentially even dynamics and energetics (Minter et al., Reference Minter, Mángano and Caron2012), especially if a leg’s kinematic history during a finite time period remains engraved into the (petrified) substrate (Falkingham, Reference Falkingham2014). However, legs with multiple segments can adopt a manifold of joint-angle combinations for the same leg length (Seyfarth et al., Reference Seyfarth, Günther and Blickhan2001; Günther et al., Reference Günther, Keppler, Seyfarth and Blickhan2004). Therefore, they are capable of performing a wide range of movements resulting in similar stepping patterns. Reliable reconstructions are therefore difficult without basic information about locomotion dynamics and constraints (e.g., mechanical, metabolic, sensory, and surface contact) (see also Ehlers, Reference Ehlers1939). While traces may provide suitable pictures of locomotion in centipedes and other polypedal arthropods (Manton, Reference Manton1950; Minter et al., Reference Minter, Mángano and Caron2012), in species with fewer propulsive legs more complicated task- and speed-dependent dynamics, as found in trombidid mites (see above), make it more difficult to reconstruct their kinematics and dynamics. Understanding the emergence of locomotion patterns in related species or those with similar locomotor systems and a comparable body shape and size is therefore inevitable for a reliable reconstruction of locomotion.
The velocity of locomotion largely determines leg coordination. Legs of many arthropod species experience increasing temporal coupling and synchronization with increasing velocity and are more likely to be coordinated in movements of alternating sets (Hughes, Reference Hughes1952; Ward and Humphreys, Reference Ward and Humphreys1981; Wosnitza et al., Reference Wosnitza, Bockemühl, Dübbert, Scholz and Büschges2013; Wahl et al., Reference Wahl, Pfeffer and Wittlinger2015). Ground-reaction forces exerted by synchronized leg movements also become more synchronized (Fig. 2). If strictly alternating sets of legs are maintained at high running speeds, single-leg duty factors and stance overlap of alternating sets of legs are low (Ting et al., Reference Ting, Blickhan and Full1994; Weihmann, Reference Weihmann2013). The acceleration of the animal’s body is uniquely determined by the sum of all single-leg ground-reaction forces. Observations of the characteristic body oscillations or net ground-reaction forces can therefore be used to gather information about leg coordination and vice versa (Blickhan, Reference Blickhan1989; Blickhan and Full, Reference Blickhan and Full1993; Full and Koditschek, Reference Full and Koditschek1999) in locomotor systems with strongly coupled sets of legs. The movement of the animal’s body towards the ground must be decelerated in the initial stance phase. Subsequently, the body must be reaccelerated away from the ground. The whole stance phase can also be seen as an initiation of the swing phase (Mochon and McMahon, Reference Mochon and McMahon1980; Lipfert et al., Reference Lipfert, Günther, Renjewski and Seyfarth2014). With optimized leg properties, it is possible to recover significant proportions of kinetic or gravitational energy in the final part of the stance phase, which helps to economize locomotion (Cavagna et al., Reference Cavagna, Saibene and Margaria1964; Alexander and Bennet-Clark, Reference Alexander and Bennet-Clark1977; Blickhan and Full, Reference Blickhan and Full1993; Ruina et al., Reference Ruina, Bertram and Srinivasan2005; Blickhan et al., Reference Blickhan, Seyfarth, Geyer, Grimmer, Wagner and Günther2007). However, the stiffness of energy-storing components must be matched to each other to provide concerted loading and unloading rates, which allow the whole locomotor system to move in a coordinated way with a well-defined stride repetition frequency (Biewener, Reference Biewener1990; Dudek and Full, Reference Dudek and Full2007; Weihmann, Reference Weihmann2013). Therefore, many fast-moving insects seemingly require strong coordinative leg coupling and force peaks with a narrow frequency spectrum to load the involved elastic structures adequately.
The sum of the distances between the joints and the leg axis is larger in bow-shaped legs than in other leg designs (Günther et al. 2004). Because of this large distance in bow-shaped legs, which are found in trigonotarbids and spiders, larger muscle forces are required to generate a given ground force (see Günther et al. 2004; Fischer and Blickhan, Reference Fischer and Blickhan2006, fig. 7; Weihmann, Reference Weihmann2013). Additionally, spider legs lack specific elastic structures that are capable of temporary energy storage (Sensenig and Shultz, Reference Sensenig and Shultz2003; Siebert et al., Reference Siebert, Weihmann, Rode and Blickhan2010). In principle, movement energy can be stored in elastic components of the prosomal pressure pump (Sensenig and Shultz, Reference Sensenig and Shultz2003), which is largely driven by isometrically contracting musculature (Stewart and Martin, Reference Stewert and Martin1974; Anderson and Prestwich, Reference Anderson and Prestwich1975; Weihmann et al., Reference Weihmann, Karner, Full and Blickhan2010; Weihmann et al., Reference Weihmann, Günther and Blickhan2012). Elasticity can occur both in series with and parallel to the contractile apparatus (i.e., the power-generating cross-bridges). In vertebrate muscles, serial muscle fiber elasticity is primarily located in the neck region of myosin heads protruding from the muscles’ thick filaments and in the filaments themselves (Piazzesi et al., Reference Piazzesi, Reconditi, Linari, Lucii, Bianco, Brunello, Decostre, Stewart, Gore and Irving2007; Fusi et al., Reference Fusi, Brunello, Reconditi, Piazzesi and Lombardi2014). Both contributions superpose to a net stiffness of about 1 pN/nm per cross-bridge (Rosenfeld and Günther, Reference Rosenfeld and Günther2014), which is equivalent to a half-sarcomere strain of about 0.5 per cent assuming a cross-bridge’s maximum isometric force of 4pN. Similar results are to be expected for arthropods. The mechanisms for elasticity parallel to the cross-bridges in vertebrate and arthropod muscle fibers are similar. Parallel elasticity is provided by titin or related titin-like proteins, which connect M-line and Z-disc in a half-sarcomere (e.g., Bullard et al., Reference Bullard, Garcia, Benes, Leake, Linke and Oberhauser2006) and can attach to actin sites like myosin depending on Ca2+ concentration (Rode et al., Reference Rode, Siebert, Herzog and Blickhan2009).
However, assuming an increase of viscous fluid drag in a cylinder with the fourth power of the radius according to Hagen-Poiseuille’s equation, at least in small hydraulically extended legs most of the potentially recovered energy is dissipated. Therefore, COM oscillations would exclusively rely on sequential muscle activities, which first dissipate and then generate movement energy. Since muscle activity is always coupled with energy consumption, in spiders and probably also in mites, trigonotarbids and other arachnids with hydraulically extended leg joints, energy-efficient locomotion can be best achieved by avoiding synchronized leg activities. This applies in particular if the stride frequency matches the natural frequency of the locomotion apparatus only insufficiently and elastic elements cannot be integrated properly. Temporally distributed foot contacts can provide an almost constant vertical ground reaction force profile and minimize corresponding body fluctuations (Fig. 2.4). Resulting low-force maxima would reduce the impact onto compliant or granular substrates and facilitate safe locomotion (Günther and Weihmann, Reference Günther and Weihmann2012). For predatory species, another advantage of almost constant ground reaction forces is the blurred frequency signature of forces transferred onto the substrate, which makes the detection by a potential prey more difficult. A blurred frequency signature, in turn, can also hamper the tracing of arachnids by a predator.
In centipedes, isopods, and other arthropods comprising similar serial locomotor systems, the legs are always coordinated in metachronal waves (Manton, Reference Manton1977; Lewis, Reference Lewis1981). However, in these species, metachronal wave patterns likely occur because of the necessity to avoid spatiotemporal interferences since locomotion dynamics are characterized by the largely concurring activities of numerous legs. With a metachronal wave locomotion pattern, the body automatically experiences small fluctuations only (Weihmann, Reference Weihmann2013). In arachnids, however, strong leg coupling and synchronization can be expected for species with elastic leg-extension mechanisms, such as solifuges and whip scorpions (Sensenig and Shultz, Reference Sensenig and Shultz2003), and have already been found for harvestmen (Sensenig and Shultz, Reference Sensenig and Shultz2006). These arachnids only use three leg pairs for propulsion though, while the remaining leg pair is predominantly used for sensing.
Mites as a model system for small fast running arachnids
In our experiment, a trombidid mite reached running speeds of up to 42 mm·s–1, which corresponds to about 50 body lengths per second. Neither the trombidid nor the gamasid mite showed strictly alternating sets of legs with low duty factors. The trombidid mite even desynchronized the activities of the legs acting jointly in quadrupedal sets when achieving their highest running speeds. However, Wu et al. (Reference Wu, Wright, Whitaker and Ahn2010) found alternating quadrupedal locomotion with duty factors of exactly 0.5 and apparently precisely alternating sets of legs in two mite species that populate hot semi-arid habitats. The same stepping pattern was proposed by Garwood and Dunlop (Reference Garwood and Dunlop2014) for trigonotarbids. However, since Wu et al. (Reference Wu, Wright, Whitaker and Ahn2010) did not comprehensibly describe how they measured the locomotion pattern, their findings are somewhat questionable. The teneriffiid mites examined by Wu et al. (Reference Wu, Wright, Whitaker and Ahn2010) were collected from debris and gravel and normally move on these substrates at temperatures between about 21°C and 55°C. On an enamelled dish, maximum running speeds exceeded 100 body lengths per second at surface temperatures between 40°C and 50°C. The body length of the mites was about 1 mm, their opisthosoma was not particularly bulky, and the legs are relatively long. Therefore, the COM was always well within the supporting polygons of the assumed quadrupeds (Fig. 1.3). For such small body sizes and high running velocities, the Reynolds number (Re) is small. Assuming a spherical shape of the body of equivalent projected area in the direction of motion, a rough estimate of the Reynolds number results in Re≈2. A Reynolds number close to 1 significantly increases aerodynamic drag relative to inertial force. As a result, these animals probably decelerate within a fraction of a stride when propulsion is absent, which prohibits aerial phases. These mites also exhibit an extraordinary maneuverability, which allows them to rotate their bodies by more than 100° in a single stride and to reaccelerate in the following stride (Wu et al., Reference Wu, Wright, Whitaker and Ahn2010). This capability may also be attributed to the high ratio of drag to inertial force and is supported by an advantageous scaling of leg-muscle forces. Assuming geometrical scaling, muscle forces scale with the second power of length while body mass scales with the third power. Small animals can therefore be much stronger relative to their body weight than larger animals. Moreover, to effectively overcome large drag forces repeated propulsive force maxima might be more suitable than nearly constant, but less-powerful propulsion generated by temporally distributed leg activities. Repeated force maxima, however, require the reported strict alternating stepping pattern with duty factors of 0.5. For larger and slower animals, such as the mites examined here, or trigonotarbids, strict coordination patterns as found in teneriffiid mites would not be optimal. It is therefore rather unlikely that they show similar locomotion patterns.
Conclusions
Locomotion in general and leg-coordination patterns, kinematics, and dynamics in particular cannot simply be deduced in extant arthropods from morphological measures alone. Even poorer prospects are to be expected for the reconstruction of extinct species. Comprehensive comparative studies regarding similarly shaped and adapted species with similar body mass and moving at similar speeds are indispensable to identify general locomotion paradigms, which then would also allow the application to extinct and cryptic species. Fairly realistic reconstructions of locomotion patterns and dynamics can be achieved if mechanical, physiological, and environmental constraints are taken into account. A detailed anatomical examination of the locomotor apparatus as a prerequisite supplemented by meaningful assumptions of muscle physiology and challenges imposed by the habitat structure would allow specifying of ecological limitations and capabilities of an extinct species. If all key species of an ecosystem were studied in this way, it would be possible to assess the interplay between them. This would provide insight into behavioral and ecological interrelations, even of ecosystems that existed hundreds of millions of years ago. However, biomechanical analyses can also foster the understanding of inaccessible extant species and ecosystems, particularly when the results are interpreted in behavioral and ecological contexts (see Arditti et al., Reference Arditti, Elliott, Kitching and Wasserthal2012).
Acknowledgments
We thank our reviewer, Jason Dunlop, for his constructive and professional way of dealing with the criticism inherent in the current manuscript, and Steven Hageman for encouraging us to submit the first draft of the manuscript. Moreover, we are indebted to Silvia Weihmann for proofreading the draft very thoroughly. Work on this manuscript was supported by the German Research Foundation (DFG) (We 4664/2-1 to TW).
Accessibility of supplemental data
Supplemental data deposited in Dryad data package: http://datadryad.org/handle/doi:10.5061/dryad.3bv13