

1.1 Background on UNCD Film Synthesis, Properties, and Applications
This chapter serves as the introduction of the focus of this book on the science and technological applications of a new material paradigm provided by a novel material in thin-film (coating) form named ultrananocrystalline diamond (UNCD™), which has enabled new generations of industrial, high-tech, and electronic-related products. In this respect, this chapter focuses on presenting a review of the status of the synthesis and properties of the UNCD film technology, originally developed and patented by a group of scientists (O. Auciello, D. M. Gruen, A. R. Krauss, and J. A. Carlisle), with a view to industrial and high-tech applications, and subsequently under R&D by Auciello’s group for biotechnological and medical devices/prostheses and medical treatment applications, which is the main topic of this book.
Early research on the growth and characterization of properties of diamond films provided valuable information for understanding the underlying physical [Reference Spitsyn, Bouilov and Derjaguin1, Reference Matsumoto, Sato, Tsutsumi and Setaka2], chemical [Reference Spitsyn, Bouilov and Derjaguin1, Reference Matsumoto3], and structural [Reference Spitsyn, Bouilov and Derjaguin1, Reference Hirose and Kondo4, Reference Kamo, Sato, Matsumoto and Setaka5] properties of the various diamond films, from single crystalline diamond (SCD) to microcrystalline diamond (MCD; ≥1 μm grain sizes) to nanocrystalline diamond (NCD; ~10–1000 nm grain sizes) films, which were synthesized by various different processes reported by several different groups [Reference Matsumoto6–Reference Butler and Sumant15]. The technique used to grow the SCD, MCD, and NCD films involved mainly the microwave plasma chemical vapor deposition (MPCVD) process, whereby a mixture of H2 (99%) and CH4 (1%) gases were flown in a chamber evacuated from air to relatively high vacuum (around ≤10–6 Torr), followed by coupling of microwave power to the gas mixture to create a plasma, producing CHxo and CHx+ (x = 1, 2, 3), C+ and Co species, and electrically neutral atomic Ho atoms and electrically charged H+ ions, which, interacting on the surfaces of substrates, produced the SCD, MCD, and NCD films. The large quantity of H inserted into the gas mixture was to produce neutral Ho atoms and H+ ions, which exhibit strong chemical reaction with open chemical bonds of C atoms on the surface of the graphite impurity phase that was observed to grow concurrently with the growth of the diamond phase [Reference Matsumoto6–Reference Butler and Sumant15], thus providing the means to minimize or practically eliminate the undesirable impurity graphite phase when growing the diamond films. However, the atomic neutral Ho atoms and H+ ions may also induce chemical etching of diamond nanograins (≤10 nm grain size), which are nucleated in the initial phase of MCD and NCD film growth, thus eliminating the possibility of growing polycrystalline diamond films with grain sizes ≤10 nm.
The next materials science breakthrough in relation to growing polycrystalline diamond films happened with the discovery of a new process to grow polycrystalline diamond films with grain sizes ≤10 nm. Gruen et al. [Reference Gruen, Liu, Krauss, Luo and Pan16–Reference Gruen18] demonstrated that by flowing Ar gas through an oven heated to ~900 °C to evaporate C60 fullerene molecules from powder, the Ar gas induced flow of C60 fullerene molecules (Figure 1.1) into an evacuated MPCVD chamber, where coupling of microwave power to the Ar/C60 fullerene molecules mixture induced cracking of the C60 fullerene molecules, releasing C atoms that upon landing on the surfaces of substrates produced the growth of polycrystalline diamond films with ≤10 nm grain size. The C60 fullerene molecule had been discovered previously in 1985 by H. W. Kroto, R. E. Smalley, and R. F. Curl, Jr. (1996 Nobel Prize Winners in Chemistry for this discovery, see review in [Reference Smalley19]).
Schematic of a fullerene molecule showing the football-type geometry of the molecule with C atoms on the corners of pentagon-type cells.

Although the use of C60 fullerene molecules produced the growth of polycrystalline diamond films with ≤10 nm grain size, this process was too expensive to produce polycrystalline diamond films for industrial applications, and in addition the need for an oven producing the gas-phase C60 fullerene molecules induced the formation of substantial amounts of carbon soot, which was not appropriate for being interconnected with a clean vacuum system, where the films were grown.
The next breakthrough in growing polycrystalline diamond films with grain sizes <10 nm happened through the discovery led by Gruen, Krauss, and Auciello [Reference Jiao, Sumant and Kirk20], which was based on replacing the H2 gas in the H2/CH4 gas mixture, used previously to grow from SCD to NCD films [Reference Matsumoto6–Reference Butler and Sumant15], with Ar gas (the less expensive inert gas on the market today) to produce an Ar (vol. 99%)/CH4 (vol. 1%) gas mixture in the MPCVD system, which resulted in the growth of polycrystalline diamond films with grain size in the range 3–5 nm, the smallest grain size of any polycrystalline diamond film today (see [Reference Jiao, Sumant and Kirk20], patent [Reference Naguib, Birrell, Elam, Carlisle and Auciello21], and reviews [Reference Auciello and Sumant22, Reference Shenderova and Gruen23], and Figure 1.4a,b). The R&D described in [Reference Jiao, Sumant and Kirk20–Reference Shenderova and Gruen23] superseded prior work that showed that diamond films grown by MPCVD, using mixtures of Ar (80–97%)/CH4 (1%)/H2 (19 to 2%), produced diamond films with grain sizes in the range 50–10 nm [Reference Zhou, Gruen, Qin, McCauley and Krauss24], respectively, as the H2 flux volume was reduced. Gruen, Krauss, and Auciello coined the name ultrananocrystalline diamond (UNCD) to designate the new polycrystalline diamond film with a grain size of 3–5 nm.
Auciello and Carlisle trademarked the name UNCD™ when founding Advanced Diamond Technologies, Inc. (founded in 2003, profitable in 2014, and sold for profit to a large company in 2019) [25]), the first and only company worldwide marketing UNCD-coated industrial products, as described below.
Auciello then led the founding of Original Biomedical Implants (OBI-USA 2013–present [26] and OBI-México 2016–present), which are currently developing revolutionary new generations of external and implantable medical devices (new long-life Li-ion batteries for a new generation of defibrillators/pacemakers with >10 times longer life and safer than the current technology – see Chapter 7), prostheses (UNCD-coated dental implants, hips, knees, and more – see Chapter 8) with superior performance to current metal-based devices and prostheses, which are corroded by body fluids sooner or later, resulting in the need for replacement earlier than desired, and other devices for medical applications, as reviewed in various chapters in this book. The UNCD coating provides the best biocompatible material for insertion in the human body, since UNCD is made of C atoms (the element of life in the DNA, cells, and molecules of every human body), and it exhibits the strongest resistance to mechanical wear [Reference Konicek, Grierson, Gilbert, Sawyer, Sumant and Auciello27] and chemical attack by body fluids [Reference Xiao, Wang and Carlisle28], and the lowest coefficient of friction compared to any biocompatible material [Reference Konicek, Grierson, Gilbert, Sawyer, Sumant and Auciello27], a condition very favorable for operation of any prostheses involving friction (hips, knees, and others).
Other breakthroughs in material-related science and development of the UNCD film technology include the following:
1. The discovery that incorporation of nitrogen atoms in grain boundaries of UNCD films, grown flowing a mixture of Ar/CH4/N2 gases for the MPCVD process, produced the first electrically conductive diamond film, via N atoms’ incorporation in UNCD grain boundaries, satisfying C atoms’ dangling bonds and providing electrons for electrical conduction through the large grain boundary network of the structure of the as defined N-UNCD film [29, 30].
2. The discovery that B atoms replacing C atoms in the UNCD lattice of the nanograins provides electrons to the electron energy conduction band, inducing true semiconductor-type doping, which yielded high electrical conductivity B-UNCD films that were inserted as a corrosion-resistant coating on metal electrodes in the first worldwide transformational electrolysis-based/ozone-generation/water purification system (DIAMONOX-Advanced Diamond Technologies) marketed by ADT [25]. The B-doping of UNCD coatings done by ADT, including the recent demonstration of the first process for low-temperature (460–600 °C) growth of B-UNCD by hot filament chemical vapor deposition (HFCVD) [Reference Zeng, Arumugam, Siddiqui and Carlisle31], a world-first for UNCD coatings, was recently reproduced by independent groups using the MPCVD process [Reference Yuan, Wu, Luo and Wu32]. The development of the B-UNCD films followed the early R&D on B-doping of crystalline and MCD and NCD films using MPCVD and HFCVD processes, based on H2/CH4 gas mixture chemistry (see [Reference Okano, Naruki and Akiba33–Reference Vernon, Swope, Butler, Feygelson and Swain36] and a recent review [Reference Srikanth, Kumar and Kumar37]). The problem with all MPCVD and HFCVD growth processes used to produce B-UNCD or B-SCD, B-MCD, B-NCD films is that the B-containing molecular precursors flown into the vacuum systems during diamond film growth result in contamination of expensive systems used for growing any type of diamond films, thus limiting those systems to growing only B-doped diamond films. In relation to this issue, Auciello’s group recently developed a post-grow diamond film doping with B atoms using an independent, relatively low-cost/dedicated rapid thermal annealing system, which produces B-UNCD films or any other B-diamond doped films with similar quality and high electrical conductivity as the B-doped diamond films produced by MPCVD and HFCVD growth processes, by simply inserting the diamond film with a spin-on-dopant (SOD) solution (Boroflim 100®) dispersed on the UNCD surface via a spinning speed of 3000 rpm and a process time of 20 s, and subjecting the surface-doped UNCD film to a rapid thermal annealing (RTA) process for ~10 s, which diffuses the B atoms into the UNCD film lattice to produce B-doped B-UNCD films [Reference Tirado, Acantar-Peña and de Obaldia38].
3. Development of a new process to grow UNCD films at the lowest temperature (~350–400 °C) [Reference Xiao, Birrell, Gerbi, Auciello and Carlisle39, Reference Carlisle, Gruen, Auciello and Xiao40] demonstrated for any diamond films at that time (early 2000s) and today, to enable integration with microelectronic devices based on complementary metal-oxide semiconductors (CMOS) technology requiring a thermal budget processing ≤425 °C. The integration of UNCD films with Si-based microchips was demonstrated by developing a hermetic/biocompatible/humor eye corrosion-resistant UNCD coating to encapsulate an Si-based microchip implantable in the eye as the main component of an artificial retina to restore partial vision to people blinded by genetically induced degeneration of photoreceptors (see [Reference Xiao, Wang and Carlisle28] and Chapter 2).
4. Discovery of basic materials/chemistry/physical processes to integrate dissimilar materials like high-dielectric constant (k) dielectrics and UNCD and MCD (e.g., UNCD or MCD/HfO2 [Reference Alcantar-Peña, Lee and Fuentes-Fernandez41]), ferroelectric/piezoelectric oxides/UNCD (e.g., PbZrxTi1-xO3/UNCD [Reference Sudarsan, Hiller, Kabius and Auciello42]; piezoelectric nitrides/UNCD (e.g., AlN/UNCD [Reference Zalazar, Gurman and Park43]), all enabling new generations of micro/nanoelectronic and microelectromechanical systems/nanoelectromechanical systems (MEMS/NEMS) devices, as described below.
The fundamental and applied material science on UNCD films, reviewed above, provides valuable information revealing that UNCD films exhibit a remarkable synergistic combination of exceptional mechanical, tribological, chemical, electrical, thermal, electron emission, and biocompatibility properties, which are being used to enable a new generation of multifunctional devices from the macro- to nanoscale:
1. The outstanding mechanical properties of UNCD films enable their application to produce a new generation of MEMS devices [Reference Auciello, Birrell and Carlisle44, Reference Auciello, Pacheco and Sumant45], including the first demonstrated UNCD/piezoelectric oxide films integration to produce piezoelectrically actuated UNCD-based MEMS actuators and sensors [Reference Sudarsan, Hiller, Kabius and Auciello42]; see also a review [Reference Auciello, Shenderova and Gruen46].
2. The chemistry and atoms bonding configuration of UNCD coating surfaces induce unique nanotribological properties resulting in outstanding resistance to mechanical wear and the lowest coefficient of friction demonstrated today in commercial products requiring low wear and friction, such as UNCD-coated mechanical pump seals and bearings and AFM tips (NaDiaProbesTM), providing practically wear-free/high-resolution AFM nanolithography and imaging capabilities, which are currently on the market commercialized by Advanced Diamond Technologies [25].
3. R&D has demonstrated that UNCD films exhibit excellent dielectric properties (as dielectric layers for RF MEMS switches [Reference Auciello, Pacheco and Sumant45]), which enable for the first time RF MEMS switches without failure as occurred in prior switch technologies involving dielectric layers made of SiO2 or Si2N3, which failed due to electrical charging (~80 µs) of the oxides and nitrides and long discharging times (hundreds of seconds), leading to sticking of the movable switch membrane to the dielectric layer on top of the bottom electrode, and thus failure [Reference Auciello, Pacheco and Sumant45]. In the case of the UNCD dielectric layer used in RF MEMS switches there is fast charging and discharging, both in ~80 µs, due to the large grain boundary network of the UNCD layer, thus eliminating the electrical charging failure [Reference Cheng, Lin and Chu45].
4. The outstanding electrical conductivity properties of nitrogen grain boundary incorporated UNCD (named N-UNCD) films [Reference Auciello and Sumant22, Reference Bhattacharyya, Auciello and Birrell29, Reference Gruen, Krauss, Auciello and Carlisle30] enables a new generation of metal electrodes for the new generation of implantable neural stimulation and Li-ion batteries (LIBs) with ≥10 times longer life and which are safer than current LIBs due to the corrosion-resistant N-UNCD coating of anodes and cathodes [47–48]. Alternatively to electrical conduction by nitrogen incorporation into the grain boundaries, highly conductive UNCD films have been achieved by doping of UNCD films, in the true sense of semiconductor doping, by inserting boron (B) atoms to replace C atoms in the diamond lattice, providing electrons to the conduction band as discussed above.
5. Excellent electric field-induced electron emission properties based on electric field-induced electron emission from UNCD film surfaces [Reference Cheng, Lin and Chu49, Reference Krauss, Ding and Auciello50–Reference Panda, Hyeok and Park52] enables field emitter cold cathodes [Reference Getty, Auciello, Sumant, George, Islam and Dutta53] and field emitter flat panel displays [Reference Garguilo, Koeck and Nemanich54].
6. Excellent chemical properties, demonstrated via surface functionalization of the UNCD films by electrochemical reduction of aryl-diazonium salts to enable growth of biomolecules on the UNCD surface [Reference Wang, Firestone, Auciello and Carlisle55].
7. Excellent biological properties, demonstrated by DNA-induced modification of UNCD thin-film surfaces [Reference Yang, Auciello and Butler56] that provide stable, biologically active scaffolds for biological cell growth and differentiation [Reference Bajaj, Akin and Gupta57, Reference Shi, Jin, Chen and Auciello58].
8. Excellent biocompatibility, demonstrated in the application of UNCD coatings for encapsulation of a microchip implantable in the eye to restore partial vision to people blinded by genetically induced death of photoreceptors [Reference Xiao, Wang and Carlisle28], and application to a new generation of implantable medical devices such as dental implants, artificial hips and knees, and many more prostheses that are implantable in the human body [Reference Auciello59].
All applications of the UNCD film (coating) technology require growing the films with the appropriate nanostructure mentioned above and described in detail in the following sections, which discuss the two main growth techniques: MPCVD and HFCVD.
1.2 Fundamentals of UNCD Film Synthesis via MPCVD and Properties
To grow diamond films on nondiamond substrates using MPCVD or HFCVD, or any other CVD method, it is necessary to induce a nucleation step. Two main methods have been developed and used over the years to condition the surface of substrates to grow diamond films:
1. Surface “seeding,” embedding diamond particles (with micro- or nanoscale dimensions) on the substrate surface via polishing with diamond-based polishing material or immersing the substrate in a container with a solution of micro- or nano-size diamond particles in methanol in an ultrasound wave-generating system such that the sound waves shake the diamond particles, embedding them on the substrate surface as “seeds” to induce the nucleation and subsequent growth of diamond films [Reference Spitsyn, Bouilov and Derjaguin1–Reference Gruen18, Reference Jiao, Sumant and Kirk20–Reference Zhou, Gruen, Qin, McCauley and Krauss24]. Following the seeding process, standard thin-film deposition methods based on MPCVD and HFCVD processes have been and are still used to grow diamond films, as discussed below.
2. The other process to nucleate and grow diamond films, which has been used more recently and is still being optimized to nucleate and grow films without using the wet chemical process, is the so-called bias enhanced nucleation-bias enhanced growth (BEN-BEG) process, whereby a negative voltage is applied to an electrically conductive substrate to attract positive ions of C+, CHx+, and other species that interact jointly on the substrate’s surface, inducing nucleation and growth of diamond films. A review of the synthesis of diamond films using MPCVD and HFCVD processes with both the chemical seeding and the BEN-BEG processes is discussed in this chapter.
1.2.1 Fundamentals on the Synthesis of MCD, NCD, and UNCD Thin Films via MPCVD with the Chemical Seeding Process
1.2.1.1 MPCVD Growth Process for MCD and NCD Films with the Wet Seeding Process
Growth of diamond films, using conventional wet seeding process, plus film growth using the MPCVD technique, involves several gas flow chemistries, resulting in different grain sizes of the diamond films. The hydrogen-rich chemistry (H2 (99.9 to 96%)/CH4 (1%)) [Reference Butler and Sumant15, Reference Butler and Windischmann60, Reference Prelas, Popovici and Biglow61] results in MCD (1–5 µm grains with columnar microstructure for ~1% CH4/2% Ar/97% H2 – see Figure 1.2a; and 0.5–1 µm grains for 1% CH4 /80% Ar /19% H2 – see Figure 1.2b) and NCD films (50–100s nm grains for ~1% CH4 /90% Ar/9% H2 – see Figure 1.2c; and 10–50–nm grains for 1% CH4/97% Ar/2% H2 – see Figure 1.2d).
Scanning electron microscope (SEM) micrographs showing grain sizes and surface morphology of diamond films grown with different CH4/Ar/H2 gas mixtures in the MPCVD process: (a) MCD film with rough surface morphology; (b) MCD film with less rough surface morphology than in (a); (c) and (d) NCD films with different grain size and surface morphology, depending on the increased Ar and decreased H2 percentage, as indicated in each subfigure.

High-quality NCD films can also be grown with relatively low methane percentages (0.3%) [Reference Prelas, Popovici and Biglow61]. The MCD and NCD films grown on surfaces seeded with conventional solutions of diamond micro- or nanoparticles, without proper functionalization to reduce agglomeration, experience the drawback of relatively low initial nucleation density (<1010/cm2). The MCD film surface coarsens with thickness, exhibiting a rough, highly faceted surface morphology with a root mean square (RMS) roughness generally ~10% of the film thickness. When an optimized seeding process and CH4 (0.3%) is used in the H2/CH4 gas mixture, at substrate temperatures in the range of 450–900 °C, very high nucleation densities are achieved (>1012/cm2) jointly with relatively smooth, high-quality NCD structure of film with various thicknesses [Reference Butler and Windischmann60]. In any case, there is no report in the literature of successful integration of NCD films with CMOS devices, which is a critical proof of low-temperature growth of diamond films, as demonstrated for UNCD films encapsulating an Si microchip implanted inside the eye as the main component of the Argus II device, which returns partial vision to people blinded by retinitis pigmentosa [Reference Xiao, Wang and Carlisle28]. The growth process related to the H2/CH4 chemistry is driven by CH3. radicals interacting on the substrate surface, involving hydrogen extraction from the radicals and ultimately resulting in C atoms’ chemical reaction with the surface to induce the growth of the NCD films. The atomic neutral H0 atoms and H+ ions generated in the plasma induce preferential etching of a graphitic phase that co-deposits with the diamond phase. Unfortunately, the H0 atoms and H+ ions also induce chemical etching of the diamond phase, specifically nanograins that try to continually nucleate. However, the etching of the diamond nanograins by the H0 atoms and H+ ions occurs at a much lower rate (~50 times) than for graphite, resulting in the formation of intergranular voids and columnar morphology with large grains (≥1 µm). The grains of MCD (1–5 µm) and NCD (10–100s nm) films are much and a medium step larger, respectively, than those of the UNCD films (3–5 nm), which are the main topic of this chapter (compare Figures. 1.2a–d and Figure 1.4).
The MCD films produced by the MPCVD process exhibit high residual compressive stress, poor intergranular adhesion, and very rough surfaces (see Figures 1.2a,b). Consequently, MCD films are not well suited, for example, to producing MEMS/NEMS structures with smooth surfaces and sharply defined geometries. In addition, MCD films exhibit high coefficient of friction due to high roughness, which makes them inappropriate for applications such as coating of prostheses (e.g., hips, knees, and others), which requires a low coefficient of friction. The grain size can be reduced to 10–100 nm, characteristic of films typically known as nanocrystalline diamond, by inserting Ar gas into the mixture and reducing the H2 percentage, thus increasing the CH4/H2 ratio in the plasma. This process produces a smoother surface than for MCD films, but at the cost of increased nondiamond components at the grain boundaries [Reference Kohn, Gluche and Adamschik62]. There is also another class of NCD film with high sp3 content which is grown with the CH4/H2 gas chemistry with relatively low CH4 content (0.3%) using a special diamond seeding/nucleation process [Reference Rotter, Yoshikawa, Koga, Tzeng, Klages and Miyoshi63], but these films exhibit the NCD structure only when the film thickness is limited to <100 nm [Reference Sumant, Grierson and Konicek64], while for thicker films grain coarsening dominates due to practically no renucleation and film growth with columnar structure, resulting in increasing grain size and roughness as the film thickness increases.
1.2.1.2 MPCVD Growth Process for UNCD Films with the Conventional Wet Seeding Process
Growth, Structure, and Chemical Characterization of Insulating UNCD Films
Growth Process.
Contrary to the growth process for MCD and NCD films described above, the UNCD films, discussed in this chapter, were first produced by the MPCVD process, but in recent years the HFCVD process was also developed to produce high-quality UNCD films, as discussed in this chapter. The original MPCVD process used to grow UNCD films was based on gas mixture flowing into an air evacuated chamber, and involved – and still involves – a novel Ar-rich chemistry (Ar [99%]/CH4 [1%]) with no H2 gas flow in the system [Reference Jiao, Sumant and Kirk20–Reference Shenderova and Gruen23, Reference Krauss, Ding and Auciello50] and in more recent years including also extremely small H2 gas flow (≤1%). In both cases, it was determined, using in situ/real-time optical emission spectroscopy imaging of the MPCVD plasma, generated with the Ar/CH4 chemistry, that carbon dimers (C2) are produced in the plasma (inducing a green color to the plasma from the light emission from the excited C2 dimers) generated by the MPCVD process, from methane decomposition, via reactions (1.1) and (1.2):
 (1.1)
 (1.2)
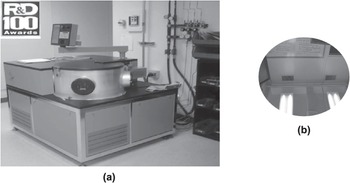
Although the Ar-rich/CH4 plasma induces the formation of a complex mixture of carbon (C2 dimers) and hydrocarbon molecules (CHx, with x = 1, 2, and 3), the C2 dimers have been proposed and demonstrated to play a critical role in the UNCD nucleation and growth process (see review in [Reference Auciello and Sumant22]). Calculations predict that C2 dimers have low activation energy (~6 kcal/mol) for insertion into the surface of substrates to induce nucleation and subsequent growth of UNCD films, thus establishing the unique growth process of the UNCD films. However, recent modeling indicated that while the C2 population in the plasma is high, the population near the surface may be lower, and other hydrocarbon radicals (e.g., C2H2) may also contribute to the growth of UNCD films [Reference May, Harvey, Smith and Mankelevich65, Reference May, Allan, Ashfold, Richley and Mankelevich66]. However, the model [Reference May, Allan, Ashfold, Richley and Mankelevich66] is related to the growth of diamond films produced by MPCVD using a mixture of Ar∕CH4∕H2 gases, which, as shown in Figure 1.2, does not produce the unique UNCD structure (with 3–5 nm grains) grown by MPCVD with the Ar/CH4 chemistry [Reference Naguib, Birrell, Elam, Carlisle and Auciello21–Reference Shenderova and Gruen23]. In addition, the model could not fully explain the low-temperature growth of UNCD films as demonstrated for UNCD film growth at ~400 °C [Reference Xiao, Birrell, Gerbi, Auciello and Carlisle39, Reference Carlisle, Gruen, Auciello and Xiao40]. Clearly, more experimental and modeling studies are needed. Regardless of the mechanism, the distinctive characteristic of the UNCD film growth process is that the plasma contains very small quantities of hydrogen, which arise mainly from the thermal decomposition of methane to acetylene in the plasma (about 1.5%) and eventual addition of an extremely small amount of H2 (≤1%). The MPCVD process is implemented in small research and, most importantly, industrial-type systems, like the ones operating in Auciello’s group laboratory at UTD and the company OBI-México (Figure 1.3a), which grows UNCD, NCD, and MCD films on up to 200 mm diameter substrates (Figure 1.3b) with outstanding uniformity in thickness (≤1%) and nanostructure.
(a) Industrial MPCVD system (IPLAS-Germany); (b) Si wafer (200 mm diameter) coated with outstanding uniform UNCD film.

A critical outcome of the nucleation and growth processes for UNCD films is that they are the only diamond films that have been demonstrated to grow at temperatures as low as 350–400 °C [Reference Xiao, Birrell, Gerbi, Auciello and Carlisle39, Reference Carlisle, Gruen, Auciello and Xiao40], as determined not only by in situ substrate temperature measurements during growth [Reference Auciello and Sumant22, Reference Xiao, Birrell, Gerbi, Auciello and Carlisle39, Reference Carlisle, Gruen, Auciello and Xiao40], but most importantly by the demonstration that CMOS devices exhibit practically the same performance before and after growing UNCD film on them [Reference Xiao, Wang and Carlisle28, Reference Sumant, Auciello and Yuan67]. Similar demonstration of low-temperature NCD films integration with CMOS devices has not been published in the open literature yet. The demonstrated integration of UNCD films with CMOS devices is paving the way for the integration with CMOS for the development of monolithically integrated UNCD-MEMS/NEMS/CMOS devices, as recently demonstrated [Reference Sumant, Auciello and Yuan67], and for encapsulation of Si microchips implantable inside the eye [Reference Xiao, Wang and Carlisle28] or other parts of the human body.
Structure Characterization.
The nucleation and growth process described above produce the UNCD films with the name based on the equiaxed 3–5 nm grains dimension and 0.4 nm wide grain boundaries for undoped insulating UNCD films grown both at 800 °C (Figure 1.4a) and 400 °C (Figure 1.4b), which exhibit extremely smooth as-grown surfaces (~3–5 nm) (Figure 1.4d) when using optimized seeding techniques.
High-resolution transmission electron microscopy (HRTEM) images of UNCD films grown by MPCVD at 800 °C (a) and 400 °C (b), showing the unique grain structure (3–5 nm dimensions) of UNCD produced at both temperatures, confirmed by statistical grain size measurements (c). (d) Cross-section SEM images of an Si tip coated with UNCD films grown by the MPCVD process described above, with thicknesses from 0.1 µm to 2.4 µm, showing that the surface roughness remains in the range 3–5 nm independently of the film thickness.

Chemical Characterization.
The UNCD films grown by MPCVD were and are characterized by Raman analysis, to provide information on the chemical bonds of the C atoms in the grains and in the grain boundaries. Raman spectroscopy is a nondestructive chemical analysis technique that provides detailed information about the chemical bonds of atoms in a material, distinguishing the atomic bonds in a crystal-type structure such as crystalline diamond and other structures such as the noncrystalline structure of grain boundaries in polycrystalline diamond films. Raman analysis is based on the interaction of light with the chemical bonds of molecules within a material, such that light induces excitation of electrons in the electronic cloud around the atomic nuclei in molecules, producing displacement of the negatively charged electrons with respect to the positively charged nucleus, inducing molecular vibration and causing a “change in polarizability” of the molecule, such that the induced dipole emits or scatters light at the optical frequency of the incident light wave, and the scattered light detected in a detector provides the information on the chemical bonds of the atoms (see a recent review in [Reference Weber and Merlin69]).
Raman spectroscopy is the most widely used technique to confirm the sp3 chemical bonds of C atoms in the diamond crystalline lattice and sp2 C atoms bonds in the grain boundaries of the films. It is a nondestructive technique, often used to determine the nanostructure of carbon thin films due to its ability to discriminate between the presence of sp2- and sp3-bonded carbon, as well as the local bonding environment of the carbon itself in some cases. Difficulty arises when Raman spectroscopy is used to examine the structure of carbon films with a mixture of sp2- and sp3-bonded carbon in a number of different bonding configurations that possess different short- and long-range order, as is found in nanocrystalline diamond and amorphous carbon films. When a laser with a wavelength in the visible region is used (e.g., 632 nm, 535 nm), the energy of the incident photons is much lower than the energy of the band gap for sp3-bonded carbon, resulting in a much larger Raman scattering cross-section for sp2-bonded carbon than for sp3-bonded carbon due to the well-known resonant Raman effect [Reference Weber and Merlin69]. The spectra observed are thus completely dominated by Raman scattering from the sp2-bonded C atoms, even when a significant amount of the C in the sample, like in UNCD films, is sp3-C bonded in the small diamond crystalline grains, but with a large network of grain boundaries with sp2-C atom bonds (Figure 1.5a,b, with a wide peak around ~1560 cm–1) [Reference Birrell, Gerbi and Auciello70]. For polycrystalline diamond films grown with less than 10% H2 in the plasma (Figure 1.5a), the fingerprint peak of diamond at 1332 cm–1 practically disappears, and the visible Raman signal is dominated by the sp2-bonded C atoms at the grain boundaries. Several distinct broad peaks can be seen for the films: at 1140, 1330, 1450, and 1560 cm–1. The peak at 1560 cm–1 corresponds to the G mode Raman peak, which arises from the in-plane stretching modes of the sp2-bonded C atoms at the grain boundaries of UNCD [Reference Birrell, Gerbi and Auciello70]. On the other hand, the 1330 cm–1 broaden peak is attributed to D band-type stretching of C atom bonds in the grain boundaries. In disordered sp2-bonded C atoms, D band stretching arises from the breathing modes in small aromatic clusters. The argument for the assignment of the broad peak at 1330 cm–1 to the sp2-bonded C atoms’ D band is based on the fact that the peak is absent from the UV Raman spectra (Figure 1.5b). The D peak is believed to arise from a double resonant Raman process (incident photon wave vector k = 0.5q), where the intensity is highest for low-energy excitation and decreases strongly with increasing excitation energy. In order to see the diamond peak at 1332 cm–1, even for UNCD films, UV laser needs to be used for the Raman analysis (Figure 1.5b). The peaks observed in the UV Raman spectra at 1550 cm–1 and 1560 cm–1 are mainly due to sp2-C atoms bonding in the grain boundaries [Reference Birrell, Gerbi and Auciello70].
(a) Raman spectra obtained with a laser beam wavelength in the visible range, showing the diamond peak at 1332 cm–1 only for NCD films grown with H2 flow ≥5%. (b) Raman spectra obtained using a laser beam with UV wavelength, for the same polycrystalline diamond films analyzed with the visible laser (a), such that the UV laser enables seeing the diamond peak at 1332 cm–1, even for the UNCD film grown with H2 flow of 0%.

The confirmation that the dominant sp2-C atoms bonds are not from an impurity graphite phase (i.e., parallel planes formed by hexagonal unit lattice with C atoms on the corner) is provided by near-edge X-ray absorption fine structure spectroscopy (NEXAFS) done on UNCD, MCD, and a crystal diamond gem. Core-level photo absorption has been used to characterize the empty electronic states of a wide variety of materials [Reference Stohr71]. Specifically, the near-edge electronic energy band region of the photo-absorption process has been used to determine the relative quantity of sp2- or sp3-C atoms bonding in several powders and thin films [Reference Stohr71]. The technique is known by several acronyms, including NEXAFS and XANES (X-ray absorption near-edge spectroscopy). Its sensitivity to the local atomic bond order in a material arises from the dipole-like electronic transitions from core atoms’ electronic states, which have well-defined orbital angular momenta, into empty electronic (e.g., antibonding) states. The symmetry of the final state can be determined, and thus the difference between sp2 (n-like) or sp3 (a-like) bonding can be readily observed in covalent, low-z materials such as diamond.
The NEXAFS spectra show the characteristic spectrum of crystalline diamond for UNCD, MCD, and a diamond gem (Figure 1.6a), which is completely different from the NEXAFS spectrum done on a pure graphite film (Figure 1.6a) [Reference Zuiker, Krauss and Gruen72].
(a) NEXAFS spectra from UNCD, MCD, and crystal diamond, showing that they are all identical and do not have graphite impurity, demonstrated by no graphite peak as shown in the graphite NEXAFS spectrum reference. (b) NEXAFS spectra from several UNCD films grown at different temperatures in the range 250–800 °C, showing that all UNCD films have the same chemistry and structure.
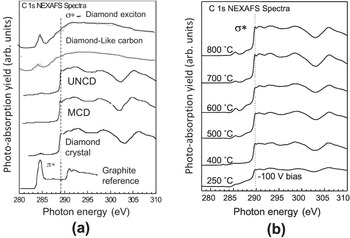
In addition to the NEXAS analysis, electron diffraction from HRTEM done on UNCD films grown at 800 °C and 400 °C (see Figure 1.4a,b) confirm that the UNCD films are made of crystalline diamond nanograins, and no impurity graphite phase is present. Relevant information given by the NEXAFS analysis is that UNCD films grown at different temperatures in the range 250–800 °C exhibit the same chemistry and nanostructure (Figure 1.6b). It is important to note that Figure 1.6b shows that UNCD films may be grown by MPCVD at ~250 °C, which may enable coating polymers used in biomedical devices such as glaucoma valves used to drain humor of the eye from people suffering from glaucoma, to keep eye pressure stable, or in polymer soft contact lenses. Both of these case require hydrophobic (liquid-rejecting) surfaces to minimize or eliminate protein and other biomolecule adsorption on normally hydrophilic (liquid-adsorbing) polymer surfaces, to avoid undesirable effects such as clogging of the humor’s eye-draining tubes in glaucoma valves, or the need for frequent cleaning of polymer contact lenses’ surfaces due protein adsorption (see review in [Reference Auciello59]). On the other hand, it has been demonstrated that hydrophilic UNCD film surface provides an excellent scaffold for embryonic cell growth and differentiation for developmental biology [Reference Shi, Jin, Chen and Auciello58]. In relation to hydrophilic vs. super-hydrophobic UNCD films’ surfaces, recent R&D has demonstrated that the surface of UNCD films can be tailored from super-hydrophilic surfaces, for scaffolds for developmental biology, to super-hydrophobic surfaces for medical devices, as just described.
To finish this section reviewing the growth of UNCD films using the conventional wet chemical seeding plus MPCVD processes, it is relevant to give a brief review of recent research [Reference Tirado, Alcantar-Peña, de Obaldia, Garcia and Auciello73], focused on exploring, in a systematic series of studies, the combined effect of total gas pressure (20–80 mbar), precursor gas chemistry (Ar/CH4/H2), and microwave power on the grain size, atoms’ chemical bonding, and growth rate of polycrystalline diamond films grown by MPCVD [Reference Tirado, Alcantar-Peña, de Obaldia, Garcia and Auciello73], with a particular focus on determining the conditions that can produce UNCD films even with the inclusion of H2 gas flow in the gas chemistry. Figure 1.7 shows a series of SEM images and Raman analysis spectra which provide very revealing information about the mechanism for growing UNCD to MCD diamond films using a tailored combination of gas chemistry and flows, total pressure and power in the MPCVD process. For a gas chemistry of H2 (98%)/CH4 (2%), the film grown at 20 mbar total pressure for 2 h was only ~60 nm thick (Figure 1.7a – right) and the surface morphology was characteristic of NCD film structure, with grains ~14 nm, as calculated from the Debye–Scherrer equation using parameters from XRD measurements (Figure 1.7a – left), mainly due to the fact that at low pressure the amount of C-based species is much lower than for the higher pressures, resulting in a film with initial nucleation nanoscale grains. SEM imaging of films grown at 40 mbar pressure (not shown here – see figure 3b in [Reference Tirado, Alcantar-Peña, de Obaldia, Garcia and Auciello73]), also for 2 h, showed a thickness of ~850 nm and grain size also of ~14 nm. Figure 1.7b,c shows that films grown at 60 mbar and 80 mbar pressure, with the same H2 (98%)/CH4 (2%) chemistry, for 2 h, exhibit the highest thickness (~2500 nm) and grain size of ~230 nm, and 1500 nm thickness and ~230 nm grain size, respectively. The Raman spectra of the films grown at 20 and 40 mbar show the typical low end of NCD (~14 nm) structure, close to UNCD (3–7 nm [Reference Auciello and Sumant22]) (Figure 1.7d), while the Raman spectra of the films grown at 60 and 80 mbar (Figure 1.7d) show a small, sharp peak at 1332 cm–1, indicative of the more noticeable sp3-type C atomic bond from diamond, indicative of grain sizes in the hundreds of nanometer range, as described above (see figures 3 and 4 in [Reference Tirado, Alcantar-Peña, de Obaldia, Garcia and Auciello73]). XRD analysis of the polycrystalline diamond films (Figure 2b in [Reference Tirado, Alcantar-Peña, de Obaldia, Garcia and Auciello73]) reveal only peaks corresponding to diamond, indicating that no graphite was formed in any of the grown films. The intensity of the peaks increased with increasing pressure, indicative of thicker films with larger grains due to grain growth with film thickness.
The SEM images of films grown with different chemistries, as indicated in Figures 1.7e–g and the corresponding Raman spectra (Figure 1.7h) indicate that films grown with H2 concentrations of 0–12% (Ar 98–86%) show the typical UNCD/small NCD structures with grain sizes in the range 2–10 nm [Reference Auciello and Sumant22, Reference Shenderova and Gruen23]. On the other hand, in the Raman spectra of the films grown with H2 concentrations of 73–98% (Ar 25–0%), in addition to the bands discussed above, a peak appears at 1332 cm–1, attributed to sp3-C bonds of diamond [Reference Fuentes-Fernandez, Alcantar-Peña and Lee74, Reference Filik75], indicating that the grain size increased significantly in the diamond films by increasing the H2 concentration during growth. XRD analysis shows only peaks attributed to diamond.
SEM top view and cross-section images of MPCVD-processed polycrystalline diamond (PCD) films grown at (a) 20, (b) 60, and (c) 80 mbar using a gas mixture composition of H2 (98%)/2% CH4 and microwave power of 1900 W. (d) Raman spectra corresponding to the PCD films, for which SEM images are shown in (a)–(c). Top view and cross-section SEM images of PCD films grown with different Ar/CH4/H2 compositions as (e) 0%/2%/98%, (f) 86%/2%/12%, (g) 98%/2%/0%, with total pressure of 60 mbar and 1900 W of microwave power. (h) Raman spectra corresponding to the PCD films, for which SEM images are shown in (e)–(g). Top view and cross-section SEM images of PCD films grown at (i) 1900 W, (j) 2200 W, and (k) 2500 W using gas composition of H2 (98%)/CH4 (2%) at a total pressure of 60 mbar. (l) Raman spectra corresponding to the PCD films, for which SEM images are shown in (i)–(k).

The data shown in Figure 1.7 indicate that films with structure close to UNCD can be grown by MPCVD, even when using H2 gas flow under specific percentages in combination with Ar and CH4 gases, but only for very thin films, correlated with the initial nucleation of NCD to MCD films, while for films grown with substantially higher thickness the MCD structure is developed. This statement is confirmed by diamond films grown with H2 (98%)/CH4 (2%) at 60 mbar and microwave power of 2500 W, but increasing the growth time to 6 h, since it has been reported in the literature that the film grain size increases with growth when using the HFCVD technique, which demonstrated MCD films [Reference Fuentes-Fernandez, Alcantar-Peña and Lee74]. Figure 1.8a shows a Raman spectrum of a large grain size MCD film, while Figure 1.8b shows the top surface SEM image of the same MCD film, grown by the MPCVD process for 6 h using a gas mixture of H2 (98%)/CH4 (2%) at 60 mbar pressure and 2500 W microwave power. Both figures show clearly an MCD structure.
(a) Raman spectrum and (b) SEM top view image of an MCD film grown using the MPCVD process with a gas mixture of H2 (98%)/CH4 (2%), 60 mbar pressure, 2500 W microwave power, 6 h growth time [Reference Tirado, Alcantar-Peña, de Obaldia, Garcia and Auciello73].
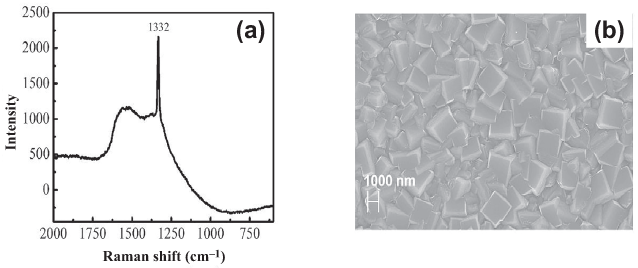
Figure 1.8 confirms the hypothesis that the growth time, using H2-rich/CH4 gas chemistry, induces the development of an MCD film structure due to grain growth.
1.2.1.3 MPCVD Growth Process for UNCD Films via the BEN-BEG Process
Background on MPCVD BEN-BEG of MCD and NCD Films
The new BEN process to nucleate PCD films was investigated and developed, first focused on growing MCD and NCD films. The BEN process provides an alternative to the chemical diamond seeding process discussed in Section 1.2.1.2. The initial research focused on doing BEN followed by film growth without bias [Reference Stoner, Ma, Wolter and Glass76, Reference Gerber, Sattel and Ehrhardt77]. One of the key initial works on BEN for growing MCD/NCD films [Reference Gerber, Sattel and Ehrhardt77] revealed an enhanced nucleation density of diamond structure (1011 cm–2) on virgin silicon wafers vs. 107 cm–2 on Si wafers seeded with diamond particles via mechanical polishing of the Si surface with diamond particles, both followed by growth of MCD and NCD films without bias. The research described in [Reference Stoner, Ma, Wolter and Glass76] revealed that if the substrate bias was on during diamond film growth, the resulting film exhibited very poor structural quality compared with films grown without bias after the BEN process. Analysis of diamond films, presented in [Reference Stoner, Ma, Wolter and Glass76], showed that a complete SiC template layer developed on the Si substrate surface before the diamond structure appeared on the film. Research from another group [Reference Gerber, Sattel and Ehrhardt77] involved growing MCD/NCD films using BEN (2–30 min), accelerating C+ and CHx+ ions from plasmas produced with CH4/H2 gas mixtures (gas pressure of 20 mbar and 800 W microwave power) via substrate biases with voltages in the range –150 V to –350 V. The bias was then turned off and the films were grown by the conventional unbiased MPCVD process for about 30 min, with the substrate temperatures in the range 650–800 °C. The results of the film growth process reported in [Reference Gerber, Sattel and Ehrhardt77] provided evidence that nucleation density of PCD films reached a maximum at a bias for which the ion energy distribution exhibited a maximum of 80 eV, independent of the substrate temperature. This effect was interpreted as providing evidence that the BEN process involves C+ ions sub-plantation underneath the substrate surface, leading to C atoms’ reaction with the Si substrate to form the SiC layer nucleation to induce the diamond film growth. Cross-section HRTEM imaging showed that the Si interfacial layer involved Si pyramidal structures (see figure 16 in [Reference Gerber, Sattel and Ehrhardt77]) on top of which SiC interfacial layers were nucleated during the BEN process. However, no explanation was provided for the mechanism for formation of the Si pyramidal structures. In addition, the HRTEM images revealed amorphous-like layers between the pyramidal structures, with thickness in the range 10–100 Å. Raman analysis and XRD presented in [Reference Gerber, Sattel and Ehrhardt77] indicated that the MCD/NCD films/Si interface produced by BEN consists substantially of sp2-C atoms bonded to noncrystalline carbon between the Si pyramidal structures. The presence of the (0002) XRD peak from the interlayer between the Si pyramidal structures indicates that the carbon interlayer is primarily graphitic. The early work involving BEN plus BEG processes, using CH4/H2 chemistries, produced NCD (30–150 nm grains) cluster and not fully dense films (see figure 15 in [Reference Gerber, Sattel and Ehrhardt77]), relatively high surface roughness, high compressive stress, delamination of the film, and high content of nondiamond phase [Reference Stoner, Ma, Wolter and Glass76, Reference Gerber, Sattel and Ehrhardt77].
Subsequent relevant research was focused on investigating the effect of key parameters on the nucleation of NCD films using the BEN process [Reference Lee, Lin, Chia, Cheng and Lin78]. This research [Reference Lee, Lin, Chia, Cheng and Lin78] revealed a relevant parameter, which is the evolution of electron emission current from the substrate surface during film nucleation, which rises from practically zero to a stable value once the film has been nucleated (see Figure 1 in [Reference Lee, Lin, Chia, Cheng and Lin78] and Figure 1.9a in this chapter). The results reported in [Reference Lee, Lin, Chia, Cheng and Lin78] showed that the time for the electron emission current to reach a steady state, and thus BEN of the NCD films, changed from ~82 min for a CH4/H2 gas ratio of 3% to ~10 min for a CH4/H2 gas ratio of –15% [Reference Lee, Lin, Chia, Cheng and Lin78]. On the other hand, the electron emission current change from zero to steady state changed from ~70 min for a total gas pressure of 40 Torr to ~10 min for a total gas pressure of 55 Torr [Reference Lee, Lin, Chia, Cheng and Lin78]. Finally, plasma power is the parameter that induces the smallest change in the time for electron emission current stabilization, from ~30 min for 1000 W to ~6 min for 1500 W. This work indicated that a key parameter in the demonstrated BEN process for MCD and NCD films is the amount of C+ and H+ ions contained in the plasma.
MPCVD BEN-BEG of UNCD Films
The early work on BEN-BEG of UNCD films was done first when exploring growing UNCD films with CH4/N2/very small H2 gas mixtures in an MPCVD process [Reference Ding, Krauss and Auciello79], but because it was focused on producing UNCD films with N atoms in grain boundaries to develop electron field emission (EFE) devices, it will be described in detail in Section 1.2.1.4, discussing the synthesis of N-UNCD films. Subsequently, two groups demonstrated BEN processes to grow UNCD films using the patented [Reference Naguib, Birrell, Elam, Carlisle and Auciello21] CH4/Ar gas mixture in the MPCVD process. One group demonstrated that BEN UNCD films, followed by growth without bias on Si substrates, exhibit stronger adhesion to the Si substrate’s surface than for UNCD films grown on chemically seeded Si surfaces [Reference Lee, Lin and Lin80]. Such an effect was attributed to the relatively high kinetic energy of C+ ions extracted from the plasma and accelerated to the Si substrate surface, which easily form covalent bonding, Si–C, and bond strongly to both the Si and diamond. The work reported in [Reference Gerber, Sattel and Ehrhardt77] did not include HRTEM, which is critical to understand the nanoscale structures of the nucleation layer and the UNCD films.
Auciello’s group [Reference Chen, Zhong and Konicek81] first performed R&D to develop a low-pressure BEN-BEG process to grow UNCD films using the MPCVD-based BEN-BEG technique, with the parameters described below. The low-pressure BEN-BEG process described in [Reference Chen, Zhong and Konicek81] involved several steps: (1) etching of the natural SiO2 layer on the surface of an Si (100) substrate for 10 min in a pure H-based plasma, with a substrate biased at –350 V; (2) in situ BEN-BEG using a H2 (93%)/CH4 (7%) gas mixture (the idea of using the H2/CH4 plasma chemistry was based on the hypothesis that having more H0 atoms and H+ ions in the plasma could help etch the impurity graphitic phase that in many cases grows concurrently with the diamond phase when growing NCD films [Reference Stoner, Ma, Wolter and Glass76–Reference Lee, Lin, Chia, Cheng and Lin78]). The UNCD film was grown using a plasma produced by 2.2 kW microwave power at low 25 mbar pressure and applying –350 V bias on a substrate heated to 850 °C in a 2.45 GHz, 6-inch IPLAS CYRANNUS MPCVD system [Reference Chen, Zhong and Konicek81]. The BEN-BEG process described here yielded UNCD films with low stress, smooth surfaces (~4–6 nm), high growth rates (~1 µm/h), and uniform grain size (3–7 nm) throughout the film area on 100 mm diameter Si wafers (Figures. 1.9 and 1.10) [Reference Chen, Zhong and Konicek81].
Bias current density (Je) vs. time curves acquired under constant bias during BEN-BEG of UNCD films showed an abrupt increase of Je after an incubation period of about 5 min and saturation at ~4.5 mA/cm2 at 15 min after the onset of the BEN process. The abrupt increase and subsequent saturation of Je can be attributed to the rapid growth of diamond nuclei and subsequent full coverage of the substrate surface by the diamond grains, respectively (see detailed discussion in [Reference Chen, Zhong and Konicek81]). The surface roughness of a 1 µm thick BEN-BEG UNCD film was ~10 nm rms over a ~10 µm2 area after Je reached steady state, then reduced to ~6 nm rms after 60 min (Figure 1.9f), as revealed by AFM analysis (Figure 1.9c) [Reference Chen, Zhong and Konicek81].
(a) Electron field emission current from biased substrate vs. BEN-BEG time for UNCD film growth, showing increase from 0 to stable 4.5 mA/cm2 value (line curve) and UNCD film grain size reduction from ~10 to 6 nm (dots) as the film reaches dense structure (d). SEM images of UNCD film surface at 15 min (b), 30 min (c), and 60 min (d) BEN-BEG process. (e) AFM measurement of UNCD film surface roughness (~6 nm rms); (f) cross-section SEM image of dense BEN-BEG uniform UNCD film on 100 mm diameter Si surface, showing 1 µm thickness in 60 min growth. (g) Schematic of plasma on negatively biased substrate holder with 100 mm diameter Si wafer, accelerating positively charged atomic and molecular ions toward an Si substrate surface to produce a uniform UNCD film on a 100 mm diameter Si wafer [Reference Chen, Zhong and Konicek81].

(a) HRTEM image of BEN-BEG grown UNCD film shown in Figure 1.9. (b) Statistical number of grains vs. grain size measured on several areas of the UNCD film. (c) Electron diffraction pattern showing the presence of the diamond structure.

Studies of the UNCD–Si interface for a BEN-BEG UNCD film on a Si substrate, using cross-sectional HRTEM, revealed the UNCD grains, an etching effect on the Si surface and the UNCD–Si interfacial layer, revealing the formation of a triangular profile on the surface of the Si substrate (Figure 1.11a) with a peak-to-valley roughness of about 15 nm. The same triangular Si surface morphology was observed previously, although without explanation, on a silicon surface during BEN followed by no-bias growth of NCD isolated grains on an Si surface [Reference Gerber, Sattel and Ehrhardt77]. The work reported in [Reference Chen, Zhong and Konicek81] indicates that H+ ion bombardment during the SiO2 layer-cleaning process results in preferential etching of the Si surface along the (100) crystallographic direction, which etches faster than the (111) direction due to a higher physical sputtering rate of the (100) direction, as shown in prior work on physical sputtering of Si surfaces [Reference Auciello and Kelly82]. The physical-dominated etching process may be enhanced by chemical reactions of H atoms with Si atoms on the surface of the Si substrate. This physical-dominated mechanism for etching of the Si surface results in the triangular Si interface profile defined by the (Reference Coffman, Cao and Pianetta111) planes. The cross-section HRTEM image in Figure 1.11a reveals a preferential nucleation of nanoscale SiC structures (~5 nm thick) on the tip of Si pyramidal structures, which induce the nucleation and growth of the UNCD grains at the peaks of the Si pyramidal structures. Simultaneously, a-C/graphitic phases appear to nucleate at the valleys between the Si pyramidal structures (Figure 1.11a). The UNCD grains nucleated at the peaks of the Si pyramidal structures rapidly extend sideways, covering the a-C and graphite phases grown in the valleys with (0001) planes approximately perpendicular to the Si (Reference Prins100) surface (Figure 1.11a). Figure 1.11e shows a schematic of the mechanism of BEN-BEG growth for UNCD films, which correlates with the observation provided by the cross-section HRTEM, which shows the nucleation of SiC on top of the Si pyramidal structures that induce the subsequent growth of the UNCD film, expanding sideways and covering the graphite areas nucleated between the pyramidal structures. Figure 1.11f shows UNCD films grown by the BEN-BEG process on sharp Si tips for EFE devices. Figure 1.11g shows growth of UNCD films on vertically positioned Ti-alloy-based dental implants in the industrial MPCVD systems shown in Figure 1.3a, using the BEN-BEG process, which provides the means for massive simultaneous coating of many dental implants at low cost because of the elimination of the time-consuming and more expensive chemical seeding process.
Confirmation of the interpretation of the nature of the materials in the areas revealed in the HRTEM images of Figure 1.11a was obtained through two types of systematic studies [Reference Zhong, Chen and Tai83]:
1. Localized electron diffraction in each particular region:
Figure 1.11b: electron diffraction on Si, showing the Si diffraction peaks;
Figure 1.11c: electron diffraction on UNCD film, showing the diamond diffraction peaks;
Figure 1.11d: electron diffraction on the graphite (G) area between Si pyramidal structures, showing the graphite peaks.
2. Systematic studies were performed to confirm the electron diffraction information, using HRTEM in situ electron energy loss spectroscopy (EELS) [Reference Zhong, Chen and Tai83]. This technique enables performing EELS spectroscopy along the length extension through the materials to obtain information on atomic chemical bonds along the pathway. Initially, general EELS spectra were obtained from the UNCD films grown under different processing condition, such as the BEN-BEG process and UNCD film growth without any bias (see Figure 1.12a). The EELS spectra revealed the two main peaks relevant to characterizing the chemical bonding from the Si substrate to the UNCD film, as shown in the cross-section HRTEM image of Figure 1.11a and 1.12a. The analysis of the EELS spectra in Figure 1.12b revealed two main peaks: (1) a peak at 285 eV, characteristic of the so-called π* peak, corresponding to the C atoms sp2 bonds in graphite; and (2) a σ* peak at 290 eV, characteristic of C atoms sp3 bonds in diamond. Not shown in the spectra of Figure 1.12b are the Si K edge at 100 eV for Si–Si bonds, and the Si K edge at 103 eV, confirming the existence of the Si–C bonds in the SiC area on top of the Si pyramidal structures, and the Si–Si bond of the Si substrate [Reference Zhong, Chen and Tai83].
(a) Cross-section HRTEM image of the BEN-BEG grown UNCD film, where plain/cross-section SEM and plain HRTEM images are shown in Figures 1.9 and 1.10, respectively. (b) Electron diffraction on the Si substrate, showing the diffraction points characteristic of Si. (c) Electron diffraction on the UNCD film, showing the diffraction points characteristic of diamond. (d) Electron diffraction on the graphitic structured film area, showing the diffraction points characteristic of graphite [Reference Ding, Krauss and Auciello79, Reference Lee, Lin and Lin80]. (e) Schematic representing the mechanism of BEN-BEG growth for UNCD films. (f) SEM image of UNCD films grown by the BEN-BEG process on sharp Si tips for EFE devices. (g) Optical picture (left) of UNCD films grown simultaneously on several Ti-alloy-based dental implants, positioned vertically on the substrate holder of the industrial MPCVD system shown in Figure 1.3, and schematic of holder under design to hold up to 300 dental implants for industrial low-cost coating by BEN-BEG biocompatible UNCD coating [Reference Chen, Zhong and Konicek81, Reference Zhong, Chen and Tai83].

Figure 1.12c shows the EELS signal evolution (for the π* (G) and σ* (D) peaks, the Si–Si bond signal from Si, and the Si–C signal from SiC) vs. distance along a pathway going from the Si substrate through a pyramidal structure, the SiC layer, and the UNCD film, grown on top of the Si pyramid. Four EELS signals evolutions are clear, namely:
the Si–Si signal goes to zero as the EELS signal goes from the Si to the SiC area;
the Si–C signal shows a maximum between ~30 and 35 nm, corresponding to the 5 nm thick SiC area on top of the Si pyramid, as shown in Figure 1.12a;
the signal corresponding to the π* peak, characteristic of the sp2-C atoms bonding, increases to a small steady value when the EELS signal reaches the UNCD film (this corresponds to the sp2-C atoms bonding in the UNCD grain boundaries); and
the signal corresponding to the σ* peak, characteristic of the sp3-C atoms bonding corresponding to diamond, increases to the maximum steady value of all signals, providing clear information about the UNCD film.
Figure 1.12d shows the EELS signal evolution (for the π* (G) and σ* (D) peaks, the Si–Si bond signal from Si, and the Si–C signal that would correspond to SiC) vs. distance along a pathway going from the Si substrate through the graphitic area between the Si pyramids, and into the UNCD film. Four EELS signal evolutions are clear:
the Si–Si signal goes to zero as the EELS signal goes from the Si to the graphitic area;
the Si–C signal is zero continuously since there is no SiC area, as shown in Figure 1.12a;
the signal corresponding to the π* peak, characteristic of the sp2-C atoms bonding, increases to a relatively medium value compared to the σ* peak signal of UNCD, and then decreases to a value comparable to that observed in Figure 1.12c, characteristic of the amount of the sp2-C atoms bonding in the UNCD grain boundaries; and
the signal corresponding to the σ* peak, characteristic of the sp3-C atoms bonding, reaches a similar value as that observed in Figure 1.12c, corresponding to reaching the UNCD film.
(a) Cross-section HRTEM image of the BEN-BEG UNCD film grown on an Si substrate. (b) EELS spectra for a BEN-BEG UNCD film and a UNCD film grown without any bias, showing the key π* peak (corresponding to the sp2-C atom bonds in UNCD grain boundaries [GB]), and the other key σ* peak (corresponding to the sp3-C atom bonds in the diamond grains of the UNCD film). (c) EELS signal evolution (for the π* (G) and σ* [D] peaks, the Si–Si bond signal from Si, and the Si–C signal from SiC) vs. distance along a pathway going from the Si substrate through a pyramidal structure, the SiC layer, and the UNCD film, grown on top of the Si pyramid. (d) The EELS signal evolution (for the π* [G] and σ* [D] peaks, the Si–Si bond signal from Si, and the Si–C signal that would correspond to SiC) vs. distance along a pathway going from the Si substrate through the graphitic area between the Si pyramids, and into the UNCD film.

Another key characterization of the chemical bonds of BEN-BEG UNCD films was performed using the NEXAFS analysis previously used to characterize UNCD films grown using the chemical seeding process, as described in Figure 1.6. NEXAFS analysis of the UNCD film, for which SEM, HRTEM, and EELS analysis were presented from Figures 1.9–1.12, is presented in Figure 1.13.
NEXAFS spectra from analysis of an MPCVD BEN-BEG UNCD film grown on a high-conductivity Si wafer. The NEXAFS analysis from the UNCD films grown from 10 to 46 min show identical spectra, indicating that the film exhibits practically the same σ* C atoms chemical bonds intensity, characteristic of the sp3-C atoms bond in diamond, and a very small π peak, characteristic of the sp2-C atoms bond in the UNCD grain boundaries. In addition, the NEXAFS spectrum obtained on the side of the UNCD film that was at the interface with the Si substrate shows a larger π peak, in agreement with the EELS analysis presented in Figure 1.12d, which shows a graphitic structure in contact with the Si substrate surface where the UNCD film was grown by BEN-BEG.

Subsequently to the initial studies described above on BEN-BEG of UNCD films, other work was performed by an independent group investigating the growth of UNCD films by the BEN-BEG process to produce UNCD films with enhanced EFE [Reference Teng, Huang-Chin and Tzeng84]. This work involved using the MPCVD process to do BEN on Si substrates bias at approximately –400 V for ≥60 min, which was required to produce an appropriate granular structure of the diamond films to enhance the EFE properties. The specific process used in the work cited in [Reference Teng, Huang-Chin and Tzeng84] included BEG under –400 V substrate bias for 60 min after a BEN step for 10 min. HRTEM studies [Reference Teng, Huang-Chin and Tzeng84] confirmed the initial R&D described above, which showed the formation of SiC–diamond nucleation structures on top of the ion bombardment Si structured surface (see Figures 1.11a and 1.12a and [Reference Chen, Zhong and Konicek81, Reference Zhong, Chen and Tai83]). The EFE turn-on voltage was 3.6 V/µm, which although low was still higher than the turn-on voltage achieved with N-UNCD films, as discussed in Section 1.2.1.4. HRTEM studies revealed that the main factor enhancing the EFE properties of BEN-BEG UNCD films may be the induction of nano-graphite filaments along the thickness of the films, which may facilitate the transport of electrons [Reference Teng, Huang-Chin and Tzeng84].
A question to be considered is why it is relevant to develop an optimized BEN-BEG process to grow not only UNCD, but also MCD and NCD films on large-area substrates (≥150 mm in diameter). The answer relates to key issues related to diamond films-based products: (1) Given the present state of safety considerations related to research in academic, national laboratories and industrial environments, eliminating the need for seeding with nanoparticles would greatly reduce research laboratory and industrial safety issues; (2) having a whole plasma-based seeding process without having to go through mechanical or ultrasonication seeding processes can reduce costs for industrial processes, including elimination of the laboratory space and systems required for the mechanical or wet type of seeding; and (3) for future fabrication of UNCD- or NCD-based MEMS/NEMS devices, in the necessary clean-room environment, eliminating the need for nanoparticle-based seeding may be a necessity, since nanoparticle solution-based seeding will complicate the implementation of this process in industrial clean rooms. However, it is important to note that the BEN process works on the substrates with moderate (semiconductor) and high electrical conductivity only.
MCD and NCD [Reference Stoner, Ma, Wolter and Glass76–Reference Lee, Lin, Chia, Cheng and Lin78, Reference Teng, Huang-Chin and Tzeng84] and UNCD [Reference Ding, Krauss and Auciello79– Reference Chen, Zhong and Konicek81, Reference Zhong, Chen and Tai83] films grown using the BEN+ growth without bias or the BEN-BEG process demonstrated that the BEN process has several advantages over mechanical polishing or ultrasonic seeding processes: (1) comparable or better seeding efficiency [Reference Lee, Lin, Chia, Cheng and Lin78–Reference Chen, Zhong and Konicek81, Reference Zhong, Chen and Tai83, Reference Teng, Huang-Chin and Tzeng84]; (2) stronger adhesion to substrates [Reference Lee, Lin, Chia, Cheng and Lin78–Reference Chen, Zhong and Konicek81, Reference Zhong, Chen and Tai83, Reference Teng, Huang-Chin and Tzeng84]; and (3) an integrated fully dry nucleation/growth process using plasma processing only [Reference Stoner, Ma, Wolter and Glass76–Reference Chen, Zhong and Konicek81, Reference Zhong, Chen and Tai83, Reference Teng, Huang-Chin and Tzeng84].
1.2.1.4 MPCVD Growth and Structure and Chemical Characterization of Electrically Conductive UNCD Films with Boron Atoms Replacing C Atoms in the UNCD Diamond Grains Forming B-UNCD Films or Nitrogen Atoms Inserted in Grain Boundaries Forming N-UNCD Films
Background on High-Tech and Bio-related Applications of Electrically Conductive B-UNCD and N-UNCD Films
Relevant biomedical applications of electrically conductive UNCD films include: (1) biosensors [Reference Härtl, Schmich and Garrido85], (2) coatings of electrodes for a new generation of Li-ion batteries (LIBs) with ≥10 times longer life and which are safer than current LIBs [Reference Tzeng, Auciello, Liu, Lin and Cheng48, Reference Link, Sankaran and Chen49] to enable the next generation of defibrillators/pacemakers (D/P) with longer life than current D/P, which need to be replaced in 6–8 years due to LIB degradation [Reference Auciello86]; and (3) electrodes for neural stimulation [Reference Cogan87–Reference Hung, Greenberg, Zhou, Judy and Talbot89]. For these bio-related technological applications, diamond has many superior material properties compared to metals and semiconductor materials used today, which exhibit chemical corrosion by body fluids and several biocompatibility problems [Reference Auciello59]. However, a key issue in applying other diamond, and specifically UNCD, films for electronic devices and electrodes is to achieve good functional electrical conduction properties via doping with appropriate atoms, as described here.
Doping of UNCD Films with Boron (B) Atoms to Produce B-UNCD Films
One type of doping, which has been explored extensively, involves insertion of boron (B) atoms, replacing C atoms in the diamond lattice of the UNCD grains and also in other PCD films [Reference Srikanth, Kumar and Kumar37]. B atoms doping of UNCD films should be compared with B atoms doping of homoepitaxial diamond films [Reference Brunet, Germi and Pernet90], which showed that B atoms inserted in the crystal lattice of diamond, with concentration of up to 8 × 10²⁰/cm–3, results in a large expansion of the diamond lattice (0.16%), especially above the semiconductor–metal transition, due to the sum of a geometrical component from the larger atomic size of boron compared with carbon. In this respect, and directly relevant to this book, doping of UNCD films with B atoms was explored [Reference Zeng, Arumugam, Siddiqui and Carlisle31, Reference Yuan, Wu, Luo and Wu32]. The main approach used was to grow UNCD films on an ultrasonically seeded Si substrate surface, followed by MPCVD film growth process using a plasma produced with a CH4/H2 gas mixture and including trimethylborate (B(OCH3)3) (TMB) to insert the B atoms in the growing UNCD films, such that after achieving a concentration of ~1020cm–3 B atoms in the UNCD grains lattice, the diamond material undergoes an insulator–metal transition, producing the so-called “p-type” doping, inducing electrical conductivity [Reference Zeng, Arumugam, Siddiqui and Carlisle31, Reference Yuan, Wu, Luo and Wu32]. The results reported in [Reference Yuan, Wu, Luo and Wu32] indicated that for a given concentration of B in the gas mixture, {111} planes in the crystalline grains of the UNCD films take up more boron into the crystal lattice than {110} planes, which was initially interpreted as that B-doping may facilitate the preferential growing of (Reference Coffman, Cao and Pianetta111) diamond planes. However, XRD analysis showed that the (220) peak was always more intense than the (Reference Coffman, Cao and Pianetta111) peak, suggesting that for all UNCD films grown, using the conditions described above, the preferred growth direction may be along the (110) planes, which may grow faster than the other planes, inducing structures elongated along the (110) axis, forming columnar structures [Reference Yuan, Wu, Luo and Wu32]. In addition, the data reported in [Reference Yuan, Wu, Luo and Wu32] showed that B-doped UNCD films, produced by using 250 ppm B in the gas mixture, exhibited the largest XRD I(220)/I(Reference Coffman, Cao and Pianetta111) intensity peaks ratio, correlating with the observation that the UNCD films exhibited preferential {110} facets. A relevant problem with producing B-doped UNCD using the MPCVD process described above is that the MPCVD system gets contaminated permanently and then that system can grow only B-doped UNCD or other PCD films, resulting in a constrained cost of hundreds of thousands of US dollars.
Alternatively, recent R&D work demonstrated a new process for B-doping of UNCD films, performed in a dedicated RTA system after growing UNCD films (∼630 nm thick) on SiO2 (∼300 nm thick)/Si substrates using the MPCVD process in a dedicated system, as described above [Reference Tirado, Acantar-Peña and de Obaldia38]. Subsequently, the UNCD films were coated with a spin-on-dopant (SOD) B-containing film (~ 200 nm thick), dispersed on the UNCD films’ surface via a spinning speed of 3000 rpm. Subsequently, the UNCD films with the SOD films on top were baked in an RTA atmospheric oven at 200 °C for 20 min in order to evaporate any excess solvent from the SOD film. The diffusion process was carried out on three UNCD films at different temperatures (e.g., 800 °C, 900 °C, and 1000 °C) to explore the diffusion depth of B atoms inside the UNCD films, and their effect on the film electrical conductivity. Figure 1.14 shows the characterization of the B-doped UNCD films using complementary techniques to determine key parameters of the B-doped UNCD film performance. Figure 1.14a shows a high-resolution cross-section SEM image of a UNCD film grown on a SiO2/Si substrate and with the B-based SOD layer on the surface. Figure 1.14b shows the key chemical analysis of B-doped UNCD films produce by RTA at the three temperatures described above. The Raman spectra show the characteristic peaks observed in many UNCD films [Reference Auciello and Sumant22, Reference Shenderova and Gruen23], namely: 1550 cm–1 G band attributed to sp2-C atom bonds [Reference Auciello and Sumant22, Reference Shenderova and Gruen23, Reference Birrell, Gerbi and Auciello70]; the 1350 cm–1 D band attributed to disorder-induced sp2-C atom bonds [Reference Auciello and Sumant22, Reference Shenderova and Gruen23, Reference Birrell, Gerbi and Auciello70]; and the 1450 and 1130 cm–1 bands both attributed to C=C and C–H vibration modes in transpolyacethylene (TPA) molecules, respectively [Reference Alcantar-Peña, Lee and Fuentes-Fernandez41, Reference Fuentes-Fernandez, Alcantar-Peña and Lee74]. All Raman bands described are due to chemical bonds of C atoms in the grain boundary network of the UNCD films. A tiny peak at 1332 cm–1, characteristic of sp3-C atom bonding in diamond, can also be observed for the film annealed at 1000 °C, indicating that for this annealing temperature the grain size has increased to a value corresponding to the low NCD grain size range. The Raman band at 1130 cm–1 is reduced significantly after the UNCD film B-doping at 900 °C, and it almost disappears for the B-doping at 1000 °C. On the other hand, the Raman band at 1450 cm–1 is halfway and significantly reduced for the UNCD films annealed at 900 and 1000 °C, respectively, during the B-doping process.
(a) Cross-section SEM image of an MPCVD-grown UNCD film on a SiO2/Si substrate. (b) Raman spectra of B-doped UNCD films annealed at three different temperatures. (c) B atoms concentration vs. depth under the surface of B-UNCD films produced with three different annealing temperatures. (d) Data from Hall measurements of B atoms concentration and resistivity vs. annealing temperature used to produce the B-UNCD films [Reference Tirado, Acantar-Peña and de Obaldia38].

The changes observed in the Raman spectra shown in Figure 1.14b are correlated mainly with changes in the grain boundary structure and chemistry of the UNCD films, mostly due to loss of TPA molecules and enhancement of sp2-C atom bonds induced by the B atoms’ diffusion during annealing at temperatures ≥900 °C [Reference Tirado, Acantar-Peña and de Obaldia38, Reference Seo, Wu and Mikael91]. The changes observed in the Raman spectra correlate with desorption of H atoms from grain boundaries and surfaces, as seen also for many polycrystalline and crystalline diamond films annealed at temperatures >800 °C [Reference Tirado, Acantar-Peña and de Obaldia38, Reference Cui, Ristein and Ley92].
The concentrations of B atoms in the subsurface region of UNCD films, measured by secondary-ion mass spectrometry (SIMS), were between 0.6 Å (~1021/cm3) and 2 Å (~1021/cm3) for UNCD films annealed between 800 and 1000 °C (see Figure 1.14c and details in [Reference Tirado, Acantar-Peña and de Obaldia38]). On the other hand, the diffusivities of B atoms inside the UNCD films, obtained from calculations correlated with B atoms’ depth profile concentration, measured by SIMS, were determined to be ~10–15 cm2/s, between 1 and 3 Å, for the first 20 nm of diffusion depth (see figure 3b in [Reference Tirado, Acantar-Peña and de Obaldia38]), and 10–15 cm2/s, between 8 and 12 Å (see figure 3b in [Reference Tirado, Acantar-Peña and de Obaldia38]) for films annealed at 800–1000 °C [Reference Tirado, Acantar-Peña and de Obaldia38], to induce B-doping. The explanation for the increased B atoms’ diffusivities in UNCD films depths ≥20 nm relates to the increased amount of grain boundaries in those depth ranges and correlates with prior measurements of B atoms’ diffusivities ~10–16 cm2/s in 2 Å under a single crystal diamond surface annealed to 1200 °C [Reference Alcantar-Peña, Lee and Fuentes-Fernandez41] vs. B atoms diffusivity of ~10–15 cm2/s in 6 Å underneath MCD (10 µm grains) film surfaces annealed at 770 °C [Reference Seo, Wu and Mikael91].
The properties of B-UNCD films revealed by Figure 1.14a–c correlate with and support the data shown in Figure 1.14d, which shows two key electrical properties of the B-UNCD films (carrier concentration and resistivity), obtained through Hall measurements [Reference Tirado, Acantar-Peña and de Obaldia38]. The Hall measurements show that the carrier concentration in the B-UNCD films increased by several orders of magnitude as the diffusion temperature increased, correlated with decrease in resistivity by the same orders of magnitude, with carrier concentrations of ~4 × 1013 cm–3, 2 × 1018 cm–3, 3 × 1020 cm–3 for the as-deposited and doped B-UNCD films annealed at 800, 900, and 1000 °C, respectively.
A key issue to be explored in relation to the use of electrically conductive B-UNCD or other B-doped PCD films or bulk, for implantable medical devices, is whether they are biocompatible. In this respect, initial work has shown that PCDs with B atoms inserted in the lattice exhibit good biocompatibility when implanted in guinea pigs [Reference Seo, Wu and Mikael91]. On the other hand, studies of boron nitride (BN) nanosheets of different sizes and BN nanoparticles in osteoblast-like cells (SaOS2) showed that the biocompatibility of BN nanomaterials depends on their size, shape, structure, and surface chemical properties [Reference Sung, Popovici, Prelas and Wilson93, Reference Popovici, Sung, Khasawinah, Prelas and Wilson94]. Electron spin resonance measurement revealed that unsaturated B atoms located at the nanosheet edges or on the particle surface are responsible for cell death [Reference Garrett, Saunders and McGowan95, Reference Mateti, Wong and Liu96]. Therefore, further work is necessary to determine whether B atoms on the surface of B-UNCD, B-MCD, B-NCD, and B-SCD films or bulks may also induce cell death when electrodes or devices with B atoms on the surface are implanted in the human bio-environment.
Background on Research to Produce n-Type Electrically Conductive Diamond Films for Biomedical Applications
Research focused on producing crystalline diamond or diamond-like films in electronic devices, requiring doping to achieve n-type conductivity (“electrons” as electrical carriers), have been largely unsuccessful [Reference Okano, Koizumi, Silva and Amaratunga97–Reference Prins100]. Although some of the prior work [Reference Prins100] demonstrated that n-type doping could produce shallow donor levels close to the conduction band of diamond, the room-temperature conductivities are still too low for the application of these materials in conventional electronic devices. A significant number of studies has been performed to investigate dopant atom candidates to produce a suitable n-type diamond. The work described in the previous section revealed that B atoms can replace C atoms in the diamond lattice, acting as a p-type dopant, in a relatively straightforward process, such that the energetic state for the B atom is 0.38 eV above the energy valance band edge of diamond. On the other hand, n-type doping of diamond is more difficult. Ideal dopants for producing n-type diamond films are nitrogen (N) atoms. However, extensive research has showed that nitrogen atoms incorporate in substitutional sites in diamond, forming a deep donor level with an activation energy of 1.7 eV, which inhibits achieving suitable electrical conduction at room temperature [Reference Collins, Lightowlers and Field101] via the conventional semiconductor-type doping where the dopant atoms replace native atoms in the lattice and provide electrons to the energy conduction band. It has been reported that lithium (Li) ion implantation can successfully transform intrinsic diamond into an n-type semiconductor [Reference Prawer, Uzan-Saguy, Braunstein and Kalish102]. In addition, phosphor atoms have been explored as dopants to produce n-type diamond [Reference Koizumi, Kamo and Sato103]. P is a benign element making up ∼1% of the total body weight as a bone constituent in the human body [Reference Childers, Corman, Edwards and Elser104, Reference Shao, Xie and Huang105]. Recent experiments have shown that black phosphor (BP) nanosheets, especially ones with a small thickness and size, have high reactivity with oxygen and water [Reference Island, Steele, van der Zant and Castellanos-Gomez106] and can degrade in aqueous media. Moreover, the final degradation products are nontoxic phosphate and phosphonate [Reference Ling, Wang, Huang, Xia and Dresselhaus107], both of which exist in and are well tolerated by the human body [Reference Shao, Xie and Huang105]. Therefore, ultrasmall BPQDs with good photothermal performance and biocompatibility are potential therapeutic agents. However, their actual clinical application in vivo still suffers from rapid renal excretion and degradation of the optical properties during circulation in the body. In addition, some published work raises concerns about the use of P inserted in the human body [Reference Pravst108]. So, further research is needed to confirm full sustainable biocompatibility of P atoms when integrated with other materials.
In any case, because the main technique that has been explored to produce n-type diamond is energetic ion implantation [Reference Dresselhaus and Kalish109], the high dose used for ion implantation, such as P or Li, in diamond causes an irrecoverable graphitization of the diamond crystals. In addition, Li ions are not good for biocompatibility, which is why LIBs in defibrillator pacemakers are encapsulated in sealed, relatively biocompatible metal cases made of Ti alloys. The damage density threshold, beyond which graphitization occurs upon annealing, is found to be 1022 vacancies/cm3. This value is checked against published data and is shown to be of a general nature, independent of ion species or implantation energy. The ion bombardment-induced graphitization of diamond indicates that the high conductivity was due mainly to the graphitized diamond and not to true semiconducting-type doping [Reference Prawer, Uzan-Saguy, Braunstein and Kalish102], which is a serious problem for practical applications [Reference Koizumi, Kamo and Sato103] requiring the multifunctional properties of diamond for the electronic devices. The information presented above indicates that ions that have been explored to produce n-type diamond (e.g., P, Li) may not be fully suitable for producing good biocompatible material for implantable electrically conductive medical devices and electrodes for neural stimulation. That is the reason why producing high electrical conductivity N-UNCD films may provide the pathway to producing implantable diamond-based electronic devices, as described at the beginning of this section.
Growth and Characterization of N-UNCD Films for Implantable Biocompatible Electrically Conductive Electrodes and Other Electronic Devices
Growth of N-UNCD Films via the MPCVD Plus Chemical Seeding Process
The first attempt at producing N-UNCD films was done by Ding/Krauss/Auciello et al. [Reference Ding, Krauss and Auciello79], developing N-UNCD films for field emission devices [Reference Ding, Krauss and Auciello79]. N atoms grain boundary incorporated UNCD (named N-UNCD) films were grown using the MPCVD BEN-BEG process on high-conductivity Si substrates; this work will be described in the next section.
This section focuses on the R&D performed after the demonstration of the BEN-BEG synthesis of N-UNCD films. The subsequent work focused on using the conventional chemical seeding plus MPCVD growth process. The initial R&D reviewed here is described in detail in [Reference Bhattacharyya, Auciello and Birrell29]. That work showed that when N2 gas is inserted in the Ar/CH4 gas mixture, the MPCVD-created plasma contains C2 dimers and CN radicals due to C–N atoms’ chemical reaction in the gas phase, such that the CN content increases substantially as N2 gas is added to the Ar/CH4 gas mixture (see figure 1a in [Reference Bhattacharyya, Auciello and Birrell29]). Small additions of N2 (1–5%) resulted in nanostructure similar to the UNCD films (3–7 nm grains and ~0.4 nm grain boundaries) (Figure 1.15a,b,d,e), while for N2 (20%) the films transform in what was originally defined as N-UNCD films (Figure 2a in [Reference Bhattacharyya, Auciello and Birrell29], patent in [Reference Gruen, Krauss, Auciello and Carlisle30]) with grains of 7–16 nm dimensions and grain boundaries with 1–2 nm width (Figure 1.15c,d) [Reference Bhattacharyya, Auciello and Birrell29, Reference Birrell, Carlisle, Auciello, Gruen and Gibson110].
HRTEM images of N-UNCD films grown with Ar/CH4 gas mixture with N2 (0%) (a) low resolution, (d) high-resolution; N2 (5%) (b) low resolution, (e) high resolution; N2 (20%) (c) low resolution, (f) high resolution (this shows the initial characterization of N-UNCD films, revealing the enlargement of grains and grain boundaries with respect to UNCD films revealed in the original first demonstration of MPCVD-grown N-UNCD films).

Raman spectroscopy has been used by many groups as the first easy/fast technique to characterize the atomic chemical bonds in the N-UNCD films, as described for the UNCD films in Section 1.2.1.2. However, as for the case of characterization of the UNCD films, although Raman spectroscopy is sensitive enough to detect the small amounts of nondiamond carbon in largely tetrahedrally C-bonded atoms such as in the UNCD and N-UNCD films, two major drawbacks, already described for the case of UNCD, exist in Raman analysis of N-UNCD films: (1) there is still a large difference in the cross-section for Raman scattering between sp2- and sp3-bonded C atoms [Reference Coffman, Cao and Pianetta111]; and (2) Raman scattering still has a strong dependence on the diamond crystallite size [Reference Nemanich, Glass and Lucovsky112] for N-UNCD, with larger grain size (~10 nm) than UNCD (3–5 nm). This dependence is very difficult to quantify and is especially challenging when measuring amorphous or nanocrystalline carbon films, including UNCD. The Raman spectra, obtained with a visible laser beam (He–Ne laser at a wavelength of 632 nm and spot size of 6 µm), from analysis of N-UNCD films grown with N2 gas contents from 0 to 20% are shown in Figure 1.16a. The spectra reveal the characteristic D band peak at 1340 cm–1 and G band peak at 1556 cm–1, both attributed to sp2-bonded carbon, and a shallow shoulder at 1140 cm–1, attributed to the nanocrystalline diamond structure [Reference Birrell, Gerbi and Auciello70, Reference Coffman, Cao and Pianetta111, Reference Nemanich, Glass and Lucovsky112] The Raman spectra show an increase of the G band peak relative to the D band peak as the N atom content in the plasma increases, with a slight shift of the peak to a higher wavenumber, indicating a slight change in the bonding configuration of the sp2-bonded carbon at the grain boundaries
However, Raman analysis does not provide all the information needed to understand how the chemical bonding in grain boundaries of N-UNCD films produces the high electrical conductivity, as proposed by molecular dynamic simulations [Reference Zapol, Sternberg, Curtiss, Frauenhein and Gruen113] that indicated that N atoms bonding to C atoms, with sp2 bonding available in grain boundaries, plays a critical role in inducing the high electrical conductivity of N-UNCD films. Therefore, small-spot HRTEM-based EELS were performed to obtain information to establish correlations between the bonding structure in the diamond grains and the grain boundaries in a series of films grown with increasing amounts of nitrogen in the plasma [Reference Birrell, Carlisle, Auciello, Gruen and Gibson110]. Figure 1.16b shows a representative EELS spectrum with the HRTEM electron beam focused on a UNCD grain, indicating that it is phase pure diamond for all nitrogen doping levels, as evidenced by the near-edge electronic structure of the peak [Reference Birrell, Carlisle, Auciello, Gruen and Gibson110]. The well-defined absorption edge at 289.5 eV and the presence of the second band gap feature, revealed at ~302 eV, clearly shows that the diamond grains are sp3-bonded carbon with a high degree of short-range ordering [Reference Birrell, Carlisle, Auciello, Gruen and Gibson110]. This effect does not change as nitrogen is added to the plasma, indicating that the electronic structure within the grains does not change. The grain boundary EELS spectra, shown in Figure 1.16c, reveals that the π* peak, at 285 eV, increases slightly when N2 gas increases from 0% to 20% during N-UNCD film growth, inducing N atom insertion into the N-UNCD films’ grain boundaries. The σ* peak at 289 eV, associated with sp3 bonding in the grains, is unchanged. The relative intensities of the sp2 vs. sp3 peaks in the EELS spectra in Figure 1.16c indicate that the amount of sp2 bonding increases only slightly within the grain boundaries when N2 flows, thus No atoms and N+ ions increase in the MPCVD plasma process [Reference Birrell, Carlisle, Auciello, Gruen and Gibson110].
(a) Spectra from Raman analysis of N-UNCD films grown with Ar/CH4 gas flux with N2 gas added from 0% to 20% for the five different N-UNCD films. (b) HRTEM-EELS analysis within diamond grains of the same N-UNCD films for which Raman spectra are shown in (a). (c) HRTEM-EELS analysis in the grain boundaries of the same N-UNCD films for which Raman spectra are shown in (a).
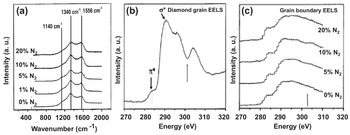
Another key analysis on the N-UNCD films was done using the atomic scale resolution technique “atom probe analysis” to determine whether N atoms were inserted in the grain boundaries. In this study, N-UNCD films with the hypothesized N atoms inserted in the N-UNCD films’ grain boundaries, as confirmed later, were grown on atomically sharp tips that were biased with a high positive potential with respect to the ground potential, while picosecond laser pulses, impinging on the specimen’s microtip along the axis in a high-vacuum system, triggered electric field-induced evaporation of ions from the surface of the N-UNCD-coated tip, such that field-evaporated ions were accelerated along diverging electric field lines to project a highly magnified image of the microtip’s surface onto a position-sensitive time-of-flight detector. The time of flight of the ions was used to identify their mass-to-charge-state ratio and hence their chemical identities (see figures 2, 3, and 4 in [Reference Heck, Staderman and Isheim114] for a detailed explanation of the technique). Three-dimensional tomographic atom probe tomography reconstructions of nano-diamonds provided information about the N and C atoms in the grain boundaries of N-UNCD films (see figure 6 in [Reference Heck, Staderman and Isheim114], showing maps of single-atom distributions).
The initial theory [Reference Zapol, Sternberg, Curtiss, Frauenhein and Gruen113] indicated that when nitrogen is incorporated in the N-UNCD or other PCD films’ grain boundaries, new electronic states are produced via electron release when N atoms bond chemically to sp2 open C atom bonds in the grain boundaries. It is important to note that this mechanism of electronic conductivity change in N-UNCD films is not due to the conventional N atom substitution of C atoms in the diamond crystal lattice of the grains producing electron donor doping, such as in Si. Complementary nanostructure and chemical characterization of the N-UNCD films, performed by independent groups [Reference Coffman, Cao and Pianetta111, Reference Gicquel, Silva and Hassouni115] to compare with theory, provided valuable information for understanding the UNCD transformation into N-UNCD films and the electrical conductivity.
In addition to the structural and chemical bonding characterization of N-UNCD films, an important characterization is related to measuring the electrical conductivity of the N-UNCD films. In this sense, Figure 1.17a shows SIMS data for the total nitrogen content in the films as a function of the percentage of N2 gas added to the plasma. Along with these data is a plot of the room-temperature conductivities for the same films (see Figure 1.17b), which reveals the high electrical conductivity of the N-UNCD, critical to developing key implantable biocompatible electrically conductive electrodes and other electronic devices for neural stimulation and other medical applications.
(a) Total N atoms content (left axis) and room-temperature conductivity (right axis) as a function of N2 gas content in the MPCVD plasma. (b) Arrhenius plot of conductivity data obtained in the temperature range 300–4.2 K for a series of films synthesized using different N2 gas concentrations in the plasma during N-UNCD film growth.

The other key property demonstrated for the N-UNCD films developed by Auciello et al., using chemical seeding plus MPCVD growth [Reference Getty, Auciello, Sumant, George, Islam and Dutta53] and BEN-BEG processes [Reference Ding, Krauss and Auciello79], is sustainable EFE, which is critical for a wide variety of applications. Figure 1.18 shows information on the structural form and electron emission properties demonstrated for N-UNCD film-based electron emission devices. Three important properties were demonstrated for the N-UNCD EFE films described in [Reference Getty, Auciello, Sumant, George, Islam and Dutta53]: (1) N-UNCD films exhibit one of the lowest electric fields (~2 V/µm – Figure 1.18e) for emission onset demonstrated today, for both the conventional sharp field emitter tips (Figure 1.18a,b) and (2) flat surfaces (Figure 1.18c,d), the most recent providing a much lower cost for the electron emission manufacturing process than the more complex and costly fabrication of field emitter tips; and (3) the N-UNCD films reported in [Reference Getty, Auciello, Sumant, George, Islam and Dutta53] were the field emitters with the longest stable emission (1000 h) demonstrated today (Figure 1.18f).
SEM images of sharp N-UNCD-coated Si field emitter tips (a) and (b) and planar UNCD-coated field emitter devices (c) and (d). (e) Emission current vs. cathode voltage and electric field emission for N-UNCD field emitter devices. (f) Electron emission current vs. emission time, showing the longest time (1000 h) field emission demonstrated today [Reference Getty, Auciello, Sumant, George, Islam and Dutta53].

The R&D performed on the synthesis and characterization of the properties of N-UNCD films by Auciello’s group has been replicated by several groups worldwide, as briefly discussed in the following.
Electrical Conductivity
1. The temperature dependence of Hall (electron) mobility measurements on N-UNCD films, together with an enhanced electron density, was used to interpret the unusual magneto-transport features, correlated with delocalized electronic transport in N-UNCD films, which can be described as low-dimensional superlattice structures. N-UNCD films grown with 10–20% N2 gas in the MPCVD process showed temperature dependences of conductivity as well as magnetoresistance (MR), contributions from weak localization (WL), and also from variable range hopping (VRH) transport (strong localization) to the net conductivity [Reference Choy, Stoneham, Ortuno and Somoza116].
2. Work by another group provided evidence that WL correction may provide insight into the dominant mechanism for electrical conductivity through grain boundaries in N-UNCD films, at low temperatures (≪300 K), although the details of film microstructures in connection with mechanisms including 2D WL to 3D WL interplay and electron–electron (e–e) interaction effects in both dimensions have not been elucidated yet [Reference Bhattacharyya117]. This work provided evidence of 3D anisotropic and correlated electronic transport in N-UNCD films through conductivity and MR measurements and at magnetic fields as high as 12 Tesla. This work also provided data on Hall resistance measurements in N-UNCD films not only to establish delocalized transport in these films but also to explain the unusual magneto-transport and weak temperature variation of conductivity of the films in the 3D WL framework.
3. N-UNCD films grown by another group, using the MPCVD process with 20% N2 gas concentration, revealed relatively higher values than those grown with 10% N2 films, in agreement with the data shown in Figure 1.18b. The estimated values of N atom concentration in the films of about 1019 cm–3 can explain the high conductivity of these films and suggests that in these heavily doped UNCD films transport can reach the high end of the diffusive regime, enabling band-like conduction. Although the number of N atoms in the N-UNCD films decreases as the substrate temperature is reduced, the minimum value of conductivity remains >1 × 1013 cm–2, which is a signature for delocalized conduction, which cannot be explained by the hopping conduction mechanism [Reference Shah, Churochkin, Chiguvare and Bhattacharyya118]. The research reported in [Reference Shah, Churochkin, Chiguvare and Bhattacharyya118] indicates that the dominant effect of anisotropic WL in three dimensions is associated with a propagative Fermi surface on the conductivity correction in N-UNCD films, and is supported by magnetoresistance studies at low temperatures. Also, low-temperature electrical conductivity shows WL transport in three dimensions, combined with the effect of e–e interactions in the N-UNCD films, which is remarkably different from the conductivity in 2D WL or strong localization regimes. The corresponding dephasing time of electronic wave functions in these systems, described as ~T−p with p < 1, follows a relatively weak temperature dependence on conductivity compared to the generally expected conductivity for bulk metals having p ≥ 1. The temperature dependence of Hall (electron) mobility together with an enhanced electron density has been used to interpret the unusual magneto-transport features and show delocalized electronic transport in these N-UNCD films, which can be described as low-dimensional superlattice structures.
Electron Field Emission
As in the case of studies of electrical conductivity of N-UNCD films by several groups worldwide, studies on EFE of N-UNCD films were also performed by different groups worldwide, confirming all the initial studies already described. Studies included the following:
1. N-UNCD films were grown on Si substrates using the MPCVD process, but using a liquid source of N atoms in the form of triethylamine (TEA) powder dissolved in methanol spun on the surface of the substrate [Reference Yuan, Fang and Feng119] to synthesize N-UNCD films on silicon substrates. The MPCVD process involved evaporating the N atoms from the surface of the Si substrate via heating to three different temperatures (760 °C, 830 °C, and 890 °C). The process replicated the previously demonstrated N-UNCD nanostructure of electrically conductive nanowires (see figure 3b,c in [Reference Yuan, Fang and Feng119]). The Raman analysis showed the characteristic two well-defined peaks of the D and G bands. The electrical conductivity of the N-UNCD films grown at a substrate temperature of 830 °C reached 1174 S cm–1 and exhibited 3.4 V/µm, which is slightly higher than the one shown in Figure 1.18e, but a comparable EFE current density of 8.0 mA cm–2 at 6.2 V/µm. Summarizing, the work reported in [Reference Yuan, Fang and Feng119] replicated the prior research already described.
2. R&D by several other groups [Reference Jothiramalingan, Haenen, Haenen and Yang120–Reference Wang, Tong, Chen, Shih and Lin122] worldwide basically confirmed all the prior research discussed above on the synthesis and properties of MPCVD-grown N-UNCD films.
Growth of N-UNCD Films by MPCVD via the BEN-BEG Process
The first demonstration of the BEN-BEG process for growing N-UNCD films was done by Auciello et al. [Reference Ding, Krauss and Auciello79]. N-UNCD films were grown on high-conductivity Si substrates heated to 800 °C using microwave power of 600 W at a total pressure of 11 Torr. One group of films was grown with Si substrates biased at –100 V using a gas mixture of N2 (1%) /CH4 (1–20%) / H2 (98–79%) [Reference Ding, Krauss and Auciello79], while a second group of films was grown with a substrate bias in the range –100 to –150 V in a gas mixture of N2 (1%)/CH4 (10%)/H2 (89%) [Reference Ding, Krauss and Auciello79]. The field emission performance in terms of threshold field and emission current improved considerably as a function of increasing CH4 concentration and negative bias voltage [Reference Ding, Krauss and Auciello79]. UV Raman analysis revealed that the field emission enhancement resulting from an increase in CH4 concentration from 1% to 5% correlates with a decrease in the sp3-C atoms bonding in the N-UNCD films. The dependence of field emission on negative bias voltage appears to be correlated with ion bombardment-induced damage in the film during growth. SEM images of N-UNCD films grown with –150 V bias showed smaller surface topographic features compared to films grown under 0 and –100 V bias. J vs. E0 measurements across a length of 40 mm over the N-UNCD film showed that films grown with a substrate bias of –150 V exhibited the lowest threshold field for electron emission demonstrated at that time (~2.0 V/µm) [Reference Ding, Krauss and Auciello79].
The initial R&D described above [Reference Ding, Krauss and Auciello79] opened a new field of R&D to optimize the growth of electrically conductive N-UNCD films for high-tech and biomedical applications, the latter motivated by the fact that N atoms inserted in biocompatible UNCD films provide probably the best biologically suitable atoms in relation to interactions with the human biological environment. The big advantage of using the BEN-BEG technique to grow N-UNCD films, as also discussed for UNCD films in Section 1.2.1.3, is that the time-consuming chemical seeding process is eliminated and the overall cost of growing N-UNCD films is also substantially reduced.
1.3 Fundamentals on the Synthesis of MCD, NCD, and UNCD Thin Films via HFCVD
1.3.1 Background Information on the Need for HFCVD to Grow PCD Films
A key challenge related to diamond film technology is the ability to grow films on large areas with uniform thickness and structure for technological applications and product development at low cost. MPCVD has been used to grow uniform MCD and NCD films at small (≤10 mm diameter) [Reference Huang, Chia, Chang and Cheng123] to medium (≤100 mm diameter) [Reference Alves, Amorim and Eichenberger Neto124, Reference Weng, Liu, Xiong, Wang and Sun125] sizes (one problem the reader needs to be careful of when reading titles of papers in the literature is that most authors claim they have grown large-area diamond films even when they have grown only on 30 mm diameter [Reference Huang, Chia, Chang and Cheng123] or 50–100 mm diameter Si substrates [Reference Alves, Amorim and Eichenberger Neto124–Reference Suna and Wang126], which in the current Si microelectronic technologies are medium-size substrates [Reference Butler and Sumant15, Reference Auciello and Sumant22]). On the other hand, UNCD films have been grown using large industrial-area MPCVD systems (see Figure 1.3a) with excellent thickness uniformity and nanostructure on relatively large (150–200 mm diameter) areas (see Figure 1.3b, this being the only real large-area UNCD film, grown by MPCVD, demonstrated today) [Reference Auciello and Sumant22].
Alternatively, HFCVD is capable of growing UNCD films on Si substrates with up to 300 mm in diameter and even larger area (~500 × 500 mm2), and is being used by Advanced Diamond Technologies, Inc. [25] for commercial growth of UNCD films on large areas to cover large amounts of mechanical pump seals (~20–40 mm diameter) at low cost. Figure 1.19a,b shows an industrial large-area HFCVD system and a 300 mm Si wafer coated with UNCD films with excellent uniformity in thickness and nanostructure across the whole surface area of the wafer.
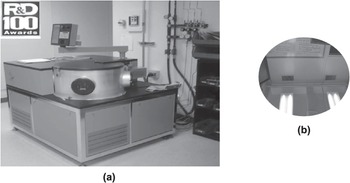
The HFCVD process is currently the most appropriate industrial growth process to produce large-area UNCD coatings at low cost for commercialization. That is the reason the fundamentals of growing UNCD films by HFCVD are discussed here.
1.3.2 Fundamentals and Properties of UNCD Films Grown by HFCVD
1.3.2.1 Background Information on Prior Research on HFCVD-Grown Diamond Films
The growth of UNCD films using the HFCVD technique has been reported for optimization in small substrates [Reference Lee, Lam, Lin, Chen and Chen127]. Most films grown by HFCVD exhibited grain size in the NCD (>10 nm) range [123–134], and no systematic analysis of the uniformity of the nanostructure and film thickness has been reported. Table 1.1 summarizes key publications on HFCVD growing of PCD films.
| Gas mixture (%) | Filament material/ geometry | Fil/sub temp. (°C) | Filament sub distance (mm) | Seeds size (μm) | Gas pressure (Torr) | Diamond grains (μm) | Characterization technique | Reference |
|---|---|---|---|---|---|---|---|---|
| H2 – 98 CH4 – 2 | W(array/ filament) | 2150/800 (850) | 6 | 0.5 on Si | 20–50 | 0.5–1 | SEM/ Raman | [Reference Huang, Chia, Chang and Cheng123] |
| H2 – 99 CH4 –1 | Ta (20/ filament) | 2320/800 (850) | 20 | Carbide Rods | 2–36 | 0.3–1 | SEM/AFM/Raman | [Reference Alves, Amorim and Eichenberger Neto124] |
| H2 – 99 CH4 – 1 | W (grid filament) | 2000/450 (550) | 5 | 20–40 | 7 | 0.04–0.07 | SEM/AFM/Raman/ XRD/IR | [Reference Weng, Liu, Xiong, Wang and Sun125] |
| H2 + CH4 1–100 Ar 0–100 | Ta (coil filament) | 2400/850 (900) | 5 | No info | 100 | 0.05 | SEM / Raman | [Reference Suna and Wang126] |
| H2 – 99 CH4 –1 | W (4/filament) | 2100/850 | 8 | 40 | 1–36 | 0.2–0.3 | SEM/AFM/XRD/Raman/ | [Reference Lee, Lam, Lin, Chen and Chen127] |
| CH4 – 1 H2 1–5 Ar-rich | Ru (helix filament) | 2100–2400/400 (800) | 5 | 1 | 20–30 | 0.01–0.05 | SEM/Raman | [Reference Schwarz, Rosiwal, Frank, Breidt and Singer128] |
| CH4 – 1 H2 – 9 Ar – 90 | W (5/filament) | 2200/550 (850) | 5 | 0.250 | 30 | 0.0045–0.0068 | SEM/XRD/Raman | [Reference Hao, Zhang, Shi and Han129] |
| CH4 – 0.25, 0.5, 1, 1.5, 2 H2 – 9.75, 9.5, 9, 8.5, 8 Ar – 90 | W (5/filament) | 2200/750 | 5 | 0.250 | 30 | Not reported | SEM/XRD/XPS/Raman | [Reference Liang, Wang, Zhu and Yang131] |
The information presented in Table 1.1 indicates that prior research did not involve systematic investigation of the effect of the H2/CH4 gas chemistry ratio and simultaneous Ar gas flow variation into the HFCVD film growth chamber to tailor the growth of diamond films using the HFCVD technique for large-area applications.
1.3.2.2 Fundamentals on Synthesis and Characterization of PCD Films By Chemical Seeding Plus HFCVD Growth Process
Based on the information presented in Section 1.3.2.1, Auciello’s group performed the first series of systematic studies focused on investigating the role of Ar gas in producing HFCVD-based growth of UNCD films (3–5 nm grains) [Reference Fuentes-Fernandez, Alcantar-Peña and Lee74, Reference Alcantar-Peña, de Obaldia and Montes-Gutierrez135] with high uniformity in surface roughness on 100 mm diameter Si substrates. In addition, gas chemistry was tailored to determine the conditions to grow PCD films from MCD (~1 μm) to NCD (≥10 nm grain) for applications in micro/nanoelectronics, as described later in this chapter. The studies described here involved systematic analysis of films using complementary HRTEM supported by XRD and AFM to determine the grain size, film surface chemistry, and surface roughness of the MCD, NCD, and UNCD films, respectively, across 100 mm substrates. Scanning electron microscopy and Raman analysis, and visible (532 nm analyzing laser wavelength) and far UV (244 nm analyzing laser wavelength) were used to characterize the film surface morphologies and C atom chemical bonds.
The HFCVD film growth process involved an array of W filaments (ø = 0.25 mm, length ~14.2 cm) held on a molybdenum (Mo) frame in an optimized geometry, positioned 3 cm above the substrate holder (Figure 1.20a–c). The substrates were located on a metal disk and rotated during film growth to induce film thickness uniformity on up to 100 mm diameter substrates (Figure 1.20c). The filaments were heated to 2200 °C by passing AC current. The gas flows were (see Figure 1.21): (a) 200 sccm H2, (b) 50 sccm H2,/50 sccm Ar, (c) 30 sccm H2/70 sccm Ar, (d) 20 sccm H2,/80 sccm Ar, (e) 15 sccm H2/85 sccm Ar, and (f) 10 sccm H2/90 sccm Ar, with fixed CH4 gas flow of 2 sccm, and a uniform pressure of 10 Torr in the film growth chamber. The geometry of the HFCVD, and specifically the filament arrays, induces a uniform distribution of C and H atoms, produced via cracking of the H2 and CH4 gases impacting on the hot filaments’ surfaces (Figure 1.20a).
Schematic of the HFCVD geometry (a), the optimized filament array (b), and view of the HFCVD system in operation at the University of Texas-Dallas (c), growing uniform UNCD film on 100 mm diameter Si substrates (d).

The growth of PCD films reviewed in this section was done on tungsten (W) template layers grown on SiO2/Si substrates, since prior research by Auciello et al. demonstrated that the W surface induces the highest nucleation density for UNCD film growth [Reference Auciello and Sumant22, Reference Naguib, Birrell, Elam, Carlisle and Auciello136, Reference Naguib, Elam and Birrell137]. Figure 1.21a–d shows SEM images of diamond films deposited with different Ar and H2 gas flow ratios, keeping the CH4 constant at 2 sccm. MCD films (grain sizes of 1–3 µm) were grown using a mixture of 3 sccm CH4 and 200 sccm H2 flow (Figure 1.21a). Increments of Ar concentration in the CH4/H2 gas mixture revealed a remarkable reduction in grain size, from large grain size NCD films (~300 nm grain size) (Figure 1.21b), produced using a gas ratio of 2 sccm CH4/50 sccm H4/50 sccm Ar, to NCD films with smaller grain sizes (9–25 nm) (Figure 1.21c), grown with 2 sccm CH4/30 sccm H2 /70 sccm Ar. Finally, UNCD films (3–7 nm grain size) were produced with 2 sccm CH4/10 sccm H2 /90 sccm Ar (Figure 1.21d), which shows an electron diffraction spectrum confirming the diamond structure. The AFM analysis provided information on the surface roughness of the films, while XRD analysis provided information on the film grain size [Reference Fuentes-Fernandez, Alcantar-Peña and Lee74]. Figure 1.21e shows the variation of film surface roughness and thickness as a function of diamond grain size for the MCD, NCD, and UNCD films (the error bars represent the main distribution across the 100 mm diameter substrate). Figure 1.21e clearly shows that the gas chemistry is key to controlling the structure of PCD films, synthesized by HFCVD from MCD to UNCD [Reference Fuentes-Fernandez, Alcantar-Peña and Lee74].
SEM images of diamond films grown by HFCVD with different gas flow ratios: (a) MCD film grown with 3 sccm CH4/200 sccm H2; (b) NCD film grown with 2 sccm CH4/50 sccm H2/50 sccm Ar; (c) NCD film grown with 2 sccm CH4/30 sccm H2/70 sccm Ar; and (d) UNCD film grown with 2 sccm CH4/10 sccm H2/90 sccm Ar. (e) Plot of the average grain size and surface roughness of the different diamond films measured across the 100 mm diameter Si substrates.

The key technique to precisely measure the grain size of NCD and UNCD films was HRTEM analysis, since the grain sizes are in the very small nanoscale range. This analysis of films grown with 2 sccm CH4/70 sccm Ar/30 sccm H2 and 2 sccm CH4/80 sccm Ar/20 sccm H2 flow ratios revealed average grain sizes of 17 nm and 18 nm, respectively, classifying both of them in the NCD range (Figures 1.22a,b). On the other hand, films grown with 2 sccm CH4/85 sccm Ar/15 sccm H2 had an average grain size of 8 nm (Figure 1.22c), which is in the UNCD upper dimension limit [Reference Auciello and Sumant22]. Films grown with 2 sccm CH4/90 sccm Ar/10 sccm H2 flow ratio exhibited a grain size of 3–6 nm (Figure 1.22d), which defines the UNCD structure [Reference Naguib, Birrell, Elam, Carlisle and Auciello21, Reference Auciello and Sumant22]. Fast Fourier transform (FFT) diffractograms (insets in Figure 1.22a–d) and selected area electron diffraction (SAED) were performed on the NCD and UNCD films. An interplanar distance of 0.19 nm corresponding to a crystalline plane of (220) was observed. The structures of grains and grain boundaries in all films were further characterized using electron diffraction with a Fourier transformed image (see insets in Figures 1.22a–d). The grain size uniformity across 100 mm diameter films was measured by XRD. Diamond films grown with Ar/H2 gas flow ratios (in sccm) 70/30, 80/20, 85/15, and 90/10, all with 2 sccm CH4 gas flow, exhibit average grain sizes of 11, 11.8, 8.3, and 5.6 nm, respectively, as shown before in [Reference Auciello and Sumant22]. The XRD grain size was calculated using Scherrer’s equation (see plot in Figure 1.22e).
Cross-section HRTEM pictures of NCD and UNCD films grown on W-coated SiO2/Si substrates under different gas flow ratios: (a) 70 sccm Ar/30 sccm H2 (Fourier transformed images from diffractograms are presented in lower right insets) (NCD/17–18 nm grains); (b) 80 sccm Ar/20 sccm H2 (NCD/17–18 nm grains); (c) 85 sccm Ar/15 sccm H2 (UNCD/8 nm grains); and (d) 90 sccm Ar/10 sccm H2 (UNCD/3–6 nm grains), while keeping the CH4 gas flow constant at 2 sccm for all cases; FFT patterns as insets. (e) XRD spectra used to determine the UNCD film grain size across the 100 mm diameter substrate.

Raman analysis using a 532 nm wavelength laser beam (Figure 1.23, spectra 1–4) was performed to determine the C atom chemical bonding in the HFCVD-grown MCD, NCD, and UNCD films structures. The key differences to be noted in the Raman spectra between the MCD, NCD, and UNCD films are: (1) the 1332 cm–1 peak is not observed for the UNCD film due to the D band signal at 1350 cm–1; (2) in general, UNCD films analyzed by visible Raman (532 nm wavelength) are characterized by the appearance of sp2-C bond peaks at 1550 cm–1 (G band) and at 1350 cm–1 (D band), such that the D band is super-imposed on the 1332 cm–1 peak due to the extremely small nanoscale grain size of the UNCD film with a relatively larger band gap; (3) the peak at 1550 cm–1 produced by the sp2-C atom bond is stronger in UNCD than in MCD and NCD due to the much larger grain boundaries network, concurrently with the substantial reduction in grain size; and (4) the peak observed at 1150 cm–1 corresponds to emission from trans-polyacetylene molecules in the grain boundaries.
(a) Raman spectra from analysis of MCD (1), NCD (>18 nm grains (2) and ~ 8–10 nm grains (3)), and UNCD (4) films using a visible 532 nm wavelength laser beam. (b) Room-temperature Raman spectra obtained using 244 nm wavelength laser of NCD and UNCD films grown with 2 sccm flow of CH4 gas with each of the Ar/H2 gas flow combinations shown for each curve (notice that although very small, the diamond peak at 1332 cm−1 is still visible for the UNCD film.

In summary, the research on HFCVD growth of PCD films described above showed that control of the gas chemistry and flows enables producing PCD films with highly controlled structures from MCD to NCD to UNCD.
1.3.2.3 Fundamentals on Synthesis and Characterization of MCD, NCD, and UNCD Films on HfO2 Films on Si by Chemical Seeding Plus HFCVD Growth Process
Background on the Importance of Growing MCD to UNCD Films on HfO2 Films for Biomedical and Other Devices Based on Si
Another critical issue related to growing PCD films on Si substrates is related to the application of Si-based microchips in implantable medical devices. In this respect, Chapter 2 of this book focuses on describing the application of a hermetic/biocompatible/humor eye chemical attack-resistant UNCD coating to encapsulate an Si microchip implantable in the eye as the main component of an artificial retina to restore partial vision to people blinded by retinitis pigmentosa (see Chapter 2 and [Reference Xiao, Wang and Carlisle28] for details). In relation to a similar topic, this section focuses on describing another critical issue regarding growth of PCD films on a key layer involved in Si-based CMOS devices, the main Si-based micro/nanoelectronics today [Reference Fussstetter, Richter and Umeno138]. The key technological issue addressed recently by Auciello’s group was to develop a process to grow MCD, NCD, and UNCD films on HfO2 layers on Si substrates, since HfO2 is the main gate oxide used in all CMOS devices on the market today [Reference Wallace, Auciello and Ogale139]. A key reason for growing MCD films on HfO2 is that it has been proven that MCD has ~1900 W/K·m thermal transport (the closest to the highest thermal transport of single crystal diamond (~2100 W/K·m) [Reference Auciello and Sumant22], and this property may provide the means to cool down the next generation of micro/nanoelectronic devices, particularly those implanted inside the human body. The reason for growing UNCD films on HfO2 layers is because it has been proven that UNCD is extremely biocompatible and inert to chemical attack by body fluids [Reference Xiao, Wang and Carlisle28], thus it may provide a powerful encapsulating coating for Si microchips implantable inside the human body using the HfO2 film as an insulating template layer grown around the Si microchip to then grow an insulating UNCD film.
Synthesis and Characterization of MCD, NCD, and UNCD Films on HfO2 Films on Si
Diamond Film Growth.
HfO2 thin films are grown via atomic layer deposition (ALD) using Tetrakis (dimethylamido) hafnium (Hf(NMe2)4) as the hafnium precursor and H2O as the oxidation precursor. HfO2 films of 5, 10, 30, and 100 nm thicknesses were grown on SiO2/Si substrates heated up to 100 °C, using a nitrogen purge of 20 seconds between each precursor pulse. All substrates with the HfO2 layers on the surface were subjected to the chemical-based diamond seeding process via immersion of the substrate in a commercial solution of methanol with functionalized diamond particles (to avoid seed particles agglomeration to induce high-density pinhole-free diamond films) in an ultrasound generator, which immersed UNCD (3–5 nm) particles from the seeding solution on the substrate surface via sound wave-induced vibration. Details of the seeding process can be found in [Reference Auciello and Sumant22]. Following the seeding process, the substrates were placed inside the HFCVD chamber on a rotating substrate holder to promote film uniformity. Details of the HFCVD geometry, gas flow, and filament and substrate heating were described in Section 1.3.2.2. Briefly, the substrates were heated to ~800 °C for growing MCD and NCD films and ~650 °C for growing UNCD films. The gas flows used to grow the diamond films were: (1) for MCD and NCD films, CH4 (3 sccm)/H2 (200 sccm) for 8 h and 4 h, respectively; and (2) for UNCD films, CH4 (2 sccm)/H2 (10 sccm)/Ar (90 sccm) for 1 h, keeping the total chamber pressure at 10 Torr. The details of the HFCVD process to grow MCD to UNCD films can be found in a recent paper [Reference Fuentes-Fernandez, Alcantar-Peña and Lee74].
The next step, after the diamond film growth, was to study their structural and chemical composition properties using complementary electron microscopy techniques and Raman and XPS analyses, respectively, as described below.
Characterization of Diamond Films Structure by Electron Microscopy.
Figure 1.24 shows SEM images of UNCD, NCD, and MCD films grown on HfO2 layers on Si, demonstrating that the HfO2 layer plays a critical role in inducing growth of dense PCD films with all structures.
SEM images of the top surface of UNCD films grown on SiO2 (a), WOx (b), TiAlOx (c), and HfO2 (d), showing that the densest UNCD film is grown on a HfO2 layer. (e,f) Dense NCD and MCD films also grow with high-density structures on HfO2 layers on Si.

Figure 1.25 shows cross-section SEM images correlated with the SEM images of the top surface shown in Figure 1.24, such that the cross-section confirms the information provided by the top surface images that UNCD, NCD, and MCD films are grown with extreme dense structures on HfO2.
SEM images of the cross-section of UNCD films grown on SiO2 (a), WOx (b), TiAlOx (c), HfO2 (d), showing that the densest UNCD film is grown on a HfO2 layer, with a nanoscale smooth UNCD/HfO2 interface. (e,f) Dense NCD and MCD films also grow with high-density structures and nanoscale smooth UNCD/HfO2 interfaces on HfO2 layers on Si.

The fundamental mechanism for growth of UNCD films on HfO2 layers was revealed by systematic detailed studies using HRTEM, Raman, and XPS analyses. Figure 1.26 shows the nanostructure of a 140 nm thick UNCD film grown uniformly on a 10 nm thick HfO2 template layer on an Si surface, as shown in the LRTEM (low-resolution transmission electron microscopy) image of Figure 1.26a. Figure 1.26b shows a plain view HRTEM image of the UNCD film, revealing the characteristic 3–5 nm grain sizes of UNCD, with the diamond crystal structure confirmed in the diffraction pattern of the inset. Figure 1.26c shows an HRTEM cross-section image that reveals the Si substrate and HfO2 layer, and the HfO2/SiO2 and UNCD/HfO2 interfaces. The HfO2 layer, amorphous as it is grown by ALD, crystallizes during the film growth, as indicated in the upper left inset diffraction pattern of Figure 1.26c, showing clear spots characteristic of the HfO2 crystalline structure. The UNCD/HfO2 interface exhibits a stripe-type structure, highlighted by the rectangle in Figure 1.26c, pointing to the upper right inset, which shows the diffraction patterns of the UNCD/HfO2 interface. A comparison between the diffraction patterns of pure UNCD (inset in Figure 1.26b) and the UNCD/HfO2 interface (upper right inset in Figure 1.26c) reveals the appearance of extra peaks for the diffraction at the interface, indicating the presence of a new phase at the interface. This new phase most probably appears during the first stages in the nucleation of the UNCD films, as explained later in the text. The HRTEM-EELS elemental analysis profile, shown in Figure 1.26d (scanning direction indicated with an arrow across the Si/HfO2/UNCD layered structure shown in Figure 1.26a), confirms the elemental profile through the whole SiO2/HfO2/UNCD heterostructure).
LRTEM cross-section (a) and HRTEM plain (b) and cross-section (c) images of UNCD film on UNCD/HfO2/SiO2 heterostructure. (d) HRTEM-EELS elemental profile analysis across the UNCD/HfO2/SiO2 heterostructure showing the distribution of C, O, Hf, and Si atoms correlated with the mechanism of diamond film nucleation and growth described in the main text.

Chemical Analysis of UNCD Films.
Characterization of the chemical bonds in UNCD films was done using Raman and XPS analysis, as complementary studies, to confirm the results presented above from electron microscopy. Figure 1.27Aa shows visible Raman spectra from UNCD films grown on HfO2 layers (with various thicknesses from 5 nm to 100 nm) grown by ALD on SiO2/Si substrates. The Raman spectra were obtained with a visible 532 nm laser beam wavelength. The spectra show characteristic D band (1341.7 cm–1) and G band (1588.5 cm–1) peaks from the sp2-C atom bond hybridization, identical for all UNCD films grown on the HfO2 layers with thickness in the 5–100 nm range (see Figure 1.27Aa). Deconvolution of the Raman peaks shows that there is a contribution of three extra peaks, green (at 1489.2 cm–1), violet (at 1258.3 cm–1), and yellow (at 1164.3 cm–1), to the D and G peaks, reported as representative of C–C atoms bonds stretching in trans-polyacetylene (TPA) molecules, broadened vibrational density of states (VDOS) of small diamond clusters, tetrahedral amorphous carbon, and TPA C–H bending combined with C–C stretching, respectively [Reference Klauser, Steinmüller-Nethl, Kaindl, Bertel and Memmel140, Reference Ferrari and Robertson141]. The literature [Reference Klauser, Steinmüller-Nethl, Kaindl, Bertel and Memmel140, Reference Ferrari and Robertson141] shows that the diamond peak (1332 cm–1) in UNCD films is always masked by the D mode peak of disordered carbon because visible Raman scattering from C atoms is mainly sensible to the dominating sp2 bonds in the large network of UNCD grain boundaries, and much less to the sp3 C bonds of diamond inside the grains. Figure 1.27Ab shows Raman spectra produced by UV (244 nm wavelength) laser beam, which provides sufficient energy to excite the σ states of both sp2 and sp3-C bonds of diamond, with a well-defined 1332 cm–1 peak from a single crystal diamond, an NCD film (10–100s nm grain size), and even a UNCD film. The disappearance of the 1150 and 1458 cm–1 peaks, shown in the visible (532 nm) Raman spectra, for the UV (244 nm) spectra (compare Figures 1.27Aa and Ab) indicate that those peaks are not the consequence of phonon confinement. This is due to the fact that if these peaks were zone boundary phonons, then they should be present in UV excitation as well [Reference Ferrari and Robertson141]. On the other hand, the visible Raman spectrum shows that the intensity of the broad peak from the graphite D band (1340–1350 cm–1) is inversely proportional to the crystal size, as indicated in Figure 1.27Aa, although the appearance of this feature was attributed to the breakdown of the q = 0 selection rule. A Raman interpretation model [Reference Ferrari and Robertson141] indicates that for nanocrystalline diamond, the characteristic Raman diamond peak at 1332 cm–1 is strongly reduced in intensity, and the D and G band peaks dominate the visible Raman spectra.
Analysis by XPS provided valuable information on the atom bonding in the initial UNCD film nucleation and growth stages. The appearance of the C1s, Hf4f, and O1s XPS peaks provided key information, complementing the HRTEM images, indicating that the UNCD films nucleate on HfO2 due to the formation of a nanometer-thick HfC interface layer at the very initial nucleation stage. The first row of data in Figure 1.27Ba shows the XPS spectra of C1s, Hf4f, and O1s from the UNCD film grown for 5 min. Figure 1.27Bb and Bc show similar XPS data for UNCD films grown for 10 and 15 min, respectively. For UNCD films grown for 5 and 10 min, the Hf4f and O1s peaks dominate the XPS spectra, while a small but noticeable (C1s) peak appears at the binding energy of ~281.8 eV, which correlates, within experimental error, with the 281.5 eV C1s peak of HfC [Reference Špatenka, Shur, Erker and Rump142, Reference Ramqvist, Hamrin, Johansson, Fahlman and Nordling143]. The C1s peak of HfC does not appear in the spectrum of the UNCD film grown for 15 min, which is due to the thickness of the UNCD film covering the HfO2 film. The C1s peak appearing at 184.5 correspond to the C atom bonds in the UNCD films.
The data from the Raman and XPS analyses shown in Figure 1.27 provide valuable information to confirm the mechanism of nucleation and growth of UNCD films on HfO2 layers, which may play a critical role in the development of a new generation of micro/nanoelectronic devices.
A (a) Raman spectra of UNCD films grown on HfO2 layers, obtained with a 532 nm wavelength visible laser beam, showing the characteristic D band (1341.7 cm−1) and G band (1588.5 cm−1) peaks; this figure includes a deconvolution of the Raman spectrum, showing the contribution of two peaks corresponding to the G band peak (1588.5 cm−1 ): 1 (1589 [cm−1] and 2 [1500 cm−1] peaks), and two peaks corresponding to the D band peak ((1341.7 cm−1): 3 (1341 cm−1) and 4 [1298 cm−1]), peaks; the deconvoluted peak 5 at ~ 1150 cm−1) correspond to the TPA peak correlated with H-rich molecules in the grain boundaries; (b) Raman spectra of a UNCD film grown on a HfO2 layer, obtained with a 244 nm wavelength UV laser beam, showing a very small but visible 1332 cm−1 peak characteristic of diamond, which is exactly at the position where the strong 1332 cm−1 diamond peak of crystalline diamond appears (Raman spectra for a NCD film and for a crystalline diamond are shown to confirm the position of the diamond pea); (c) Arrhenius plot ? growth rate (k) vs. 1/T – for UNCD films grown on HfO2 layers at different temperatures (fitting of the experimental data points provides the activation energy for growth of UNCD films at ~18.4 kcal/mol, which is within the range of activation energies that yield high-quality diamond films).
B XPS spectra from UNCD films grown on HfO2 layers for 5 min (a), 10 min (b), and 15 min (c). The spectra for the C1s and Hf 4f peaks reveal the presence of peaks at ~284.5 eV and ~14.7 eV, respectively, which confirm the formation of a HfC interface layer that induces nucleation of the UNCD films, the peaks for O 1s confirm the presence of O atoms contributing to form stoichiometric HfO2 films.

In concluding this section, it is relevant to note that in addition to the development of a process to produce high-quality UNCD coatings on HfO2 layers on Si, Figure. 1.24f and 1.25f show that high-quality MCD films can be grown on HfO2 layers on Si substrates. This is a key result that opens the way to develop the coating technology to cool down the next generation of Si-based micro/nanoelectronics, since it has been demonstrated that MCD exhibit a thermal transport of ~1900 W/K·m [Reference Auciello and Sumant22], very close to the best thermal transport of any material perpendicular and parallel to the film surface, which is for single crystal diamond (~2100 W/K·m) [Reference Auciello and Sumant22]. However, further R&D is needed to develop a process to grow MCD at ≤450 °C, as has been developed for UNCD coatings [Reference Auciello and Sumant22], in order to be within the thermal budget of Si microchips to avoid destroying the Si device, as occurs when heated above 450 °C.
1.3.2.4 Fundamentals on Synthesis and Characterization of UNCD Films with Tailoring of the UNCD Surface from Super-Hydrophilic to Super-Hydrophobic for Multifunctional External and Implantable Medical Devices and Prostheses: Background for Application of Super-Hydrophobic to Super-Hydrophilic UNCD Coating surfaces
Cardiovascular and Other Blood-Interfacing Devices.
Implantable medical devices that make contact with blood, such as vascular grafts, stents, and artificial heart valves, are widely used for treatment of cardiovascular diseases. Also, catheters and ports inserted in the venous system provide access to that system, to enable drug delivery in patients with cancer, including hematological malignancies, for example. Thrombus formation is a common cause of failure of these devices, where the formation of thrombi (blood-clotting aggregates) on the surface of the device due to adhesion of platelet aggregates and fibrin on supposedly hydrophilic (liquid-adsorbing) device surfaces leads to stopping of blood flow [Reference Jaffer, Fredenburgh, Hirsh and Weitz144]. Blood consists of a complex mixture of plasma and cells. Proteins are a major constituent of plasma, which contains about 300 different proteins, with concentrations in the 35–50 mg/mL range. Rapid adsorption of proteins from plasma onto artificial surfaces is considered a main component initiating thrombus formation because the protein layer modulates subsequent reactions, attracting platelets and other molecules in the blood. The dynamics of protein adsorption are related to the chemical and physical properties of the surface and the proteins. Thus, adsorption involves interactions between charged groups at the protein surface interface and/or conformational changes in protein structure. Adsorbed proteins form a monolayer with a thickness of 2–10 nm on the surface of cardiovascular devices, such that the concentrations of proteins on the surface can be 1000-fold higher than those in the plasma [Reference Wilson, Clegg, Leavesley and Pearcy145].
A group of researchers claimed that hydrophilic surfaces may reduce adhesion of platelets and blood cells. Negative surface charge density gradients were prepared on fused silica slides using selective oxidation of a 3-mercaptopropyltrimethoxysilane (MTS) monolayer converting surface thiol groups (–SH) into negatively charged sulfonate (-SO3–) groups [Reference Corum and Hlady146]. Gradients pre-adsorbed with fibrinogen showed an adhesion maximum in the center of the gradient region. Albumin coating of the gradients resulted in low overall platelet adhesion, with increased adhesion in regions of high negative charge density. The authors of the research described in [Reference Corum and Hlady146] claimed that hydrophilic surfaces show less adhesion of platelets than hydrophobic surfaces. However, this claim does not have support from the surface analysis point of view, comparing true hydrophobic and hydrophilic surfaces [Reference Corum and Hlady146].
Hydrophilic coatings based on polymers make polymer-based devices susceptible to fluids. The lubricity and water retention on the polymer surface reduce the force required to manipulate intravascular medical devices during surgical procedures. The lubricated surface helps to decrease the frictional force between devices 10- to 100-fold and helps reduce the risk of damage to blood vessel walls, enabling navigation in complex vascular pathways. Hydrophilic coatings are being implemented for balloon catheter angioplasty, neurological interventions, lesion crossing, and site-delivered drug therapies, with reduced thrombogenicity in some cases [Reference Hughes147]. Reduction of friction between biological tissue and catheters has contributed to reduced procedure time and cost. Another benefit of hydrophilic coatings on medical devices is that they may create an interface that the human immune system does not recognize as artificial, significantly reducing the risk of problems.
Biologically compatible hydrophilic surfaces, like the demonstrated hydrophilic UNCD surface, can be used as scaffolds for efficient growth of embryonic stem cells and differentiation into other human cells for developmental biology [Reference Shi, Jin, Chen and Auciello58] to treat different human biological conditions via replacement of natural cells by cells created in the laboratory [Reference Shi, Jin, Chen and Auciello58].
Hydrophobic coatings can keep surgical tools and instruments that become fouled with fluids or tissue debris cleaner overall and for longer periods [Reference Hughes147]. Because hydrophobic coatings repel fluids, the blood, urine, or tissue sheets slide off easily. In some cases, these hydrophobic coatings incorporate fluorocarbon functionality in order to improve repellency of hydrocarbons (i.e., lipids); these coatings are generally called oleophobic. In this sense, hydrophobic coatings demonstrate water-repellent, self-cleaning, antifouling, and/or anticorrosive effects [Reference Hughes147]. Medical devices treated with hydrophobic coatings greatly reduce the risks of contamination and infections in patients [Reference Hughes147]. Super-hydrophobic coatings were biologically inspired by the lotus leaf, which has an extremely high water drop contact angle of >120° and low sliding angle of <10°. Micro- and nanoscale architectures on surfaces minimize water droplet adhesion. Super-hydrophobic surfaces refers to those exhibiting extreme water repellency. A super-hydrophobic coating has a water contact angle (WCA) greater than 120° and a sliding angle less than 10°. Many super-hydrophobic coatings become destabilized under adverse conditions and the performance is lost [Reference Hughes147].
Other Devices Benefiting from Tailoring of Surface Wettability.
In addition to the devices described above, there are other devices requiring control of material surface wettability, such as electrochemically highly stable external and implantable electrodes [Reference Varney, Aslam, Janoudi, Chan and Wang148], several external and implantable biomedical devices [Reference Auciello59], chemical and biological sensors [Reference Kang, Gurbuz, Davidson and Kerns149, Reference Gurbuz, Kang, Davidson, Kinser and Kerns150], microfluidics [Reference Guillauden, Zhu and Aslam151], and many other devices and systems.
The information presented above indicates that new paradigms in biocompatible materials with the capability for tailoring their surfaces from super-hydrophilic to super-hydrophobic are necessary. In this sense, the transformational biocompatible UNCD coating provide a new paradigm material, as described in the next section.
Fundamentals on the Synthesis and Characterization of Super-Hydrophobic to Super-Hydrophilic UNCD Coatings Using Chemical Seeding plus HFCVD Process
Background on Research on Wettability of Diamond Surfaces
Before describing the new R&D process for tailoring the wettability of UNCD film surfaces, it is relevant to provide background information on the prior R&D done on the wettability of diamond surfaces. In this sense, from the information shown in Table 1.2 and the literature cited therein, it appears that there are no reports on systematic research on the influence of grain size of PCD films on the surface chemistry termination and their effects on the wettability of the treated surfaces. Therefore, the research reviewed in this section relates to work performed by Montano et al. [Reference Gabriela Montano-Figueroa, Alcantar-Peña and Tirado152], which was focused on performing systematic studies of O2, H2, and CF4-based plasma treatment of MCD, NCD, and UNCD films, and the effect of combined surface chemistry and UNCD-coated 3D microstructured surfaces, all on surface wettability and related performance.
| Sample | Treatment | Process time | Gases | Characterization | WCA | Ref. |
|---|---|---|---|---|---|---|
| PCD films | Plasoxidation and fluorination | SF6: 10 min O2: 10 min | SF6 , O2 plasmas | SEM, Raman, XPS | Not reported | [Reference Teli, Hori and Goto153] |
| UNCD/amorphous carbon (a-C) by MPCVD | Plasoxidation and fluorination | O2: 10 min CHF3: 10 min | O2, CHF3 | XPS, TOF-SIMS, AFM, and WCA | O2: 33 ± 1° CHF3: 91 ± 1 | [Reference Popov, Vasilchina and Kulisch154] |
| NCD by MPCVD | Air oxidation + hydrogenation in microwave plasma | O2: 15 min H2: 15 min | O2 , H2 | WCA | O2: ~5° H2: ~110° | [Reference Osterovskaya, Perevertailo, Ralchenko, Saveliev and Zhuraviev155] |
| Diamond | Glow discharge plasma | CF4: 5, 10, 15, 30, and 60 min | CF4 | AFM, Raman spectroscopy, XPS | Not reported | [Reference Durant, Baranauskas and Peterlevitz156] |
| Type 2A Diamond (100) | Direct treatment with molecular and atomic beams in UHV | Not reported | 5% fluorine in argon gas mixture | XPS and LEED | Not reported | [Reference Fredman and Stinespring157] |
| Boron-doped epitaxial diamond layers | Plasma fluorination and oxidation | CF4: 2 min O2: 2 min | CF4 , O2 | AFM and XPS | Not reported | [Reference Denisenko, Romanyuk, Pietzka, Scharpf and Kohn158] |
| Diamond powder commercial | Plasma fluorination | CF4: 10 min | CF4 | FTIR DRS and XPS | Not reported | [Reference Ando, Tanaka and Ishii159] |
| Diamond-like carbon (DLC) | Plasma fluorination | C4F8: 30 s CHF3: 30 s | C4F8 , CHF3 | Ellipsometry, AFM, and WCA | Both gases: ~90–100° | [Reference Schvartzman, Mathur, Hone, Jahnes and Wind160] |
| UNCD | Plasma fluorination | CHF3 /SF6: 5–900 s | CHF3, SF6 | WCA, XPS, and AFM | CHF3: 90–100° SF6: 110° | [Reference Kulisch, Voss and Merker161] |
| NCD commercial | Plasma oxidation and fluorination | O2: 30 min C3F8: 30 min | O2 , C3F8 | XPS and WCA | O2: 34.11° C3F8: 101.16° | [Reference Park, Son and Kim162] |
Growth of UNCD Films by Chemical Seeding Plus HFCVD Process
Montano et al. [Reference Gabriela Montano-Figueroa, Alcantar-Peña and Tirado152] investigated wettability of MCD, NCD, and UNCD film surfaces. However, only the studies on UNCD film surface wettability are reviewed here, and the reader is referred to [Reference Gabriela Montano-Figueroa, Alcantar-Peña and Tirado152] to read about the research on MCD and NCD films.
The UNCD films were grown using the HFCVD technique. The UNCD films were grown on electrically conductive р-Si (Reference Coffman, Cao and Pianetta111) wafers inserted in the HFCVD chamber onto a rotating substrate holder, located underneath an array of 10 parallel tungsten (W) filaments (see Section 1.3.2.2. and Figure 1.20 and [Reference Fuentes-Fernandez, Alcantar-Peña and Lee74]). The parameters used to grow the UNCD films are shown in Table 1.3, which correlates with the production of nanoscale dense UNCD films on Si surfaces (Figure 1.28). For the research focused on investigating the effect of 3D structures on wettability of UNCD films, these films were grown on a large array of micropatterned pillars on Si substrates (Figure 1.29) using well-established photolithography and reactive ion etching processes [Reference Gabriela Montano-Figueroa, Alcantar-Peña and Tirado152]. Because of the nanoscale size (3–5 nm) of UNCD, these films can be grown with excellent thickness uniformity (Figure 1.28) and density on high aspect ratio 3D structures like pillars (Figure 1.29c,d). The parameters used to grow UNCD films on the 3D Si pillars are shown in the first row of Table 1.3. The Si pillar dimensions were: diameter, 20 μm; height, 5 μm; and distance between pillars, 20 μm.
| Polycrystalline type of film | Gas mixture H2/CH4/Ar (sccm) | Growth time (h) | Distance between filaments and sample (mm) | Film thickness (nm) | Sample code |
|---|---|---|---|---|---|
| UNCD | 10–2–90 | 2 | 20 | 118 | 10 |
| UNCD | 25–2–75 | 2 | 20 | 135 | 25 |
Treatment of PCD Films Surfaces with O2, H2, and CF4 Plasmas to Tailor Wettability and Characterization
UNCD Surface Treatment.
UNCD films were inserted in a reactive ion etching (RIE) chamber to perform CF4 and O2 plasma-based treatment of the UNCD films’ surfaces. The CF4 and O2 plasma treatments were done on a TRION Sirus T2-Tabletop RIE, using the following conditions:
1. O2 plasma treatment: power: 50 W; O2 flow rate: 8 sccm; process pressure: 100 mTorr; process time: 30 seconds.
2. CF4 plasma treatment: power: 100 W; CF4 flow rate: 12 sccm; process pressure: 50 mTorr; process time: 60 seconds.
3. Hydrogen plasma treatment: the microwave plasma treatment was performed in the MPCVD system used to grow UNCD films (see Figure 1.3) using flow of Ar (50 sccm) and H2 (50 sccm) gases and a microwave process power of 2500 W to generate the plasma. The substrate surface temperature was monitored with a pyrometer aimed at the surface, reading 592 °C. The H-plasma process time was 10 min, followed by cooling down in 200 sccm of H2 gas flow until the UNCD film surface reached a temperature of 100 °C.
Characterization of Key Parameters of the Treated Surfaces of UNCD Films to Produce Super-hydrophilic to Super-Hydrophobic Surfaces
Surface Chemistry.
For UNCD films, the Raman analysis, with visible laser wavelength (532 nm), revealed the characteristic spectrum dominated by Raman scattering from the sp2-bonded C atoms in the grain boundaries (see Figure 1.27A(a); 5 nm curve in Section 1.3.2.3). Raman analysis of the UNCD film using UV laser of 244 nm wavelength revealed the 1332 cm–1 diamond peak, although very small (see Figure 1.27A(b)/ UNCD film in Section 1.3.2.3).
Thickness and Surface Morphology of Flat and 3D Structured UNCD films.
The thicknesses of the UNCD films were measured using cross-section SEM imaging (Figure 1.28), and the surface roughnesses were measured using AFM (top right insert in Figure 1.28). The AFM measurements revealed the characteristic nanoscale surface roughness of UNCD films in the range of 3–7 nm.
Cross-section SEM image of a UNCD film grown using HFCVD on the surface of an Si wafer; the top right insert shows an AFM image of the surface of the UNCD film, revealing an rms roughness of about 3–7 nm.

UNCD films were grown on a large array of micropatterned pillars on Si substrates, such that the top surface exhibited the characteristic UNCD smooth structure (Figure 1.29a). Figure 1.29b shows a low-magnification SEM image of the large array of Si pillars coated with a very conformal UNCD film. Figure 1.29c,e shows high-magnification cross-section SEM images of an Si pillar coated with UNCD film, revealing the extreme uniformity of the UNCD film thickness achieved on the high aspect ratio 3D pillar structures [Reference Gabriela Montano-Figueroa, Alcantar-Peña and Tirado152]. Finally, Figure 1.29d shows a summary of the static WCA measurements on UNCD film surfaces with different chemical treatments on flat and 3D structures, revealing the orders of magnitude change in the surface nature of UNCD films from super-hydrophilic, when treated with an O2 plasma, to super-hydrophobic when treated with a CF4 plasma and grown on a microstructured Si large pillar array.
(a) SEM top view of a flat UNCD surface on top of an Si pillar. (b) Low-magnification image of UNCD-coated Si pillars array. (c,e) Part of a high-magnification image of a UNCD-coated Si pillar, showing the excellent dense/conformal coating achieved on the 3D structured Si surface. (d) WCA vs. chemical surface treatment of UNCD coatings grown on flat Si substrates and on a 3D structured Si pillar array, showing the controllable wettability properties by different means, tailoring from super-hydrophilic surface with WCA ~ 0 to super-hydrophobic surface (UNCD-coated Si pillar treated with CF4 plasma) with WCA 178° (including the measurement error).

The importance of controlling the wettability properties of a large range of PCD films through a relatively easy and short-duration process is that it has a direct impact on a wide range of applications to biomedical devices and protheses coated with UNCD films.
Water Contact Angle Measurements on UNCD Film Surfaces.
Figure 1.30 shows the systematic measurement of the static WCA from all UNCD film flat surfaces and their XPS survey analysis, as well as the microtextured UNCD surfaces grown on the Si pillar arrays. The pictures in Figures 1.30a–c show the results from WCA measurement of flat UNCD surfaces and their change in surface energy [Reference Gabriela Montano-Figueroa, Alcantar-Peña and Tirado152]:
1. Super-hydrophilic (total wetting of the surface) with high surface energy, after 30 s O2 plasma treatment (Figure 1.30a), inducing O atoms and/or O–H molecules attaching to the surface, and reacting chemically with water molecules.
2. Medium hydrophobic (with UNCD-H terminated surface by MPCVD H-plasma processing (Figure 1.30b).
3. Hydrophobic, after 60 s CF4 plasma treatment (Figure 1.30c) with low surface energy.
4. Highly hydrophobic, pillar textured Si surface coated with a UNCD film with the surface terminated by H atoms via H-plasma treatment with an MPCVD H-plasma process, such that the H atoms, chemically bonding to C open bonds on the UNCD surface, inhibit chemical reactions of the C atoms with water (H2O) molecules (Figure 1.30d) (WCA = 159°) [Reference Gabriela Montano-Figueroa, Alcantar-Peña and Tirado152].
5. Pillar array textured Si surface coated with UNCD films, plus exposure to a CF4 plasma inducing a super-hydrophobic surface, induced by the combination of texture plus UNCD surface termination with F atoms, inducing the highest water drop contact angle demonstrated today (~178° water drop contact angle to the UNCD surface) [Reference Gabriela Montano-Figueroa, Alcantar-Peña and Tirado152].
XPS analysis of the surface of the treated UNCD films, shown in Figure 1.30f, showed the following results:
1. The oxygen plasma treatment resulted in replacement of H atoms on the surface of the as-grown UNCD films by O and OH groups. This agrees with results reported by other groups [Reference Popov, Vasilchina and Kulisch154, Reference Park, Son and Kim162].
2. In the case of CF4 plasma treatment, a single XPS narrow peak appeared for the fluorinated UNCD surface, which is consistent with the formation of a carbon-monofluoride species on the surface, as also confirmed by other authors [Reference Denisenko, Romanyuk, Pietzka, Scharpf and Kohn158]. So, the presence of the prominent F1s peak confirms the surface fluorination of the UNCD film, which was not shown in the survey XPS spectra for the films treated with O2 or not treated at all. The bonding energy of the C–F bond is very high, thus enabling high stability of the fluorinated surface.
(a) Flat UNCD film surface treated with an O2 plasma for 30 s. (b) Flat UNCD surface terminated with H atoms. (c) Flat UNCD surface treated with a CF4 plasma for 60 s. (d) UNCD-coated Si pillar array with the UNCD surface terminated with H atoms. (e) Fluorinated UNCD-coated Si pillar array treated with a CF4 plasma for 50 s. (f) Survey XPS spectra of as-grown UNCD film (bottom curve), H-surface terminated UNCD film (second curve from bottom), O-surface terminated UNCD film (third curve from bottom), and finally F-surface terminated UNCD film (top curve) [Reference Gabriela Montano-Figueroa, Alcantar-Peña and Tirado152].

The results reported in [Reference Gabriela Montano-Figueroa, Alcantar-Peña and Tirado152] indicate that when a water drop interacts with a textured surface, such as the Si micropillars, two distinguished wetting states can be formed: the Wenzel state (θW), where the liquid penetrates the structures, wetting the whole surface; or the Cassie–Baxter state (θCB), where the water droplet is suspended on top of the textures and the droplets placed on them remain almost spherical [Reference Nosonovsky and Bhushan163, Reference Kim, Choi and Williams164]. Hence, θW and θCB were calculated by the researchers of [Reference Gabriela Montano-Figueroa, Alcantar-Peña and Tirado152] for the two cases: (1) Si micropillars coated with UNCD film; and (2) Si micropillars coated with UNCD film exposed to CF4 plasma. θW and θCB calculated values are shown in Table 1.4. The values of f (the fraction of the liquid droplet touching solid and not air) represents the fraction of the solid–liquid interface in the entire composite surface beneath the liquid, obtained by using the Cassie–Baxter formula, and r (the ratio of the actual area of the solid–liquid interface to the normally projected area), obtained by using the Wenzel formula, was used to calculate θW and θCB, enabling correlation with experimental measurements. The calculations indicate that the Wenzel model correlates better with the wettability state of the UNCD-coated Si pillar array without fluorine treatment, while the Cassie–Baxter model correlates better with the state of the fluorinated UNCD-coated Si pillar array (Table 1.4).
| Sample | θmeas | θW | θCB |
|---|---|---|---|
| Si pillars + UNCD | 130.43 + 8.01 | 141.10 | 158.39 |
| Si pillars + UNCD + CF4 | 178. ± 1.0 | NA | 176.40 |
The results described above revealed the key role that CF4 plasma treatment of UNCD film surface has on enhancing the hydrophobic intrinsic behavior of a material such as UNCD, by controlling the surface chemistry, combined with the microstructure of the substrate, resulting in a synergistic effect that leads to the formation of Cassie–Baxter droplets, where the liquid sits partially on the air trapped underneath. The experimental observation is that water does not adsorb at all on the fluorinated UNCD micro-/nanostructured surface, which provides a new material paradigm for application to a broad range of blood-interfacing implantable medical devices.
1.3.2.5 Fundamentals on Synthesis and Characterization of PCD Films By the HFCVD-Based BEN-BEG Process
Background on HFCVD BEN-BEG of Diamond Films
As discussed in Section 1.2.1.3, the BEN-BEG processes to grow UNCD, NCD, and MCD films without any chemical pre-seeding process were first developed for the MPCVD technique, and that work involved a systematic characterization of the process using complementary HRTEM, SEM, Raman, and XPS studies, which revealed details of the film nanostructure and interfaces, critical to understanding the BEN-BEG process (see Section 1.2.13 and references therein for details on the MPCVD BEN-BEG process). Further information on the MPCVD BEN-BEG process, relevant to the discussion on the HFCVD BEN-BEG process, should be considered. Careful reading of published research on BEN to grow NCD and MCD films indicates that either ultrasonic scratching of the substrate surface in a solution containing diamond powder was done before carrying out the BEN-BEG process [Reference Yang, Xiao and Hirose165], or polishing of the substrate surface with diamond powder was done (with micro-size particles), followed by oxygen annealing at high temperature, supposedly to eliminate diamond particles embedded on the substrate surface, but without presenting clear evidence that the cleaning happened, so most probably the particles were on the surface acting as chemical seeding [Reference Stoner and Glass166]. On the other hand, other work involved studies of the MPCVD BEN-BEG growth process synthesizing MCD and NCD films, without any chemical pre-seeding process, but unfortunately the studies involved only Raman analysis and low-resolution SEM imaging of the film surface [Reference Soga, Sharda and Jimbo167], neither of which can provide key insights into the nanostructure of the films and interfaces at the nanoscale to better understand the underlying mechanisms of the BEN-BEG process, as done for the research reported on MPCVD BEN-BEG of UNCD films, including detailed HRTEM studies [Reference Chen, Zhong and Konicek81, Reference Zhong, Chen and Tai83].
More recently, research was performed on the BEN-BEG process by different groups using the HFCVD technique to grow UNCD to MCD films. Table 10.5 shows a summary of the results from research related to BEN-BEG of diamond films using the HFCVD process. In this sense, Table 10.5 shows that most of the research performed was focused on HFCVD BEN-BEG of diamond films on Si++ substrates, mostly on small areas, except for [Reference Janischowsky, Ebert and Kohn168], where the authors attempted to do BEN-BEG on up to 100 mm diameter Si substrate but were not able to cover the substrate with uniform film all the way to the edge.
| System configuration | Gas mixture(%) | Substrate | Pressure (Torr) | Filament temp. (°C) | Substrate temp. (°C) | Bias volt (V)/ curr (A) or V/sub curr. dens. | BEN- BEG (h) | Growth time (h) | Substrate diameter | Ref. |
|---|---|---|---|---|---|---|---|---|---|---|
| Filament to substrate bias | H2 – 1; CH4 –1–5; Ar – 97–94 | – | 10–50 | <2800 | 400–800 | (–) 150–200/0.05 (+) 30–40/0.05 | 3 | 3 | – | [Reference Uppireddi, Weiner and Morell169] |
| Grid behind filaments (+) Substrate (–) | H2 – 98; CH4 – 2 | Si (100) | – | 2100 | 600 | 240/0.005 | 0.5 | 4–20 | – | [Reference Makris, Giorgi, Lisi, Pilloni and Salernitano170] |
| Grid behind filaments (+) Substrate (–) | H2 – 96.5; CH4 – 3.5 | Si (100) | 30 | 2100 | 800–850 | 28/0.4 grid – 150 (0.3 mA/cm2) | 0.5 | 12 | [Reference Zhou, Lai and Peng171] | |
| Grid behind filament (+) Substrate (–) | H2 – 96.5; CH4 – 0.7 (add N for growth) | Si (100) | 15 | 2000 | 700–840 | +60/–200 (0.5 mA/cm2) | 2–4 | 3 | 100 mm | [Reference Janischowsky, Ebert and Kohn168] |
| Grid behind filament (+) Grid-front (–) (+) Substrate(–) | H2 – 94; CH4 – 4 (change for growth) | Si (Reference Coffman, Cao and Pianetta111) | 15–30 | – | 700–850 | +15–170 (0.2 mA/cm2) | 0.25 | 0.11 | 3 mm | [Reference Pecoraro, Arnault and Werckmann172] |
| Filament– substrate bias | H2 – 80; CH4 – 20 | Si (Reference Prins100) | 30 | 2200 | ~800 | (–)150/ vs. growth time and grain size | 2 | None | [Reference Li, Li, Wang, Yang and Gu173] | |
| Filament to substrate bias | H2 – 1; CH4 – 7; Ar – 92 | Si (Reference Prins100) | 12 | 2350 | 950 | (–)200 /not reported | 0.5 | 1.5–2 | [Reference Ansari, Anh and Seo174] | |
| Filament to substrate bias | H2 – 49; CH4 – 2; Ar – 49 | 40 nm W/Si (100) | 10 | 2300 | 550 | (–)230–250/1.5 A | 0.5–2 | 2 | 100 mm | [Reference Alcantar-Peña, de Obaldia and Montes-Gutierrez135] |
Fundamentals and Technological Development of HFCVD BEN-BEG of UNCD Films
Based on the information presented above, Auciello’s group started to perform systematic studies to investigate the fundamentals and develop and optimize the growth of uniform UNCD films on large-area substrates, using the HFCVD BEN-BEG process [Reference Alcantar-Peña, de Obaldia and Montes-Gutierrez135]. This work focused initially on growing uniform UNCD films on 100 mm diameter substrate (as an intermediate stage to scale to ≥200 mm diameter wafers) Si wafers. The Si wafers were coated with 40 nm thick tungsten (W) layers to provide high electrical conductivity surfaces and high-density UNCD film growth, as demonstrated for MPCVD growth of UNCD films [Reference Auciello and Sumant22, Reference Naguib, Elam and Birrell137] grown on the WC nucleation layer forming W surfaces [Reference Auciello and Sumant22, Reference Naguib, Elam and Birrell137]. The research cited in [Reference Alcantar-Peña, de Obaldia and Montes-Gutierrez135] showed that the HFCVD BEN-BEG process can be applied to other substrates with different electrical conductivity, including semiconductors. The importance of understanding the UNCD HFCVD BEN-BEG growth process on large-area substrates other than Si, specifically on carbide surface layers, forming materials such as W, Ti, Mo, and more, is because it opens new technological applications of the UNCD coating technology, with substantial reduction in the cost of fabrication of UNCD-coated products based on elimination of the relatively time-consuming and high-cost wet chemical diamond particle seeding process currently used in commercial production of UNCD-coated industrial products [25]. In addition, HFCVD BEN-BEG of uniform UNCD films over larger areas will enable selective/directional growth of UNCD films on patterned W structured layers for fabrication of devices on large-area wafers used in the semiconductor industry [Reference Alcantar-Peña, de Obaldia and Montes-Gutierrez135].
The HFCVD system used for the research on HFCVD BEN-BEG of UNCD films is shown in Figure 1.20. Figure 1.31a shows a picture of the HFCVD in operation, revealing the plasma produced on top of the substrate surface, from where the positively charged C+, CHx+, H+, and Ar+ ions are accelerated toward the negatively biased substrate, inducing sub-implantation of C atoms under the surface, inducing the UNCD film BEN-BEG process.
(a) The HFCVD system in operation, showing the plasma created on top of the substrate surface, inducing the UNCD film BEN-BEG process. (b) Computer simulation providing information on the electric field lines in the plasma created between the positively biased filaments and the negatively biased substrate, revealing concentration of field lines on the edges, which correlates with the film growth geometry shown below.

A key parameter in the HFCVD BEN-BEG UNCD film growth process is the incubation time when C-based diamond nanocrystals nucleate on the substrate surface during the BEN process, followed by the growth of the diamond nanoscale grains, which coalesce to produce a continuous UNCD film during the stage defined as BEG. The BEN-BEG time in the HFCVD-based growth of UNCD films was changed to be in the range 0.5–2.5 h. adding 2 h of film growth time without bias for each film. The filaments were heated to 2300 °C during film growth. A mixture of gases with a ratio of H2 (49%), CH4 (2%), and Ar (49%) was flown into the HFCVD chamber, previously evacuated to ~3 × 10⁻⁶ Torr. The substrate heater temperature was set up at 550 °C. Further experimental details can be found in prior papers [Reference Alcantar-Peña, Lee and Fuentes-Fernandez41, Reference Fuentes-Fernandez, Alcantar-Peña and Lee74]. The BEN-BEG process was performed applying a voltage of ~–220 V on the substrate to keep a constant electrical current of 1.5 A through the plasma. SEM and HRTEM analyses were used to characterize the surface morphology and nanostructure of the UNCD films, respectively. XRD was used to characterize the crystallinity and grain sizes of the UNCD films. Raman spectroscopy was performed, using a 532 nm wavelength laser beam, to characterize the chemical bonds in the UNCD films. The surface chemistry of the UNCD films was characterized by XPS. Details of all the characterization systems and parameters used for the analyses can be found in [Reference Alcantar-Peña, de Obaldia and Montes-Gutierrez135].
Figure 1.32a shows the bias voltage (Vb) between the filaments and the substrate vs. the BEN time in the range 1–2.5 h. Figure 1.32b shows Raman spectra for UNCD films grown for several BEN-BEG times in the range 0.5–2.5 h. The plasma was stabilized after several minutes of starting the BEN process. The reduction in the voltage between the filament and the substrate vs. the BEN time, observed in Figure 1.32a, can be attributed to the formation of the UNCD grains with sp3-C atom bonding characteristic of diamond, and grain boundaries with sp2-C atoms bonding, from which electron emission has been demonstrated to arise due to carriers originating from the formation of the sp2-bonded carbon [Reference Auciello and Sumant22]. Therefore, the abrupt decrease and subsequent stabilization of the bias voltage Vb can be attributed to the rapid growth of nanodiamond grains, characteristic of the UNCD films and subsequent full coverage of the substrate with a dense UNCD film, respectively, as observed previously for the MPCVD BEN-BEG process [Reference Chen, Zhong and Konicek81, Reference Zhong, Chen and Tai83]. The results of BEN-BEG of UNCD films described in [Reference Alcantar-Peña, de Obaldia and Montes-Gutierrez135], as well as other BEN results shown in the literature for HFCVD BEN-BEG of NCD and UNCD films [Reference Soga, Sharda and Jimbo167], without any chemical diamond seeding, are in principle supported by modeling developed to explain BEN of diamond on Si substrates [Reference Robertson, Gerber and Sattel175–Reference García, Jiménez, Sánchez, Gómez-Aleixandre and Vázquez177], which indicate that there may be a bias-induced nucleation of carbon-based layers to subsequently induce diamond grain growth, produced by C+ and CHx+ ion sub-plantation near the substrate surface. The modeling indicates that bias in the range –100 to 250 V would provide ion energies sufficient to pass through the surface atomic layer and enter a subsurface interstitial position at a depth in the range 5–10 nm under the surface.
Figure 1.32b shows Raman spectra for all five UNCD films for which the voltage vs. BEN time curves are shown in Figure 1.32a. Raman analysis were done on the edge, middle, and center areas of the films across the 100 mm diameter substrate. The Raman spectra obtained at ~5 mm from the edge of the UNCD film grown for 0.5 h show the characteristic D and G mode peaks, although small, present in every UNCD film grown for the last many years [Reference Auciello and Sumant22]. On the other hand, the Raman signal intensity in the middle and center of the film are very similar, but very small, indicating good uniformity in the initial stages of nucleation. As the BEN-BEG time increases, the D and G mode signals increase, more prominently at the edges, until the 2.5 h growth time, for which all Raman spectra from center, middle, and edge overlap, showing excellent uniformity of the UNCD film across the 100 mm diameter substrate. The Raman data indicates that the nucleation starts on the edges, where the electric fields concentrate first on the electrically conductive substrate. Once the insulating UNCD film nucleates on the edges, the electric field transfers to the less nucleated area between the center and the edge, and finally it transfers to the center to complete the nucleation, resulting in a uniform film growth across the 100 mm diameter wafer, as shown by the Raman spectra for the 2.5 h growth.
(a) Voltage between filaments and substrate vs. BEN times at a constant 1.5 A plasma current and –220 V applied to the substrate with respect to the positive biased filaments. (b) Raman spectra obtained from analysis on the center, middle, and edge areas of the UNCD films, grown on a W (40 nm thick) layer on an Si substrate surface via BEN-BEG times in the range 0.5–2.5 h, plus an additional 2 h growth time without bias. The broad peaks at ~1340 cm−1 (D band) and ~1588 cm−1 (G band) are characteristic of the sp2-C atom bond hybridization in the grain boundaries of the UNCD films [Reference Alcantar-Peña, Lee and Fuentes-Fernandez41, Reference Fuentes-Fernandez, Alcantar-Peña and Lee74, Reference Alcantar-Peña, de Obaldia and Montes-Gutierrez135] (for UNCD films, the diamond Raman peak at 1332 cm−1 is buried inside the broad peak at 1340 cm−1, and can only be seen when using deep UV (244 nm wavelength) laser Raman, as shown in Figure 1.27A(b); the sharp peak at ~1900 cm−1 corresponds to the W layer underneath the UNCD films, which is relatively thin and allows seeing Raman peaks from the underlying W layer.
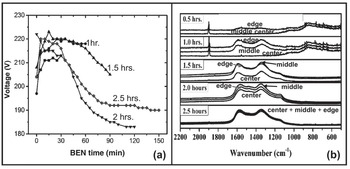
The proposed nucleation and initial UNCD film growth mechanism for the HFCVD BEN-BEG process, based on Figures 1.31b and 1.32b, is supported by three key complementary characterization techniques, as described below.
XRD Analysis.
XRD analysis on all films (Figure 1.33) confirms the information from the Raman analysis, revealing that the UNCD films tend to grow at and near the edge faster than at the center and middle of the substrate. Figure 1.33a shows that for BEG UNCD films grown for 0.5 and 1.0 h, the main peaks are located at positions 1 (31.5°), 2 (35.5°), 3 (39.7°), and 5 (48.5°), which correspond to WC (001), WC (100), W2C (Reference Collins, Lightowlers and Field101), and WC (Reference Collins, Lightowlers and Field101), respectively [Reference Dash, Nayak and Abhangi178]. Diamond (Reference Coffman, Cao and Pianetta111) appears at 2θ = 44°, represented by peak 4 in Figure 1.33a, which starts showing strong intensity after 2.0 h BEN-BEG of UNCD films. Diamond (220) at 75° is convoluted with the WC (Reference Coffman, Cao and Pianetta111) and W2C (221) at 73° and 76° (peaks 7 and 8 in Figure 1.33a). All diamond directions were confirmed by HRTEM diffraction (Figure 1.35). For 2.0 and 2.5 h BEN-BEG of UNCD films, the diamond (311) can be seen in HRTEM, but it cannot be corroborated with XRD since it is a non-allowed diffraction due to the FCC nature of the diamond structure. Figure 1.33 (b) shows the XRD spectra from analysis on the center, middle, and edge areasof a UNCD film grown for 1 h. by BEN-BEG. The XRD peaks correspond mainly to the WC nucleation layer, correlating with the XRD spectra shown in Figure 1.33 (a) for films grown up to 1.5 hrs, with the small diamond (111) peak (5), at 2θ = 44˚, just starting to appear on the edge area, where the film nucleates faster. However, there is no intense diamond (111) peak because the film needs to be grown for ~ 2 hrs to exhibit the dense structure. These results support the need for using complementary analytical techniques to obtain reliable information.
(a) XRD spectra from analysis of BEN-BEG UNCD films grown for 0.5–2.5 h plus additional growth time of 2 h without bias. : b) XRD spectra from analysis on center, middle, and edge areas of a UNCD film grown for 1 h. by BEN-BEG (the XRD peaks correspond mainly to the WC nucleation layer, correlating with the XRD spectra shown in (a) for films grown for up to 1.5 hrs., with the small diamond (111) peak (5) at 2θ = 44˚, just starting to appear on the edge area, where the film nucleate faster (see discussion of the peaks identification in the text).

SEM Analysis.
SEM imaging of the top UNCD film surface on the center, middle, and edge areas (Figure 1.34) confirm the data from Raman and XRD analysis, showing that the UNCD film growth from edge to center, combined with the longer BEN-BEG time (2.5 h), produces the denser UNCD films. The cross-section SEM images show good film thickness uniformity across the 100 mm diameter substrates.
SEM top view images of HFCVD BEN-BEG UNCD films grown for times in the range 0.5–2.5 h, with additional growth time of 2 h without bias. The inset figures (top right corner) for the center, middle, and edge areas of the films grown for 2 and 2.5 h show cross-section SEM images of the full dense films grown across the 100 mm diameter substrates.

HRTEM Studies.
HRTEM images (top view) of BEN-BEG UNCD films grown for times in the range 0.5–2.5 h, plus 2 h growth without bias, are shown in Figure 1.35. All films showed grain sizes of 2–5 nm, characteristic of the UNCD nanostructured films for many applications [Reference Naguib, Birrell, Elam, Carlisle and Auciello21–Reference Shenderova and Gruen23, Reference Carlisle, Gruen, Auciello and Xiao40, Reference Alcantar-Peña, Lee and Fuentes-Fernandez41, Reference Auciello, Shenderova and Gruen46, Reference Tzeng, Auciello, Liu, Lin and Cheng48–Reference Krauss, Ding and Auciello50, Reference Shi, Jin, Chen and Auciello58, Reference Auciello59, Reference Fuentes-Fernandez, Alcantar-Peña and Lee74].
EELS Analysis.
EELS analysis was performed also for all BEN-BEG UNCD films grown in the range 0.5–2.5 h, plus 2 h growth without bias (see a typical curve, similar for all films, in Figure 1.35f). The curve shown in this figure reveals the characteristic spectrum intensity vs. energy loss (step up at about 290 eV and peaks at about 303 and 310 eV) of UNCD obtained in EELS analysis of numerous UNCD films grown with the conventional chemical seeding process using both the MPCVD and the HFCVD processes by many groups worldwide.
Top view HRTEM images of BEN-BEG UNCD films grown for (a) 0.5 h, (b) 1 h, (c) 1.5 h, (d) 2 h, and (e) 2.5 h, plus 2 h growth without bias. (f) Spectrum from EELS analysis corresponding to all BEN-BEG UNCD films, for which HRTEM images are shown in (a)–(e). The inset top right figures show electron diffraction patterns from the UNCD films (the arrows in the diffraction patterns in (a)–(e), pointing to 2.08, 206, and 2.05 Å, correspond to diamond (Reference Coffman, Cao and Pianetta111) orientation; the arrows pointing to 1.27, 1.29, and 1.22 Å correspond to diamond (220) orientation, and the arrows pointing at 1.02 Å correspond to diamond (311) orientation.
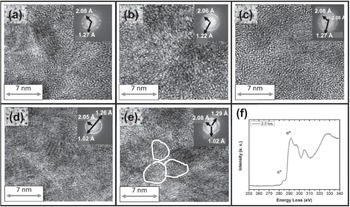
EDAX Analysis.
Energy-dispersive X-ray spectroscopy (EDAX) analysis was performed during the HRTEM studies, through the cross-sections of all the UNCD films, from the surface into the Si substrate. Figure 1.36 shows the EDAX cross-section analysis profiles from the surface of the UNCD films to the diamond/W/Si interfaces for all BEN-BEG UNCD films grown for 0.5–2.5 h, plus 2 h growth without bias. For all UNCD films, it can be seen that Si diffuses into the W layer and vice versa, induced by the high-temperature (600–700 °C) growth process, as observed by other groups [Reference de Luca, Poravoce and Texier179]. In addition, as the time of exposure of the substrate to the BEN-BEG process increases, the electric field plus ion bombardment may induce further interdiffusion of W into the UNCD films, which can explain the observation of W particles into the diamond network for 2.0 and 2.5 h BEN-BEG process. A key feature shown by the EDAX analysis is that Si atoms diffused into the W layer do not reach the surface of the W layer, correlating with the fact that WC regions formed at the W layer surface appear to be the dominant regions contributing to nucleation of the UNCD grains.
EDAX analyses through the cross-sections of BEN-BEG UNCD films grown for (a) 0.5 h, (b) 1 h, (c) 1.5 h, (d) 2 h, and (e) 2.5 h, plus 2 h growth without bias. The EDAX spectra correspond to the HRTEM images shown in

Studies of UNCD/W Layer Interfaces via Cross-Section HRTEM.
A key study enabled understanding of the nucleation process for HFCVD BEN-BEG of UNCD films on a W layer (~40 nm thick) on an Si substrate. Figure 1.37 shows cross-section HRTEM images of the UNCD–W layer interface at the UNCD film nucleation sites for the BEN-BEG UNCD films grown (a) 0.5 h, (b) 1 h, (c) 1.5 h, (d) 2 h, and (e) 2.5 h, plus 2 h growth without bias. All cross-section images were taken at diamond nucleation sites identified via electron diffraction. Determination of the diamond lattice spacing in the UNCD films was done via combination of experimental measurements and modeling using the GMS3 software, applied to different crystal structures containing W and C atoms, such as W, WC, W2C, graphite, and diamond, detected at the UNCD–W interface. The cross-section HRTEM images, shown in Figure 1.37, revealed that crystalline W nuclei are incorporated in the diamond structure during the growth process. Although EDAX cross-section analysis shown in Figure 1.36 indicates that Si atoms can diffuse close to the WC interface, SiW nuclei or Si were not detected via XPS analysis at the WC–C interface. The prevalent diamond orientation in the UNCD grains, as indicated by the XRD analysis shown in Figure 1.33a is (111), because of minimization of the surface energy [Reference Liu and Dandy180]. The interfaces investigated (Figure 1.37) showed the appearance of WC with different orientations (Figure 1.37a) in all the interfaces studied, suggesting that WC plays a key role in the nucleation of diamond crystals. Furthermore, the diamond (111) and the WC (101) have very similar structural spacing, allowing for heteroepitaxial growth. Other crystal structures like graphite and pure W could also be present in the interface, which subsequently starts inducing the nucleation of WC regions on the W layer grown on the Si surface (confirmed by the HRTEM [Reference Alcantar-Peña, de Obaldia and Montes-Gutierrez135]) that incubates the growth of the UNCD grains.
Cross-section HRTEM images of BEN-BEG UNCD?W (40 nm thick) interfaces on Si substrates, grown for (a) 0.5 h, (b) 1 h, (c) 1.5 h, (d) 2 h, and (e) 2.5 h, plus 2 h growth without bias. (f) cross-section LRTEM image of UNCD film grown on W (40 nm thick) layer on Si, showing the nucleation of UNCD film on WC and the extended UNCD grown layer for which HRTEM is shown in (c). (g) table showing identification of W, WC, and diamond phases via electron diffraction from the areas in the squares, where the d-spacing values are correlated with the numbers indicated by the arrows in each inset showing the e-diffraction patterns.

XPS Analysis of UNCD Films.
To complete the systematic analysis of the HFCVD BEN-BEG UNCD films via complementary characterization techniques, XPS analysis was performed (Figure 1.38) on all the BEN-BEG UNCD films described above. The only elements found at the surface of the UNCD films were carbon and tungsten (Figure 1.38a), in addition to O, which is due to exposure of the UNCD surface to the atmospheric environment when transferring the sample from the HFCVD system to the XPS system. No Si was found, and the oxygen in the surface disappeared after the Ar+ sputtering cleaning with 1 KeV Ar+ ions for 30 s. Figure 1.38a shows that the C atoms in the 0.5 h BEN-BEG UNCD films are bound to W atoms, which changes the binding energy of C atoms from 284.5 eV to 282.7 eV [Reference Liu, Li and Zhai181]. As the BEN-BEG film growth process develops, the amount of C atoms and CHx radicals increases, such that C atoms that do not bind to W are free to start binding between each other, enabling the formation of diamond nuclei sites. The XPS W peaks are present as long as the surface is still being converted from W to W2C and WC. For BEN-BEG UNCD films grown for 2.0 h and 2.5 h, the layer of crystalline diamond is dense enough that no C atoms appear bound to W and no W atoms are visible (green flat curve in figure S8B in [Reference Alcantar-Peña, de Obaldia and Montes-Gutierrez135]). The XPS C peak bond energy (285 eV) for UNCD films grown for 1.5–2.5 h corresponds to the C peak bond energy characteristic in the diamond phase. To further understand the Si–W and WC–C interfaces, the 0.5 h HFCVD BEN-BEG-grown UNCD films were analyzed as a function of depth from the film surface, using XPS profiling, involving Ar+ ion bombardment to produce physical etching of the film. The depth profiling showed no evidence of Si at the WC–C interface (Figure 1.38b). The W–WC interface could not be determined, but it was clear that there was a very thin layer of SiO2 between the Si–W/WC interface, as shown by the presence of a sharp O peak at the Si–W interface (Figure 1.38b). The data shows that, initially, the CHx+ (x = 1, 2, 3) radical ions and C+ ions produced in the plasma are accelerated toward the negatively biased substrate, producing sub-plantation at the W layer surface, inducing preferential formation of WC instead of sp3-C bond formation characteristic of diamond. Once the W layer surface is transformed to WC, then formation of sp3-C bonds occurs, corresponding to the diamond phase [Reference Liu, Xie, Sun, Ning and Jiang182].
XPS analysis of HFCVD BEN-BEG-grown UNCD films, showing the presence of C, O, and W atom binding energy (a) at 0.5 h BEN-BEG time, and the XPS analysis profile spectra (b) when inducing physical etching of the film, via in situ Ar+ ion beam bombardment-induced sputtering in the XPS system.

Complementary Experiment and Modeling of HFCVD BEN-BEG of UNCD Films.
The mechanism proposed for explaining the growth of UNCD film by HFCVD BEN/BEG on W-covered Si wafers can be seen in Figure 1.39. The initial step, according to this figure, is the formation of a plasma between the filaments and the substrate and substrate holder at a bias voltage of ~200 V, applied between the positively biased filaments and the negatively biased substrate. Figure 1.39a shows that the plasma covers the entire wafer surface. However, Figure 1.39b shows that there is an electric field–enhanced concentration at the relatively sharp substrate holder edges, inducing higher amounts of CHx+ and C+ ions striking the edge of the wafer, initially inducing sub-plantation of the ions on the W layer to induce formation of the W2C/WC nucleation sites as a precursor for the formation of diamond nanocrystals. Figure 1.39c represents the actual nucleation and growth of the diamond nanocrystals, such that as the W surface layer gets transformed to W2C/WC, the nucleation and growth of the diamond cluster propagates toward the center. The WC layer then spreads across the substrate surface from edge to center with different crystal orientations until enough nuclei of W (001) and (Reference Collins, Lightowlers and Field101) are grown to induce formation of diamond (111), based on the fact that the WC and diamond crystals have similar lattice parameters and low activation energy of 1.39 eV [Reference Koeck and Nemanich183]. The optimum time determined for the HFCVD BEN-BEG of UNCD film on a W surface is ~2.5 h, based on the observation that UNCD films produced for this growth time are very uniform, as shown in Figure 1.39d, revealing a fully coated 100 mm diameter W-coated Si substrate with a ~200 nm thick UNCD film.
(a) Overall schematic of electric field lines across filaments over the W-coated 100 mm diameter Si substrate. (b) Schematic showing the BEN-BEG process inducing WC formation on the surface of the W layer grown on the Si substrate and Si–W reaction areas at the Si–W layer interface. (c) Model representation of plasma–electric field lines inducing diamond nuclei formation from the substrate edge toward the center, due mainly to the initial electric field concentration at the W-coated Si substrate edges during the BEN-BEG growth process. (d) Picture of uniform BEN-BEG UNCD film across 100 mm W-coated Si substrate after 2.5 h of BEN-BEG followed by 2 h of growth without bias.

The HFCVD BEN-BEG growth process to grow UNCD films on Si and other substrates opened the path to new technological applications of UNCD films grown by this unique process, as described in the next section.
Selective Growth of UNCD Films on W-Patterned Layers on a Si Substrate.
The electric fields generated between the filaments and the W-coated Si substrate during growth of UNCD films by the HFCVD BEN-BEG process can be used to induce selective growth of diamond films on patterned metallic layers grown on Si or other semiconducting or insulating substrates to produce UNCD film-based patterned devices. This process was demonstrated by producing BEN-BEG of UNCD films on W film–patterned lines on Si substrates. Figure 1.40a shows a BEN-BEG UNCD film grown on patterned W lines resembling a diamond grown on an SiO2/Si substrate. Figure 1.40b shows the plasma concentrated on the W lines during the HFCVD BEN-BEG of UNCD film selectively grown on the electrically conductive W lines grown on an insulating SiO2/Si substrate. This experiment demonstrates the feasibility of using the HFCVD BEN-BEG technique for growing UNCD and other diamond films selectively on W-patterned layers on Si-based substrates.
(a) Optical picture of UNCD film grown selectively on electrically conductive W-patterned lines with a diamond shape, grown on an SiO2/Si substrate exposed to 2.0 h of HFCVD BEN-BEG with additional growth time of 2 h without bias. (b) Picture taken during the HFCVD BEN-BEG UNCD film growth process, showing the plasma concentrated on the electrically conductive W lines, connected to the electrically conductive substrate holder with thin wire (compare this picture with the one shown in Figure 1.31a, which shows the bright plasma uniformly distributed across the whole W-coated Si substrate).

Conclusions on the HFCVD BEN-BEG Process
HFCVD BEN-BEG of UNCD films on W-coated 100 mm diameter Si-based substrates has shown key outcomes:
1. The HFCVD BEN-BEG process produces UNCD films with excellent uniformity on up to 100 mm diameter substrates, using optimized growth times in the range 2.0–2.5 h; however, if the BEN-BEG process is sustained beyond 2.5 h the UNCD film starts to be etched away.
2. The data show that 2.0 h of HFCVD BEN-BEG time induces nucleation of diamond nanocrystals with orientation (001) and (Reference Collins, Lightowlers and Field101), which stimulate the formation of diamond grains with (111), (220), and (311) orientations.
3. The concentration of electric fields on the edge area of the substrates has a key influence on the BEN-BEG growth mode, starting from the edge and progressing toward the center area.
4. The HFCVD BEN-BEG process can provide a pathway for producing selectively grown UNCD and other diamond films on patterned electrically conductive W lines on large-area Si substrates for fabrication of diamond-based electronics in the future.
1.4 Conclusions
There are key conclusions related to the UNCD coating technology reviewed in this chapter, with a view to applications in a new generation of medical devices and prostheses:
1. The fundamental and applied science focused on understanding the bases for the synthesis and properties of the novel material named UNCD, in thin-film (coating) form, since its invention in the early 1990s, and the numerous applications demonstrated until now and those upcoming in the future have proven that UNCD represents a new paradigm material that exhibits a broad range of functionalities applicable to a large range of multifunctional devices.
2. The past 20 years of R&D on UNCD coatings have been extremely productive in advancing the science and technological applications, and many groups worldwide are now working on the science and technology of UNCD coatings, which provides a pathway for substantial advances in the future.
3. UNCD coatings are already in commercial industrial products (e.g., UNCD-coated mechanical pump seals and bearings, AFM tips, and electrically conductive/corrosion-resistant boron-doped UNCD-coated metal electrodes in electrolysis-based water purification systems) currently commercialized by Advanced Diamond Technologies (a company co-founded by O. Auciello and colleagues in 2003, profitable in 2014, and partially sold to a large company in 2019).
4. The next frontier is the application of UNCD coatings as a unique biocompatible material made of C atoms (the element of life in all human DNA, cells, and molecules). UNCD-coated dental implants are in an advanced state of clinical trials (20 patients have already received UNCD-coated dental implants since 2018, which are demonstrating far superior performance compared with current metal-based implants). The clinical trials are being conducted by Original Biomedical Implants (OBI-USA and OBI-México), two companies founded by Auciello and colleagues, in collaboration with Dr. Gilberto Lopez (a world-class craniofacial surgeon) in Querétaro-México (see Chapter 5). Other UNCD coating-based prostheses to be developed include hips, knees, and many more.
5. The two techniques to grow UNCD coatings reviewed in this introductory chapter, microwave plasma chemical vapor deposition (MPCVD) and hot filament chemical vapor deposition (HFCVD), are the two key techniques that can be used to grow the UNCD coatings for different applications. Each of these techniques needs to be explored to produce the UNCD coatings for particular applications in order to determine which one of them is the most appropriate for application to particular devices or systems.
In conclusion, UNCD coating provides a new paradigm material with superior biocompatibility for new generations of medical devices and prostheses.