


Introduction
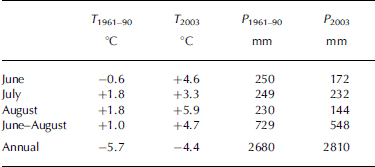
Glaciers can regulate and compensate the water supply of alpine catchments during warm, dry summer periods. The fraction of ice melt during summer strongly depends on the glacierized share of the catchment area, the area and the time period at which bare ice is exposed to solar radiation and the climatic conditions at the catchment. The summer of 2003 in Europe was an outstanding event (Reference BenistonBeniston, 2004; Schär and others, 2004). Analysis of the long-term climatological time series of Sonnblick observatory, Austria, from 1886 until the present (Reference Auer, Böhm, Leymüller and SchönerAuer and others, 2002) shows that the mean summer (June–August) air temperature was exceeded by 3.9˚C in 2003. The mean summer air temperature for the period 1961–90 was exceeded by 3.7˚C in 2003 (see Table 1). The hot and dry conditions in summer 2003 had an extreme impact on glacier melt, so that the 2002/03 annual glacier net balance of Goldbergkees, Austria, was the most negative since the start of observations (Reference Hynek and SchönerHynek and Schöner, 2004; Reference Schöner, Auer, Böhm, Hynek, Holzmann, Koboltschnig and HerrmannSchöner and others, 2004). Table 1 shows that in 2003 June and August were exceptionally warm and dry compared to the long-term mean values (climate normal period 1961–90; Reference Auer, Böhm, Leymüller and SchönerAuer and others, 2002), but, comparing the annual precipitation and air temperatures, no extreme anomalies can be seen for 2003. It should be noted that 60% of the August precipitation was registered in the last 3 days of the month, and only then did slightly negative air temperatures appear.
Mean air temperature and cumulative precipitation at Sonnblick observatory (3106ma.s.l.): comparison of the 2003 and the long-term (1960–90) values
Runoff observations during summer 2003 show distinctive diurnal variations induced by ice melt and high peak discharges during periods without rainfall (Fig. 3a and b, further below). Reference Collins, Semadeni-Davies, Bengtsson and WesterströmCollins (2005) gives an overview of the temporal variations of climate change and runoff. It is mentioned that most of the Alpine glaciers declining from their extension during the Little Ice Age contributed their maximum ice melt at about the beginning of the 20th century. Hence, although an extreme summer was observed in 2003 and more extreme summers may follow, the reduced glacier extents will not allow more extreme ice-melt contributions. In this paper, we present a study in which the hydrological response of a glacierized basin under the extreme climate conditions of 2003 is simulated using the past glacier extent of 1979 compared to the reaction of the present glacier extent. The results show a non-proportional reaction of the ice-melt contribution against the changed glacier extent. The 1979 glacier extent was used due to data availability (maps and digital elevation model (DEM)) and a major difference in the glacier surfaces. Similar studies present the impact assessment at glacierized basins due to a possible climate change in future, driven by the doubling of CO2 (Reference Singh and KumarSingh and Kumar, 1997; Reference Braun, Weber and SchulzBraun and others, 2000; Reference Rees and CollinsRees and Collins, 2006). In this paper, we work out a comparison in order to understand the past.
Study Area
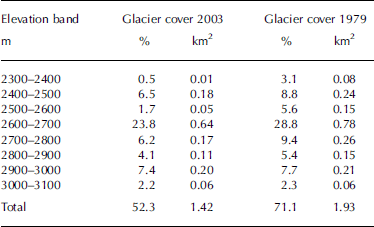
The catchment area of Goldbergkees is situated directly beneath the Hoher Sonnblick observatory (3106ma.s.l.; 47˚03'16'' N, 12˚57'25'' E) in the Austrian Alps (Figs 1 and 2). Meteorological observations at the observatory have been conducted since 1886; mass-balance measurements at nearby glaciers started in 1983 (Reference Auer, Böhm, Leymüller and SchönerAuer and others, 2002). Some hydrological investigations have been carried out since 2002 (Koboltschnig and others, unpublished data). The main advantage of this study area for hydrological investigations is the availability of long-term observations of meteorological and glaciological data. The Goldbergkees watershed area is about 2.72 km2. Elevations range between 2350 (outlet) and 3106ma.s.l. (observatory at Hoher Sonnblick). In 2003 about 1.42 km2 (52% of the area) and in 1979 about 1.93 km2 (71%) were glacierized. The main difference, due to glacier-surface changes from 1979 to 2003, can be seen in Table 2. In 1979 even the lower and middle elevation bands were covered by a wider glacier surface. The three uppermost elevation bands show nearly the same glaciation in 1979 as in 2003.
Location of the Goldbergkees basin. The catchment area is outlined by the black solid line, with 100m contour lines, hydrometeorological stations and change of the glacier extent (light grey: 2003; dark grey: 1979). Black dots indicate the distribution of the 20 ablation stakes drilled into the ice in the 2003 melt season.

Absolute and relative area ratio of 100m elevation bands of the glacier extent in 1979 and 2003, assigned to the catchment area of 2.72 km2
No part of the catchment is lower than the timberline. The dominant land cover is rock (central alpine gneiss), gravel and ice. The mean air temperature at Sonnblick observatory is about –5.7˚C, and annual precipitation averages about 2680mm (climate normals 1961–90; Reference Auer, Böhm, Leymüller and SchönerAuer and others, 2002). The retreat of the glacierized area from 1980 to 2005 can be seen in Figure 2.
Photographs of Goldbergkees from a neighbouring mountain. Left image: 19 September 1980; right image: 28 July 2005. At the highest point on the right of the pictures, the observatory, and downstream of the glacier tongue the proglacial lake at the catchment outlet, can be seen. Photographs by R. Böhm (left) and G. R. Koboltschnig (right).

Methods
Meteorological network and field investigations
As a major input to the hydrological model, hourly data of precipitation (mm), air temperature (˚C), relative humidity (%), wind speed (m s–1), sunshine duration (value 0–1) and global radiation (Wm–2) were taken from the observatory at the top of Hoher Sonnblick (Fig. 1). Air-temperature and precipitation data collected at the observatory in 2003 are shown in Figure 3b. Water levels were recorded between July and October at a natural cross-section of a lake outlet at about 250m downstream of the glacier tongue (Figs 1 and 2). Discharge was measured at different water levels, using propeller measurements for higher, and salt dilution gauging for lower (<0.5m3 s–1), discharges to obtain the rating curve for runoff calculations. The estimated error for the discharge calculation, including the errors for the velocity measurements and water-level observations, is 8%.
(a) Simulated ice melt M (mm h–1) averaged over the catchment area; (b) hourly data of air temperature T (˚C) and precipitation P (mm h–1) at Hoher Sonnblick observatory; and (c) observed and simulated discharge Q (m3 s–1) at the catchment outlet of Goldbergkees. The rising curves in (c) indicate the cumulative discharge Q cum (106m3) over the period of discharge observations, 7 July–30 September 2003.

The ice ablation was measured as a standard programme of the mass-balance measurements following the glaciological method (Reference Kaser, Fountain and JanssonKaser and others, 2003) using ablation stakes drilled into the bare ice of the glacier. The net ablation of the glacier was calculated using 20 ablation stakes (see Fig. 1) distributed over the entire ablation area of Goldbergkees (Reference Hynek and SchönerHynek and Schöner, 2004). The results of the mass-balance measurements are used to validate the simulated ice melt. The maximum snow-free extent of the glacier at the end of the ablation period in 2003 was mapped using the global positioning system (GPS).
The hydrological model PREVAH
The spatially distributed hydrological model PREVAH (precipitation–runoff–evapotranspiration–HRU (hydrological response unit) model; Reference Gurtz, Baltensweiler and LangGurtz and others, 1999) was used to simulate the processes contributing to runoff. PREVAH has already been used at glacierized sites at different spatial resolution (Reference BadouxBadoux, 1999; Reference Zappa, Badoux and GurtzZappa and others, 2000, Reference Zappa, Pos, Strasser, Warmerdam and Gurtz2003; Reference GurtzGurtz and others, 2003). The catchment area is subdivided into HRUs based on DEM and land-cover data. For every HRU the hydrological response to the meteorological input is simulated, using a conceptual storage cascade (Reference BergströmBergström, 1976). The runoff contributions of all HRUs are added to calculate the total runoff at the outlet of the entire catchment. The main advantage of the HRU concept is that it reduces the simulation time. In this study, the radiation-based temperature-index approach after Reference HockHock (1999) is applied to model ice- and snowmelt:

where M is the calculated melt rate (mm h–1), MFsnow/ice is the melt factor for snow or ice (mm d–1 K–1), a snow/ice is the radiation melt factor for snow or ice, I is the potential clear-sky direct solar radiation at the ice or snow surface (Wm–2), T is the air temperature (˚C) and n is the number of time-steps per day, in this case 24 hours. The melt factors for snow and ice are empirical coefficients and I is a calculated value following Reference HockHock (1999). The melt factor for snow (MFsnow) is implemented as variable in time applying a sinus-shaped curve with the maximum at 21 June and the minimum at 21 December. The temperature-dependent melt factor for ice (MFice) is constant in time. Only air temperature is needed as input to the model; radiation is calculated as the site-adjusted potential direct radiation for each HRU, considering exposition and slope (Reference HockHock, 1999). To calculate snow accumulation, surface runoff and evaporation, PRE-VAH additionally requires precipitation, water-vapour pressure, global radiation, wind speed and sunshine duration as input.
Model application at Goldbergkees
In a previous study (Koboltschnig and others, unpublished data), PREVAH was calibrated applying a multi-validation approach using the input data of the hydrological year 2005 in the Goldbergkees catchment area. The calibrated parameters were used for all the following simulations: threshold temperature for snowmelt = 0˚C; maximum degree-day factor = 3.2 mmd–1 K–1; minimum degree-day factor = 1 mmd–1 K–1; radiation melt factor for snow = 0.00015mmW–1m2 K–1 h–1; temperature melt factor for ice = 2.15mmd–1 K–1; radiation melt factor for ice = 0.0003 mmW–1m2 K–1 h–1; storage time for snowmelt = 25 hours; storage time for ice melt = 2 hours; translation time for snowmelt = 3 hours; translation time for ice melt = 2 hours. The hydrological year 2002/03 was modelled using DEM data of 1998 (Reference Auer, Böhm, Leymüller and SchönerAuer and others, 2002) and the glacier extent computed from aerial photographs taken in September 2003. The simulation of the hypothetical hydrological year 1978/79 was applied using the 1979 DEM and glacier extent, digitized from an aerial photograph. The 1998 DEM was produced applying photogrammetric methods, and the 1979 DEM was an adaptation of the 1998 DEM by digitizing the contour lines covering the glacier using a paper map from 1979.
HRUs were separated using two land-cover classes (glacier and rock), 50m elevation bands (16 classes), nine aspect classes and six slope classes. HRUs were generated separately for 1979 and 2003, because the change of the DEM and the different glacier extent affected the amount and combination of HRUs. Thus, 722 HRUs and 197 meteorological units (MU) were generated for 2003, and 850 HRUs and 231 MU for 1979. MU are the spatial units covering the watershed for which the meteorological data have been interpolated based on hourly data from the Sonnblick observatory. A lapse rate of 0.65 K (100 m)–1, calculated from long-term observations, was applied for the air-temperature regionalization. Two stations, one inside and one next to the catchment area measuring monthly precipitation sums, were used for a better weighting for the inverse distance weighting (IDW) interpolation of precipitation. The meteorological input for the 1979 simulation was the same as for the simulation of the hydrological year 2003. For both simulations runs, the model was initialized on 1 October, calculating the snow accumulation during winter and finally simulating snow- and ice-melt processes during the ablation period until 30 September.
Results and Discussion
The comparison of observed and simulated runoff data during the period 7 July–30 September 2003 is shown in Figure 3c and in the scatter plot in Figure 4. The model performance for the period of observed runoffs was calculated as R 2 = 0.65 following the criterion of Reference Nash and SutcliffeNash and Sutcliffe (1970). Simulated discharge has a slight tendency to underestimate the observations which can be seen at the curves of the cumulated discharges (Fig. 3c). The scatter plot (Fig. 4) shows the same, and that the highest observations have not been simulated as high. We assume that the main underestimations of the modelled discharges are due to missing or too low precipitation signals, i.e. precipitation not caught by the gauging system. Simulated distinct diurnal variations of the ice melt, which are the result of air-temperature and radiation variations, are shown in Figure 3a. Due to nearly snow-free conditions in August 2003, the melting of the exposed bare ice was the major fraction of runoff. Approximately 86% of the total runoff in August 2003 originated from ice melt (Fig. 5a). In July 2003, ice melt contributed about 47% of the monthly total runoff. For the entire modelling period 2002/03, PREVAH calculated an ice loss of –1830mm assigned to the glacier surface of 2003. This result is comparable to the observed specific glacier mass balance of Goldbergkees, which had its minimum during the range of observations in the hydrological year 2002/03 at –1806mm (Reference Hynek and SchönerHynek and Schöner, 2004). The ice loss of the entire 2002/03 period was calculated as 29% of the total runoff. The annual snowmelt was calculated as 68% of the total runoff.
Scatter plot of observed vs simulated discharges over the period of discharge observations, 7 July–30 September 2003.

Water balance of Goldbergkees catchment using meteorological input data of 2003 simulated for the glacier extent of (a) 2003 and (b) 1979. Q tot is the total annual runoff, P tot is the annual areal precipitation, Ice is the annual ice melt, S now is the annual snowmelt and E vap is the annual evaporation.

The simulation of the hypothetical hydrological year 1978/79 (glacier extent of 1979, using the meteorological input of 2003) has a similar hydrograph during the period before the fraction of ice melt increases. In Figure 6 it can be seen that the simulations of the glacier extent in 2003 and 1979 show the same hydrograph in the period from 1 June to approximately mid-June. As soon as the ice-melt fraction increases, the diurnal maximum discharges in 1979 exceed the maxima in 2003. The highest deviation of simulated hourly discharges was calculated at 1700 h on 18 August as +0.68m3 s–1 at a peak discharge of 1.98 m3 s–1 simulated for 2003 (see Fig. 6). The mean deviation of the hourly discharge between the 1979 and 2003 simulations during the period 1 June–31 August (same period as shown in Fig. 6) is +0.13m3 s–1; for the period 1 July–31 August the deviation is +0.18m3 s–1. Another comparable feature is the mean deviation of the daily minimum discharges, which was calculated as +0.06m3 s–1 in 1979 for the period 1 July– 31 August. The deviation of the cumulative discharge in the period 1 June–31 August of 2003 and 1979 accounts for about 1.03×10⁶m3. This is a difference of about 14%, due to the higher glacier extent in 1979. The difference in total runoff is 12% calculated for the entire hydrological year starting in October 2002 or October 1978. Comparing the plot of monthly cumulated discharge, precipitation, ice melt, snowmelt and evaporation of 1979 and 2003 (see Fig. 5a and b), the main change appears only in July and August, when only ice melt and total runoff show larger differences. Ice melt is the driving factor for changes in total runoff. In July and August 1979, 40% and 37% more ice melt, respectively, contributed to runoff compared to 2003. In August 1979, 89% of the total runoff was ice melt. The annual ice melt was calculated as 36% of the total runoff, which is about 1980 mm, assigned to the glacierized area of 1979. The annual snowmelt was calculated as 61% of the total runoff.
Simulated 1979 runoff (dashed line) vs simulated 2003 runoff (solid line). The rising curves indicate the cumulative discharge Q cum (106m3) over the period 1 June–30 August.

Conclusion
The application of PREVAH to the glacierized catchment area of Goldbergkees shows an acceptable model performance of R 2 = 0.65 for the simulation of the summer 2003 melt period, following the criterion of Reference Nash and SutcliffeNash and Sutcliffe (1970). Model results show that about 86% of the total runoff in August 2003 was ice melt, due to nearly snow-free conditions. The surface of Goldbergkees in 1979 was about 129% of the 2003 surface. Simulation results for the hypothetical 1978/79 period show a 12% higher total annual runoff compared to the 2002/03 period, due to the higher fraction of the basin surface that was ice-covered. In summer 2003 the ice melt of a 52% glacierized surface, and in 1979 the ice melt of a 71% glacierized surface, contributed to total runoff because of nearly snow-free conditions. The change in the glacier’s topography, with much of the glacierized surface at lower elevations disappearing during the 24 year interval 1979–2003 (see Table 2; Fig. 1, next to the catchment outlet), resulted in total ice-melt rates in July and August 2003 that were up to 29% lower than in 1979. This is due to the results of the simulated specific glacier mass balance which accounts for 1830mm in 2003 and about 1980 mm in 1979 (using the 2003 meteorological input).
A bigger difference between the two compared specific mass balances would only be possible if the glacierized area fraction at lower elevations were higher. Hence, if the impact of an extremely warm summer like 2003 had appeared in 1979, it would have resulted in much higher discharges driven by glacial melt. For possible future scenarios, assuming smaller glacier surfaces, this means that, to produce more extreme ice-melt contributions, warmer conditions or as warm conditions but with longer durations compared to summer 2003 are necessary. To compare the hourly runoff, we calculated key values showing the deviation from 1979 to 2003. The maximum deviation appeared at the peak discharge on 18 August and was calculated as +34%, and the mean deviation of hourly discharges for the period 1 July–31 August was calculated as +24%. The maximum deviation was the result of a melt event, which was superposed by a rainfall event. Furthermore the mean daily minimum runoff in the period 1 July– 31 August was 14% higher in 1979 than in 2003.
Summarizing, we can state that the comparison of the simulation of the extreme summer 2003 and the hypothetical summer 1979 using PREVAH has shown a wide range of analyzable results, but primarily that knowledge of the spatial topography, mainly the area ratio of the different elevation bands of glacierized areas, is needed to estimate the ice-melt contribution of different glacier extents.
Acknowledgements
This ongoing research is supported by a grant from the Austrian Academy of Sciences under the project SNOWTRANS HOE29, part of the IHP PUB (International Hydrological Program, Prediction in Ungauged Basins). The authors are grateful to all the students, colleagues and friends who helped to carry out the exhausting fieldwork. Meteorological time series were provided by ZAMG. We thank R. Hodkins for his scientific editorial work. D.A. Swift and an anonymous reviewer made valuable remarks and suggestions.



