Introduction
Ice shelves fringe almost half of the Antarctic coast and most of the ice loss from the Antarctic ice sheet occurs through iceberg calving and basal melting from ice shelves. The two largest ice shelves, the Filchner–Ronne Ice Shelf (FRIS) and the Ross Ice Shelf (RIS) drain around two-thirds of West Antarctica and, through their buttressing effect, may exert an important control on the dynamics of the inland ice sheet (MacAyeal Reference MacAyeal1987, Hindmarsh Reference Hindmarsh and Peltier1993). This paper concerns FRIS, which is the second largest ice shelf by area, the largest by volume, and has the largest accumulations of marine ice yet discovered. In addition, melting from the underside of FRIS is known to form essential precursors to Antarctic Bottom Water, a globally important water mass that provides ventilation of large parts of the world's deep oceans (Foldvik et al. Reference Foldvik, Gammelsrød and Tørresen1985). An accurate description of the physiography of this ice shelf is essential for both modelling of ocean circulation and modelling of tides and investigations of the potential impacts of ice shelf changes on the inland ice sheet, and thus sea level. This is especially true for the grounding line area, where a buttressing stress is imposed by the ice shelf on the glaciers and ice streams that feed it (Scambos et al. Reference Scambos, Bohlander, Shuman and Skvarca2004b), and for the marine ice body (Robin et al. Reference Robin, de, Doake, Kohnen, Crabtree, Jordan and Möller1983, Thyssen Reference Thyssen1988) which can be used to diagnose sub-ice ocean conditions.
Massive accumulations of marine (sea-water derived) ice lie beneath the meteoric (precipitation derived) ice, similar to conditions observed recently underneath Amery Ice Shelf (Fricker et al. Reference Fricker, Popov, Allison and Young2001). This marine ice originates from frazil ice platelets in the sub-ice water column that accumulate on the ice shelf base, and eventually consolidate into ice (Oerter et al. Reference Oerter, Drücker, Kipfstuhl, Nixdorf, Graf and Oerter1992a, Bombosch & Jenkins Reference Bombosch and Jenkins1995, Grosfeld et al. Reference Grosfeld, Hellmer, Jonas, Sandhäger, Schulte and Vaughan1998). The occurrence of the two distinct ice types, formed by quite different accumulation processes, requires separate ice thickness models (meteoric, marine, and total ice thickness) to fully describe the ice shelf for the purposes of ocean and ice-dynamics modelling.
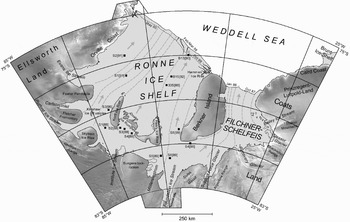
Several research institutes from different countries have carried out extensive ice thickness surveys during various field campaigns on FRIS (Fig. 1). Previously, these datasets have been used separately to compile ice thickness maps and digital ice thickness models for portions of FRIS (see references given in Table I). We aim to provide a combined analysis and to derive maps of meteoric and marine ice thickness for the entire FRIS, paying particular attention to grounding lines on the southern RIS, which, so far, has been poorly described. These maps will provide a basis for ice dynamics, tidal and oceanographic studies.
Map of FRIS and the adjacent inland ice. The RADARSAT SAR image mosaic of the grounded ice (Jezek & RAMP Product Team 2002) clearly shows ice streams, glaciers, and mountainous regions. Arrows and selected flowlines (dashed light grey lines) indicate the basic structure of the ice shelf flow regime. The positional change of the Ronne Ice Shelf (RIS) front between February/March 1986 and October 1999/May 2000 is partly due to the calving of icebergs A-38 to A-44. Grounding line, ice front, and flowline positions are from Heidrich et al. (Reference Heidrich, Sievers, Schenke and Thiel1992) and ADD Consortium (2002), the grounding line of Foundation Ice Stream (FIS) is mapped according to Lambrecht (Reference Lambrecht1998). The drill sites listed in Table III are marked by squares with the year of drilling in brackets. The small triangles at the ice front indicate the change in date for the individual sections of the ice front.

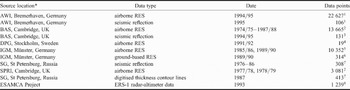
Basic datasets used to derive the digital meteoric ice thickness model of FRIS.

* AWI = Alfred Wegener Institut für Polar- und Meeresforschung, BAS = British Antarctic Survey, DPG = Department of Physical Geography and Quaternary Geology, Stockholm University, IGM = Institut für Geophysik der Universität Münster, SG = Sevmorgeologija of the Ministry of Geology (of the former USSR), SPRI = Scott Polar Research Institute, University of Cambridge, ESAMCA = Exploitation of satellite altimetry for the monitoring of climate-related change of Antarctic ice shelves
Source data references: 1Hempel & Oerter Reference Hempel, Oerter and Oerter1995, Lambrecht et al. Reference Lambrecht, Mayer, Hempel, Nixdorf and Oerter1995, Reference Lambrecht, Mayer, Oerter and Nixdorf1999, Lambrecht Reference Lambrecht1998, 2Robin et al. Reference Robin, de, Doake, Kohnen, Crabtree, Jordan and Möller1983, Crabtree & Doake Reference Crabtree and Doake1986, Vaughan et al. Reference Vaughan, Doake, Mantripp, Miller and Oerter1991, 3Johnson & Smith Reference Johnson and Smith1997, 4Homlund Reference Homlund and Oerter1992, 5Thyssen Reference Thyssen1988, 1991, Thyssen et al. Reference Thyssen, Bombosch and Sandhäger1992, Grosfeld et al. Reference Grosfeld, Hellmer, Jonas, Sandhäger, Schulte and Vaughan1998, 6Blindow Reference Blindow1994, 7Pozdeev & Kurinin Reference Pozdeev and Kurinin1987, 8Sievers et al. Reference Sievers, Doake, Ihde, Mantripp, Pozdeev, Ritter, Schenke, Thyssen and Vaughan1995, Mantripp et al. Reference Mantripp, Sievers, Bennat, Doake, Heidland, Ihde, Jonas, Riedel, Robinson, Scharroo, Schenke, Schirmer, Stefani, Vaughan and Wingham1996, Wingham et al. Reference Wingham, Doake, Ihde, Mantripp, Scharroo, Schenke and Sievers1997.
Measurement of meteoric and marine ice thickness
Ice thickness can be determined by a variety of methods, each of which has benefits and limitations:
i) radio echo sounding (usually abbreviated as RES),
ii) seismic sounding,
iii) inversion of ice surface elevation based on the assumption that the ice is in hydrostatic equilibrium.
In this study, we used all these types of data and below we give a short discussion of the features and weaknesses of each measurement technique.
Radar techniques
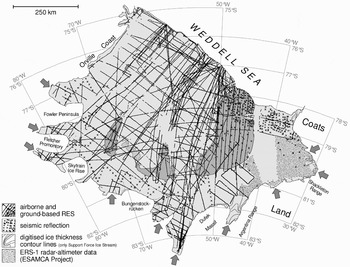
Except where it is obscured by crevassing, the dominant echo in most radar data from ice shelves comes from the base of the meteoric ice layer, and this is true whether the meteoric ice is underlain by sea-water or marine ice. Furthermore, because radio wave absorption in marine ice is considerably higher than in meteoric ice, echoes from the base of marine ice bodies are likely to be far weaker (Jenkins & Doake Reference Jenkins and Doake1991). This adsorption effect may, in places, be compounded by the presence of a ‘slush layer’ that creates a distributed transition from consolidated marine ice to unconsolidated ice platelets (Engelhardt & Determann Reference Engelhardt and Determann1987). This means that there may be no strong reflector at the marine ice/sea-water interface to produce a reflection. Thus, in only a few cases has radar sounding been able to detect the thickness of a marine ice layer, and it is generally accepted that conventional radar data will usually show the bottom of the meteoric ice layer. The thickness of any marine ice layer must thus be determined using different techniques (e.g. comparing RES data and ice thicknesses from inverted surface elevations in Fricker et al. Reference Fricker, Popov, Allison and Young2001). The radar sounding data used in this study were acquired during oversnow and airborne field campaigns mounted by several institutes, and which together, covered much of FRIS (Fig. 2, Table I).
Distribution of the meteoric ice thickness measurements used to determine the digital thickness model of FRIS. The major part of the database results from RES and seismic reflection surveys. An improvement of the data point coverage of the Filchnerschelfeis (FSE) region is attained by including two auxiliary datasets with digitised thickness contours and converted surface elevations (from the ESAMCA project), respectively (cf. Table I). Arrows indicate the main contributory glaciers and ice streams comprising most of the mass discharge from inland into FRIS.

Seismic techniques
Seismic techniques detect physical variations rather than the variations in electrical properties detected by radar techniques. Due to a lack of acoustic contrast between meteoric and marine ice, they generally cannot detect the meteoric/marine interface, but are generally successful in obtaining reflections from the marine-ice/sea-water interface. We used three seismic reflection datasets in our analysis (Table I) especially to improve coverage of the western and southern margin of RIS.
In a few areas of the southern Filchnerschelfeis (FSE), data derived from digitisation of an ice thickness map published by Pozdeev & Kurinin (Reference Pozdeev and Kurinin1987) were used. This map was derived from Russian seismic data, but the original point measurements were not available to us.
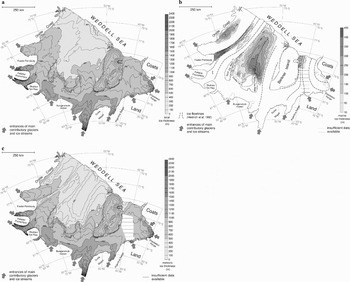
Map of FRIS showing the distribution of a. meteoric ice thickness, b. basal marine ice layer thickness, and c. total ice thickness. The map directly derives from the new digital ice thickness model for FRIS. The locations of the main contributory glaciers and ice streams are indicated by arrows. Grounding line (except for the MES and FIS region), ice front and flowline positions are from Heidrich et al. (Reference Heidrich, Sievers, Schenke and Thiel1992) and ADD Consortium (2002).

Hydrostatic inversion
The final technique used to determine ice thickness is an indirect one that has been used by many other authors (e.g. Jenkins & Doake Reference Jenkins and Doake1991, Vaughan et al. 1994), and this is to invert measurements of ice surface elevation into ice thickness using the assumption that the ice is floating and that the density-depth structure of the ice column is known (Fig. 2, Table I). We used this approach only for the parts of FRIS [or FSE] where there is evidence that marine ice is absent (cf. Grosfeld et al. Reference Grosfeld, Hellmer, Jonas, Sandhäger, Schulte and Vaughan1998) and no direct ice thickness measurements exist, in order to obtain information about the meteoric ice thickness distribution in these areas.
In this study, we have used as the primary source of surface elevation data, the ESAMCA Digital Elevation Model (ESAMCA DEM, Datum: WGS84; Sievers et al. Reference Sievers, Doake, Ihde, Mantripp, Pozdeev, Ritter, Schenke, Thyssen and Vaughan1995, Mantripp et al. Reference Mantripp, Sievers, Bennat, Doake, Heidland, Ihde, Jonas, Riedel, Robinson, Scharroo, Schenke, Schirmer, Stefani, Vaughan and Wingham1996, Wingham et al. Reference Wingham, Doake, Ihde, Mantripp, Scharroo, Schenke and Sievers1997). This DEM was constructed for FRIS using ERS-1 satellite radar altimetry data that was re-tracked, corrected for ocean tides and regional geoid anomalies (Wingham et al. Reference Wingham, Doake, Ihde, Mantripp, Scharroo, Schenke and Sievers1997). The vertical accuracy of the ESAMCA DEM was determined to be ± 5 m (Wingham et al. Reference Wingham, Doake, Ihde, Mantripp, Scharroo, Schenke and Sievers1997). Although more recent surface elevation data are now available (e.g. from ICESat, Fricker & Padman Reference Fricker and Padman2006) we choose to use the ESAMCA DEM for the reason that it was derived from data collected over a time period (early 1993) closest to that over which the other ice thickness data were collected (Table I). More recent data might have higher precision, and better coverage, but its use could result in some substantial difficulties in reconciling issues of data mismatch and potential real temporal changes in ice-shelf thickness, and should probably not be attempted until it has been established that ongoing changes in FRIS are insignificant. This means that, essentially, our derived maps are best considered as tied to an approximate epoch centred on the late 1980s to early 1990s.
As stated above, to use the floatation inversion correctly, a prior knowledge of the density-depth structure is important, and thus the presence of a marine ice layer (which has a different density to meteoric ice) must be known before the calculation can be made. Initially, it is valuable to demonstrate and calibrate the inversion in areas of FRIS where we have some confidence that no marine ice is present (cf. Grosfeld et al. Reference Grosfeld, Hellmer, Jonas, Sandhäger, Schulte and Vaughan1998). Thus, to determine the correct parameters for the floatation inversion, we performed a regression of RES and seismic ice thickness measurements, against corresponding elevations from the ESAMCA DEM. This shows that the hydrostatic relation for areas of the ice shelf where only meteoric ice is present conforms well to the relation,

where, H met is the meteoric ice thickness, h is the surface elevation above sea level, ρw and ρc are the densities of sea-water and consolidated ice, and Δh 1 is a constant correction for firn layer density. As the firn layer depth does not vary considerably across the ice shelf, it is justified to use a constant for the parameter Δh 1. The second correction factor, Δh 2 represents discrepancies due to locally modified glaciological conditions (e.g. occurrence of surface crevasses, stress-induced enhancement of firn densification, deviations from hydrostatic equilibrium due to bending stresses near to grounding lines). Although Δh 2 varies from several metres up to a few tens of metres in very few known areas, as detected by direct comparison, Δh 2 ≈ 0 holds for most ice shelf areas. With an assumed sea water density of ρw ≈ 1028 kg m-3, the mean density of solid ice implied by the regression line is ρc ≈ 917 kg m-3. Using the values given above, the model results in a regression coefficient of r 2 = 0.9895.
Based on all data, the meteoric ice thickness distribution for most of RIS and also major parts of FSE can be readily derived (Fig. 3a), although the region close to the grounding line will require a more detailed analysis.
Grounding line mapping
In order to map the ice shelf, we must first be confident of its areal extent. In most places, the grounding line is marked by a strong change in surface slope that has been easily identified using satellite images, although Fricker & Padman (Reference Fricker and Padman2006) noted that care needs to be taken in where the surface gradients are low because there is often a substantial difference between break-in slope and true grounding line position.
Around most of FRIS, the position of the grounding line is well known and is well delineated in topographic maps (e.g. Sievers et al. Reference Sievers, Vaughan, Bombosch, Doake, Mantripp, Pozdeev, Ritter, Sandhäger, Swithinbank and Thyssen1992). However, until now, the southernmost grounding lines, in the area of Foundation Ice Stream (FIS), Möllereisstrom (MES) and Institute Ice Stream (IIS), were derived almost exclusively from interpretation of optical satellite imagery (Sievers et al. Reference Sievers, Vaughan, Bombosch, Doake, Mantripp, Pozdeev, Ritter, Sandhäger, Swithinbank and Thyssen1992) and there is some scope of reassessment of this area. To the east the grounding line of FIS is well defined and unambiguous since it occurs on a steep gradient of ice thickness from the ice shelf towards the Schmidt Hills. Further west, there are shallow surface gradients that make the position of the grounding lines much harder to determine unambiguously from the satellite imagery alone. Indeed, on MES, satellite images seem to show a very complex pattern of floating and grounded ice that is impossible to define from imagery alone.
Seismic investigations on FIS in 1994/95 (Lambrecht et al. Reference Lambrecht, Mayer, Oerter and Nixdorf1999), showed a water-column thickness of more than 400 m under the ice stream around 26 km farther south than the imagery based grounding line location. This interpretation was confirmed by gravity measurements in the same area that show a clear tidal signal indicating movement of the ice column with a maximum vertical amplitude of about 4.5 m (Lambrecht et al. Reference Lambrecht, Mayer, Hempel, Nixdorf and Oerter1995).
The combination of remote sensing information and ground data from the 1994/95 field campaign now make a new and more accurate determination of the grounding line in this area possible. Evidence for the position of the grounding line was obtained by calculating the hydrostatic anomaly, determined from ice thickness and surface elevation measured by airborne radar survey. We used ice thickness to calculate the ice surface elevation under freely floating conditions, assuming densities of 917 kg m-3 for ice and 1028 kg m-3 for sea-water. To correct for the low density in the near-surface firn layer we reduce the freeboard by 17 m. This is consistent with a 70 m firn layer with a mean density of 700 kg m-3 derived from direct measurements at ice core B13 (Oerter et al. Reference Oerter, Eiken, Kipfstuhl, Miller, Graf and Oerter1994, Eicken et al. Reference Eicken, Oerter, Miller, Graf and Kipfstuhl1994) and analogous to the correction applied in Eq. (1). In this case, we used the directly determined firn correction rather than the mean correction derived from the comparison of ESAMCA data and ice thickness data, because here we are using airborne data that might contain a different set of instrument biases. The actual surface elevations were determined as the difference between the barometrically measured aircraft elevation and the clearance between aircraft and ice surface, derived from the radar data. The barometric elevations were tied to the elevation of 163 m a.s.l. measured at the base camp by GPS observations in “static mode”. The Base Camp position and elevation was fixed with the reference station Belgrano II and corrected for geoid undulations with the geopotential model OSU 91 (Riedel et al. Reference Riedel, Karsten, Ritter, Niemeier and Oerter1995). The uncertainty in the barometric elevation is about ± 8 m after subtraction of linear trends. Changes of barometric pressure during a typical flight time between one and two hours were usually rather small and were alleviated by removing observed linear trends.
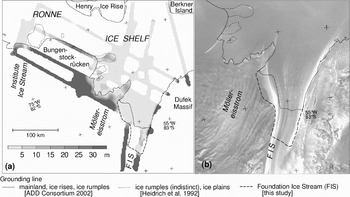
We used a threshold of +10 m deviation for the height above buoyancy to define the floating ice. The results displayed in Fig. 4 show considerable differences in the position of the old and the newly determined grounding line. For FIS the grounding line is about 50 km further south of the previous estimates (e.g. location in the ADD 2002, see also Lambrecht et al. Reference Lambrecht, Mayer, Hempel, Nixdorf and Oerter1995). The MES grounding line is more complicated. The results from our freeboard calculations show that extended areas are close to flotation with a few firmly grounded spots. The characteristic peninsula of grounded ice, shown in the former map of FRIS (ADD Consortium 2002), now forms an isolated ice rumple in front of the entrance of MES into FRIS. The observed pattern of grounded and floating ice in front of MES suggests the existence of an ice plain (Corr et al. Reference Corr, Doake, Jenkins and Vaughan2001) close to flotation in many places. The elevation difference between floating and grounded parts typically lies between 0 and 15 m. Our data shows similar conditions close to Bungenstockrücken, confirming the existence of the ice rumples described by Heidrich et al. (Reference Heidrich, Sievers, Schenke and Thiel1992).
Analysis of the grounding line conditions in the Southern FRIS: a. Height above floating conditions derived from airborne RES ice thickness data and barometric surface elevation data, areas of ice rumples indicated in earlier maps are shown by dotted lines, the original grounding line is shown as a bold line, whereas the new grounding line in the FIS area is displayed as a dashed line, b. section of the RAMP Radarsat mosaic (Jezek & RAMP Product Team 2002) for the FIS and MES region, with the old and new grounding lines.

For the Institute Ice Stream (IIS) the analysis shows no changes in grounding line position in comparison to the ADD Consortium (2002). Unfortunately there is only one new flight line crossing the ice plain in front of IIS, described in Heidrich et al. (Reference Heidrich, Sievers, Schenke and Thiel1992). This ice plain also was identified by Scambos et al. (Reference Scambos, Bohlander, Raup and Haran2004a) in RAMP data, who suggested that the surface in this area is a maximum of 25 m above the flotation point, and this was confirmed by a recent analysis of ICESat data (Fricker & Padman Reference Fricker and Padman2006). The flight line crosses the ice plain close to its northern margin, showing only a small deviation from the mean ice shelf level of less than 10 m. Based on these results, the total increase in area for the FRIS in the southern grounding line region is 3200 km2.
Around Berkner Island no special flotation criterion was necessary since the island has steep slopes all round. The grounding line around the island is clearly defined and can easily be mapped from optical satellite imagery and the determined grounding line positions match very well with the grounding line detected in RES profiles.
Derivation of ice thickness maps
Meteoric ice thickness
The digital map of meteoric ice thickness for FRIS was produced by a direct interpolation of the meteoric ice thickness data described above (also Table I) onto a regular horizontal grid. Several interpolation algorithms were tested but the final computation was performed with a geostatistical gridding method (kriging), which takes account of the relationships evidence through the use of a semivariogram. A grid spacing of 1.67 km was chosen to provide an acceptable resolution, ensuring representation of even comparatively small topographic features, such as the Kershaw Ice Rumples (~80 km2) or the Hemmen Ice Rise (~75 km2) that are represented in the data (cf. Fig. 1). This gridding procedure could, however, not be accomplished in the central FSE (Fig. 2), due to the lack of meteoric ice thickness data.
Marine ice thickness
The digital map of marine ice thicknesses for FRIS was produced through a combined analysis of the DEM and meteoric ice thickness map, in such a way as to allow for the known density difference of meteoric and marine ice.
Ice-core data from drill site B15 (Fig. 1) provide a depth density profile comprising the double-layer structure, including the densities of meteoric and marine ice (Oerter et al. Reference Oerter, Drücker, Kipfstuhl, Nixdorf, Graf and Oerter1992a), ρc | met = (896 ± 9) kg m-3 and ρc | mar = (911 ± 6) kg m-3, respectively. This difference implies that a simple conversion of surface elevation to total ice thickness based on the hydrostatic regression relation (Eq. 1) would incorrectly estimate the marine ice thickness. Thus we have used a slightly more complex but more accurate procedure.
Equation (1) results from a regression of meteoric ice thickness against surface elevations. Both datasets were scrutinised for possible erroneous offsets leading to the overestimation of the ice density. While the meteoric ice thicknesses show an overall high consistency, the comparison between the ESAMCA DEM and a topographic map of FRIS, compiled mainly from airborne altimetry and ground-based levelling data (Mantripp et al. Reference Mantripp, Sievers, Bennat, Doake, Heidland, Ihde, Jonas, Riedel, Robinson, Scharroo, Schenke, Schirmer, Stefani, Vaughan and Wingham1996), reveals a significant mismatch particularly for the central RIS. Thus, we cannot be sure that the ESAMCA DEM is not affected by a negative offset of several metres at least for this region. Assuming that i) the surface elevations from the ESAMCA DEM are too low for all ice shelf areas with basal marine ice, ii) the ice densities measured at drill site B15 are representative for all these areas, and iii) the marine ice is completely consolidated, an expanded hydrostatic relation for the double-layered ice shelf section of FRIS reads:

where H mar is the marine ice thickness and the parameter a is a correction for the assumed erroneous elevation offset. As before Δh 1 = 15.5 m is used in this relation. For Δh 2 carefully extrapolated values from known areas across the marine ice regions were used for regions with locally modified glaciological conditions only. A steady transition between Eqs (1) and (2) is attained by specifying a = 1.19. In the strict sense, H mar represents the ‘equivalent’ thickness of a homogeneous marine ice layer with the same buoyancy as a composition of upper consolidated ice and a lower slush layer (Fig. 3b).
Total ice thickness
The digital map of total ice thickness for FRIS (Fig. 3c) was generated by adding the gridded meteoric (Fig. 3a) and marine ice thickness datasets (Fig. 3b). To estimate the total ice thickness distribution in the central FSE, Eq. (1) was used to convert elevations from the ESAMCA DEM. Thus, the final total ice thickness model covers the entire FRIS region, including the area of FSE that were sparsely covered by data describing meteoric ice thickness.
Estimation of uncertainty in the ice thickness maps
Our new ice thickness maps of FRIS contain several sources of uncertainty, primarily those in the basic ice thickness measurements and in the ESAMCA DEM, as well as those incurred during the gridding procedure and arising from the hydrostatic inversion (see Table II).
Estimated error tolerances for the meteoric, marine, and total ice thicknesses in the new geometric model for FRIS.

Meteoric ice thickness
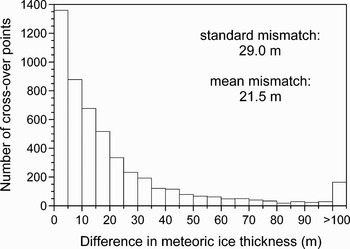
The quality of the meteoric ice thickness data, H met are limited by errors in the measured delay times between the reflections of the ice surface and the bottom of the meteoric ice, and uncertainties in the velocity-depth function. Other inaccuracies originate from positioning errors of the individual depth soundings. In order to characterize these errors, a crossover analysis was performed between different flight tracks (Fig. 5). In total almost 5100 crossover points were found, where the horizontal distance between the measurements was less than 1 km. The crossovers generally show high consistency, with mean deviations at the crossover points fitting the uncertainties suggested for the individual measurements (± 20 m for AWI-RES, Lambrecht Reference Lambrecht1998; ± 7.5 m (up to ± 50 m at some places) for AWI-Seismic, Lambrecht Reference Lambrecht1998; ± 10 m to ± 30 m for BAS/SPRI-RES, Robin et al. Reference Robin, de, Doake, Kohnen, Crabtree, Jordan and Möller1983; ± 10 m for BAS-RES, Crabtree & Doake Reference Crabtree and Doake1986; ± 9 m for BAS-Seismic, Johnson & Smith Reference Johnson and Smith1997; ± 5 m for IGM-RES (for unambiguous and clear reflections, Thyssen Reference Thyssen1988). Especially for older datasets, for which GPS navigation was not available, ice thickness deviations due to the positioning uncertainty, can dominate the total error.
Distribution of observed crossover points in relation to the measured difference in meteoric ice thickness for RES and seismic data (Table I).

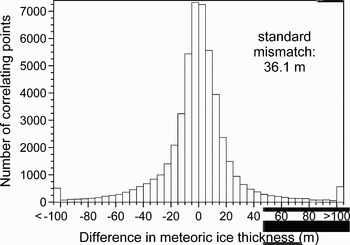
The quality of the final meteoric ice thickness map also depends on gridding procedure. We have determined the mismatch of the point measurements and the ice thickness grid, and calculated the mismatch, ΔH met (Fig. 6). For about 79% of the ~50.000 measured ice thicknesses, the absolute difference |ΔH met| is less than 25 m, whereas at about 4% of the points |ΔH met| is larger than 75 m.
Distribution of the thickness differences ΔH met between the measured ice thicknesses (Table I) and the corresponding interpolated values in the ice thickness model for FRIS.

The distribution of these mismatches indicates small discrepancies in areas with a high density of measurements and in areas with low thickness gradients. Larger discrepancies are observed on steep terrain and where data are sparse. We conclude that the uncertainties given in Table II can, in effect, be applied to the gridded ice thicknesses of FRIS - the uncertainties involved in the analysis and potential for digitising or processing errors of unknown magnitude mean that a more detailed analysis of the accuracy is not very meaningful.
Marine ice thickness
For the marine ice thickness, the mean uncertainties given for the parameters in Eq. (2) were used in order to determine the error range of the marine ice thickness calculation. The individual uncertainties were estimated to be h = ± 5 m, H met = ± 25 m, Δh 1 = ± 1 m, Δh 2 = ± 2.5 m, ρc | met = ± 9 kg m-3 and ρc | mar = ± 6 kg m-3. The resulting errors are given in Table II. Consequently, the errors in the total ice thicknesses result from the sum of the uncertainty in the meteoric ice thickness determination and of the marine ice thickness.
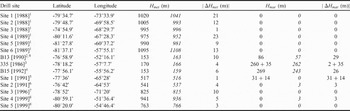
A validation of the thickness model is performed by comparison with available borehole data (Table III). The discrepancies between the ice thicknesses measured at the drill sites and the respective values extracted from the maps presented are smaller than our described uncertainties.
Meteoric and marine ice thicknesses determined at 14 drill sites on FRIS with different methods and respective values from the new ice thickness model (italic). For the individual methods used for the thickness determination, please refer to the original papers. Apart from the ice core sites B13 and B15, all other drill sites are hot water drills. At sites 335 [1986] and Site 1 [1991] the measurements provide distinction between upper consolidated marine ice and a lower slush layer. Drill site locations are indicated in Fig. 1.

1Vaughan Reference Vaughan and Miller1990, 2Oerter et al. Reference Oerter, Kipfstuhl, Determann, Miller, Wagenbach, Minikin and Graf1992b, 3Engelhardt & Determann Reference Engelhardt and Determann1987, 4Oerter et al. Reference Oerter, Drücker, Kipfstuhl, Nixdorf, Graf and Oerter1992a, 5Nicholls et al. Reference Nicholls, Makinson and Robinson1991, 6Robinson & Makinson Reference Robinson, Makinson and Oerter1992, 7Makinson Reference Makinson and Oerter1996, 8Nicholls et al. Reference Nicholls, Østerhus, Makinson and Johnson2001, 9Grosfeld & Thyssen Reference Grosfeld and Thyssen1994.
Discussion
The new maps representing the meteoric, marine and total ice thickness distributions of FRIS are shown in Fig. 3. The largest meteoric ice thicknesses (> 1500 m) occur close to the grounding zones of the largest glaciers and ice streams that feed the ice shelf. Since most of the mass discharge from the ice sheet into FRIS is concentrated on these drainage systems, they substantially influence the flow regime and the geometry of the ice shelf body. An accurate knowledge of ice thicknesses in such regions is thus a necessary prerequisite for reliable assessments of ice sheet stability.
A lack of data means there is still uncertainty regarding the distribution of marine ice beneath FES. However the data available allow a good description of the three major marine ice bodies beneath the RIS. This interpretation is independent of the calculation that relied on the continuity condition to calculate marine ice thickness (Joughin & Vaughan Reference Joughin and Vaughan2004). In our assessment we have used point thickness data for the distributed determination of meteoric ice thickness, and a different compilation of the ERS satellite altimetry data (ESAMCA, Wingham et al. Reference Wingham, Doake, Ihde, Mantripp, Scharroo, Schenke and Sievers1997; rather than the Antarctic-wide DEM, Bamber & Bindschadler Reference Bamber and Bindschadler1997). In general terms, the two assessments of marine ice thickness are similar, although notable differences can be seen in some specific areas. The more discontinuous body of marine ice north of Fowler Peninsula indicated by Joughin & Vaughan (Reference Joughin and Vaughan2004), is probably due to interpolation artifacts in their assessment. Greater marine ice thicknesses (e.g. north of Henry Ice Rise) in our analysis very likely result from the improved vertical density profile we have used that takes account of the higher density for marine ice.
Besides their typical elongated shapes resulting from advection and longitudinal stretching with the ice shelf flow, the three marine ice bodies beneath the RIS are characterized by a continuous thinning towards the ice front. The largest body of marine ice is situated in the central part of FRIS north of the Doake Ice Rumples (Thyssen Reference Thyssen1988). Generally the marine ice layer shows the largest ice thicknesses close to the ice rises and thins towards the calving front (cf. Bombosch & Jenkins Reference Bombosch and Jenkins1995). This is also true for the other marine ice layer downstream of Fowler Peninsula (Joughin & Vaughan Reference Joughin and Vaughan2004). Due to this persistent melting regime near the ice front, the marine ice layers beneath the RIS do not extend up to the ice front. Thus, calving icebergs should comprise only little or no marine ice. It is evident from Fig. 3b, that the icebergs that detached from the FSE between 1986 and 2000 only contained some marine ice underneath their southern part at the time of calving. After these major calving events, the marine ice extended right to the ice shelf front. Therefore, it depends on the time period until the next calving, whether marine ice will be present underneath future icebergs produced from this part of the ice shelf.
Finally, the new ice thickness model was used to quantify basic features of the ice shelf of FRIS and its main subareas. The results are summarised in Table IV. The floating area of FRIS now results to 429 000 km2, closely matching earlier measurements (Fox & Cooper Reference Fox and Cooper1994).
Integral quantities related to the ice body geometry of FRIS and its main sub-areas. Computation base is the new ice thickness model which considers the ice front positions from Feb. / Mar. 1986 (RIS) and Jan. 1986 / Oct. 1987 (FSE). Marine ice volumes are calculated from the assumption that all marine ice beneath FRIS is completely consolidated. Due to missing data on the marine ice distribution across FSE only lower limits for marine ice volume and mass can be given.

Conclusions
In some respects, FRIS has never received the same level of scientific attention as its counterpart, the Ross Ice Shelf. This is at least in part due to its remoteness from permanent research stations. Systematic mapping of the Ross Ice Shelf was completed in the 1970s by the RIGGS programme, whereas most of the data collected on FRIS result from individual campaigns designed to address rather specific scientific questions. Our compilation provides a comprehensive description of the two components of the ice shelf, appropriate to an epoch of the late 1980s. The compilation generally agrees with other estimations (e.g. Vaughan et al. 1994, Joughin & Vaughan Reference Joughin and Vaughan2004), but our approach, using density data from a borehole for the calibration of the ice thickness to surface elevation relation, provides an improved ice thickness model, especially for the region where marine ice exists.
The main improvement compared to earlier results is the first high-resolution ice thickness distribution for the grounding line region between Institute Ice Stream in the west and Schmidt Hills in the east. Especially the area around MES and FIS shows some considerable differences compared with earlier work.
The “ice plain” indicated in earlier maps in front of MES was identified as an area with a pattern of floating and grounded parts, where the highest elevations above flotation are around 20 m (Fig. 4). This region of the ice shelf with ice thicknesses close to grounding exist in an area between the boundary of MES and FIS until the eastern margin of Bungenstockrücken. A close observation of this region over a number of years could provide valuable information about growth or decay of the ice masses in the transition zone between the ice sheet and the ice shelf. Further to the east the grounding line of FIS turned out to be about 50 km further to the south as indicated in earlier maps (Lambrecht et al. Reference Lambrecht, Mayer, Hempel, Nixdorf and Oerter1995). The new compilation of the ice thicknesses in combination with the analysis of remote sensing data (Jezek & RAMP Product Team 2002) now results in an additional ice shelf area of 3200 km2. Even with the strong basal melt rates determined in that area (Lambrecht et al. Reference Lambrecht, Mayer, Hempel, Nixdorf and Oerter1995) the change in the general mass balance conditions is minor, because the area increase is only 0.6%.
The maps produced from this model should prove to be a valuable resource for many areas of investigation. Precursors to the maps presented here have already been used in studies of tidal flow beneath the ice shelf (Makinson Reference Makinson2002) and sub-ice oceanographic modelling (Holland & Jenkins Reference Holland and Jenkins2000, Holland & Feltham in press) where the new grounding line conditions could lead to much improved results.
Acknowledgements
We thank H. Bennat, C.S.M. Doake, P. Homlund, U. Nixdorf, D.R. Mantripp, V.S. Pozdeev, U. Schirmer, J. Sievers, and F. Thyssen for providing data and valuable advice. We are grateful for the ADD information that was provided by SCAR. Support from the Alfred Wegener Institut für Polar- und Meeresforschung, Bremerhaven, Germany, British Antarctic Survey, Cambridge, UK, Bundesamt für Kartographie und Geodäsie, Frankfurt am Main, Germany, Institut für Geophysik, Universität Münster, Germany, Sevmorgeologija, Sankt Peterburg, Russia, and Department of Physical Geography, Stockholm, Sweden, is gratefully acknowledged. The project has received financial support from the European Science Foundation (grant EIS/96/09). The map data are available through the Pangaea data base (www.pangaea.de).