Durst et al., in their Comment to our article, point out that the way we calculated the correction factor β in the case of elastic materials is incorrect. We agree with them. By defining the β factor as we did, i.e.,  , β appears as a correction factor of the contact stiffness at a given depth, which has not the same signification as that of β in equation
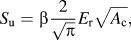 where β appears also as a correction factor of the contact area. Indeed, for a given depth, both unloading contact stiffness and contact area varies depending on the radius of the indenter (see Fig. 1 of Ref. Reference Meza, Abbes and Troyon1).
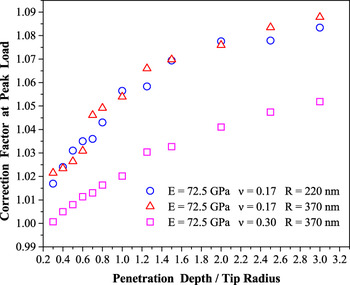
Correction factor versus the depth to tip radius ratio (h/R) for different values of indenter radius (R) and Poisson’s ratio (υ).

To complete results of Durst et al., who have limited their calculations to a restricted range of depths (between 100 and 500 nm), we have extended the calculation of β to a larger penetration depth range and presented the result versus the depth to tip radius ratio, h/R, since β depends on this ratio according to dimensionless analysis.Reference Meza, Abbes and Troyon1 The numerical simulations have been carried out using the finite element (FE) code Abaqus. The indenter was considered to be perfectly rigid, and the contact between the sample and the tip was assumed to be frictionless. The specimen was modeled with four-node bilinear axisymmetric quadrilateral elements (CAX4R), with a refined mesh close to the indenter to be able to describe the strain and the stress gradient beneath the tip with sufficient accuracy. Calculation has been done for two tip radius values (220 and 370 nm), E = 72.5 GPa and Poisson’s ratio υ = 0.17. Since β depends also on υ, we have also calculated β for υ = 0.3 to show the influence of υ. These calculations have been done, of course, by using equation  where A c and the contact stiffness S FEC are extracted from the FE simulation.
Figure 1 shows these results. Note first that, for R = 370 nm, E = 72.5 GPa, and υ = 0.17, the variation range of β values is between 1.02 and 1.09 for 0.3 < h/R < 3. On the other hand, FE calculation for R = 220 nm verifies well that β is h/R dependent since both curves for R = 220 and 370 nm are almost perfectly superimposed taking into account the calculation inaccuracies. When Poisson’s ratio increases to υ = 0.3, β values are smaller, in the range 1–1.05. This is explained by the diminution of the influence of the radial inwards displacements of surface points inside the circle of contact, which decreases with the increase of υ as shown by Hay et al.Reference Hay, Bolshakov and Pharr2
To resume, results presented in Fig. 1 show that the correction factor β, for elastic materials, depends on h/R and Poisson’s ratio in a relatively moderate manner. We did not verify it, but β certainly depends also on friction coefficient and indenter cone angle as foreseen by dimensional analysis.
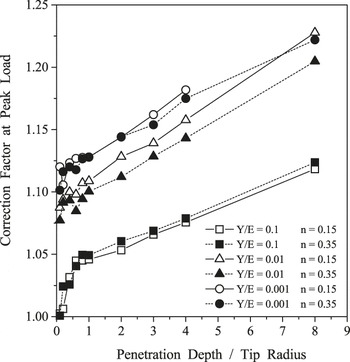
We would like to draw readers’ attention to the fact that these results, which concern only the purely elastic materials, have a moderate interest as quantitative values, in the sense that most of the engineering materials present also plasticity, with a very different behavior than that of elastic ones as the results of Fig. 2, that we previously published,Reference Abbes, Troyon, Meza and Potiron3 shows it. Therefore, results for elastic materials are certainly not transposable to materials presenting some plasticity.
Finite element calculation for elastic–plastic materials of the correction factor versus h/R for different ratios of the initial yield stress Y to the elastic modulus E and strain hardening exponent n values (Ref. Reference Abbes, Troyon, Meza and Potiron3).

Figure 2 shows the β factor depends strongly on the material properties and the ratio h/R, with β values much higher than the range 1.02–1.05 mentioned in the Comment by Durst et al. Conclude as these authors in their Comment “the range 1.02–1.05 for β is in line with the experimentsReference Strader, Shim, Bei, Oliver and Pharr4 and FE simulationsReference Bolshakov, Oliver, Pharr, Baker, Ross, Townsend, Volkert and Børgesen5–Reference Cheng and Cheng7 performed for spherical and conical indentions in elastic–plastic materials” suggests that the influence of the correction factor is low, which is far from being exact. Moreover, others experimental resultsReference Troyon and Huang8, Reference Troyon and Lafaye9 than the oneReference Strader, Shim, Bei, Oliver and Pharr4 cited in the Comment show that β can take much higher values than 1.02–1.05.
CONCLUSION
We agree with Durst et al. that the way we calculated the correction factor β for elastic material in Ref. Reference Meza, Abbes and Troyon1 is misleading. We also agree that the projected contact area is of paramount importance in contact mechanics and it is often not sufficient simply using the contact depth for analyzing the data. But, we do not agree that the β factor has an almost constant value regardless of the indentation depth or the considered geometry of the indenter, with a variation range 1.02–1.05 in line with experiments and FE simulations performed for elastic–plastic materials. If for elastic materials the variation range of β is relatively moderate, it is not the case for elastic–plastic materials. Results obtained for elastic materials cannot be transposed to elastic–plastic materials. On the contrary, for these materials, β strongly depends on the mechanical properties but also on the ratio h/R, i.e., when passing from the nanoindentation to the microindentation domain.