INTRODUCTION
The maximum sustainable yield that can be taken from an exploited stock is related to the species’ life history pattern and its environment (King, Reference King1995). Extreme overfishing can result in recruitment failure when the number of mature adults is so low that insufficient offspring are produced to sustain the population. Fecundity estimates have been used for fisheries-independent assessment of Nephrops spawning biomass using the larval production method (Briggs et al., Reference Briggs, Armstrong, Dickey-Collas, Allen, McQuaid and Whitmore2002) and estimates of fecundity are used to measure the capacity of individuals to produce offspring, or Darwinian fitness (McFarland, Reference McFarland1999). In order to maximize fitness, Nephrops has adopted a reproductive strategy in which a relatively large number of eggs are produced to compensate for losses over the 9-month incubation period, during which females remain in burrows in the seabed. Egg losses during incubation have been attributed to poor adhesion to the pleopods at oviposition, mechanical abrasion, predation and parasitism (Kuris, Reference Kuris, Wenner and Kuris1991).
Mating in Nephrops occurs annually in the Irish Sea, following female ecdysis and just after the previous egg batch has hatched which is during April–May in the Irish Sea (Nichols et al., Reference Nichols, Bennet, Symonds and Grainger1987). In the Irish Sea fertilized eggs are extruded during August–September, after which they go through a series of developmental stages. According to Farmer (Reference Farmer1974) yolk cleavage occurs within a few days of egg extrusion, after which egg development appears to cease for up to seven months, during which time the eggs remain dark green in colour. Subsequent development continues rapidly until the larvae hatch during April or May. Over the final development period the egg diameter increases and the colour changes from dark green, through pale green to pink. This change in egg colour is due to the increasing size of the pink/orange coloured embryo and the decreasing amount of green coloured yolk. Egg loss during the incubation period is an important determinant of effective fecundity, i.e. the number of viable eggs remaining intact for hatching in the spring. Reports of egg loss during incubation range from 75% in Portuguese stocks (Figueiredo & Nunes, Reference Figueiredo and Nunes1965) to 32–51% in the Moray Firth, Scotland (Chapman & Ballantyne, Reference Chapman and Ballantyne1980). This paper examines the reproductive process in Irish Sea Nephrops and provides estimates of potential fecundity (number of oocytes in ovaries), realized fecundity (number of eggs extruded at spawning time) and effective fecundity, defined as the number of eggs attached to the pleopods just prior to hatch (Morizur, Reference Morizur1981; Figueiredo et al., Reference Figueiredo, Margo and Franco1982). Spatial and temporal variations in fecundity are also discussed.
MATERIALS AND METHODS
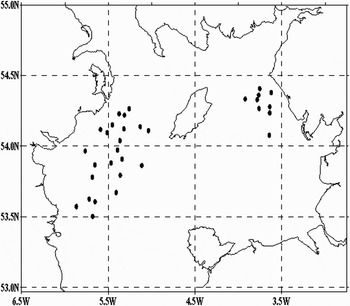
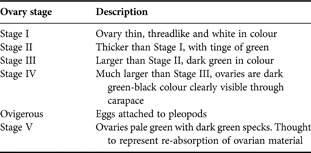
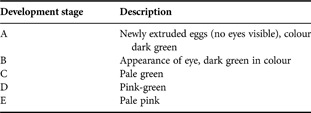
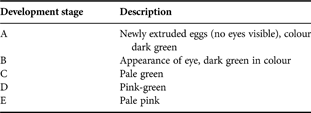
The Agri-Food and Biosciences Institute (AFBI) carries out Nephrops trawl surveys during spring (April) and summer (August) each year, marking the beginning and end of the egg incubation period. These surveys form part of AFBI's ongoing Nephrops research programme and focus on an established grid of sampling stations on the western Irish Sea Nephrops grounds (Figure 1). At each station a custom-made 20-fathom Nephrops trawl net with a 50 mm mesh is deployed for around 30 minutes over a distance of 2–3 nautical miles. Ovaries of captured Nephrops are examined macroscopically according to an arbitrary scale (Table 1) proposed by Bailey (Reference Bailey1984), and later adapted by Briggs (Reference Briggs1988). Ovigerous animals were collected mainly during August research surveys in 1999 and 2000 and preserved in 4% buffered formalin before being transferred to the laboratory for egg counting. Figueiredo & Barraca (Reference Figueiredo and Barraca1963) developed a scale to describe egg development following extrusion based on macroscopic observation of egg colour and this was adopted here (Table 2). Carapace length (CL) of all specimens was measured to the nearest mm below, using Vernier callipers before preserving in formalin. Females with fully mature ovaries (Stage IV in Table 1) were transferred to a land-based holding system established for retaining Nephrops throughout their incubation period (Briggs et al., Reference Briggs, Armstrong, Dickey-Collas, Allen, McQuaid and Whitmore2002).
Map of Irish Sea showing eastern and western stations sampled (dots).

Ovary maturation stages described by Briggs (Reference Briggs1988) were adapted from those proposed by Bailey (Reference Bailey1984).

Egg development scale adapted from Figueiredo & Barraca (Reference Figueiredo and Barraca1963).
Potential fecundity
Non-ovigerous females with mature ovaries (Stage IV) were caught during AFBI summer trawl surveys which avoided the spring moulting period. Whole females were frozen at −20°C and returned to the laboratory where they were fixed in 4% buffered formalin for 24 hours and then transferred to 70% alcohol for a further 24 hours. A longitudinal incision was made along the carapace and tail and the shell was peeled back to expose the ovaries. The ovary material was dried to a constant weight at 100°C for 24 hours according to the method of Tuck et al. (Reference Tuck, Atkinson and Chapman2000). The dried ovaries were weighed, a sub-sample removed and oocytes counted. These counts were raised to the dry weight of the whole ovary to provide an estimate of potential fecundity.
Realized fecundity
Two sources of ovigerous females (size-range 21–39 mm CL) were used to assess realized fecundity: (i) animals collected directly from the trawl and (ii) mature females which had extruded their eggs in the holding system. The ovigerous females were removed from the trawled catch as quickly as possible to reduce egg loss due to handling stress and mechanical abrasion. It is possible that eggs extruded in captivity may also be lost due to different adhering rates in aquaria compared to the wild. Animals appearing by visual examination of egg mass to have excessive egg loss compared to other ovigerous animals were excluded. Ovigerous females were left in 4% formalin for 2 months to allow any shrinkage of eggs to occur (Sterk & Redant, Reference Sterk and Redant1989). This period also allowed the eggs to harden and to aid intact egg removal from the pleopods with forceps. Upon successful removal eggs were blotted dry and weighed. A sub-sample of eggs was then taken, for counting and the result assessed to give an estimate of realized fecundity. A sub-sample of freshly-extruded eggs in captivity was retained to examine egg size in relation to female size.
Effective fecundity
Effective fecundity was estimated: (i) from the number of pre-hatch eggs (Stage D) attached to the pleopods of females in trawl survey catches; and (ii) by counting the number of larvae produced by ovigerous females in captivity at the end of the incubation period. Two methods of estimation were used as both are subject to egg loss through capture.
RESULTS
Data analysis
Fecundity (Fec) was expressed as a function of CL in the form:

where Fec is fecundity, CL is carapace length (mm), a and b are constants which represent the intercept and the slope respectively. A logarithmic transformation was performed on the data to give the linear form:

This can be fitted by least squares linear regression and showed a significant (P < 0.05) positive correlation between female size and fecundity. The parameters of the fitted regression equations for each fecundity assessment technique were compared using analysis of variance (ANOVA) and the ANOVA of regressions method described by Mead et al. (Reference Mead, Curnow and Hasted1993).
Potential fecundity
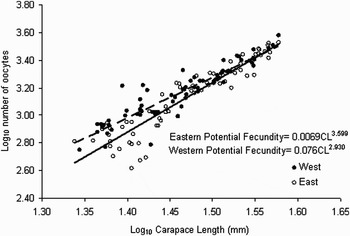
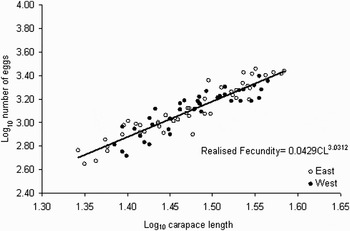
Potential fecundity estimates in 2000 were found to be positively correlated with CL for both eastern and western Irish Sea stocks and Figure 2 illustrates the relationship between the two stocks. ANOVA of the potential fecundity data revealed significant differences between regression slopes and intercepts for the two stocks (F = 8.65, P = 0.004). This suggests smaller females in the eastern stocks have a lower potential fecundity than those in the western Irish Sea for most of the size-range, but the regression lines in Figure 2 intersect at less than the maximum CL, so the difference diminishes as CL increases and presumably would not be significantly different for some portion of the upper range of CLs.
Relationship between potential fecundity and carapace length for western and eastern Irish Sea stocks. Data have been log–log transformed and lines are fitted by least squares.

Realized fecundity
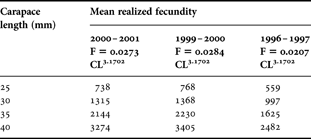
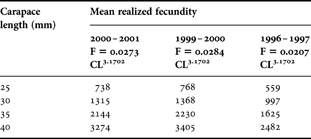
Realized fecundity was estimated from egg counts on trawled ovigerous females to compare western and eastern Irish Sea stocks (Figure 3). ANOVA of the fitted regressions revealed no significant difference in realized fecundity between the two stocks. ANOVA of regressions fitted for the 1996, 1999 and 2000 spawning periods showed no significant difference between the slopes, but did show significant differences in intercepts calculated from the regression equations for realized fecundity between the three years investigated (Table 3). Although the predicted fecundity at size for 1999 was 25% higher than in 1996 (Anonymous, 1999) pairwise comparison (ANOVA of regressions) of the three years, showed that there was no significant difference between 1999 and 2000. Realized fecundity was therefore significantly (P < 0.001) lower in 1996 than in the more recent years. Egg counts on mature females that had extruded eggs in captivity performed in 1997, 1999 and 2000 gave variable estimates.
Relationship between realized fecundity and carapace length for eastern and western Irish Sea stocks. Coefficient of determination (r2) of 0.8474 was calculated for the relationship.

The mean realized fecundities for a range of carapace lengths for realized fecundity for three separate spawning seasons. Regression equations are in the form fecundity = a CLb, where CL represents the carapace length, b is the slope and a is the intercept.
COMPARISON OF REALIZED FECUNDITY ESTIMATES
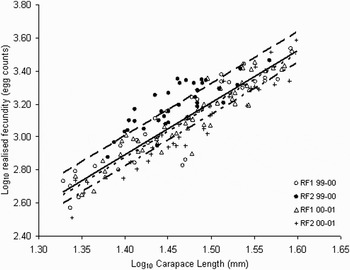
The four sets of data on realized fecundity were plotted against CL to investigate the relationship between the method of determination and the spawning season. ANOVA of regressions fitted to the data sets identified parallel lines as best fit (Figure 4) and showed that the realized fecundity estimates for 1999 and 2000 for eggs extruded in captivity had the greatest variability. Realized fecundity was estimated from trawled ovigerous females and was adopted as the most viable method.
Relationship between two methods of estimating realized fecundity in two separate spawning seasons; RF 1, trawled ovigerous females; RF2, females became ovigerous in the laboratory. Data have been log–log transformed and lines fitted by least squares. The fitted lines follow the order in which the data are listed above.

Effective fecundity
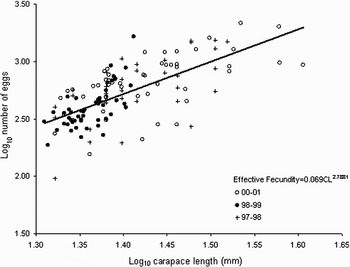
Effective fecundity was estimated from counts of ready-to-hatch eggs (Stage D) in 1997, 1998 and 2000. ANOVA performed on the linear regressions fitted data from the three years showed no significant difference between effective fecundity between years and a single line was fitted by least squares, through the combined data for the three spawning periods (Figure 5).
Relationship between effective fecundity and carapace length for three separate spawning periods. Best line of fit to the data was fitted by least squares.

COMPARISON OF THE TWO METHODS USED TO ESTIMATE EFFECTIVE FECUNDITY
(a) Counting the number of Stage D eggs from trawl caught females collected at the end of the egg incubation period.
(b) Collecting females with eggs ready to hatch during spring research vessel surveys and allowing eggs to hatch in captivity. Although the number of larvae produced per female was variable (45–993), regression analysis did show a significant positive correlation between CL and the number of larvae produced (F = 5.503; P = 0.0265).
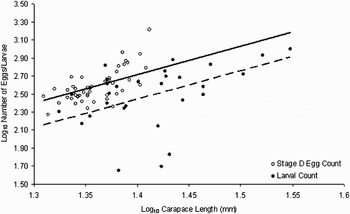
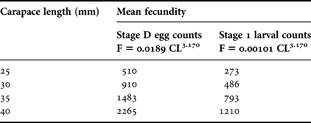
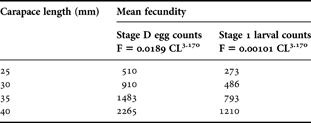
Further analysis of data from the two methods showed no significant difference between regression slopes but there was a significant difference between intercepts (Figure 6). The regression equations for the two techniques were used to predict mean fecundities over a range of CLs (Table 4). These data demonstrate an average of 46.5% loss between Stage D eggs and hatched larvae.
Relationship between two methods of estimating effective fecundity in the 1998–1999 spawning period. Lines are fitted by least squares. Egg counts = 0.0189 CL3.170 (solid line); larval counts = 0.0101 CL3.170 (broken line).

The mean fecundities predicted from the regression equations, for a range of carapace lengths for two effective fecundity techniques carried out in the 1998–1999 spawning period.
Relationship between potential, realized and effective fecundity
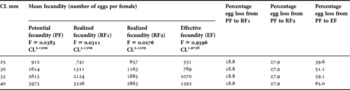
The 2000 data were the most comprehensive and were used to investigate the relationship between potential, realized and effective fecundity. Potential and realized fecundity estimates were analysed together, as they represented fecundity at the beginning of the egg incubation period and gave the following relationships:
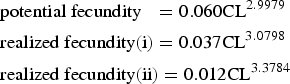
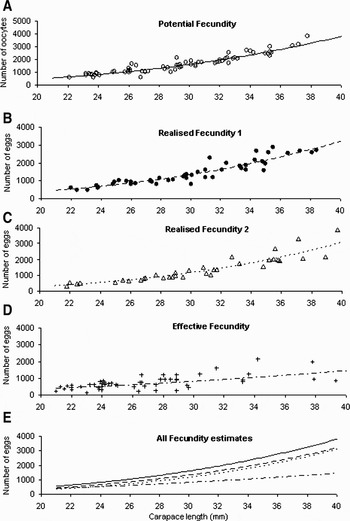
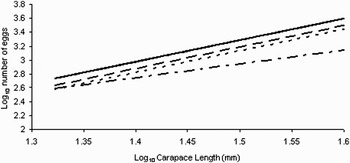
These regressions were evaluated using ANOVA of regressions and identified parallel lines as best fit indicating no significant differences in their slopes and that variation between fecundity estimates were independent of size. The pooled slope calculated to be 3.1309 (SE ± 0.090) was applied to the data sets and the intercepts were re-calculated. These equations were then used to predict the mean fecundities for a range of CLs in order to investigate changes in fecundity over the incubation period (Table 5). Pairwise comparison of the potential and realized fecundity estimates revealed that the three intercepts were significantly different from each other (P < 0.0001). Effective fecundity data for 2000, representing fecundity at the end of the incubation period was plotted and ANOVA carried out on the linear regressions for all four fecundity datasets. Effective fecundity data had a significantly different slope and intercept (P < 0.001) from the potential and realized fecundity regressions over the same period. While effective fecundity estimates increased with CL it did not increase at the same rate as potential and realized fecundity (Figures 7 & 8).
Relationships between carapace length and potential (A), realized (B) and (C) and effective fecundity (D) for the incubation period 2000–2001 for the western Irish Sea stocks; (E) combines the 4 fecundity estimates to illustrate the similarities and differences between estimates carried out for the 2000–2001 spawning period.

Fecundity data from Figure 7: (e) was log–log transformed to give linear relationships between number of eggs and carapace length for the different techniques.

The mean fecundities predicted from the regression equations, for a range of carapace lengths for potential and realized fecundity (RF1, trawled ovigerous females; RF2, females which extruded eggs in the laboratory) for the 2000–2001 spawning season. Regression equations are in the form fecundity = a CLb, where CL represents the carapace length, b is the slope and a is the intercept.

Egg loss over the incubation period
The differences in mean predicted fecundities, calculated from the potential, realized and effective fecundity regression equations represent egg loss over the reproductive cycle. The differences between potential and realized fecundity correspond to the loss of eggs between release from the ovary and attachment to the pleopods. Realized fecundity estimates from trawled ovigerous females and from females that extruded eggs in the laboratory, were found to be 18.8% and 27.9% lower than potential fecundity, respectively. The difference between potential and realized represents failure of eggs to adhere to pleopods, wear and tear loss and loss during capture. The fact that realized fecundity was lower for eggs hatched in aquaria (suffering no trawl capture loss and minimal wear and tear, as eggs were counted soon after extrusion) than for trawl caught ovigerous animals suggests strong aquarium effect on eggs adhering.
ANOVA of regressions carried out on potential and realized fecundity in 2000 demonstrated parallel lines as best fit indicating that there was no significant difference in slope, i.e. egg loss remains constant over the size-range. Analysis of the difference between potential and effective fecundity gave significantly different slopes and intercepts (P < 0.001). Therefore, egg loss varied with female size and ranged from 39.6% at 25 mm CL to 65.0% at 40 mm CL (Table 5).
Relationship between egg size and female carapace length
Egg diameter was measured for freshly extruded Stage A eggs in 1998 and 2000 and converted to egg volume using the equation:

where V is volume and D is diameter of the egg. Regression analysis revealed no significant correlation between egg diameter (F = 3.829, P > 0.05) or egg volume (F = 2.858, P > 0.05) and CL.
DISCUSSION
Comparison between western and eastern Irish Sea
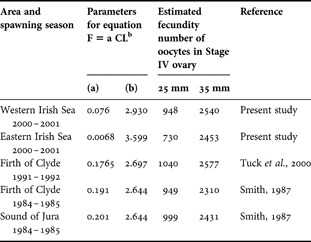
The number of oocytes in the ovary of mature Nephrops has been used as an indicator of potential fecundity by a number of authors including Thomas (Reference Thomas1964), Smith (Reference Smith1987), Farina et al. (Reference Farina, Freire and Gonzalez-Gurriaran1999) and Tuck et al. (Reference Tuck, Atkinson and Chapman2000), and Table 6 lists some of these for comparison. To facilitate comparison, potential fecundity was calculated from regression equations for females at 25 mm and 35 mm CL, representing the upper and lower range of the mature population. Both slopes and intercepts of the regressions for eastern and western populations differed significantly (P < 0.001) and the fecundity–size relationship suggests a lower potential fecundity in the eastern Irish Sea. However, it is likely that the shallower grounds in the eastern Irish Sea have greater fluctuations in bottom temperature than the western grounds and this may affect food availability, a primary regulator of egg production (Mori et al., Reference Mori, Biagi and Ranieri1998). Ovigerous female Nephrops were trawled in 2000 from the western and eastern Irish Sea for realized fecundity estimates. ANOVA of egg count: CL regressions found no significant difference between realized fecundity for the western and eastern stocks. However, realized fecundity is of little value and could only be accurately measured from creel caught individuals, where capture disturbance is minimized. Potential fecundity, reflecting ovary development and effective fecundity providing an estimate of offspring produced are most important to our understanding of Nephrops population dynamics.
Comparison of mean predicted potential fecundity of females Nephrops norvegicus at two carapace lengths (25 mm and 35 mm) based on present and previous studies.

Temporal comparison of realized fecundity
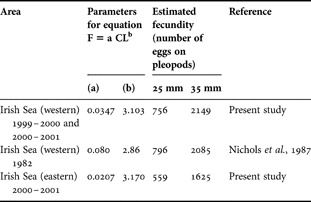
Realized fecundity was estimated in 1996 using egg counts from trawled ovigerous females and from counts of eggs extruded in the laboratory. The aim was to investigate realized fecundity estimates over time and ANOVA of regression analysis of realized fecundity data identified differences in intercept values as the main variant in the fecundity–size relationship. Although comparison of temporal data showed no significant difference between 1999 and 2000, realized fecundity was 26% lower in 1996 and coincided with low water temperatures in 1996. It is possible that temperature may have a direct effect on oocyte development by influencing metabolism or indirectly by influencing nutrient availability for egg production (Mori et al., Reference Mori, Biagi and Ranieri1998). The 1999 and 2000 data from egg counts of trawled ovigerous females indicate that fecundity remains relatively constant between spawning seasons. The predicted mean realized fecundity from Nichols et al. (Reference Nichols, Bennet, Symonds and Grainger1987) is very similar to the estimates in this study and supports the hypothesis that fecundity does not vary significantly over time under similar temperature regimes (Table 7). Realized fecundity was also estimated from the number of eggs attached to the pleopods of females that had extruded their eggs in captivity, avoiding bias from loss of eggs up to and during capture. However, the method does assume that laboratory conditions do not affect oviposition. ANOVA of regressions revealed significant differences in both slopes and intercepts for the three spawning periods investigated and pairwise comparison of realized fecundity did identify differences in intercept as the main variant between spawning seasons.
Comparison of predicted mean realized fecundity based on egg counts from trawled ovigerous Nephrops norvegicus at two lengths based on present and previous studies. The 1999–2000 and 2000–2001 data were pooled to give a single slope and intercept.

Comparison of realized fecundity estimate techniques
If the high variability (34%) in the realized fecundity estimate with captive egg extrusion noted here was related to environmental conditions during ovary development the same trend would be found in egg counts on trawled ovigerous females (technique i) and this was not the case as a pairwise comparison showed no significant difference between the two years. This suggests that egg adhesion to pleopods may be affected by the in vitro conditions. In 2000 the extruded egg counts were lower than the trawled egg counts though histological examination of ovaries shows mature oocytes in the ovary. In previous years the extruded count was higher than the trawled egg count, though the same procedures were followed. It is likely that the egg extrusion is affected by such factors as stress from handling, or transport to the laboratory, or maintenance in the holding system. Until the process of oviposition is more fully understood counts of eggs extruded in captivity give an inconsistent estimate of realized fecundity. Other studies showed that egg loss during capture by trawling is about 11%, by comparing egg counts from females of a similar size collected by trawl and creel (Anonymous, 1999). Egg counts from trawled ovigerous females adjusted for egg loss during capture by trawls is therefore a more robust method available for estimating realized fecundity over time than egg extrusion in captivity.
Effective fecundity
Although effective fecundity estimates vary considerably within years for a given CL the overall fecundity–size relationship did not vary from year to year. Smith (Reference Smith1987) also noted that fecundity from egg counts carried out on Scottish stocks remained relatively constant between spawning years. Estimates of effective fecundity from the number of larvae released by ovigerous females trawled prior to hatch were also quantified. Although the number of larvae varied greatly for a given CL, a significant (P < 0.05) positive relationship was identified. Since both methods of estimating effective fecundity were carried out in 1999 a comparison of the two data sets showed the slopes of the two fecundity–size relationships did not differ significantly, though their intercepts did (P < 0.001). Variation between the intercepts represents egg loss between Stage D eggs and larvae.
Relationship between potential, realized and effective fecundity
In 2000 it was possible to follow fecundity from mature oocytes to Stage D eggs at the end of the egg bearing period. At the start of incubation when potential and realized fecundity were estimated, differences in regression intercept rather than the slope were identified as the main variant. This has been reported to be to be a general feature of Nephrops fecundity and is also the case with other crustaceans (Thomas, Reference Thomas1964; Farina et al., Reference Farina, Freire and Gonzalez-Gurriaran1999; Tuck et al., Reference Tuck, Atkinson and Chapman2000).
Egg loss over the incubation period
Egg loss over the incubation period has been studied by Morizur (Reference Morizur1981), Figueiredo et al. (Reference Figueiredo, Margo and Franco1982), Smith (987), Mori et al. (Reference Mori, Biagi and Ranieri1998) and Farina et al. (Reference Farina, Freire and Gonzalez-Gurriaran1999). Working in the Tyrrhenian Sea Mori et al. (Reference Mori, Biagi and Ranieri1998) found egg loss between potential and realized fecundity decreased with increase in female CL from 30% at 30 mm CL to 20% at 40 mm CL. In the Irish Sea however, Nephrops egg loss remained constant at around 19% (18.8%), estimated from trawled ovigerous females within the size-range 22.1–37.8 mm CL. Smith (Reference Smith1987) also reported constant egg loss over the size-range examined in the Clyde Sea area in creel caught Nephrops. In the eastern Irish Sea stocks, the slope and intercepts for potential and realized fecundity differed significantly and egg loss ranged from 1% at 26 mm to 20% at 38 mm CL. It is unclear why smaller females from the eastern Irish Sea grounds have a lower egg loss between release from the ovary and egg attachment to the pleopods than females of the same size from the west, but it may be due to water depth, i.e. more eggs are lost during trawl hauling in the deeper western Irish Sea. Farmer (Reference Farmer1974) noted that some oocytes were not extruded as eggs, remained in the ovary and are resorbed. Larger females may retain more oocytes than smaller ones in areas where food availability is limited and this strategy is likely to be a means of increasing survival by conserving nutrients (Tuck et al., Reference Tuck, Taylor, Atkinson, Grammitto and Smith1997).
Egg loss between freshly extruded (Stage A) and pre-hatch (Stage D) eggs varies between stocks. Figueiredo & Nunes (Reference Figueiredo and Nunes1965) first estimated egg loss over the incubation period at 75%, with a monthly egg loss of 10% in Portuguese stocks. In a later study Figueiredo et al. (Reference Figueiredo, Margo and Franco1982) used an improved estimation technique and re-calculated egg loss for the same stocks to be 56% from mature ovary to Stage D. In the Bay of Biscay Morizur (Reference Morizur1981) estimated egg losses of 45–50% from ovary to egg Stage D and 30–40% from the newly extruded to pre-hatch stage eggs. Chapman & Ballantyne (Reference Chapman and Ballantyne1980) estimated egg loss in Scottish stocks at 32–51% over the incubation period and Farina et al. (Reference Farina, Freire and Gonzalez-Gurriaran1999) estimated losses at 44% from egg Stage A in Galician stocks. Egg loss from ovary to egg Stage D in the western Irish Sea stocks ranged from 40% at 25 mm CL to 65% at 40 mm CL Nephrops. This egg loss, adjusted losses during trawling (11%), therefore falls within the range estimated from other areas. The causes of egg loss in crustaceans was reviewed by Kuris (Reference Kuris, Wenner and Kuris1991) who listed factors such as mechanical abrasion with the substratum, maternal cannibalism, egg predation and parasitism as possible causes. Mori et al. (Reference Mori, Biagi and Ranieri1998) suggested that females are able to identify and remove infertile eggs and there was some evidence of this in this study with females removing individual eggs from the egg mass.
The difference in mean fecundity estimated from the two effective fecundity techniques employed here accounted for a further loss from pre-hatch eggs to larvae of about 47%. This loss includes eggs removed by trawl abrasion at the end of the incubation period and during transport to the laboratory. Unfortunately the small number of ovigerous females captured at the end of the incubation period meant it was not possible to sacrifice enough animals to quantify the egg loss specifically due to transport to the laboratory. A more precise estimate of the number of Stage 1 larvae produced by Nephrops at the end of the nine month incubation period would require an improved estimate of egg loss from transport and from holding-system-induced stress.
Relationship between egg diameter and female carapace length
Limits on resource allocation to reproduction can lead to a ‘trade off’ between size and the number of eggs produced in order to maximize Darwinian fitness. Morizur & Rivoalen (Reference Morizur and Rivoalen1982) found that average egg diameter varied according to female size in Celtic Sea Nephrops. Smith (Reference Smith1987) on the other hand found no relationship between the females size and egg diameter for Scottish stocks. Egg diameter and egg volume of Stage A eggs from females of 22–40 mm CL supported Smith's findings in that there was no significant relationship between mean egg size and female size.
Results from this study suggest that as Irish Sea female Nephrops increase in size they use available resources to produce more, rather than larger, eggs and the number of eggs produced is sufficient to compensate for 18–20% loss of oocytes during egg extrusion and 20–60% loss of these during incubation, followed by a further loss of up to 40% prior to larvae hatching. This means that as few as 20% of oocytes become free swimming larvae. Nephrops survival strategy and Darwinian fitness therefore depends upon a high fecundity and is a life strategy that is in line with that associated with planktotrophic development during which larval mortality is likely to be high.