INTRODUCTION
Leishmania spp. are protozoa parasites among which are species that cause leishmaniasis, a disease that occurs in different clinical forms (cutaneous, mucocutaneous and visceral) and is endemic in many countries around the globe. Disease control and treatment are still inefficient and parasite drug resistance is a challenge since it may involve DNA amplification (Beverley et al. Reference Beverley, Ellenberger and Cordingley1986; Grogl et al. Reference Grogl, Oduola, Cordero and Kyle1989; Beverley, Reference Beverley1991; Ouellette et al. Reference Ouellete, Drummelsmith and Papadopoulou2004; Berman, Reference Berman2005). Therefore, efforts for the establishment of intensive research to better understand the molecular biology of these parasites are encouraged.
In most eukaryotes, replication protein A (RPA) is a heterotrimeric complex of single-stranded DNA-binding proteins that plays multiple roles in eukaryotic DNA metabolism, including telomere maintenance and DNA damage signalling (Wold, Reference Wold1997; Schramke et al. Reference Schramke, Luciano, Brevet, Guillot, Corda, Longhese, Gilson and Geli2004). RPA has high affinity for single-stranded DNA generated during replication and for damaged double-stranded DNA (Patrick and Turchi, Reference Patrick and Turchi1999; Lao et al. Reference Lao, Gomes, Ren, Taylor and Wold2000). This protein complex is required for each of the 4 major DNA repair pathways, including the repair of DNA double-strand breaks (DSBs), a finding that suggests a surveillance function in the response to DNA damage (Wold, Reference Wold1997). RPA has also been implicated in cell cycle checkpoint activation (Zou et al. Reference Zou, Liu, Wu and Shell2006) since HeLa cells deficient in RPA are arrested at G2/M, have high levels of spontaneous DNA damage and show constitutive activation of checkpoint kinases (Dodson et al. Reference Dodson, Shi and Tibbetts2004).
During the repair of DSBs by homologous recombination in yeast, RPA interacts with and modulates the activities of 2 members of the RAD52 epistasis group, namely proteins RAD51 and RAD52 (Sugiyama and Kowalczykowski, Reference Sugiyama and Kowalczykowski2002; Stauffer and Chazin, Reference Stauffer and Chazin2004). In addition, the partial co-localization of RAD51 with RPA suggests that these nuclear foci are sites of DNA repair by homologous recombination (Golub et al. Reference Golub, Gupta, Haaf, Wold and Radding1998). In mammals, RPA acts as a common intermediate for signalling DNA damage and for the subsequent recruitment and activation of damage response proteins at telomeres. The accumulation of RPA bound to single-stranded telomeric DNA occurs in the absence of single-stranded telomeric proteins or telomerase. In contrast, the presence of DNA-binding proteins inhibits the recruitment of RPA, nucleases, telomerase and checkpoint proteins (Longhese, Reference Longhese2008).
In trypanosomatids, which includes Leishmania spp., knowledge about the roles played by RPA in DNA metabolism is very limited compared with model eukaryotes. Few reports show that the subunit 1 of RPA in L. amazonensis (LaRPA-1) binds and co-localizes with telomeres in vivo (Fernandez et al. Reference Fernandez, Castellari, Conte, Gozzo, Sabino, Pinheiro, Novello, Eberlin and Cano2004; Siqueira-Neto et al. Reference Siqueira-Neto, Lira, Giardini, Khater, Perez, Peroni, dos Reis, Freitas-Junior, Ramos and Cano2007). LaRPA-1 is also structurally different from other RPA-1 but it shares many structural similarities with known conserved and RPA-like single-stranded telomere-binding proteins (e.g. POT1, CDC13 and OnTEBP) (Gao et al. Reference Gao, Cervantes, Mandell, Otero and Lundblad2007; Siqueira-Neto et al. Reference Siqueira-Neto, Lira, Giardini, Khater, Perez, Peroni, dos Reis, Freitas-Junior, Ramos and Cano2007) whose homologues were not identified in the protozoan´s genome. In this particular case, RPA-1 may have assumed an extra function at telomeres, analogous to the related telomere end-binding proteins such as POT1 in higher eukaryotes (Lira et al. Reference Lira, Giardini, Siqueira-Neto, Conte and Cano2007; Barrientos et al. Reference Barrientos, Kendellen, Freibaum, Armbruster, Etheridge and Counter2008). To assess the role of LaRPA-1 in damage response, we induced DNA double-strand breaks in Leishmania promastigotes using phleomycin as the genotoxic agent. (Moore, Reference Moore1988, Reference Moore1989; McKean et al. Reference McKean, Keen, Smith and Benson2001). In T. brucei, phleomycin induces in vivo the phosphorylation of a Tr130 residue in the histone H2A, which seems to be a very early signal of the DSB damage response resembling γH2A from other eukaryotes (Glover and Horn, Reference Glover and Horn2012). It was also shown that T. brucei γH2A foci co-localizes with the RAD51 recombinase and that these foci naturally occur during S and G2 phases or upon DSBs induced by chemicals or artificial meganuclease expression (Glover and Horn, Reference Glover and Horn2012).
In the present study, we show that LaRPA-1 is involved in damage response and telomere protection upon phleomycin-induced damage, although it is structurally different from the RPA-1 described in other eukaryotes (Siqueira-Neto et al. Reference Siqueira-Neto, Lira, Giardini, Khater, Perez, Peroni, dos Reis, Freitas-Junior, Ramos and Cano2007). Damage was confirmed by TUNEL-positive nuclei and triggered a G1/S cell cycle arrest concomitantly with the nuclear accumulation of LaRPA-1 and RAD51 in the S phase of hydroxyurea-synchronized cells. DSBs also increased the levels of RAD51 in non-synchronized parasites and of LaRPA-1 and RAD51 in the S phase of hydroxyurea-synchronized cells. At telomeres, more LaRPA-1 associated earlier with the G-rich telomeric strand, with a few foci showing an apparent co-localization of RAD51, although RAD51 did not immunoprecipitate telomeric DNA.
We speculate that in spite of being the major parasite telomere end-binding protein, LaRPA-1 together with RAD51 is involved in DSBs damage response and, at telomeres, upon damage, LaRPA-1 works probably to prevent loss of single-stranded DNA and to avoid a gross damage response. These results, although preliminary, are in agreement with an extra function of LaRPA-1 at parasite telomeres and may add new insights in the protozoa telomere biology field.
MATERIALS AND METHODS
Parasite cultures and cell synchronization
Leishmania amazonensis promastigotes (MHOM/BR/73/M2269) were grown in M199 (Cultilab) supplemented with 10% fetal calf serum (Cultilab), 25 mM. Hepes and a 1× antibiotic/antimycotic solution (Cultilab) at 26 °C. Leishmania amazonensis cultures were synchronized by treating mid-log phase cultures (1·5 × 107 cells mL−1) with 5 mM hydroxyurea for 12 h, and released into drug-free M199 medium (da Silva et al. manuscript in preparation).
Determination of the IC50 for phleomycin in promastigote forms of L. amazonensis
Parasite cultures were incubated with 5–250 μg of phleomycin mL−1 at 1 h time-intervals up to 12 h and then 12 h later at 28 °C. At each time-interval, parasites treated and non-treated with the drug (controls) were fixed in 1% formaldehyde and the cells were counted in a haemocytometer.
A modification of the trypan blue exclusion test (Paland et al. Reference Paland, Kamer, Kogan-Sakin, Madar, Goldfinger and Rotter2009) was used to determine the number of non-viable L. amazonensis promastigotes in the presence of different concentrations of phleomycin and at different times (0, 1, 3 and 6 h); control cells received no drug. After each incubation, parasite cells were washed with 1× PBS and incubated for 15 min at room temperature with 0.4% trypan blue (Gibco) in 1× PBS. The cells were then washed in 1× PBS and cell death was checked by reading the absorbance at a wavelength of 620 nm in an ELISA microplate reader (Multiscan Ex, Labsystems).
Cell sorter analysis
HU-synchronized, phleomycin-treated and non-treated cells were harvested, washed in 1× PBS, fixed in 1% formaldehyde and incubated with RNAse A (10 μg mL−1) for 10 min at room temperature. To measure the DNA content, the cells were stained with propidium iodide (40 μg mL−1; Sigma, St Louis, MO, USA) and analysed with a FACScalibur flow cytometer (Becton and Dickson). Fluorescence was quantified with the CellFIT cell cycle analysis program. Twenty thousand events were analysed for each sample.
Preparation of L. amazonensis nuclear protein extracts
Equal numbers of parasites were used to obtain nuclear extracts from non-treated and treated cultures at each time-point. Nuclear extracts were obtained according to the method of Fragaki et al. (Reference Fragaki, Ferrua, Mograbi, Waldispuhl and Kubar2003), in the presence of protease and phosphatase inhibitors, with minor modifications. Briefly, extracts were prepared from 3 × 10⁹ cells on ice in 0·5 mL of lysis buffer 1 (10 mM Hepes, 1·5 mM MgCl2, 10 mM KCl, 0·5 mM DTT, 0·5% NP40, pH 7·5). After lysis, the parasites were centrifuged and the resulting supernatant was used as the cytoplasmic extract. The pellet containing nuclei was incubated for 20 min on ice with 0·1 mL of lysis buffer 2 (200 mM Hepes, 1·5 mM MgCl2, 840 mM KCl, 0·5 mM DTT, 25% glycerol, 0·2 mM EDTA, pH 8·0). After centrifugation (15 500 g, 15 min, 4 °C), the resulting supernatant was recovered, dialysed against lysis buffer 3 (the same as lysis buffer 2, except that KCl was 100 mM) and used as the nuclear extract.
Western blot and antibodies
Nuclear extracts (equivalent to 107 parasites/lane) from control and phleomycin-treated parasites were separated in 10–12% SDS-PAGE and transferred to nitrocellulose membranes (Bio-Rad) in Tris-glycine-methanol (48 mM, 39 mM, 20%, v/v) at 16 °C. Western blots were developed using a goat anti-rabbit HRP-conjugate secondary antibody (Bio-Rad) and the enhanced chemiluminescence (ECL), according to the manufacturer´s instructions (Millipore).
The homologous sera used to probe Western blot membranes and/or IP and IIF were the mouse polyclonal anti-LaRPA-1 serum (produced from full length recombinant LaRPA-1), the rabbit polyclonal anti-LaRPA-1 (Siqueira-Neto et al. Reference Siqueira-Neto, Lira, Giardini, Khater, Perez, Peroni, dos Reis, Freitas-Junior, Ramos and Cano2007), and rabbit polyclonal anti-La α-Tubulin and anti-LaNOP1 sera (both obtained from synthetic peptides, GenScript, data not shown).
The Leishmania RAD51 gene (LmjF28.0550) encodes the protein RAD51, which is highly conserved in a variety of eukaryotes. The Leishmania spp. RAD51 and the mammalian RAD51 are about 74·5–84% similar and 63–78% identical (McKean et al. Reference McKean, Keen, Smith and Benson2001; Genois et al. Reference Genois, Mukherjee, Ubeda, Buisson, Paquet, Roy, Plourde, Coulombe, Ouellette and Masson2012 and TriTrypDB, http://tritrypdb.org/tritrypdb/). This high level of conservation allowed us to probe Western blots of L. amazonensis protein extracts with a polyclonal serum prepared from full-length human RAD51 expressed in E. coli (Ab46981, Abcam). However, in the L. major gene DB (http://www.genedb.org/genedb/leish/index.jsp) there are 3 genes annotated as homologues of RAD51: LmjF28.0550 (encodes a putative 41·2 kDa protein), LmjF33.2490 (encodes a putative 72·9 kDa protein) and LmjF35.4890 (encodes the 39·5 kDa protein DMC1, RAD51/dmc1). The rabbit anti-human RAD51 serum (Abcam Ab46981) used to develop the immunoblots recognized only the 41·2 kDa L. amazonensis RAD51 protein homologue and no other protein band was revealed with this serum in all Western blots done during the preparation of this article. In agreement with our results, Genois et al. (Reference Genois, Mukherjee, Ubeda, Buisson, Paquet, Roy, Plourde, Coulombe, Ouellette and Masson2012) showed that an anti-human RAD51 serum also recognized in L. infantum extracts was a 41 kDa protein which is the predicted molecular weight for LiRAD51.
We also used the rabbit anti-human histone H2A (Abcam Ab530545) serum that recognizes 2 protein bands of approximately 13–14 kDa in L. amazonensis nuclear extracts (see Fig. 6). In the L. major genome database there is 1 gene annotated as histone H2A (gene DB LmjF.21.0915) and 6 others annotated as histone H2A putative genes (LmjF.21.0920, LmjF.21.0930, LmjF.29.1720, LmjF.29.1730, LmjF.29.1740 and LmjF.17.0280). According to a search using Delta-Blastp (data not shown) the Leishmania H2A protein (gene DB LmjF.21.0915) shares approximately 45% identity with the human histone H2A type 1-A (GenBank Accession number NP_734466) and also ∼50% with other mammalian and vertebrate's histone H2A proteins. Thus, it is possible that both the anti-human RAD51 and the anti-human histone H2A sera that we used here recognize epitopes presented in the most conserved regions of the Leishmania RAD51 and H2A proteins, respectively.
Chromatin immunoprecipitation assay
Formaldehyde cross-linked chromatin was obtained from parasites (0·8 × 108 cells/experiment) treated with phleomycin (40 μg mL−1) for 1 and 3 h and from non-treated controls at the same time-points. Chromatin was immunoprecipitated with anti-LaRPA-1 and anti-RAD51 sera and DNA was extracted after reversal of the cross-linking. DNA samples were slot-blotted and hybridized with Tel1C [(CCCTAA)3], and kDNA (5′-TTTCGGCTCGGGCGGTGAAAACTGGGGGTTGGTGTAAAAT-3′) probes using an established protocol (Lira et al. Reference Lira, Giardini, Siqueira-Neto, Conte and Cano2007). Aliquots corresponding to 1% and 5–10% of the total number of cells used in each experiment (input) were tested separately. Control assays included mock experiments and experiments done with rabbit pre-immune serum. The amount of immunoprecipitated DNA was calculated according to the protocol of Lira et al. (Reference Lira, Giardini, Siqueira-Neto, Conte and Cano2007).
Immunoprecipitation assays (IP)
Nuclear extracts from 1 × 10⁹ log phase promastigotes treated with phleomycin (40 μg mL−1) for 1, 3 and 6 h and from non-treated controls were used for the immunoprecipitation (IP) assays, in conjunction with ∼200 μg of mouse anti-LaRPA-1 serum. The IP assays were done using Pierce® Crosslink immunoprecipitation kit according to the manufacturer's instructions. At the end of the assay, one-tenth of each eluate was fractionated in 10–12% SDS-PAGE followed by Western blot probed with the appropriate antisera and pre-immune serum as the control. Extracts from non-treated parasites were also immunoprecipitated and used as controls. The specificity of mouse anti-LaRPA-1 serum for IP assays is shown in Supplementary Fig. S4, online version only.
Indirect immunofluorescence (IIF) and indirect immunofluorescence combined with fluorescence in situ hybridization (FISH-IIF)
The IIFs were done using previously described protocols (Siqueira-Neto et al. Reference Siqueira-Neto, Lira, Giardini, Khater, Perez, Peroni, dos Reis, Freitas-Junior, Ramos and Cano2007; da Silva et al. Reference da Silva, Perez, da Silveira, de Moraes, Siqueira-Neto, Freitas-Jr and Cano2010) with minor modifications. First, 106 promastigotes were washed in 1× PBS and fixed in 1% formaldehyde for 5 min at 4 °C. After permeabilization with 0·1% Triton X-100 for 10 min at room temperature, the cells were incubated with 0·1 M glycine. Specific proteins were detected by incubating the cells with the appropriate immune serum followed by washing 3 times with 1× PBS and incubation with goat anti-rabbit or anti-mouse IgG labelled with Alexa Fluor 488 or 555 (Invitrogen). The parasites were then attached to glass coverslips coated with 0·1% poly-L-lysine (Sigma). FISH was done using log phase L. amazonensis promastigotes and a telomere PNA FISH/FITC kit (Dako Cytomation), according to manufacturer´s instructions. For IIF, the cells were washed in 1× PBS and fixed in 1% formaldehyde for 5 min at 4 °C. After permeabilization with 0·1% Triton X-100 for 10 min at room temperature, the cells were incubated with specific antibodies followed by incubation with goat anti-rabbit IgG coupled to Alexa Fluor 488 or 555 as the secondary antibody. Vectashield® mounting medium with DAPI (Vector Labs) was used to stain nuclear and kinetoplast DNA for simple IIF and for the FISH-IIF assays. Images were analysed with a Nikon 80i fluorescence microscope and captured with a digital camera (Nikon). When necessary, images were superimposed using NIS elements software (v. Ar 3.10).
RESULTS
LaRPA-1 lacks the RPA1N domain involved with the binding to checkpoint proteins
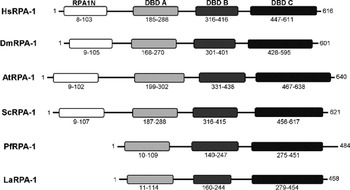
We have previously shown that LaRPA-1 is co-purified with LaRbp38 and DNA polymerase alpha in telomerase-positive extracts (Fernandez et al. Reference Fernandez, Castellari, Conte, Gozzo, Sabino, Pinheiro, Novello, Eberlin and Cano2004). In addition, it co-immunoprecipitates telomeric DNA in vivo and co-localizes with telomeric DNA (Siqueira-Neto et al. Reference Siqueira-Neto, Lira, Giardini, Khater, Perez, Peroni, dos Reis, Freitas-Junior, Ramos and Cano2007). But contrary to RPA-1 from other eukaryotes, LaRPA-1 has a truncated RFA-1 structural domain and it binds single-stranded DNA using a single but canonical oligonucleotide-oligosaccharide fold (OB fold) localized at its N-terminus (Fig. 1) (Siqueira-Neto et al. Reference Siqueira-Neto, Lira, Giardini, Khater, Perez, Peroni, dos Reis, Freitas-Junior, Ramos and Cano2007). Here we performed a domain search with the Conserved Domains database (CDD) (http://www.ncbi.nlm.nih.gov/Structure/cdd/wrpsb.cgi), in order to verify whether LaRPA-1 contains some of the conserved domains shared by other RPA-1. As shown in Fig. 1 and in Siqueira-Neto et al. (Reference Siqueira-Neto, Lira, Giardini, Khater, Perez, Peroni, dos Reis, Freitas-Junior, Ramos and Cano2007), LaRPA-1 and its counterparts from other protozoa (e.g. Plasmodium falciparum) share low sequence identities with other RPA-1 (18·2–32%) although it preserves the 3 putative and structurally conserved DNA-binding domains (DBD A–C) or OB fold domains (Fig. 1). In addition, RPA-1 from Leishmania spp. and from other trypanosomatids lacks the N-terminal RPA1N domain (Fig. 1 and Brown et al. Reference Brown, Melendy and Ray1992; Siqueira-Neto et al. Reference Siqueira-Neto, Lira, Giardini, Khater, Perez, Peroni, dos Reis, Freitas-Junior, Ramos and Cano2007) responsible for interaction with multiple checkpoint proteins, including ATRIP, RAD9 and MRE11. In humans, disruption of these interactions causes hypersensitivity to both DNA damage and replication stress (Xu et al. 2008).
LaRPA-1 lacks the N-terminal RPA1N domain. A diagram showing the localization of RPA1N, DBD-A, DBD-B and DBD-C structural domains in different RPA-1, based on CD database analysis. Numbers correspond to the position of the amino acid residues flanking each domain. Note that PfRPA-1 and LaRPA-1 lack the N-terminal RAPA1N domain. Homo sapiens (HsRPA-1, GenBank Accession no. AAH18126), Drosophila melanogaster (DmRPA-1, GenBank Accession no. AAF54206), Arabidopsis thaliana (AtRPA-1, GenBank Accession no. AT2g06510), Saccharomyces cerevisiae (ScRPA-1, GenBank Accession no. CAA42420), Plasmodium falciparum (PfRPA-1, GenBank Accession no. CAD51733), Leishmania amazonensis (LaRPA-1, GenBank Accession no. AAR84278).

DNA damage induced by phleomycin elicited a G1/S cell cycle arrest in L. amazonensis promastigotes
It is known that in Saccharomyces cerevisiae, 50 μg mL−1 of phleomycin for 60–120 min induces a checkpoint response that is controlled by the ATM-related TEL1 protein (Nakada et al. Reference Nakada, Shimomura, Matsumoto and Sugimoto2003) and that in most eukaryotes DNA DSBs (Moore, Reference Moore1988; Povirk et al. Reference Povirk, Han and Steighner1989) are repaired by homologous recombination (HR) (Belenguer et al. Reference Belenguer, Oustrin, Tiraby and Ducommun1995; Sugiyama and Kowalczykowski, Reference Sugiyama and Kowalczykowski2002; Stauffer and Chazin, Reference Stauffer and Chazin2004). Leishmania major promastigotes exposed to 10 μg mL−1 of phleomycin for 24–48 h also showed a damage response with detectable levels of the RAD51, a protein that commonly participates in damage repair by HR. In addition, during phleomycin treatment parasites stopped growing, suggesting that the drug induced a possible cell cycle arrest (McKean et al. Reference McKean, Keen, Smith and Benson2001). It is worth noting though that 10 μg mL−1 is the drug concentration routinely used to select against non-transformed L. major promastigote cultures in genetic transfection experiments and is also the amount of drug able to kill the whole population of parasites in 3–4 days (Freedman and Beverley, Reference Freedman and Beverley1993).
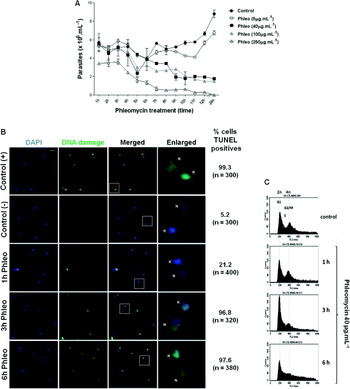
Thus, in order to verify the amount of drug that would elicit a damage response in promastigotes of L. amazonensis, we first tried to determine the IC50 of phleomycin, using the classic MTT (tetrazolium component) cell proliferation assay by incubating parasite cultures with a variety of drug concentrations 5–100 μg mL−1) for a short period of time (0–12 h and 24 h). Unfortunately we did not succeed because the drug absorbs light in the same wavelength (570 nm) as the insoluble formazan produced during the reduction of MTT by the mitochondria of viable cells (data not shown). Thus, growth curves were done of L. amazonensis promastigotes grown in different concentrations of the drug (5, 40, 100 and 250 μg mL−1). Figure 2A shows that compared with the non-treated controls, incubation with 40–100 μg mL−1 of phleomycin for up to 24 h reduced the number of parasites by 50–75% and no increase in parasite numbers was detected during the 24 h time-course, suggesting that at these concentrations the drug induced a growth arrest. In contrast, incubation with 250 μg mL−1 of phleomycin for up to 11 h was able to kill the whole population of parasites. In this experiment, the control curves represent the growth of parasites not treated with the drug. In addition, and because up to 100 μg mL−1 of phleomycin failed to kill 100% of the parasites in culture (Fig. 2A), the influence of the drug on L. amazonensis viability was examined by using a modification of the trypan blue exclusion test (Paland et al. Reference Paland, Kamer, Kogan-Sakin, Madar, Goldfinger and Rotter2009). As shown in the graph in Supplementary Fig. S1A (online version only), compared with the non-treated control, exposure of parasites to about 10–500 μg mL−1 of phleomycin for up to 6 h resulted in a parasite mortality of 0–100%, respectively. Since ∼50% of the parasites in the culture were viable in concentrations around 10–100 μg mL−1 it was speculated that the DNA damage induced by the drug was probably rapidly repaired. Thus, we decided to perform most of the experiments shown here with 40 μg mL−1 of phleomycin and within 0–6 h of incubation.
Phleomycin induces DSBs and G1/S cell cycle arrest in Leishmania amazonensis promastigotes. (A) L. amazonensis wild-type promastigotes were exposed to different concentrations of phleomycin (5 (○), 40 (▪), 100 (▲), 250 μg mL−1 (Δ)) and cell density was monitored for 0–12 h and 12 h later (24 h). Parasites not treated with the drug were used as growth control (●). Error bars indicate SD of the mean of triplicates. (B) DNA damage was investigated in phleomycin-treated (Phleo-40 μg mL−1) or untreated cells (Control (-)) and analysed at 1, 3 and 6 h of drug exposure. DSBs on DNA (green) were detected by TUNEL assay. DNase I treatment was used as DNA damage positive control. DAPI (blue) was used to stain the nucleus (N) and kinetoplast (K). Scale bar represents 2 μm. (C) Histograms show the relative propidium iodide fluorescence, which is directly proportional to DNA content plotted against the number of events per channel (number of cells). Phleomycin-treated (40 μg mL−1) parasites (Phleo) were examined at various intervals up to 6 h. Each histogram represents data collected from 20 000 events per sample. The positions of G1 (2n), S and G2/M (4n) indicated in the panels were determined using CELLFit software (Becton Dickinson).

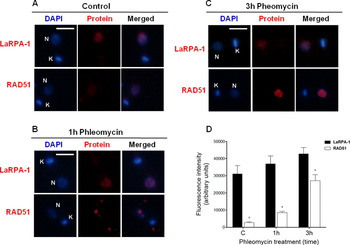
It was first examined whether parasite death was caused by phleomycin-induced DNA fragmentation. As shown by TUNEL-positive assay, after exposing parasites to 40 μg mL−1 for up to 6 h around 96·8% of the examined cells presented fragmented DNA in the nucleus and in the kinetoplast (Fig. 2B and Supplementary Fig. S1B, online version only). We also checked whether 40 μg mL−1 phleomycin caused cell cycle arrest in L. amazonensis promastigotes. Figure 2C shows that exposure to phleomycin for 1–6 h caused accumulation of cells in G1 and loss of signal for S and G2/M cells, perhaps suggesting a delay in G1/S transition compared with the non-treated control. This resulted in a cell cycle arrest that persisted for up to 12 h (data not shown) and is signalled by the formation of nuclear foci containing LaRPA-1. The recombinase RAD51, a key component of the HR repair machinery, was also involved in this global response to phleomycin treatment (Fig. 3A–D). Indirect immunofluorescence (IIF) assays were done with non-synchronized parasites treated with phleomycin (40 μg mL−1) for 1 and 3 h, as well as with non-treated controls. Images were obtained in duplicate from cells with positive signals for both proteins and from different fields for each experiment. LaRPA-1 is commonly detected in the nucleus of proliferating cells, and after 1 h to 3 h of exposure to phleomycin, although the protein seems to reorganize in foci, we did not observe statically significant alterations in its fluorescence intensity (Fig. 3A–D). RAD51 was also detected in control parasites, but the staining was more diffuse and widespread than in phleomycin-treated parasites (Fig. 3A), which after 1 h of drug exposure, showed RAD51 distributed in a few nuclear foci (Fig. 3B) followed by a higher nuclear accumulation after 3 h of drug exposure (Fig. 3C).
Possible involvement of LaRPA-1 and RAD51 in the DNA DSBs response. In (A–C), LaRPA-1 and RAD51 proteins were detected by IIF (red) in parasites treated with phleomycin (40 μg mL−1) for 1 h and 3 h. Non-treated parasites were used as control. IIFs were performed using anti-LaRPA-1 and anti-human RAD51 sera. DNA in the nucleus (N) and kinetoplast (K) was stained with DAPI and bar represents 2 μm. (D) Quantitative analysis of each protein based on the fluorescence intensity was assessed using NIS elements software. Images of cells (n = 50) in duplicated experiments for each time-point were analysed. Error bars indicate s.d. of the mean of duplicates. (*) Indicates P < 0·001 calculated using two-way ANOVA, Bonferroni post-test (GraphPad Prism).

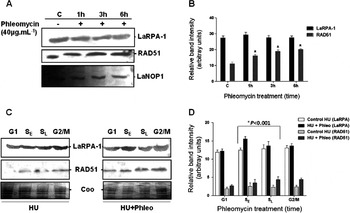
Western blots of nuclear extracts from non-synchronized parasites treated with phleomycin (40 μg mL−1) indicated that after treatment no significant alterations in the amount of LaRPA-1 were detected (Fig. 4A–B). In contrast, there was a significant (P < 0·001) increase in the levels of RAD51, which was gradual and time dependent (Fig. 4A–B), probably reflecting the role of RAD51 in the repair of DNA DSBs.
DNA damage induced alterations in the expression levels of RAD51 in non-synchronized parasites and of LaRPA-1 and RAD51 in HU-synchronized parasites. (A) Western blot of nuclear extracts from 107 parasites/lane treated with phleomycin (40 μg mL−1) for 1, 3 and 6 h compared with non-treated controls (c). Membranes were probed with anti-LaRPA-1 (top) and anti-RAD51 (middle) sera. LaNOP-1 was used as the loading control (bottom). The graphs shown in (B) and (D) are the quantitative analyses of the Western blot assays in (A) and (C), respectively using ImageJ software (1·43u). Error bars indicate s.d. of the mean of duplicates. In (B) *P < 0·001 was calculated for RAD51 results obtained from phleomycin-treated and the non-treated control, using two-way ANOVA, Bonferronni post-test (GraphPad Prism). (C) Western blot of nuclear extracts from: Left, HU-synchronized parasites (HU); Right, HU-synchronized parasites treated with phleomycin (40 μg mL−1) (HU + Phleo). G1, SE, SL and G2/M indicate the cell cycle phases according to the CellFIT cell cycle analysis program. Membranes were probed with anti-LaRPA-1 (top) and anti-RAD51 (middle) sera. Coomassie (Coo) panels show loading control (bottom). In (D) *P < 0·001 was calculated between data of phleomycin treated in early (SE) and late S (SL) phases and the non-treated control, using two-way ANOVA, Bonferroni post-test (GraphPad Prism).

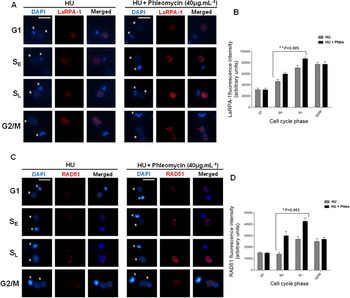
To determine whether the changes in protein location and accumulation could be followed during the parasite's cell cycle, cultures were synchronized with HU prior to treatment with phleomycin (Supplementary Fig. S2B, online version only). Figure 4C shows that phleomycin elicited discrete alterations in LaRPA-1 and RAD51 expression, principally at S phase, but induced a marked and significant (P < 0·001) accumulation of both proteins in early (SE) and late S (SL) phase of HU-treated cells after 1 and 3 h, respectively (Fig. 5A–D); these findings partially confirmed those of Figs 3A–D and 4A–B.
Damage-induced accumulation of LaRPA-1 and RAD51 in S phase. In (A) and (B), changes in the levels of LaRPA-1 and RAD51 during Leishmania amazonensis cell cycle was assessed by IIF. The parasites were synchronized with HU and treated with phleomycin (40 μg mL−1) after which the cells were incubated with anti-LaRPA-1 (A) or anti-human RAD51 (B) sera. DNA in the nucleus (N) and kinetoplast (K) was stained with DAPI. Scale bar represents 2 μm. In (B) and (D), graphs represent the quantitative analysis of the results shown in (A) and (C). The fluorescence intensity of each protein was determined using NIS elements software. Images of cells (n = 50) at each cell cycle phase (G1, S and G2/M) were analysed, including the 2 different time-points in S phase: 1 h (SE) and 3 h (SL). Error bars indicate s.d. of the mean of duplicates. (*) Indicates P < 0·001 and (**) indicates P < 0·005 between data of phleomycin-treated and non-treated control in SE and SL, both calculated using two-way ANOVA, Bonferroni post-test (GraphPad Prism).

We were also able to demonstrate that synchronization of the cultures with HU did not induce detectable levels of damaged DNA as shown by the TUNEL assay (Supplementary Fig. S2A, online version only). Thus, this indicates that the alterations detected in protein expression and accumulation were indeed a response to the DNA damage induced by phleomycin. Together, these results suggest that LaRPA-1 and RAD51 participate in the global response of L. amazonensis to DNA DSBs.
DNA damage induced a gradual increase in the levels of RAD51 and in the amount of RAD51 associated with LaRPA-1
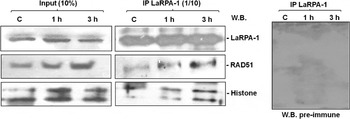
Immunoprecipitation assays were used to determine whether LaRPA-1 and RAD51 interact in cells with damaged DNA (Fig. 6). Mouse anti-LaRPA-1 serum was used to immunoprecipitate nuclear extracts from control parasites and from parasites treated with phleomycin (40 μg mL−1). Immunoglobulin-free immunoprecipitates (1/10 of column eluates) and 10% of the column input were fractionated in 10% SDS-PAGE and analysed by Western blot with rabbit antisera raised against LaRPA-1 and RAD51; as the loading control we used an anti-histone H2A serum that recognized the highly conserved core of the Leishmania protein (see Materials and Methods section for details). This analysis showed that in control cells LaRPA-1 was part of the same complex containing RAD51 and histone H2A and that upon damage, the levels of RAD51 in the extracts as the amount of RAD51 associated with LaRPA-1 gradually increased (Fig. 6, right). This result suggests that LaRPA-1 and RAD51 work in the same damage response pathway. Their association is probably necessary to signal and repair both phleomycin-induced DSBs and naturally occurring lesions, because LaRPA-1 and RAD51 immunoprecipitate even in extracts of parasites not exposed to chemical damage. Figure 6, left, shows input representing 10% of extracts loaded to the IP columns. Immunoprecipitates probed with rabbit pre-immune serum showed no positive interaction.
Changes in LaRPA-1 protein forming-complexes upon damage. LaRPA-1 and RAD51 protein levels were assessed in Western blots of nuclear extracts from parasites treated with phleomycin (Phleo-40 μg mL−1) for 1 and 3 h and non-treated controls (c). Extract samples were used in immunoprecipitation assays with mouse antiserum raised against LaRPA-1. One-tenth of each immunoprecipitate (IP, right) pool was analysed by Western blots probed with rabbit antisera raised against LaRPA-1, human RAD51 and human histone H2A. Input (left) represents 10% of extracts loaded to the IP columns. Rabbit pre-immune serum was used as control.

LaRPA-1 is rapidly recruited to telomeres upon DNA damage
As with bulk DNA, telomeric DNA needs to be repaired. Base excision repair, nucleotide excision repair and mismatch repair are presumably used to maintain the TTAGGG repeats. However, some forms of repair may have disastrous outcomes for telomeres. For example, non-homologous end-joining (NHEJ) of 2 telomeres creates a circular or dicentric chromosome. Homologous recombination (HR) between telomeres could result in aberrant telomere length, and recombination of a telomere with an interstitial telomeric sequence could lead to deletions, inversions and translocations (de Lange, Reference de Lange2005). But fully functional telomeres do not elicit a DNA-damage response that is sufficient to stop cell proliferation (Khadaroo et al. Reference Khadaroo, Teixeira, Luciano, Ecker-Boulet, Germann, Simon, Gallina, Abadallah, Gilson, Geli and Lisby2009) and this also appears to be the case in L. amazonensis promastigotes (Fig. 7A–B).
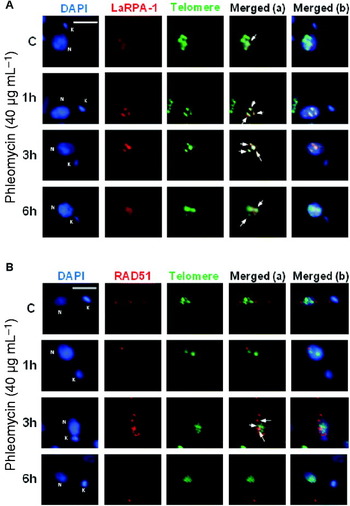
LaRPA-1 is involved in the telomere response to damage. IIF of promastigote forms using (A) anti-LaRPA-1 (red) and (B) anti-RAD51 (red) serum were combined with FISH using a PNA-telomere probe (green). DAPI (blue) was used to stain DNA in the kinetoplast (K) and nucleus (N). Merged (a) combined images from IIF (red) and FISH (green) and merged (b) combined all images. These figures contain representative images showing the co-localization of LaRPA-1 and RAD51 with telomeric clusters in phleomycin-treated (for 1 h, 3 h and 6 h) and non-treated parasites (C, control). Scale bar represents 2 μm.

To understand how LaRPA-1 and RAD51 participate in the response to DNA-induced damage at telomeres, an IIF assay was developed using anti-LaRPA-1 and anti-RAD51 sera combined with FISH using a PNA-telomere probe (Siqueira-Neto et al. Reference Siqueira-Neto, Lira, Giardini, Khater, Perez, Peroni, dos Reis, Freitas-Junior, Ramos and Cano2007; Dossin et al. Reference Dossin, Dufour, Dusch, Siqueira-Neto, Moraes, Yang, Cano, Genovesio and Freitas-Junior2008). For this assay we captured a set of 10–12 overlaid images in duplicate and observed co-localization in almost every case. As shown in Fig. 7A, the amount of LaRPA-1 that co-localized with telomeric clusters was greater after 1–3 h of drug treatment than in the controls and in parasites exposed to phleomycin for 6 h. This finding suggests that LaRPA-1 is rapidly recruited to telomeres upon DNA damage. In contrast, only a few foci containing RAD51 apparently co-localized with telomeric clusters after 3 h of drug treatment (Fig. 7B) were detected. This result also indicates that in these experimental conditions most telomeres are covered by LaRPA-1, which probably protects these structures from a local DNA damage response. In addition, it is presumed that only a few telomeres showed a mild response in which RAD51 might have displaced part of LaRPA-1 from the single-stranded DNA.
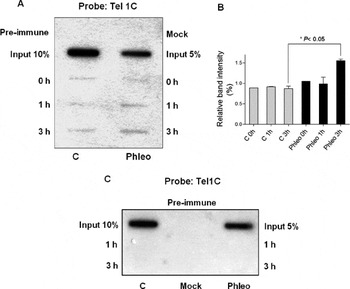
To confirm these findings, chromatin-immunoprecipitation assays were performed with samples from control and phleomycin-treated parasites (Fig. 8A–C). As shown in Fig. 8A, in control parasites the amount of G-rich telomeric DNA that co-immunoprecipitated with anti-LaRPA-1 relative to the input DNA was around ∼0·9–1·0% in all samples (0, 1 h and 3 h). This is in agreement with previous results from our laboratory (Siqueira-Neto et al. Reference Siqueira-Neto, Lira, Giardini, Khater, Perez, Peroni, dos Reis, Freitas-Junior, Ramos and Cano2007). In contrast, in phleomycin-treated parasites the amount of telomeric DNA that was immunoprecipitated by anti-LaRPA-1 (relative to the input DNA) in 3 h of treatment, increased to ∼1·5% compared with the controls. No telomeric DNA was immunoprecipitated with pre-immune serum or in mock experiments (Fig. 8A and C). In addition, anti-LaRPA-1 serum did not immunoprecipitate kDNA in control and drug-treated samples (Supplementary Fig. S3, online version only).
More LaRPA-1 is recruited to telomeres upon DNA damage. (A) Chromatin immunoprecipitation (ChIP) of DNA from asynchronous log phase promastigotes treated with phleomycin (40 μg mL−1) and from non-treated controls (c) were immunoprecipitated with anti-LaRPA-1 or pre-immune serum. (B) The graph represents quantitative analysis of the immunoprecipitated telomeric DNA using ImageJ software (1·43u). Error bars indicate s.d. of the mean of duplicates. (*) Indicates P < 0·05 calculated using two-way ANOVA, Bonferroni post-test (GraphPad Prism). (C) The same ChIP assay shown in (A) was done with samples immunoprecipitated with anti-RAD51 or pre-immune serum. In (A) and (B), slot-blots were hybridized with 5′ end-labelled Tel1C [(CCCTAA)3] probe. Control reactions were done without serum (mock). Total DNA (input) corresponded to 5 and 10% of the DNA cross-linked to chromatin in 0·8 × 108 cells.

Contrary to anti-LaRPA-1, anti-RAD51 serum was not able to immunoprecipitate telomeric DNA in control or in phleomycin-treated parasites (Fig. 8B, samples from 1 and 3 h respectively) (Fig. 8B), suggesting that the apparent co-localization of RAD51 with parasite telomeres using FISH-IIF (Fig. 7B) was not due to its interaction with telomeric LaRPA-1. Thus, the presumed contribution of RAD51 to telomere damage response in Leishmania needs more investigation.
These findings suggest that LaRPA-1 and RAD51 work together in response to DNA DSBs, and at telomeres, upon damage, LaRPA-1 works probably to prevent loss of single-stranded DNA and to assume a capping function.
DISCUSSION
The presence of DNA DSBs in a dividing cell is detected by cell-cycle surveillance mechanisms also known as checkpoint mechanisms. The occurrence of such breaks leads to the arrest of cell division at one of several points, although the level of damage that can be tolerated by different cell types varies markedly (Featherstone and Jackson, Reference Featherstone and Jackson1999). Single DSBs in the core of T. brucei chromosomes have been shown to trigger a robust DNA damage response and efficient repair via homologous recombination with allelic templates (Glover et al. Reference Glover, McCulloch and Horn2008). It also induces the action of a γH2A homologue, one of the earliest markers of DNA damage in eukaryotes (Glover and Horn, Reference Glover and Horn2012).
The results described here suggest that, in L. amazonensis, DNA DSBs also triggered repair by activating the HR repair machinery that involves global and local actions of RPA-1 and RAD51. In other eukaryotes, DSBs repair initiates with long 3′-single-stranded DNA overhangs that are rapidly coated by RPA that acts as a sensor that binds with high affinity to single-stranded DNA. This protein:DNA complex recruits the recombinases RAD52 and RAD51 that interact with RPA to form an additional complex that displaces RPA from single-stranded DNA to effectively initiate repair (Golub et al. Reference Golub, Gupta, Haaf, Wold and Radding1998; Stauffer and Chazin, Reference Stauffer and Chazin2004; Lisby et al. Reference Lisby, Teixeira, Gilson and Geli2010). In T. brucei, RAD51 has a role in homologous recombination during antigenic variation (McCulloch and Barry, Reference McCulloch and Barry1999), a T. cruzi Rad51 has also been characterized (Regis-da-Silva et al. Reference Regis-da-Silva, Freitas, Passos-Silva, Furtado, Augusto-Pinto, Pereira, DaRocha, Franco, Macedo, Hoffmann, Cazaux, Pena, Teixeira and Machado2006) and shown to participate in HR repair of DSB induced by gamma-irradiation. The L. major and L. infantum RAD51 homologues are highly conserved, with activities similar to RAD51 from other eukaryotes (McKean et al. Reference McKean, Keen, Smith and Benson2001; Genois et al. Reference Genois, Mukherjee, Ubeda, Buisson, Paquet, Roy, Plourde, Coulombe, Ouellette and Masson2012). In contrast, the Leishmania spp. genome contains no homologues of RAD52 (data not shown) raising questions about the existence of a factor, other than RAD52, that recruits RAD51 to the RPA-bound single-stranded DNA complex. Also, whether in these protozoa this action can be performed directly by RAD51 without the help of another factor. Both of these hypotheses deserve investigation, although very recently, Genois et al. (Reference Genois, Mukherjee, Ubeda, Buisson, Paquet, Roy, Plourde, Coulombe, Ouellette and Masson2012) showed that the L. infantum BRCA2 homologue should be this missing candidate factor, as its interaction with RAD51 promotes homologous recombination at the genetic and biochemical level.
The concentration of phleomycin (40 μg mL−1) used here caused DNA DSBs in L. amazonensis, after a short time (1–3 h) of drug exposure, as revealed by TUNEL positive assay. This amount of drug is about 4 times higher than the concentration that induced a damage response in L. major promastigotes after 24–48 h of treatment (∼10 μg mL−1) (McKean et al. Reference McKean, Keen, Smith and Benson2001). Here we show that LaRPA-1 and RAD51 participates in the response to DNA damage induced by phleomycin in the nucleus, but DSBs were also clearly detected in the kDNA, although no co-localization of LaRPA-1 or RAD51 with kDNA could be found. In nuclear-damaged DNA, LaRPA-1 probably binds the exposed single-stranded DNA ends in DSBs and in the telomeric strands. Cell cycle arrest in the G1/S phase was also indicative of drug-induced DNA damage. Thus, if phleomycin-induced damage elicits a strong checkpoint in L. amazonensis, than the conserved HR repair mechanism would be expected to initially recruit RPA to protect single-stranded DNA and then RAD51 to repair the damage (Gasior et al. Reference Gasior, Olivares, Ear, Hari, Weichselbaum and Bishop2001). The results described here confirmed this hypothesis since, in non-synchronized cells, although not statistically significant, damage slightly increased LaRPA-1 fluorescence and induced foci formation, which was accompanied by a gradual accumulation of RAD51. An increase in the levels of RAD51 in nuclear extracts of asynchronous and the significant alterations in the levels of LaRPA-1 and RAD51 in the S phase of HU-synchronized cells, in addition to nuclear accumulation of both proteins in the S phase, agree with the roles of these proteins in, respectively, signalling and damage repair. In vivo, more LaRPA-1 associated earlier with telomeres indicating a role for this protein in protecting (capping) parasite chromosome ends. Nevertheless, RAD51 was not immunoprecipitated with telomeric DNA, suggesting that the presence of LaRPA-1 was enough to protect telomeres and to avoid a gross local DNA damage response. Apart from its role in damage response and repair, in other eukaryotes, RAD51 is normally required for telomere maintenance and t-loop formation (Tarsounas et al. Reference Tarsounas, Munoz, Claas, Smiraldo, Pittman, Blasco and West2004; Verdun and Karlseder, Reference Verdun and Karlseder2006).
Although LaRPA-1 formed complexes with RAD51, with these proteins probably acting synergistically in response to damage, we cannot exclude the possibility that DNA damage led to a rapid global genomic response and to the formation of foci as a consequence of mild telomere dysfunction. Such telomere dysfunction is likely to be rapidly repaired since most of the parasites exposed to 40 μg mL−1 of phleomycin, showed no overt damage or dramatic cell cycle arrest or even death, but rather continued to grow. This finding strongly suggests that in L. amazonensis the presence of LaRPA-1 may prevent the loss of single-stranded telomeric DNA and induces the recruitment of other unknown factors that help to protect the chromosome ends.
The functions played by RPA70 in DNA metabolism have been extensively studied in model organisms (Deng et al. Reference Deng, Habel, Kabaleeswaran, Snell, Wold and Borgstahl2007; Grudic et al. Reference Grudic, Jul-Larsen, Haring, Wold, Lonning, Bjerkvig and Boe2007; Haring and Wold Reference Haring and Wold2007). This is the first report showing the involvement of RPA-1 from a pathogenic protozoan (LaRPA-1) in damage response and telomere protection. Unlike its counterparts in other eukaryotes, protozoa RPA-1 is a truncated protein that lacks the RPA1N domain involved with the recruitment of checkpoint proteins such as ATR. But the natural absence of RPA1N did not impair LaRPA-1 participation in damage response. Moreover, RPA bound to single-stranded DNA is at least part of the molecular recognition element that recruits the checkpoint complexes (Xu et al. Reference Xu, Vaithiyalingam, Glick, Mordes, Chazin and Cortez2008). Thus, the results shown here demonstrate that the natural absence of RPA1N domain does not affect LaRPA-1 participation in DNA damage response, suggesting that it uses other regions/domains to do these interactions or it recruits an unknown protein partner to play this role.
In yeast, there is a notable difference in the cellular responses to telomeres and DNA DSBs. Whereas telomeres are relatively inert and stable, DNA DSBs are immediately recognized by the MRX (Mre11/Rad50/Xrs2) complex, leading to Tel1 (ATM-related kinase) activation. A cascade of events occurs when resected 3′ G-overhangs are coated by RPA, which in turn recruits Mec1 and checkpoint complexes, as well as RAD52 and RAD51 recombinases and downstream factors (Lisby et al. Reference Lisby, Teixeira, Gilson and Geli2010). However, uncapped telomeres produced by one of the following: telomerase depletion, a pause in the replication fork or senescence, are recognized as DSBs. In a recent study using single cell analysis and chromatin immunoprecipitation, it was shown that the loss of telomerase is accompanied by an ordered recruitment of the nuclease Mre11, the telomere-end binding protein Cdc13, RPA, the ATRIP-like Ddc2 checkpoint protein and the recombination protein RAD52 (Khadaroo et al. Reference Khadaroo, Teixeira, Luciano, Ecker-Boulet, Germann, Simon, Gallina, Abadallah, Gilson, Geli and Lisby2009). The accidental collapse of a replication fork at a telomere and the subsequent early telomere damage response could also lead to the exposure of single-stranded DNA that would be recognized by Cdc13 and RPA, thereby recruiting telomerase to repair telomeres. In this case, only in the absence of telomerase would the recruitment of RAD52 serve as an alternative pathway to repair telomeres.
Kalocsay et al. (Reference Kalocsay, Hiller and Jentsch2009) showed that the persistence of DSBs can lead to DNA damage at the nuclear periphery in a process requiring RAD51 and histone variant H2AZ. Although we did not detect damage to L. amazonensis DNA at the nuclear periphery, our results showed that LaRPA-1 can also form complexes with RAD51 and histone H2A (non-phosphorylated histone H2A) when parasites are treated with phleomycin. This finding suggests that these proteins can act together in response to DSBs.
The results described here indicate that phleomycin caused parasite cell-cycle arrest that altered the expression of RAD51 and the input of LaRPA-1, a possible DNA damage sensor and telomere protector (Siqueira-Neto et al. Reference Siqueira-Neto, Lira, Giardini, Khater, Perez, Peroni, dos Reis, Freitas-Junior, Ramos and Cano2007). Addressing how LaRPA-1 and RAD51 can initiate different outcomes, depending on where the ‘break’ is on the chromosome, will be challenging.
Our findings also suggest that in L. amazonensis LaRPA-1 is required for DNA damage signalling even lacking the RPA1N domain, and that this function may be directly related to its single-stranded DNA binding activity. The observation that more LaRPA-1 was recruited to telomeric DNA and that most of the parasites survived DNA damage suggests that the presence of this protein may be sufficient to prevent overt DNA damage to telomeres. Although the precise molecular mechanisms that govern this phenomenon in Leishmania spp. remain unknown, we speculate that LaRPA-1 exerts a new capping function that prevents a gross response at parasite telomeres. This information is particularly important to direct future research and will help advance our understanding of conserved, as well as Leishmania-specific properties of telomere maintenance.
ACKNOWLEDGEMENTS
The authors thank E. Ledvinka Filho for help in estimating the IC50 of phleomycin, M. A. Golim for help with the cell sorting analysis, colleagues in Dr Cano's laboratory for helpful discussions during this work, and Dr S. Hyslop for revising the English and critical reading of the manuscript.
FINANCIAL SUPPORT
This work was supported by Fundação de Amparo a Pesquisa do Estado de São Paulo, FAPESP (grant no. 09/53336–0) and Conselho Nacional de Pesquisa, CNPq (grant no. 474425/2010-0). R.C.V.S. was supported by a doctoral fellowship from CNPq (Brazil) and M.S.S., A.M.P. and V.S.N. were supported by doctoral and post-doctoral fellowships from FAPESP (Brazil).