1. INTRODUCTION
Transfer alignment has become one of the most important navigation technologies for the application of Inertial Navigation Systems (INS), such as the missions in terms of guiding weapons, flexure estimation of ships, initial alignment for carrier-borne aircraft, etc. (Kain and Cloutier, Reference Kain and Cloutier1989; Wang et al., Reference Wang, Xiao, Xia and Fu2013; Wei and Gao, Reference Wei and Gao2012). For the integration system consisting of a Slave INS (SINS) and a Main INS (MINS), rapid transfer alignment was originally proposed to shorten the alignment time and reduce the requirement for vehicle manoeuvring (Kain and Cloutier, Reference Kain and Cloutier1989). Since the alignment performance directly affects the speed of response and follow-on navigation accuracy of an INS, accuracy evaluation is an important issue for rapid transfer alignment. In general, the measure indicators, such as the alignment precision and time to become stable, are evaluated based on the benchmark information in terms of misalignment angles, which are time-variant due to the existence of vibration and vehicle flexure. However, the complete information of misalignment angles during the alignment process cannot be measured directly in real-time. Thus, an offline smoothing approach is necessary (Yang et al., Reference Yang, Wang and Yang2014). For accuracy evaluation, all sampling points should be estimated during the alignment process. Hence, the fixed-interval smoother is the most appropriate approach to address such problems (Simon, Reference Simon2006; Liu et al., Reference Liu, Nassar and El-Sheimy2010; Gong and Qin, Reference Gong and Qin2014).
It is often hoped that the SINS will be aligned with small initial errors, and the linear Kalman Filter (KF)-based smoother can then be used to address the smoothing issue appropriately (Yang et al., Reference Yang, Wang and Yang2014). However, the SINS could be aligned without a coarse alignment procedure in some urgent situations (Wei and Gao, Reference Wei and Gao2012). Consequently, the nonlinearity of the error model will increase significantly, and it is necessary to consider the nonlinear character of the accuracy evaluation issue (Särkkä, Reference Särkkä2013). In addition, the single-model-based fixed-interval smoothing approaches assume that the observations provided by MINS are perfectly known during the alignment process, which is not necessarily true in practice. For instance, the existence of random data transmission delay and unpredictable vehicle vibration will easily affect the observations (Lim and Lyou, Reference Lim and Lyou2001; Pehlivanoǧlu and Ercan, Reference Pehlivanoǧlu and Ercan2013). In other words, the statistics of the observation noise may be time-variant, and the estimation accuracy of the single-model-dependent smoother will be degraded.
For the smoothing problem with the coexistence of nonlinearity and the uncertainty of observation noise, the Interacting Multiple Model (IMM) smoother has been proven to be an effective approach (Blom and Bar-Shalom, Reference Blom and Bar-Shalom1988). There are two types of IMM smoother: the Rauch-Tung-Striebel (RTS) type and the two-filter-type. The structure of the IMM-RTS Smoother (IMM-RTSS) is more like the standard IMM filter, which means that it is easily realised. In contrast, the IMM Two-Filter-Smoother (IMM-TFS) utilises the observations more effectively, and has better performance for solving nonlinear smoothing problems (Malleswaran et al., Reference Malleswaran, Vaidehi, Irwin and Robin2013). Hence, IMM-TFS is used in this paper due to its advantages. The Extended Kalman Filter (EKF)-based IMM-TFS has been proposed for solving nonlinear target tracking problems (Helmick et al., Reference Helmick, Blair, Hoffman and Hoffman1995; Mazor et al., Reference Mazor, Averbuch, Bar-Shalom and Dayan1998). However, the first-order Taylor series expansion neglects the high-order error terms, which further leads to poor performance for a highly nonlinear system (Simon, Reference Simon2006). To avoid this, the Unscented Kalman Filter (UKF)-based IMM-TFS was developed to achieve better estimation accuracy, since the Unscented Transform (UT) can approximate the posterior mean and covariance up to the third order. Nevertheless, the UKF cannot guarantee the positive definiteness of the covariance, and the accumulation of errors caused by the matrix operations may induce instability or even divergence (Brunke and Campbell, Reference Brunke and Campbell2004). The Stirling interpolation formula-based Divided Difference Filter (DDF), which was directly developed in the square root form, maintains a positive semi-definiteness of the covariance matrix (Nørgaard et al., Reference Nørgaard, Poulsen and Ravn2000). Thus, we use the DDF as the nonlinear filter module of our IMM-TFS to account for the nonlinearity.
An inherent drawback of IMM-TFS is that it needs the existence of an inverse model, which is either predefined or obtained from trivial derivations in previously published literatures (Helmick et al., Reference Helmick, Blair, Hoffman and Hoffman1995; Malleswaran et al., Reference Malleswaran, Vaidehi, Irwin and Robin2013). This restriction limits the application of IMM-TFS in practice. A promising forward-backward sigma-point Kalman smoother was developed to avoid the inverse model restriction by means of the Weighted Statistical Linearization Regression (WSLR) method, and the resulting linearization parameters are more accurate than that of the first-order linearization method in statistical sense (Paul and Wan, Reference Paul and Wan2008; Gong et al., Reference Gong, Zhang and Fang2015). However, this approach is only available for the single-model-based smoothing problem, and few published literatures have suggested the combination of the IMM-TFS and the WSLR method.
In this paper, a DDF-based IMM-TFS is proposed to address the accuracy evaluation problem of rapid transfer alignment. The WSLR method is performed in a Forward-time IMM Filter (FIF) to form the pseudo-linear system model for a Backward-time IMM Filter (BIF). The simulations show that this new smoother can achieve better estimation accuracy compared with previously reported approaches, and has a high efficiency for detecting the changes in a model.
This paper is organised in six sections. In Section 2, the DDF with WSLR is introduced. The DDF-based IMM-TFS approach is presented in Section 3. In Section 4, the nonlinear model of rapid transfer alignment with large misalignment angles is described. In Section 5, an accuracy evaluation approach using the DDF-based IMM-TFS is implemented. The performance of the proposed smoother is verified by simulation tests, and compared with the EKF-based IMM-TFS, DDF-based TFS and DDF-based IMM-RTSS in terms of estimation accuracy. The paper is concluded in Section 6.
2. DDF WITH WSLR
In this section, the DDF with WSLR is discussed. The linearization parameters are obtained during the prediction and filtering steps of the DDF, and they lay the groundwork for the backward-time IMM filter. Here, we mainly discuss the second-order DDF since it has a better estimation performance than the first-order version (Nørgaard et al., Reference Nørgaard, Poulsen and Ravn2000).
Consider a nonlinear discrete-time system model:
 $$\left\{\matrix{{\bi x}_k ={\bi f}({\bi x}_{k-1}, {\bf \omega}_{k-1})\cr {\bi z}_k ={\bi g}({\bi x}_k, {\bi v}_k)}\right.$$
where xk is the state vector;  ${\bf \omega}_{k-1}$ is the process noise with covariance
 ${\bi Q}_{{\bf \omega}_{k-1}}$, zk is the observation vector, vk is the observation noise with covariance
 ${\bi R}_{v_{k}}$ and
 ${\bi f}(\cdot)$ and
 ${\bi g}(\cdot)$ stand for the process model and observation model, respectively.
The WSLR aims to obtain the linearized model of Equation (1) by using the weighted statistically linearized approach, which can be described as (Paul and Wan, Reference Paul and Wan2008):
 $$\left\{\matrix{{\bi x}_k ={\bi A}_{f,k-1} {\bi x}_{k-1} +{\bi b}_{f,k-1} +{\bi G}_{f,k-1} {\bf \omega}_{k-1} +{\bi G}_{f,k-1} {\bf \varepsilon}_{f,k-1}\cr {\bi z}_k ={\bi A}_{g,k} {\bi x}_k +{\bi b}_{g,k} +{\bi G}_{g,k} {\bi v}_k +{\bi G}_{g,k} {\bf \varepsilon}_{g,k}}\right.$$
where Af,k-1, Ag,k, bf,k-1, and bg,k are the statistical linearization parameters. Gf,k-1 and Gg,k denote the noise distribution matrix of the process model and observation model, respectively.  ${\bf \varepsilon}_{f,k-1}$ and
 ${\bf \varepsilon}_{g,k}$ are the linearization error terms of the process model and observation model with covariance
 ${\bi P}_{\varepsilon,f,k-1}$ and
 ${\bi P}_{\varepsilon,g,k}$, respectively. Note, the linearization error covariance is increasing with the higher degree of nonlinearity and the uncertainty region of the state.
The second-order DDF with WSLR can be summarised as follows.
2.1. Initialisation
The initial state vector is defined as x0. The filtered covariance, process noise covariance, observation noise covariance and their corresponding square root decompositions are defined as:
 $${\bi P}_{k-1\vert k-1} ={\bi S}_{xx,k-1\vert k-1} ({\bi S}_{xx,k-1\vert k-1})^T, \quad {\bi Q}_{{\bf \omega}_{k-1}} ={\bi S}_{{\bf \omega}_{k-1}} ({\bi S}_{{\bf \omega}_{k-1}})^T, \quad {\bi R}_{v_k} ={\bi S}_{v_k} ({\bi S}_{v_k})^T$$
2.2. Prediction step
For the prediction step, the predicted mean is given by:
 $$\eqalign{\hat{\bi x}_{k\vert k-1}&={h^2-n_x -n_\omega \over h^2}{\bi f}\lpar \hat{\bi x}_{k-1\vert k-1} \rpar + {1 \over 2h^2}\sum\limits_{p=1}^{n_x} \lsqb {\bi f}\lpar \hat{\bi x}_{k-1\vert k-1} +h{\bi s}_{x,p} \rpar +{\bi f}\lpar \hat{\bi x}_{k-1\vert k-1} -h{\bi s}_{x,p}\rpar \rsqb \cr &\quad + {1 \over 2h^2}\sum\limits_{p=1}^{n_\omega} \lsqb {\bi f}\lpar \hat{\bi x}_{k-1\vert k-1}, \bar{{\bf \omega}}_{k-1} +h{\bi s}_{\omega,p}\rpar +{\bi f}\lpar \hat{\bi x}_{k-1\vert k-1}, \bar{{\bf \omega}}_{k-1} -h{\bi s}_{\omega,p}\rpar \rsqb }$$
where h is the selection of interval length, and  $h=\sqrt{3}$ when the estimation errors are assumed to be Gaussian. n x and n ω stand for the dimension of state and process noise, respectively,
 $\bar{{\bf \omega}}_{k-1}$ is the mean of process noise and sx,p and sω,p denote the p-th columns of matrix
 ${\bi S}_{xx,k-1\vert k-1}$ and
 ${\bi S}^{{\bf \omega}_{k-1}}$, respectively. Then, the updated square root of the predicted covariance is obtained as follows:
 $$\bar{{\bi S}}_{xx,k\vert k-1} =H\left\{\left[\matrix{ {\bi S}_{x\hat{x},k\vert k-1}^{(1)} &{\bi S}_{x\omega ,k\vert k-1}^{(1)} &{\bi S}_{x\hat{x},k\vert k-1}^{(2)} &{\bi S}_{x\omega ,k\vert k-1}^{(2)}}\right]\right\}$$
where H{·} is a Householder transformation of the argument matrix. The four matrices related to  $\bar{{\bi S}}_{xx,k\vert k-1} $ are omitted, and they can be found in previously reported literature (Nørgaard et al., Reference Nørgaard, Poulsen and Ravn2000).
The weighted statistical linearization parameters of the process model are given by:
 $${\bi A}_{f,k-1} ={\bi S}_{x\hat{x},k\vert k-1}^{(1)} \lpar {\bi S}_{xx,k-1\vert k-1}\rpar ^{-1}$$
 $${\bi b}_{f,k-1} =\hat{\bi x}_{k\vert k-1} -{\bi A}_{f,k-1} \hat{\bi x}_{k-1\vert k-1}$$
 $${\bi P}_{\varepsilon ,f,k-1} =\bar{{\bi S}}_{xx,k\vert k-1} \lpar \bar{{\bi S}}_{xx,k\vert k-1}\rpar ^T-{\bi S}_{x\hat{x},k\vert k-1}^{(1)} \lpar {\bi S}_{x\hat{x},k\vert k-1}^{(1)}\rpar ^T$$
 $${\bi G}_{f,k-1} =\left. {\partial {\bi f}\lpar {\bi x}_{k-1},{\bf \omega}_{k-1}\rpar \over {\bf \omega}_{k-1}} \right\vert_{{\bi x}_k =\hat{\bi x}_{k-1\vert k-1} ,{\bf \omega}_{k-1} =\bar{{\bf \omega}}_{k-1}}$$
2.3. Filtering step
The predicted observation and square root of its covariance are calculated as:
 $$\eqalign{\hat{{\bi z}}_{k\vert k-1} &={h^2-n_x -n_v \over h^2}{\bi g}\lpar \hat{\bi x}_{k\vert k-1} \rpar + {1 \over 2h^2}\sum\limits_{p=1}^{n_x } \lsqb {\bi g}\lpar \hat{\bi x}_{k\vert k-1} +h\bar{{\bi s}}_{x,p}\rpar +{\bi g}\lpar \hat{\bi x}_{k\vert k-1} -h\bar{{\bi s}}_{x,p}\rpar \rsqb \cr &\quad + {1 \over 2h^2}\sum\limits_{p=1}^{n_v} \lsqb {\bi g}\lpar \hat{\bi x}_{k\vert k-1} ,\bar{{\bi v}}_k +h{\bi s}_{v,p}\rpar +{\bi g}\lpar \hat{\bi x}_{k\vert k-1} ,\bar{{\bi v}}_k -h{\bi s}_{v,p} \rpar \rsqb }$$
 $$\eqalign{{\bi S}_{zz,k\vert k-1} &=H\left\{\left[\matrix{ {\bi S}_{z\hat{x},k\vert k-1}^{(1)} &{\bi S}_{zv,k\vert k-1}^{(1)} &{\bi S}_{z\hat{x},k\vert k-1}^{(2)} &{\bi S}_{zv,k\vert k-1}^{(2)}}\right]\right\}}$$
where n v is the dimension of the observation noise,  $\bar{{\bi s}}_{x,p} $ and
 ${\bi s}_{v,p} $ are the p-th columns of
 $\bar{{\bi S}}_{xx,k\vert k-1} $ and
 ${\bi S}_{v_{k}}$, respectively and
 $\bar{{\bi v}}_{k} $ is the mean of observation noise. For brevity, the four matrices related to
 ${\bi S}_{zz,k\vert k-1} $ are omitted, they can be found in previously reported literature (Nørgaard et al., Reference Nørgaard, Poulsen and Ravn2000).
Now, we can obtain the gain matrix, filtered mean of state and updated square root of its covariance as follows:
 $${\bi K}_{k\vert k} =\bar{{\bi S}}_{xx,k\vert k-1} \lpar {\bi S}_{z\hat{x},k\vert k-1}^{(1)}\rpar ^T\lsqb {\bi S}_{zz,k\vert k-1} \lpar {\bi S}_{zz,k\vert k-1}\rpar^T\rsqb ^{-1}$$
 $$\hat{\bi x}_{k\vert k} =\hat{\bi x}_{k\vert k-1} +{\bi K}_{k\vert k} \lpar {\bi z}_k -\hat{{\bi z}}_{k\vert k-1}\rpar $$
 $${\bi S}_{xx,k\vert k} =H\left\{\left[\matrix{ \bar{{\bi S}}_{xx,k\vert k-1} -{\bi K}_{k\vert k} {\bi S}_{z\hat{x},k\vert k-1}^{(1)} &{\bi K}_{k\vert k} {\bi S}_{zv,k\vert k-1}^{(1)} &{\bi K}_{k\vert k} {\bi S}_{z\hat{x},k\vert k-1}^{(2)} &{\bi K}_{k\vert k} {\bi S}_{zv,k\vert k-1}^{(2)}}\right]\right\}$$
The weighted statistical linearization parameters of the observation model are given by:
 $${\bi A}_{g,k} ={\bi S}_{z\hat{x},k\vert k-1}^{(1)} \lpar \bar{{\bi S}}_{xx,k\vert k-1}\rpar ^T\lsqb \bar{{\bi S}}_{xx,k\vert k-1} \lpar \bar{{\bi S}}_{xx,k\vert k-1} \rpar^T\rsqb ^{-1}$$
 $${\bi b}_{g,k} =\hat{{\bi z}}_{k\vert k-1} -{\bi A}_{g,k} \hat{\bi x}_{k\vert k-1}$$
 $${\bi P}_{\varepsilon ,g,k} ={\bi S}_{zz,k\vert k-1} \lpar {\bi S}_{zz,k\vert k-1}\rpar ^T-{\bi S}_{z\hat{x},k\vert k-1}^{(1)} \lpar \bar{{\bi S}}_{xx,k\vert k-1}\rpar ^T\lpar {\bi A}_{g,k} \rpar ^T$$
 $${\bi G}_{g,k} =\left. {\partial {\bi g}\lpar {\bi x}_k ,{\bi v}_k \rpar \over {\bi v}_k} \right\vert_{{\bi x}_k =\hat{\bi x}_{k\vert k-1} ,{\bi v}_k =\bar{{\bi v}}_k}$$
The resulting linearization parameters can be used for the backward-time KF to estimate the states for the statistically linearized state-space model in Equation (2). The backward-time KF is formulated using the linearization error vectors of the forward-time filter state, which is different from the standard KF. The smoothing accuracy is improved since the WSLR method fully considers the linearization errors of the nonlinear model. For brevity, we only present the DDF with WSLR in terms of the forward-time filter in this section. The conclusions can be directly applied to the multiple-model situation.
3. DDF-BASED IMM-TFS
3.1. Forward-time IMM Filter
In this subsection, we review the forward-time IMM filtering algorithm briefly, and the notations defined in this subsection will be used extensively in the derivations of the backward-time IMM filter and two-filter-type IMM smoother.
Consider a nonlinear discrete-time system with multiple models:
 $$\left\{\matrix{{\bi x}_k ={\bi f}_{k-1}^{m_k^i} \lpar {\bi x}_{k-1} ,{\bf \omega}_{k-1}^{m_k^i}\rpar \cr {\bi z}_k ={\bi g}_k^{m_k^i} \lpar {\bi x}_k ,{\bi v}_k^{m_k^i}\rpar }\right.$$
where  ${\bi f}_{k-1}^{m_{k}^{i}} (\cdot)$ and
 ${\bi g}_{k}^{m_{k}^{i}} (\cdot)$ are the process model and observation model matched to
 $m_{k}^{i}$, xk is the state vector and
 ${\bi z}_{k} $ is the observation vector. The process noise
 ${\bf \omega}_{k-1}^{m_{k}^{i}}$ and observation noise
 ${\bi v}_{k}^{m_{k}^{i}}$ are subject to Gaussian distributions. The system is assumed to switch among a known model set following the Markov process with a transition probability matrix
 ${\bi P}_{pro} =[p_{k\vert k-1}^{\,f,\,ji}]_{n\times n}$, where n denotes the number of known models;
 $p_{k\vert k-1}^{\,f,\,ji} =p(m_{k}^{i} \vert m_{k-1}^{\,j})$ are the transition probabilities with
 $i,j=1,2,\ldots ,n$.
In the forward-time filter, the estimates of xk can be inferred from the density  $p({\bi x}_{k}\vert {\bi Z}_{1:k})$, where Z1:k denotes the observation sequence from time step 1 to k. This density can be written as a mixture of Gaussian densities by using the total probability theorem. That is:
 $$p\lpar {\bi x}_k \vert {\bi Z}_{1:k}\rpar =\sum\nolimits_{j=1}^{\,n} \mu_{k\vert k}^{\,f,\,j} p\lpar {\bi z}_k \vert {\bi x}_k,m_k^{\,j} ,{\bi Z}_{1:k-1}\rpar p\lpar {\bi x}_k \vert m_k^{\,j} ,{\bi Z}_{1:k-1}\rpar \left/\vphantom{\sum\nolimits_{j=1}^{\,n}}\right.\!c$$
where  $\mu_{k\vert k}^{\,f,\,j} =p(m_{k}^{\,j} \vert {\bi Z}_{1:k})$ is the filtered model probability of FIF,
 $p({\bi z}_{k} \vert {\bi x}_{k},m_{k}^{\,j} ,{\bi Z}_{1:k-1})$ is model-conditioned likelihood,
 $c=p({\bi z}_{k} \vert m_{k}^{\,j} ,{\bi Z}_{1:k-1})$ is a constant value and
 $p({\bi x}_{k} \vert m_{k}^{\,j},{\bi Z}_{1:k-1})$ is the model-conditioned density given the past observations.
The Gaussian mixture expression of density  $p({\bi x}_{k} \vert m_{k}^{\,j} ,{\bi Z}_{1:k-1})$ can be obtained by using the total probability theorem, that is:
 $$p\lpar {\bi x}_k \vert m_k^{\,j} ,{\bi Z}_{1:k-1} \rpar =\sum\nolimits_{i=1}^{\,n} \mu_{k-1\vert k-1}^{\,f,i\vert j} p\lpar {\bi x}_k \vert m_{k-1}^i ,m_k^{\,j} ,{\bi Z}_{1:k-1}\rpar $$
where  $\mu_{k-1\vert k-1}^{\,f,i\vert j} =(p_{k\vert k-1}^{\,f,ij} \mu_{k-1\vert k-1}^{\,f,i}) /(\sum\nolimits_{i=1}^{\,n} p_{k\vert k-1}^{\,f,ij} \mu_{k-1\vert k-1}^{\,f,i})$ is the conditional model probability for switching from model
 $m_{k}^{\,j}$ to model
 $m_{k-1}^{i} $,
 $\mu_{k-1\vert k-1}^{\,f,i} =p(m_{k-1}^{i} \vert {\bi Z}_{1:k-1})$ is the filtered model probability matched to
 $m_{k-1}^{i}$ and
 $p_{k\vert k-1}^{\,f,ij}$ is obtained from the known matrix Ppro.
 $p({\bi x}_{k} \vert m_{k-1}^{i} ,m_{k}^{\,j} ,{\bi Z}_{1:k-1})$ is the filtered density of the state matched to models
 $m_{k}^{\,j} $ and
 $m_{k-1}^{i} $ and Z1:k-1 can be approximated by the set of model-conditioned estimates, that is,
 $\{\hat{\bi x}_{k-1\vert k-1}^{\,f,r} ,{\bi P}_{k-1\vert k-1}^{\,f,r}\}_{r=1}^{\,n} $.
 $\hat{\bi x}_{k-1\vert k-1}^{\,f,r} $ denotes the estimates of FIF matched to
 $m_{k-1}^{r} $ with covariance
 ${\bi P}_{k\vert k}^{\,f,\,j} $. This can also be written as:
 $$p\lpar {\bi x}_k \vert m_{k-1}^i ,m_k^{\,j} ,{\bi Z}_{1:k-1} \rpar =p\lpar {\bi x}_k \vert m_k^{\,j} ,\hat{\bi x}_{k-1\vert k-1}^{\,f,i} ,{\bi P}_{k-1\vert k-1}^{\,f,i}\rpar $$
Now, the density  $p({\bi x}_{k} \vert m_{k}^{\,j},{\bi Z}_{1:k-1})$ can be rewritten as:
 $$p\lpar {\bi x}_k \vert m_k^{\,j} ,{\bi Z}_{1:k-1} \rpar =\sum\nolimits_{i=1}^{\,n} \mu_{k-1\vert k-1}^{\,f,i\vert j} p\lpar {\bi x}_k \vert m_k^{\,j} ,\hat{\bi x}_{k-1\vert k-1}^{\,f,i} ,{\bi P}_{k-1\vert k-1}^{\,f,i}\rpar $$
The forward-time filtered model probability in Equation (20) can be expressed as:
 $$\mu_{k\vert k}^{\,f,\,j} =\lsqb \Lambda_{k\vert k}^{\,f,\,j} p\lpar m_k^{\,j} \vert {\bi Z}_{1:k-1} \rpar \rsqb \left/\vphantom{\sum\nolimits_{j=1}^{\,n}}\right.\left[\sum\nolimits_{j=1}^{\,n} \Lambda_{k\vert k}^{\,f,\,j} p\lpar m_k^{\,j} \vert {\bi Z}_{1:k-1}\rpar \right]$$
where  $\Lambda_{k\vert k}^{\,f,\,j} = N({\bi z}_{k} ;\hat{{\bi z}}_{k\vert k-1}^{\,j} ,{\bi P}_{zz,k\vert k-1}^{\,j})$ is the likelihood of the forward-time filter matched to
 $m_{k}^{\,j} $,
 $p(m_{k}^{\,j} \vert {\bi Z}_{1:k-1})=\sum\nolimits_{i=1}^{\,n} p_{k\vert k-1}^{\,f,ij} \mu_{k-1\vert k-1}^{\,f,i}$ is the model-conditioned density given the past observations and
 $\hat{{\bi z}}_{k\vert k-1}^{\,j} $ denotes the predicted observation matched to
 $m_{k}^{\,j} $ with covariance
 ${\bi P}_{zz,k\vert k-1}^{\,j}$.
The forward-time IMM filtering algorithm can be summarised as follows.
1) Initialisation: The beginning time step is k=1. for n models, the initial forward-time estimations and probabilities are set to  $\hat{\bi x}_{0\vert 0}^{\,f,i} ={\bf 0}_{n_{x} \times 1} $,
 ${\bi P}_{0\vert 0}^{\,f,i} =0_{n_{x} \times n_{x} } $ and
 $\mu_{0\vert 0}^{\,f,i} =1/n$, respectively, where i=1, 2, …, n.
2) Calculation of conditional model probabilities:
 $$\mu_{k-1\vert k-1}^{\,f,i\vert j} =\lpar p_{k\vert k-1}^{\,f,ij} \mu_{k-1\vert k-1}^{\,f,i} \rpar \left/\vphantom{\sum\nolimits_{j=1}^{\,n}}\right.\!\left(\sum\nolimits_{i=1}^{\,n} p_{k\vert k-1}^{\,f,ij} \mu_{k-1\vert k-1}^{\,f,i} \right), \quad i,j=1,2,\ldots ,n$$
3) Mixing:
 $$\hat{\bi x}_{k-1\vert k-1}^{\,f,0j} =\sum\nolimits_{i=1}^{\,n} \mu_{k-1\vert k-1}^{\,f,i\vert j} \hat{\bi x}_{k-1\vert k-1}^{\,f,i}$$
 $${\bi P}_{k-1\vert k-1}^{\,f,0j} =\sum\nolimits_{i=1}^{\,n} \mu_{k-1\vert k-1}^{\,f,i\vert j} \lsqb {\bi P}_{k-1\vert k-1}^{\,f,i} +\lpar \hat{\bi x}_{k-1\vert k-1}^{\,f,i} -\hat{\bi x}_{k-1\vert k-1}^{\,f,0j}\rpar \lpar \hat{\bi x}_{k-1\vert k-1}^{\,f,i} -\hat{\bi x}_{k-1\vert k-1}^{\,f,0j}\rpar^T\rsqb $$
where j=1, 2, …, n;  $\hat{\bi x}_{k-1\vert k-1}^{\,f,0j} $ and
 ${\bi P}_{k-1\vert k-1}^{\,f,0j} $ are the mixed mean and covariance matched to
 $m_{k-1}^{\,j} $, respectively.
4) Model-matched prediction and filtering: For model  $m_{k}^{\,j} $, the prediction step and filtering step can be expressed as:
 $$\lsqb \hat{\bi x}_{k\vert k-1}^{\,f,\,j} ,{\bi P}_{k\vert k-1}^{\,f,\,j} ,{\bi A}_{f,k-1}^{\,j} ,{\bi b}_{f,k-1}^{\,j} ,{\bi P}_{\varepsilon ,f,k-1}^{\,j} \rsqb =DDF_p \lpar \hat{\bi x}_{k-1\vert k-1}^{\,f,0j} ,{\bi P}_{k-1\vert k-1}^{\,f,0j} ,{\bi f}_{k-1}^{\,j} \lpar \cdot \rpar ,{\bi Q}_{\omega_{k-1} }^{\,j} \rpar $$
 $$\lsqb \hat{\bi x}_{k\vert k}^{\,f,\,j},{\bi P}_{k\vert k}^{\,f,\,j} ,{\bi A}_{g,k}^{\,j} ,{\bi b}_{g,k}^{\,j} ,{\bi P}_{\varepsilon ,g,k}^{\,j} \rsqb =DDF_u \lpar \hat{\bi x}_{k\vert k-1}^{\,f,\,j} ,{\bi P}_{k\vert k-1}^{\,f,\,j} ,{\bi z}_k,{\bi g}_k^{\,j} \lpar \cdot\rpar ,{\bi R}_{v_k }^{\,j} \rpar $$
where j=1, 2, …, n; the notations  $DDF_{p} (\cdot)$ and
 $DDF_{u} (\cdot )$ denote the prediction step (see Equations (3)–(9)) and filtering step (see Equations (10)–(18)) of DDF with WSLR;
 $\hat{\bi x}_{k\vert k-1}^{\,f,\,j} $ and
 ${\bi P}_{k\vert k-1}^{\,f,\,j} $ are the predicted estimates;
 $\hat{\bi x}_{k\vert k}^{\,f,\,j} $ and
 ${\bi P}_{k\vert k}^{\,f,\,j} $ stand for the filtered estimates. Note that the predicted and filtered covariance matrices can be easily obtained from their corresponding square root decompositions (Nørgaard et al., Reference Nørgaard, Poulsen and Ravn2000). The model likelihood functions are given by:
 $$\Lambda_{k\vert k}^{\,f,\,j} =N\lpar {\bi z}_k ;\hat{{\bi z}}_{k\vert k-1}^{\,j} ,{\bi P}_{zz,k\vert k-1}^{\,j}\rpar , \quad j=1,2,\ldots ,n$$
where  $\hat{{\bi z}}_{k\vert k-1}^{\,j} $ and
 ${\bi P}_{k\vert k-1}^{\,j} $ are the predicted observation and its covariance, respectively.
5) Model probabilities update:
 $$\mu_{k\vert k}^{\,f,\,j} =\left(\Lambda_{k\vert k}^{\,f,\,j} \sum\nolimits_{i=1}^{\,n} p_{k\vert k-1}^{\,f,\,ji} \mu_{k-1\vert k-1}^{\,f,i} \right) \left/\vphantom{\sum\nolimits_{j=1}^{\,n}}\right.\!\left(\sum\nolimits_{j=1}^{\,n} \Lambda_{k\vert k}^{\,f,\,j} \sum\nolimits_{i=1}^{\,n} p_{k\vert k-1}^{\,f,\,ji} \mu_{k-1\vert k-1}^{\,f,i}\right), \quad j=1,2,\ldots ,n$$
Note, the linearization parameters of each estimation period are restored during the forward-time IMM filter (see Equations (28) and (29)), and they can further be used to form the pseudo-linear model of the nonlinear model for BIF.
3.2. Backward-time IMM filter
In this subsection, the Backward-time IMM Filter (BIF) is briefly introduced (Helmick et al, Reference Helmick, Blair, Hoffman and Hoffman1995). The estimates of BIF can be inferred from the density  $p({\bi x}_{k} \vert {\bi Z}_{k:N})$, which can be written as:
 $$p\lpar {\bi x}_k \vert {\bi Z}_{k:N}\rpar =\sum\nolimits_{j=1}^{\,n} \mu_{k\vert k}^{b,j} p\lpar {\bi x}_k \vert m_k^{\,j} ,{\bi Z}_{k:N} \rpar $$
where  $\mu_{k\vert k}^{b,j} = p(m_{k}^{\,j} \vert {\bi Z}_{k:N})$ is the filtered model probability of BIF matched to
 $m_{k}^{\,j} $.
 $p({\bi x}_{k} \vert m_{k}^{\,j} ,{\bi Z}_{k:N})$ denotes the density of BIF matched to
 $m_{k}^{\,j} $, which can be written as:
 $$p\lpar {\bi x}_k \vert m_k^{\,j} ,{\bi Z}_{k:N} \rpar =p\lpar {\bi z}_k \vert {\bi x}_k ,m_k^{\,j} ,{\bi Z}_{k+1:N} \rpar p\lpar {\bi x}_k \vert m_k^{\,j} ,{\bi Z}_{k+1:N}\rpar /c_1$$
where  $p({\bi z}_{k} \vert {\bi x}_{k},m_{k}^{\,j} ,{\bi Z}_{k+1:N})$ is the model-conditioned likelihood,
 $p( {\bi x}_{k} \vert m_{k}^{\,j} ,{\bi Z}_{k+1:N})$ represents the model-conditioned density of the state for BIF given the future observation sequence and
 $c_{1} = p({\bi z}_{k} \vert m_{k}^{\,j} ,{\bi Z}_{k+1:N} )$ is a constant value. Again, by using the total probability theorem, the density
 $p({\bi x}_{k} \vert m_{k}^{\,j} ,{\bi Z}_{k+1:N})$ can be expressed as:
 $$p\lpar {\bi x}_k \vert m_k^{\,j} ,{\bi Z}_{k+1:N} \rpar =\sum\nolimits_{i=1}^{\,n} \mu_{k+1\vert k+1}^{b,i\vert j} p\lpar {\bi x}_k \vert m_k^{\,j} ,m_{k+1}^i ,{\bi Z}_{k+1:N} \rpar $$
where  $\mu_{k+1\vert k+1}^{b,i\vert j} = (p_{k\vert k+1}^{b,ij} \mu_{k+1\vert k+1}^{b,i})/(\sum\nolimits_{i=1}^{\,n} p_{k\vert k+1}^{b,ij} \mu_{k+1\vert k+1}^{b,i})$ is the conditional model probability of BIF for switching from model
 $m_{k}^{\,j} $ to model
 $m_{k+1}^{i} $,
 $p_{k\vert k+1}^{b,ij} = [p_{k+1\vert kji}^{\,f,\,ji} p(m_{k}^{\,j})]/c_{2}$ denotes the backward transition probability, which still obeys the Markov property, and
 $c_{2} =\sum\nolimits_{j=1}^{\,n} p_{k+1\vert k}^{\,f,\,ji} p(m_{k}^{\,j})$.
 $p(m_{k}^{\,j})=\sum\nolimits_{i=1}^{\,n} p_{k\vert k-1}^{\,f,ij} p(m_{k-1}^{i})$ is the prior model probability. The calculation of prior model probabilities for BIF is only in terms of the forward-time transition probabilities, which means that these densities can be calculated offline.
The density  $p({\bi x}_{k} \vert m_{k}^{\,j} ,m_{k+1}^{i} ,{\bi Z}_{k+1:N})$ is the filtered density of the state for BIF matched to the models
 $m_{k}^{\,j} $ and
 $m_{k+1}^{i} $ given the future observations, and Zk+1:N can be approximated by the set of one-step predicted estimates of BIF, i.e.,
 $\{\hat{\bi x}_{k\vert k+1}^{b,r} ,{\bi P}_{k\vert k+1}^{b,r}\}_{r=1}^{\,n} $.
 $\hat{\bi x}_{k\vert k+1}^{b,r} $ denotes the predicted estimates of BIF matched to
 $m_{k+1}^{r} $ with covariance
 ${\bi P}_{k\vert k+1}^{b,r} $. In other words:
 $$p\lpar {\bi x}_k \vert m_k^{\,j} ,m_{k+1}^i ,{\bi Z}_{k+1:N} \rpar =p\lpar {\bi x}_k \vert m_k^{\,j} ,\hat{\bi x}_{k+1\vert k+1}^{b,i} ,{\bi P}_{k+1\vert k+1}^{b,i} \rpar $$
Thus, Equation (34) can be rewritten as a Gaussian mixture expression, that is:
 $$p\lpar {\bi x}_k \vert m_k^{\,j} ,{\bi Z}_{k+1:N} \rpar =\sum\nolimits_{i=1}^{\,n} \mu_{k+1\vert k+1}^{b,i\vert j} p\lpar {\bi x}_k \vert m_k^{\,j} ,\hat{\bi x}_{k+1\vert k+1}^{b,i} ,{\bi P}_{k+1\vert k+1}^{b,i}\rpar $$
The updated backward-time model probability  $\mu_{k\vert k}^{b,j} $ in Equation (32) is:
 $$\mu_{k\vert k}^{b,j} = \Lambda_{k\vert k}^{b,j} p\lpar m_k^{\,j} \vert {\bi Z}_{k+1:N}\rpar / c_3$$
where  $\Lambda_{k\vert k}^{b,j} = p({\bi z}_{k} \vert m_{k}^{\,j} ,{\bi Z}_{k+1:N})$ is the model likelihood matched to
 $m_{k}^{\,j}$ given the future observations,
 $c_{3} = \sum\nolimits_{j=1}^{\,n} \Lambda_{k\vert k}^{b,j} p(m_{k}^{\,j} \vert {\bi Z}_{k+1:N})$ is a constant value and
 $p(m_{k}^{\,j} \vert {\bi Z}_{k+1:N})$ denotes the model probability matched to
 $m_{k}^{\,j}$ given the future observations, which can be written as:
 $$p\lpar m_k^{\,j} \vert {\bi Z}_{k+1:N}\rpar =\sum\nolimits_{i=1}^{\,n} p_{k\vert k+1}^{b,ij} p\lpar m_{k+1}^i \vert {\bi Z}_{k+1:N}\rpar $$
where  $p(m_{k+1}^{i} \vert {\bi Z}_{k+1:N})$ is the filtered model probability of BIF matched to
 $m_{k+1}^{i}$.
The backward-time IMM filtering algorithm can be summarised as follows:
1) Initialisation: The beginning time step is k=N. for n models, the initial backward-time filtered estimations and probabilities are set to  $\hat{\bi x}_{N\vert N}^{b,i} =\hat{\bi x}_{N\vert N}^{\,f,i} $,
 ${\bi P}_{N\vert N}^{b,i} ={\bi P}_{N\vert N}^{\,f,i} $ and
 $\mu_{N\vert N}^{b,i} =1/n$, respectively, where i=1, 2, …, n. Note, the initial backward-time filtered probabilities guarantee the total uncertainty of the single model at the beginning of BIF.
2) Calculation of backward-time model transition probabilities:
 $$\matrix{p(m_k^{\,j})=\sum\nolimits_{i=1}^{\,n} p_{k+1\vert k}^{\,f,\,ji} p(m_{k-1}^i), \quad j=1,2,\ldots ,n \cr p_{k\vert k+1}^{b,ij} = \lsqb p_{k+1\vert k}^{\,f,\,ji} p\lpar m_k^{\,j}\rpar \rsqb \left/\vphantom{\sum\nolimits_{j=1}^{\,n}}\right.\!\left[ \sum\nolimits_{j=1}^{\,n} p_{k+1\vert k}^{\,f,\,ji} p\lpar m_k^{\,j}\rpar \right], \quad i,j=1,2,\ldots ,n}$$
3) Calculation of conditional model probabilities:
 $$\mu_{k+1\vert k+1}^{b,i\vert j} = \lpar p_{k\vert k+1}^{b,ij} \mu_{k+1\vert k+1}^{b,i} \rpar \left/\vphantom{\sum\nolimits_{j=1}^{\,n}}\right.\!\left(\sum\nolimits_{i=1}^{\,n} p_{k\vert k+1}^{b,ij} \mu_{k+1\vert k+1}^{b,i} \right), \quad i,j=1,2,\ldots ,n$$
4) Model-matched prediction:
 $$\hat{\bi x}_{k\vert k+1}^{b,i} =\lpar {\bi A}_{f,k}^i \rpar ^{-1}\lpar \hat{\bi x}_{k+1\vert k+1}^{b,i} -{\bi b}_{f,k}^i \rpar $$
 $${\bi P}_{k\vert k+1}^{b,i} =\lpar {\bi A}_{f,k}^i \rpar ^{-1}\lsqb {\bi P}_{k+1\vert k+1}^{b,i} +{\bi G}_k^i {\bi Q}_{\omega ,k}^i \lpar {\bi G}_k^i \rpar^T+{\bi P}_{\varepsilon ,f,k}^i \rsqb \lsqb \lpar {\bi A}_{f,k}^i \rpar^{-1}\rsqb ^T$$
where i=1, 2, …, n;  $\hat{\bi x}_{k\vert k+1}^{b,i} $ and
 ${\bi P}_{k\vert k+1}^{b,i} $ are the one-step backward-time predicted mean and covariance, respectively. Note that the linearization error term and its covariance does not appear in the prediction step of the standard KF algorithm.
5) Mixing:
 $$\hat{\bi x}_{k\vert k+1}^{b,0j} =\sum\nolimits_{i=1}^{\,n} \mu_{k+1\vert k+1}^{b,i\vert j} \hat{\bi x}_{k\vert k+1}^{b,i}$$
 $${\bi P}_{k\vert k+1}^{b,0j} =\sum\nolimits_{i=1}^{\,n} \mu_{k+1\vert k+1}^{b,i\vert j} \lsqb {\bi P}_{k\vert k+1}^{b,i} +\lpar \hat{\bi x}_{k\vert k+1}^{b,i} -\hat{\bi x}_{k\vert k+1}^{b,0j}\rpar \lpar \hat{\bi x}_{k\vert k+1}^{b,i} -\hat{\bi x}_{k\vert k+1}^{b,0j} \rpar^T\rsqb $$
where j=1, 2, …, n;  $\hat{\bi x}_{k\vert k+1}^{b,0j} $ and
 ${\bi P}_{k\vert k+1}^{b,0j} $ denote the mixed model-conditioned mean and covariance, respectively.
6) Model-matched filtering:
 $${\bi K}_{k\vert k}^{b,j} ={\bi P}_{k\vert k+1}^{b,0j} \lpar {\bi A}_{g,k}^{\,j} \rpar ^T\lsqb {\bi A}_{g,k}^{\,j} {\bi P}_{k\vert k+1}^{b,0j} \lpar {\bi A}_{g,k}^{\,j} \rpar^T+{\bi R}_{v,k}^{\,j} +{\bi P}_{\varepsilon ,g,k}^{\,j}\rsqb $$
 $${\bi P}_{k\vert k}^{b,j} =\lpar {\bi I}-{\bi K}_{k\vert k}^{b,j} {\bi A}_{g,k}^{\,j} \rpar {\bi P}_{k\vert k+1}^{b,0j}$$
 $$\hat{\bi x}_{k\vert k}^{b,j} =\hat{\bi x}_{k\vert k+1}^{b,0j} +{\bi K}_{k\vert k}^{b,j} \lpar {\bi z}_k -{\bi b}_{g,k}^{\,j} -{\bi A}_{g,k}^{\,j} \hat{\bi x}_{k\vert k+1}^{b,0j}\rpar $$
where j=1, 2, …, n;  ${\bi K}_{k\vert k}^{b,j} $ is the gain matrix of BIF matched to
 $m_{k}^{\,j} $;
 $\hat{\bi x}_{k\vert k}^{b,j} $ and
 ${\bi P}_{k\vert k}^{b,j} $ are the filtered estimates of BIF matched to
 $m_{k}^{\,j} $, respectively. Again, the linearization error term and its covariance does not appear in the filtering step of the standard KF algorithm. The model likelihood functions are given by:
 $$\Lambda_{k\vert k}^{b,j} =N\lpar \tilde{{\bi z}}_{k\vert k+1}^{b,j} ;{\bf 0},{\bi S}_{k\vert k+1}^{b,j}\rpar , \quad j=1,2,\ldots ,n$$
where  $\tilde{{\bi z}}_{k\vert k+1}^{b,j} ={\bi z}_{k} -{\bi g}(\hat{\bi x}_{k\vert k+1}^{b,j})$ denote the residual with covariance
 ${\bi S}_{k\vert k+1}^{b,j}$.
7) Model probabilities update:
 $$\mu_{k\vert k}^{b,j} = \left(\Lambda_{k\vert k}^{b,j} \sum\nolimits_{i=1}^{\,n} p_{k\vert k+1}^{b,ij} \mu_{k+1\vert k+1}^{b,i} \right) / \left(\sum\nolimits_{j=1}^{\,n} \Lambda_{k\vert k}^{b,j} \sum\nolimits_{i=1}^{\,n} p_{k\vert k+1}^{b,ij} \mu_{k+1\vert k+1}^{b,i} \right)$$
where j=1, 2, …, n.
Note, the prediction step and the filtering step in the BIF are different from the backward-time filter of an EKF-based IMM-TFS. The linearization error and its covariance are used to improve the accuracy of the BIF, while the state-of-the-art backward-time filter of IMM-TFS does not take into account the linear error terms.
3.3. Two-filter-type IMM smoother
The two-filter-type IMM smoother takes into account the models over two consecutive estimation periods. The smoothing estimates can be inferred from the density  $p({\bi x}_{k} \vert {\bi Z}_{1:N})$, which is conditioned on the multiple model hypothesis. The Gaussian mixture expression of this smoothing density can be written as:
 $$p\lpar {\bi x}_k \vert {\bi Z}_{1:N}\rpar =\sum\nolimits_{j=1}^{\,n} \mu_{k\vert N}^{s,j} p\lpar {\bi x}_k \vert m_k^{\,j} ,{\bi Z}_{1:N} \rpar $$
where  $\mu_{k\vert N}^{s,j} =p(m_{k}^{\,j} \vert {\bi Z}_{1:N})$ is the smoothed model probability matched to
 $m_{k}^{\,j} $. The Gaussian mixture expression of density
 $p({\bi x}_{k} \vert m_{k}^{\,j} ,{\bi Z}_{1:N})$ can be written as:
 $$p\lpar {\bi x}_k \vert m_k^{\,j} ,{\bi Z}_{1:N} \rpar =\sum\nolimits_{i=1}^{\,n} \mu_{k+1\vert N}^{s,i\vert j} p\lpar {\bi x}_k \vert m_{k+1}^i ,m_k^{\,j} ,{\bi Z}_{1:N}\rpar $$
where  $\mu_{k+1\vert N}^{i\vert j} =(\Lambda_{k\vert k}^{s,ji} p_{k+1\vert k}^{\,f,\,ji}) / (\sum\nolimits_{i=1}^{\,n} \Lambda_{k\vert k}^{s,ji} p_{k+1\vert k}^{\,f,\,ji})$ denotes the smoothed conditional model probability and
 $\Lambda_{k\vert k}^{s,ji} =p({\bi Z}_{k+1:N} \vert m_{k+1}^{i} ,m_{k}^{\,j} ,{\bi Z}_{1:k})$ represents the smoothed likelihood matched to models
 $m_{k+1}^{i} $ and
 $m_{k}^{\,j} $. Note that Zk+1:N can be approximated by the set of model-conditioned one-step predicted estimates of BIF, that is,
 $\{\hat{\bi x}_{k\vert k+1}^{b,r} ,{\bi P}_{k\vert k+1}^{b,r}\}_{r=1}^{\,n}$. Thus, the density
 $p( {\bi x}_{k} \vert m_{k}^{\,j} ,m_{k+1}^{i} ,{\bi Z}_{1:N})$ and
 $\Lambda_{k\vert k}^{s,ji} $ can be expressed as (Helmick et al, Reference Helmick, Blair, Hoffman and Hoffman1995):
 $$p\lpar {\bi x}_k \vert m_k^{\,j} ,m_{k+1}^i ,{\bi Z}_{1:N} \rpar =N\lpar {\bi x}_k ;\hat{\bi x}_{k\vert k+1}^{b,i} ,{\bi P}_{k\vert k+1}^{b,i} \rpar N\lpar {\bi x}_k ;\hat{\bi x}_{k\vert k}^{\,f,\,j} ,{\bi P}_{k\vert k}^{\,f,\,j}\rpar \left/\vphantom{\sum\nolimits_{j=1}^{\,n}}\right.\!p\lpar {\bi Z}_{k+1:N} \vert m_k^{\,j} ,{\bi Z}_{1:k} \rpar $$
 $$\Lambda_{k\vert k}^{s,ji} =p\lpar \hat{\bi x}_{k\vert k+1}^{b,i} \vert m_{k+1}^i ,m_k^{\,j} ,\hat{\bi x}_{k\vert k}^{\,f,\,j} \rpar $$
where  $N\lpar \cdot \rpar $ represents the normal distribution function of state.
The smoothed model probability in Equation (50) can be represented as:
 $$\mu_{k\vert N}^{s,j} =p\lpar {\bi Z}_{k+1:N} \vert m_k^{\,j} ,{\bi Z}_{1:k}\rpar \mu_{k\vert k}^{\,f,\,j} / c_4$$
where  $p({\bi Z}_{k+1:N} \vert m_{k}^{\,j} ,{\bi Z}_{1:k})=\sum\nolimits_{i=1}^{\,n} \Lambda_{k\vert k}^{s,ji} p_{k+1\vert k}^{\,f,\,ji}$,
 $c_{4} =\sum\nolimits_{j=1}^{\,n} p({\bi Z}_{k+1:N} \vert m_{k}^{\,j} ,{\bi Z}_{1:k})\mu_{k\vert k}^{\,f,\,j}$.
The two-filter-type IMM smoother can be summarised as follows:
1) Initialisation: For n models, the initial smoothed estimations are set to  $\hat{\bi x}_{N\vert N}^{s,i} =\hat{\bi x}_{N\vert N}^{\,f,i}$,
 ${\bi P}_{N\vert N}^{s,i} ={\bi P}_{N\vert N}^{\,f,i} $, respectively, where i=1, 2, …, n.
2) Model-matched smoothing:
 $$\hat{\bi x}_{k\vert N}^{s,ji} ={\bi P}_{k\vert N}^{s,ji} \lsqb \lpar {\bi P}_{k\vert k}^{\,f,\,j} \rpar^{-1}\hat{\bi x}_{k\vert k}^{\,f,\,j} +\lpar {\bi P}_{k\vert k+1}^{b,i} \rpar^{-1}\hat{\bi x}_{k\vert k+1}^{b,i} \rsqb $$
 $${\bi P}_{k\vert N}^{s,ji} =\lsqb \lpar {\bi P}_{k\vert k}^{\,f,\,j} \rpar^{-1}+\lpar {\bi P}_{k\vert k+1}^{b,i}\rpar^{-1}\rsqb ^{-1}$$
where  $i,j=1,2,\ldots ,n$;
 $\hat{\bi x}_{k\vert N}^{s,ji} $ and
 ${\bi P}_{k\vert N}^{s,ji} $ are the associated mean and covariance for density
 $p({\bi x}_{k} \vert m_{k}^{\,j} ,m_{k+1}^{i} ,{\bi Z}_{1:N})$, respectively.
3) Calculation of the likelihood functions:
 $$\Lambda_{k\vert k}^{s,ji} =N\lpar \lpar \hat{\bi x}_{k\vert k+1}^{b,i} -\hat{\bi x}_{k\vert k}^{\,f,\,j}\rpar ;{\bf 0},\lpar {\bi P}_{k\vert k+1}^{b,i} +{\bi P}_{k\vert k}^{\,f,\,j}\rpar \rpar , \quad i,j=1,2,\ldots ,n$$
4) Calculation of conditional model probabilities:
 $$\mu_{k+1\vert N}^{s,i\vert j} =\lpar \Lambda_{k\vert k}^{s,ji} p_{k+1\vert k}^{\,f,\,ji} \rpar / \left(\sum\nolimits_{i=1}^{\,n} \Lambda_{k\vert k}^{s,ji} p_{k+1\vert k}^{\,f,\,ji} \right), \quad i,j=1,2,\ldots ,n$$
5) Mixing:
 $$\hat{\bi x}_{k\vert N}^{s,j} =\sum\nolimits_{i=1}^{\,n} \mu_{k+1\vert N}^{s,i\vert j} \hat{\bi x}_{k\vert N}^{s,ji}$$
 $${\bi P}_{k\vert N}^{s,j} =\sum\nolimits_{i=1}^{\,n} \mu_{k+1\vert N}^{s,i\vert j} \lsqb {\bi P}_{k\vert N}^{s,ji} +\lpar \hat{\bi x}_{k\vert N}^{s,j} -\hat{\bi x}_{k\vert N}^{s,ji}\rpar \lpar \hat{\bi x}_{k\vert N}^{s,j} -\hat{\bi x}_{k\vert N}^{s,ji} \rpar^T\rsqb $$
where j=1, 2, …, n;  $\hat{\bi x}_{k\vert N}^{s,j} $ and
 ${\bi P}_{k\vert N}^{s,j}$ are the mixed mean and covariance for the smoothing step matched to
 $m_{k}^{\,j} $, respectively.
6) Model probabilities update:
 $$\mu_{k\vert N}^{s,j} =\left(\mu_{k\vert k}^{\,f,\,j} \sum\nolimits_{i=1}^{\,n} \Lambda_{k\vert k}^{s,ji} p_{k+1\vert k}^{\,f,\,ji}\right) / \left(\sum\nolimits_{j=1}^{\,n} \mu_{k\vert k}^{\,f,\,j} \sum\nolimits_{i=1}^{\,n} \Lambda_{k\vert k}^{s,ji} p_{k+1\vert k}^{\,f,\,ji}\right)$$
where j=1, 2, …, n.
7) Estimate:
 $$\hat{\bi x}_{k\vert N}^s =\sum\nolimits_{j=1}^{\,n} \mu_{k\vert N}^{s,j} \hat{\bi x}_{k\vert N}^{s,j}$$
 $${\bi P}_{k\vert N}^s =\sum\nolimits_{j=1}^{\,n} \mu_{k\vert N}^{s,j} \lsqb {\bi P}_{k\vert N}^{s,j} +\lpar \hat{\bi x}_{k\vert N}^s -\hat{\bi x}_{k\vert N}^{s,j} \rpar \lpar \hat{\bi x}_{k\vert N}^s -\hat{\bi x}_{k\vert N}^{s,j} \rpar^T\rsqb $$
where j=1, 2, …, n,  $\hat{\bi x}_{k\vert N}^{s} $ and
 ${\bi P}_{k\vert N}^{s} $ are the smoothed mean and covariance.
The block diagram of the IMM-TFS for two models is shown in Figure 1. This diagram illustrates the principle of the FIF, the BIF and the two-filter-type IMM smoother in two consecutive estimation periods. Both the FIF and BIF algorithms consist of n filters, and the smoothing step consists of n 2 smoothers that operate in parallel. For simplicity, we define  ${\bf \mu}_{k\vert k}^{f} $ and
 ${\bf \mu}_{k\vert k}^{b} $ as the vectors consisting of the filtered model probabilities for FIF and BIF, respectively;
 ${\bf \mu}_{k-1\vert k-1}^{\,f,i\vert j} $ and
 ${\bf \mu}_{k+1\vert k+1}^{b,i\vert j} $ denote the matrices consisting of conditional model probabilities for FIF and BIF, respectively;
 ${\bf \mu}_{k+1\vert N}^{s,i\vert j} $ represents the matrix consisting of smoothed conditional model probabilities and
 ${\bf \mu}_{k\vert N}^{s} $ stands for the vector consisting of smoothed model probabilities. The statistical linearization parameters of the nonlinear system model are obtained from the FIF, and further used to form the pseudo-linear model for the BIF. In addition, this diagram demonstrates the difference of the mixing steps between the FIF and the BIF. In the FIF, the previous filtered estimates are effective at time step k−1. Thus, they can be mixed and predicted to model
 $m_{k}^{\,j} $ directly. In contrast, the previous filtered estimates of the BIF are effective at time step k+1, which implies that these estimates should be mixed after the one-step prediction step of the BIF. The smoothing step inherits the merits of the previously reported IMM-TFS approach, which allows for the merging of estimations and the mixing of different models. Consequently, the accuracy of estimation is improved.
Block diagram of the IMM-TFS for two models.

Compared with previously well-known fixed-interval smoothing approaches, the main features of the DDF-based IMM-TFS are as follows: First, this approach is applicable for solving the smoothing problem with uncertain model parameters in comparison to the single-model-based smoother. Second, the WSLR method performed in the DDF-based IMM-TFS sufficiently considers the uncertainty of the state and linearization error, whereas the first-order linearization-based inverse Jacobian in the EKF-based IMM-TFS can degrade the estimation performance or even divergence. Third, the proposed approach maintains the principle of the two-filter-type IMM smoother, which uses the estimates from both the FIF and BIF to calculate the smoothed model-conditioned estimates and smoothed model probabilities. In contrast, the recursion step of the RTS-type IMM smoother is only in terms of linearization parameters from the FIF, the structure of which is more similar to that of a standard IMM filter (Nadarajah et al., Reference Nadarajah, Tharmarasa, McDonald and Kirubarajan2012). Consequently, the proposed smoother utilises the observations more effectively, but has a larger computational burden than the RTS-type IMM smoother. Fortunately, the real-time performance is not the first consideration compared with the estimation accuracy for an offline smoothing issue.
4. NONLINEAR MODEL FOR RAPID TRANSFER ALIGNMENT
The error model for INS is the foundation of the rapid transfer alignment. For some quick-response missions, the INS could be aligned with large misalignment angles, which motivates the study of the nonlinear error model. In this section, the nonlinear model of rapid transfer alignment is reviewed briefly.
The coordinate frames used in this section are listed as follows (Kain and Cloutier, Reference Kain and Cloutier1989). The body frame of the MINS (m-frame), actual body frame of the SINS (s r-frame), calculated body frame of the SINS (s c-frame), inertial frame (i-frame), local navigation frame (n-frame) and Earth-centred Earth fixed frame (e-frame). Some notations in terms of angular velocity and attitude transformation matrix are utilised for the description of the system model for rapid transfer alignment. For convenience, the notation  ${\bi C}_{a}^{b} $ is defined as the Direction Cosine Matrix (DCM) from the a-frame to the b-frame, and
 ${\bf \omega}_{xy}^{z} $ is defined as the angular velocity of the y-frame relative to the x-frame projected in the z-frame.
4.1. Attitude error model
The attitude error model enables the nonlinear propagation of the measurable MINS/SINS coordinate frame misalignment angles as a function of the actual physical misalignment angles and the constant bias of the gyroscope. That is (Wei and Gao, Reference Wei and Gao2012):
 $$\dot{{\bf \psi}}_m ={\bf \Xi}\lsqb \lpar {\bi I}-{\bi C}_m^{s_c} {\bi C}_{s_r }^m \rpar {\bf \omega}_{ns_c }^{s_c } +{\bi C}_m^{s_c } {\bi C}_{s_r }^m {\bf \varepsilon}^{s_r}\rsqb +{\bi w}_m$$
where the matrix  ${\bf \Xi}$ is defined as:
 $${\bf \Xi}=\left[\matrix{ \cos \psi_{my} &0 &\sin \psi_{my}\cr \sin \psi_{my} \tan \psi_{mx} &1 &-\cos \psi_{my} \tan \psi_{mx}\cr -\sin \psi_{my} / \cos \psi_{mx} &0 &\cos \psi_{my} /\cos \psi_{mx}}\right]$$
and  ${\bf \psi}_{m} =[\matrix{ \psi _{mx} &\psi _{my} &\psi _{mz}}]^{T}$ is the measurable misalignment angles vector,
 ${\bi I}$ is the unit matrix with the appropriate dimension,
 ${\bf \varepsilon}^{s_{r} }$ is the constant drift of the gyroscope and
 ${\bi w}_{m} $ is the noise term of the attitude error equation. Note the corresponding state vectors related to
 ${\bi C}_{s_{r} }^{m} $ are actual physical misalignment angles, i.e.,
 ${\bf \psi}_{a} = [\matrix{ \psi _{ax} &\psi _{ay} &\psi _{az}}]^{T}$.
4.2. Velocity error model
We assume that the acceleration induced by the lever-arm effect has been compensated, and the velocity error model for rapid transfer alignment is given by (Wei and Gao, Reference Wei and Gao2012):
 $$\delta \skew6\dot{{\bi V}}^{\,n}={\bi C}_{s_c }^{\,n} \lpar {\bi I}-{\bi C}_m^{s_c } {\bi C}_{s_r }^m \rpar {\bi f}_{is_r }^{s_r } -\lpar 2{\bf \omega}_{ie}^{n\times } +{\bf \omega}_{en}^{n\times} \rpar \delta {\bi V}^{\,n}+{\bi C}_{s_r }^{\,n} \nabla^{s_r }+{\bi w}_v$$
where  $\delta {\bi V}^{\,n}$ is the velocity error term considering the lever-arm effect compensation,
 ${\bi f}_{is_{r}}^{s_{r}}$ is the specific force sensed by SINS projected in the s r-frame,
 $\nabla^{s_{r}}$ is the constant bias of the accelerometer and
 ${\bi w}_{v} $ is a noise term, which contains the acceleration caused by flexure deformation and the random error of acceleration.
4.3. Design of the nonlinear model for rapid transfer alignment
The measurable misalignment angles  ${\bf \psi}_{m}$, velocity error
 $\delta {\bi V}^{\,n}$, gyro drift
 ${\bf \varepsilon}^{s_{r}}$, accelerometer bias
 $\nabla^{s_{r}}$ and actual physical misalignment angles
 ${\bf \psi}_{a}$ are selected as the estimate state vector. We assume that both the gyro drift and accelerometer bias are constant values. The actual physical misalignment angles represent the angle errors between the m-frame and the s r-frame, and a white noise process is used to represent the disturbance acting on
 ${\bf \psi}_{a}$ (Kain and Cloutier, Reference Kain and Cloutier1989). Thus, the process model for rapid transfer alignment can be written as:
 $$\left\{\matrix{\dot{{\bf \psi}}_m ={\bf \Xi}\lsqb \lpar {\bi I}-{\bi C}_m^{s_c } {\bi C}_{s_r }^m \rpar {\bf \omega}_{ns_c }^{s_c } +{\bi C}_m^{s_c } {\bi C}_{s_r}^m {\bf \varepsilon}^{s_r}\rsqb +{\bi w}_m \cr \delta \skew6\dot{{\bi V}}^{\,n}={\bi C}_{s_c}^{\,n} \lpar {\bi I}-{\bi C}_m^{s_c } {\bi C}_{s_r }^m \rpar {\bi f}_{\!\!is_r}^{s_r } -\lpar 2{\bf \omega}_{ie}^{n\times} +{\bf \omega}_{en}^{n\times} \rpar \delta {{\bi V}}^{\,n}+{\bi C}_{s_r }^{\,n} \nabla^{s_r }+{\bi w}_v\cr \dot{{\bf \varepsilon}}^{s_r}={\bf 0}\cr \nabla^{s_r}={\bf 0} \cr \dot{{\bf \psi}}_a ={\bf \eta}_a}\right.$$
where  ${\bf \eta}_{a} $ is a white noise term with covariance Qa.
The measurable misalignment angles  ${\bf \psi}_{m} $ and velocity error
 $\delta {\bi V}^{\,n} $ are selected as observations. The observation model can be described as:
 $${\bi z}_k ={\bi H}_k {\bi x}_k +{\bi v}_k$$
where  ${\bi v}_{k} $ is the observation noise; the coefficient matrix
 ${\bi H}_{k} $ is given in:
 $${\bi H}_k =\left[\matrix{ {\bi I}_{3\times 3} &{\bf 0}_{3\times 3} &{\bf 0}_{3\times 3} &{\bf 0}_{3\times 3} &{\bf 0}_{3\times 3}\cr {\bf 0}_{3\times 3} &{\bi I}_{3\times 3} &{\bf 0}_{3\times 3} &{\bf 0}_{3\times 3} &{\bf 0}_{3\times 3}}\right]$$
The observation  ${\bf \psi}_{m} $ can be obtained by using the multiplication operation between the attitude DCM of the MINS and SINS. Note that the observations provided by the MINS suffer from random time delay and unpredictable vibration, which can induce the observation mismatch problem. Consequently, the statistics of the observation noise are uncertain.
5. SIMULATION AND DISCUSSION
In this section, a series of simulations are carried out to validate the performance of the DDF-based IMM-TFS. The simulated data of MINS and SINS are obtained through a common trajectory of aircraft. Then, the proposed approach is compared with the EKF-based IMM-TFS, DDF-based TFS and DDF-based IMM-RTSS.
5.1. Simulation parameters
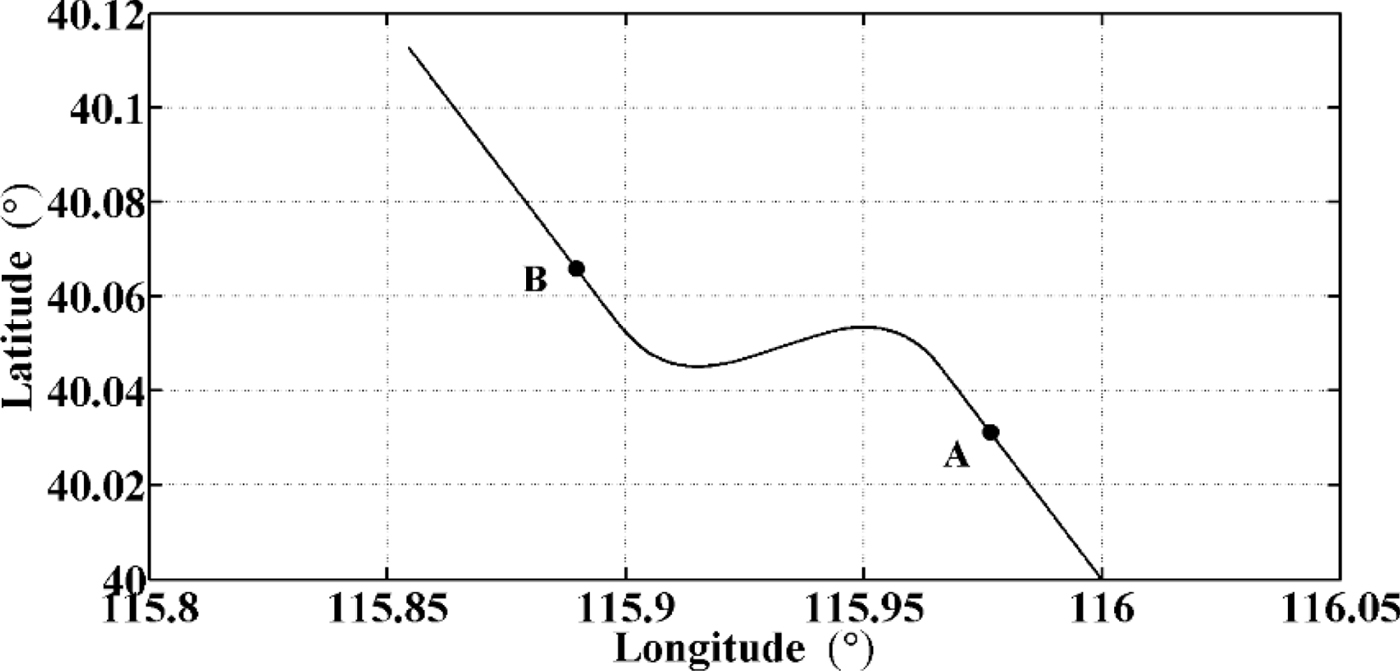
In this subsection, a typical flight trajectory with a S manoeuvre is designed, as shown in Figure 2. The aircraft flies for 50 s in a straight line at first, then, an S-manoeuver of the aircraft is achieved with an 80° decrease and increase in heading direction. Finally, the aircraft flies straight for 70 s again. The rapid transfer alignment procedure is started at A point (40 s), and ended at point B (140 s).
Trajectory of the simulation.

The initial position of the aircraft is Latitude 40° N, Longitude 116° E and 800 m in height. The velocity of the aircraft is 100 m/s. The initial heading angle of the aircraft is 330° and the initial pitch angle and roll angle are set to 0°. The gyro bias of the SINS is 10°/h, and the gyro white noise is 1°/h. The accelerometer bias of the SINS is 200 μ g, and the accelerometer white noise is 100 μ g. The attitude and velocity observations can be obtained from the measurement of the MINS. The precision of attitude observation and velocity observation are 0.1° and 0.02 m/s, respectively. The initial attitude errors are set to  ${\bf \Psi}_{a} =[5^{\circ} ;5^{\circ} ;10^{\circ} ]$. The covariance of
 ${\bf \Psi}_{a} $ is set to
 ${\bi Q}_{a} =diag\{( 0.01^{\circ}/\hbox{h})^{2},(0.01^{\circ} / \hbox{h} )^{2}, (0.01^{\circ} / \hbox{h})^{2}\}$. The covariance of observation noise changes twice during the flight: at 20 s and 60 s, and each period lasts 20 s. We define the model with the normal observation noise level as model 1 and the model with three times observation noise as model 2. The initial state vector and model probability vectors for the FIF are set to
 $\hat{\bi x}_{0\vert 0}^{i} ={\bf 0}$, i=1, 2 and
 ${\bf \mu}_{0\vert 0}^{f} =[\matrix{ 0.5 &0.5}]$. The initial estimates for the BIF are obtained from the final estimates of the FIF, and the model probabilities are set to
 ${\bf \mu}_{N\vert N}^{b} =[\matrix{ 0.5 &0.5}]$. The transition probability matrix is given by:
 $${\bi P}_{pro} =\left[\matrix{ 0.95 &0.05 \cr 0.05 &0.95}\right]$$
5.2. Results and Discussions
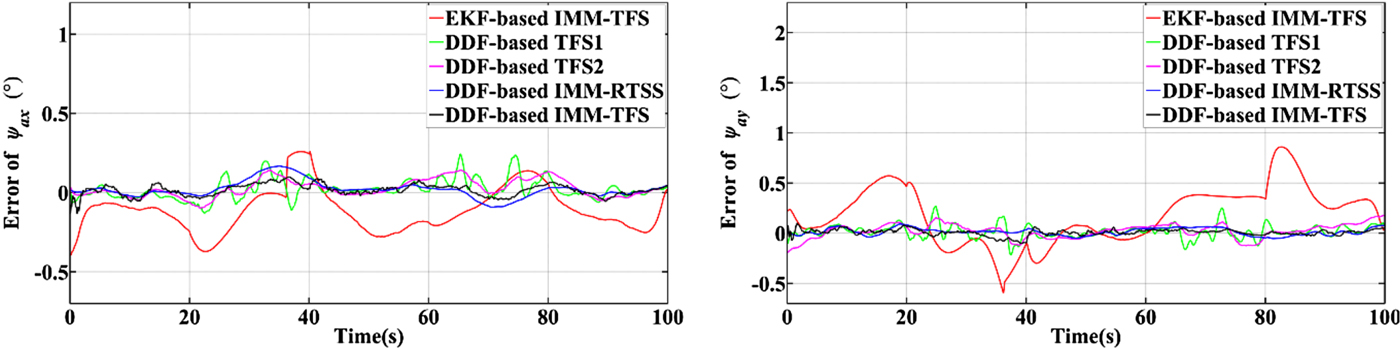
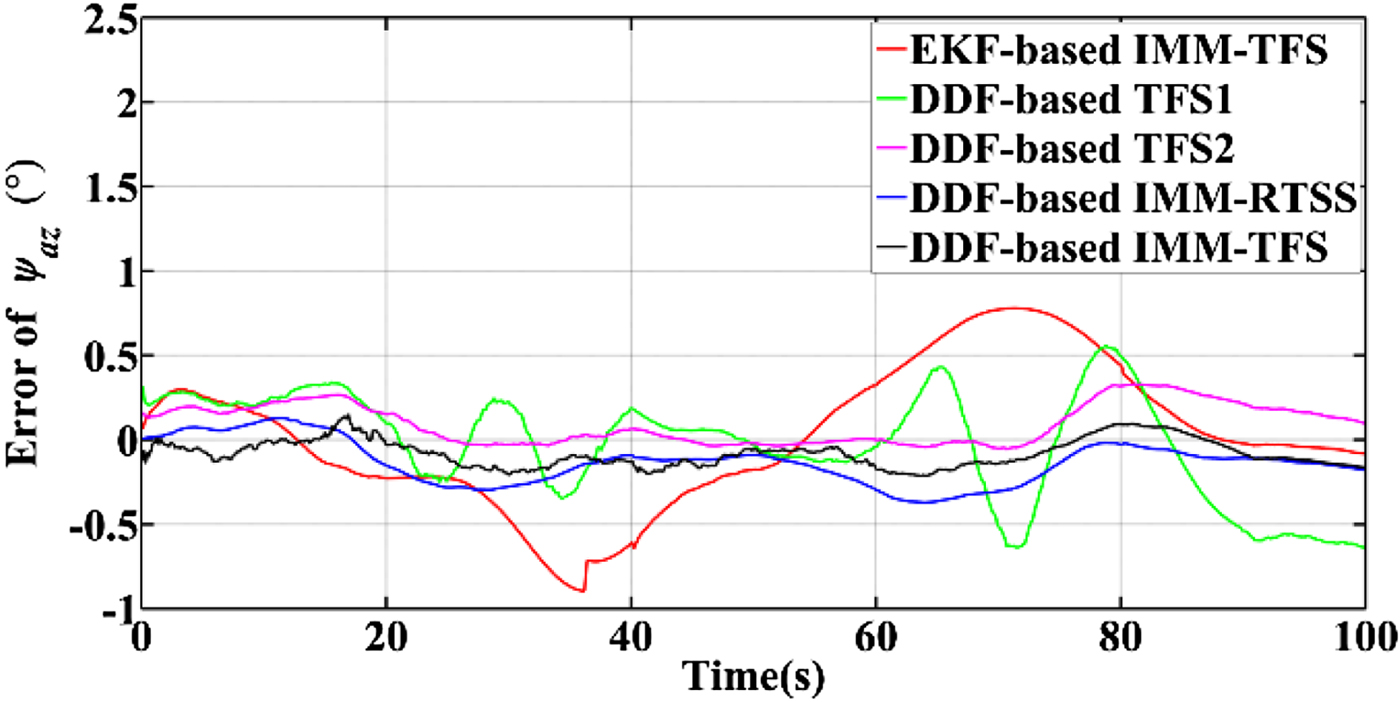
The DDF-based IMM-TFS, DDF-based IMM-RTSS, EKF-based IMM-TFS and DDF-based TFS were executed to estimate the actual physical misalignment angles of the SINS during the simulated flying trajectory. Figure 3 and Figure 4 show the estimated errors of the different approaches. DDF-based TFS1 and DDF-based TFS2 denote the results of the DDF-based TFS in terms of model 1 and model 2, respectively.
Estimated error of Ψax and Ψay.

Estimated error of Ψaz.

As shown in Figure 3 and Figure 4, both the DDF-based IMM-TFS and DDF-based IMM-RTSS approaches perform better than the DDF-based TFS for the different models. The estimation accuracies of DDF-based IMM-TFS and DDF-based IMM-RTSS are indistinguishable in terms of Ψax and Ψay, and the former approach has a better estimation result than the latter in terms of Ψaz. Note that the results obtained by DDF-based IMM-RTSS are smoother than that of the DDF-based IMM-TFS in terms of all misalignment angles. The EKF-based IMM-TFS obviously has the worst performance. The reasons for the results can be summarised as follows. First, the mismatch problem decreases the performance of the single-model-dependent DDF-based TFS. Moreover, the DDF-based IMM-TFS combines the estimates of the FIF and BIF, that is, it uses the observations more effectively. In contrast, the recursion step of DDF-based IMM-RTSS is only in terms of the linearization parameters from the FIF, and the lower computation smoother corresponds to a lower estimation accuracy with relatively smooth estimations. The WSLR used in DDF-based IMM-TFS also improves the linearization accuracy of the nonlinear system model, whereas the accumulated error that arises from the first-order Taylor expansion method in the EKF-based IMM-TFS distinctly degrades the estimation accuracy.
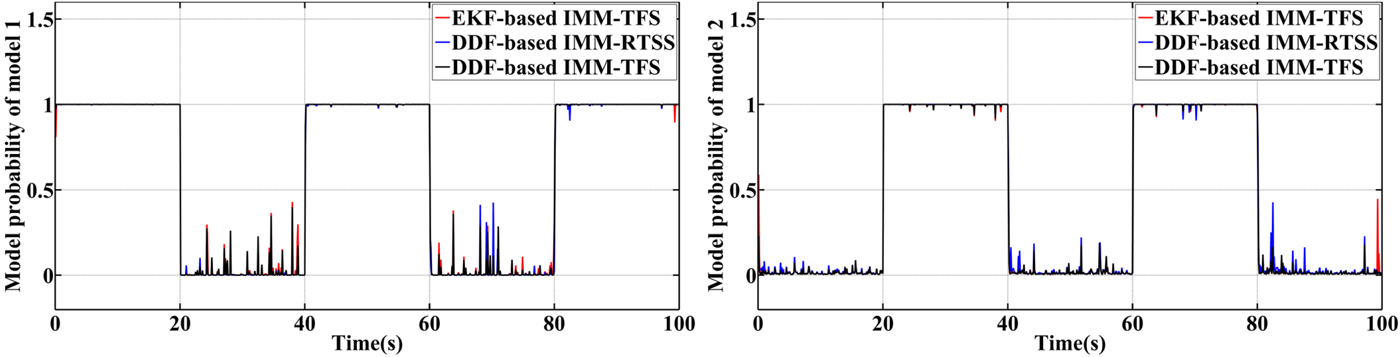
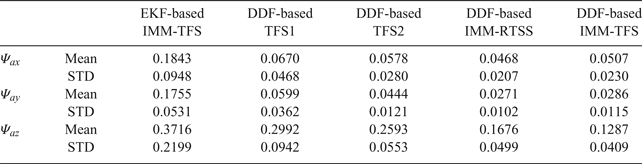
To make a general comparison of the performance, the four algorithms were performed over 100 Monte Carlo simulations. The simulations of DDF-based TFS for two models were separately executed to compare the performance of these approaches. The initial simulation parameters were set identical to the aforementioned case. In addition, we used the time-average and Standard Deviation (STD) values of the Root Mean Square Errors (RMSE) to evaluate the performances of different approaches. The resulting statistics of the RMSE for 100 Monto Carlo simulations are shown in Table 1. The average smoothed model probabilities in terms of different IMM-type smoothers are presented in Figure 5.
Average smoothed model probability of model 1 and model 2.

Statistics of RMSE for 100 Monto Carlo simulations (°).

Table 1 shows that the DDF-based IMM-TFS gives superior results to the other approaches in terms of the statistics of RMSE values. Although the estimation accuracy of DDF-based IMM-TFS is close to that of DDF-based IMM-RTSS in terms of Ψax and Ψay, the former approach gives better results for the estimation of Ψaz. However, the STD values of DDF-based IMM-TFS are larger than the DDF-based IMM-RTSS, since the combination of the estimations from FIF and BIF degrade the smoothness of the results. The DDF-based TFS approaches perform worse than the DDF-based IMM smoothers because of the observation mismatch problem. The EKF-based IMM-TFS obviously gives the worst estimation accuracy for all three misalignment angles.
As shown in Figure 5, the probabilities estimated by different IMM smoothers rapidly switch, which indicates that they efficiently detect the changes of the model, and show an explicit variation of the changes with respect to different models. The priority of probability weight shows higher values than the related model according to the simulated situation. The simulation shows that the two-filter-type IMM smoother has comparable results to the smoothed model probabilities of the R-T-S-type IMM smoother.
The mean value of the computing time for the implementation of these four methods are listed as follows. The required time for EKF-based IMM-TFS is 5.49 s; the required time for DDF-based TFS is 14.53 s; the required time for DDF-based IMM-RTSS is 27.58 s and the required time for DDF-based IMM-TFS is 29.42 s. The results agree well with the theoretical analysis in Section 2, that is, the high estimation accuracy of DDF-based IMM-TFS comes at the cost of a larger computation load.
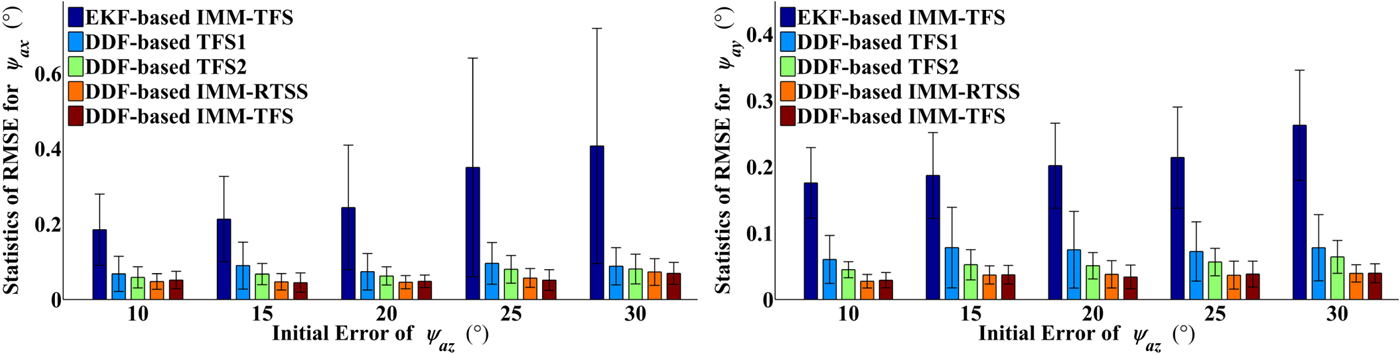
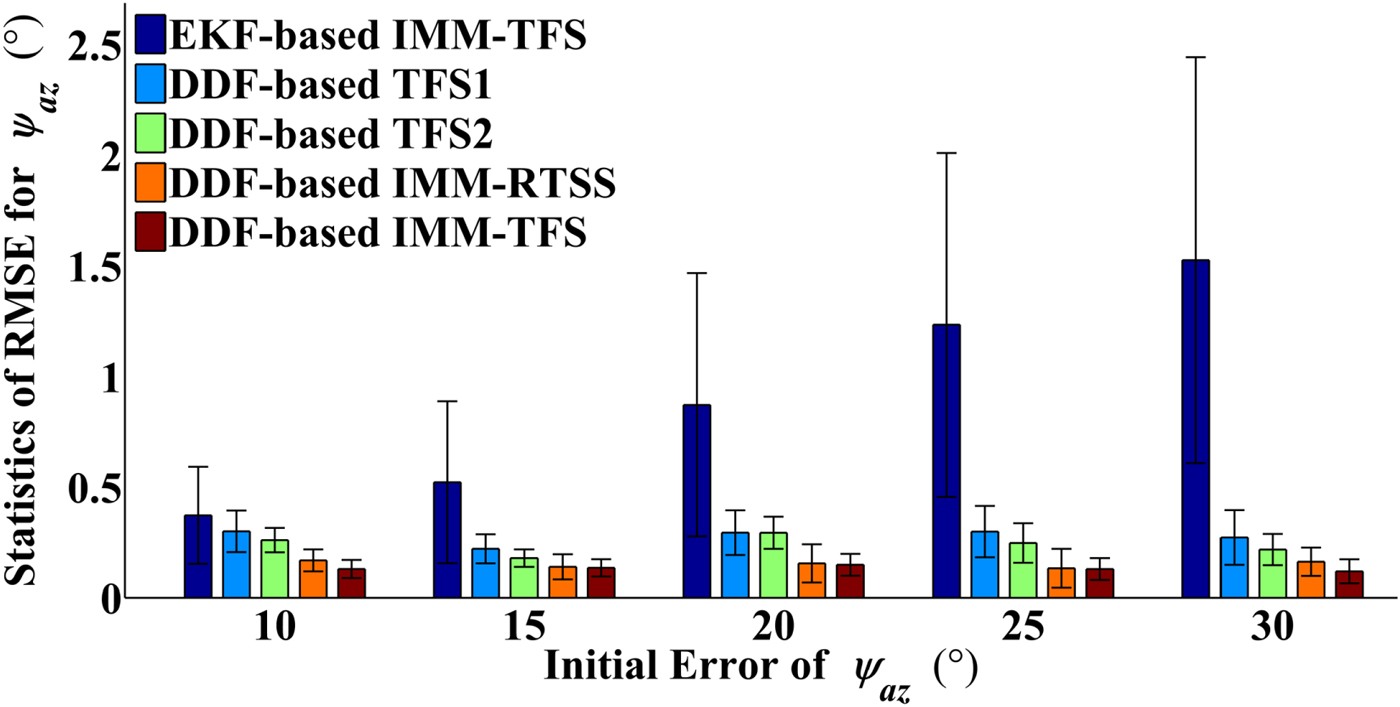
To validate the ability to handle an increasing degree of nonlinearity, the DDF-based IMM-TFS is compared with other smoothers, and different cases of initial error for Ψaz are designed. The initial errors for Ψaz are set to  $10^{\circ} -30^{\circ} $ with 5° intervals, and the initial errors of Ψax and Ψay are set to 5° for these cases. Then, the aforementioned four smoothing approaches were performed using the data simulated by the trajectory generator, and each approach was executed 100 times for each different case. The results in terms of the statistics of the RMSE for different approaches are displayed in Figure 6 and Figure 7.
The statistics of RMSE for Ψax and Ψay in different cases.

The statistics of RMSE for Ψaz in different cases.

As shown in Figure 6 and Figure 7, the estimation errors of the EKF-based IMM-TFS increase distinctly with the growth of the initial error of Ψaz, which illustrates that the first-order Taylor expansion method severely decreases the performance of this estimator. There is no significant difference between the results of the DDF-based TFS in terms of different models for these cases, and they have poor performance because they suffer from observation mismatch. Simultaneously, the performances of DDF-based IMM-RTSS and DDF-based IMM-TFS are stable with the increasing initial error of Ψaz. For the estimation results of Ψax and Ψay, the precision of the DDF-based IMM-RTSS is close to that of DDF-based IMM-TFS, and the latter approach performs better than the former in terms of the estimation accuracy of Ψaz. The results illustrate that the DDF-based IMM-TFS can prevent the divergence and achieve a higher estimation accuracy than other approaches.
6. CONCLUSIONS
In this paper, we investigated a DDF-based IMM-TFS approach to address the accuracy evaluation issue of rapid transfer alignment with the coexistence of a high degree of nonlinearity and uncertain observation noise. The proposed approach inherits the basic structure of the two-filter-type IMM smoother, which includes a DDF-based FIF with WSLR, a standard KF-based BIF, and a two-filter-type IMM smoother. The WSLR method performed in the FIF escapes the restriction of the required inversion of the nonlinear system model, and the resulting linearization parameters are used to form the pseudo-linear model for BIF. Compared with the RTS-type IMM smoother, the DDF-based IMM-TFS benefits from the combination of two independent solutions obtained from FIF and BIF, which implies that it contains more error information during the alignment procedure. In addition, the mixing step of the proposed smoother takes into account the model switching situation, thus, better accuracy can be achieved compared with the single-model based smoother. Besides, the DDF-based IMM-TFS can effectively detect the changes of the model, and the simulation results show that the estimation performance of model probability is at least comparable to those of the EKF-based IMM-TFS and DDF-based IMM-RTSS. In conclusion, with the improved estimation accuracy, the DDF-based IMM-TFS can be considered as a candidate approach to address the accuracy evaluation issue of rapid transfer alignment.
ACKNOWLEDGMENTS
This paper was funded by the National Natural Science Foundation of China (61320106010). The authors would like to thank the editors and reviewers who gave suggestions for the revision of this paper.