Introduction
The mineral lepersonnite, now lepersonnite-(Gd), reflecting the dominance of Gd over other REE, was discovered at the famous Shinkolobwe mine in the Democratic Republic of Congo in Africa and described by Deliens and Piret (Reference Deliens and Piret1982). Based on the original description, the chemical formula assigned to lepersonnite-(Gd) and accepted by the Commission on New Minerals, Nomenclature and Classification of the International Mineralogical Association (IMA-CNMNC) is Ca(Gd,Dy)2(UO2)24(SiO4)4(CO3)8(OH)24·48H2O. The assumed symmetry of the mineral based on the original Weissenberg X-ray photographs is orthorhombic (Pnnm or Pnm21). Attempts by Deliens and Piret to obtain X-ray-diffraction data suitable for deciphering the crystal structure were unsuccessful and recent attempts have failed as well (at least those known to/or conducted by the corresponding author). Here, we report on the first determination of the crystal structure of lepersonnite-(Gd), which has been accomplished using three-dimensional electron diffraction (3D ED) techniques. This first reliable structure model provides insights into important features concerning the crystal chemistry of this mineral and related phases. The structure determination has also been essential for the description of the new mineral lepersonnite-(Nd), which has been approved by the IMA-CNMNC with symbol Lps-Nd (IMA 2021-066, Plášil et al., Reference Plášil, Kampf, Škoda, Philippo, Guennou and Mees2021). There are two co-type specimens of lepersonnite-(Nd). One cotype is deposited in the Musée d’Histoire Naturelle, Luxembourg (specimen no. WPV020). The second cotype specimen is deposited in the Musée royal de L’Afrique centrale, Tervuren, Belgium (specimen no. RGM11529.1). Along with the description of the new mineral, we provide new analytical data for lepersonnite-(Gd). According to the mineral classification based on Strunz and Nickel (Reference Strunz and Nickel2001), lepersonnite-(Gd) and lepersonnite-(Nd) are classified as 5.EG.10: Uranyl carbonates with SiO4.
Occurrences
Lepersonnite-(Gd) was originally described by Deliens and Piret (Reference Deliens and Piret1982) from the Shinkolobwe mine in the Democratic Republic of Congo in Africa. The holotype, which is deposited in the Musée royal de L’Afrique centrale in Tervuren, is also the type specimen for bijvoetite-(Y), described at the same time. Lepersonnite-(Gd) forms globular crystal aggregates and crusts of pale-yellow colour, composed of prismatic, transparent, but mostly translucent crystals. The matrix of the specimen consists of massive uraninite (pitchblende) and dolomite cemented by massive uranyl-oxide hydroxy-hydrate minerals (the authors refer to curite and becquerelite).
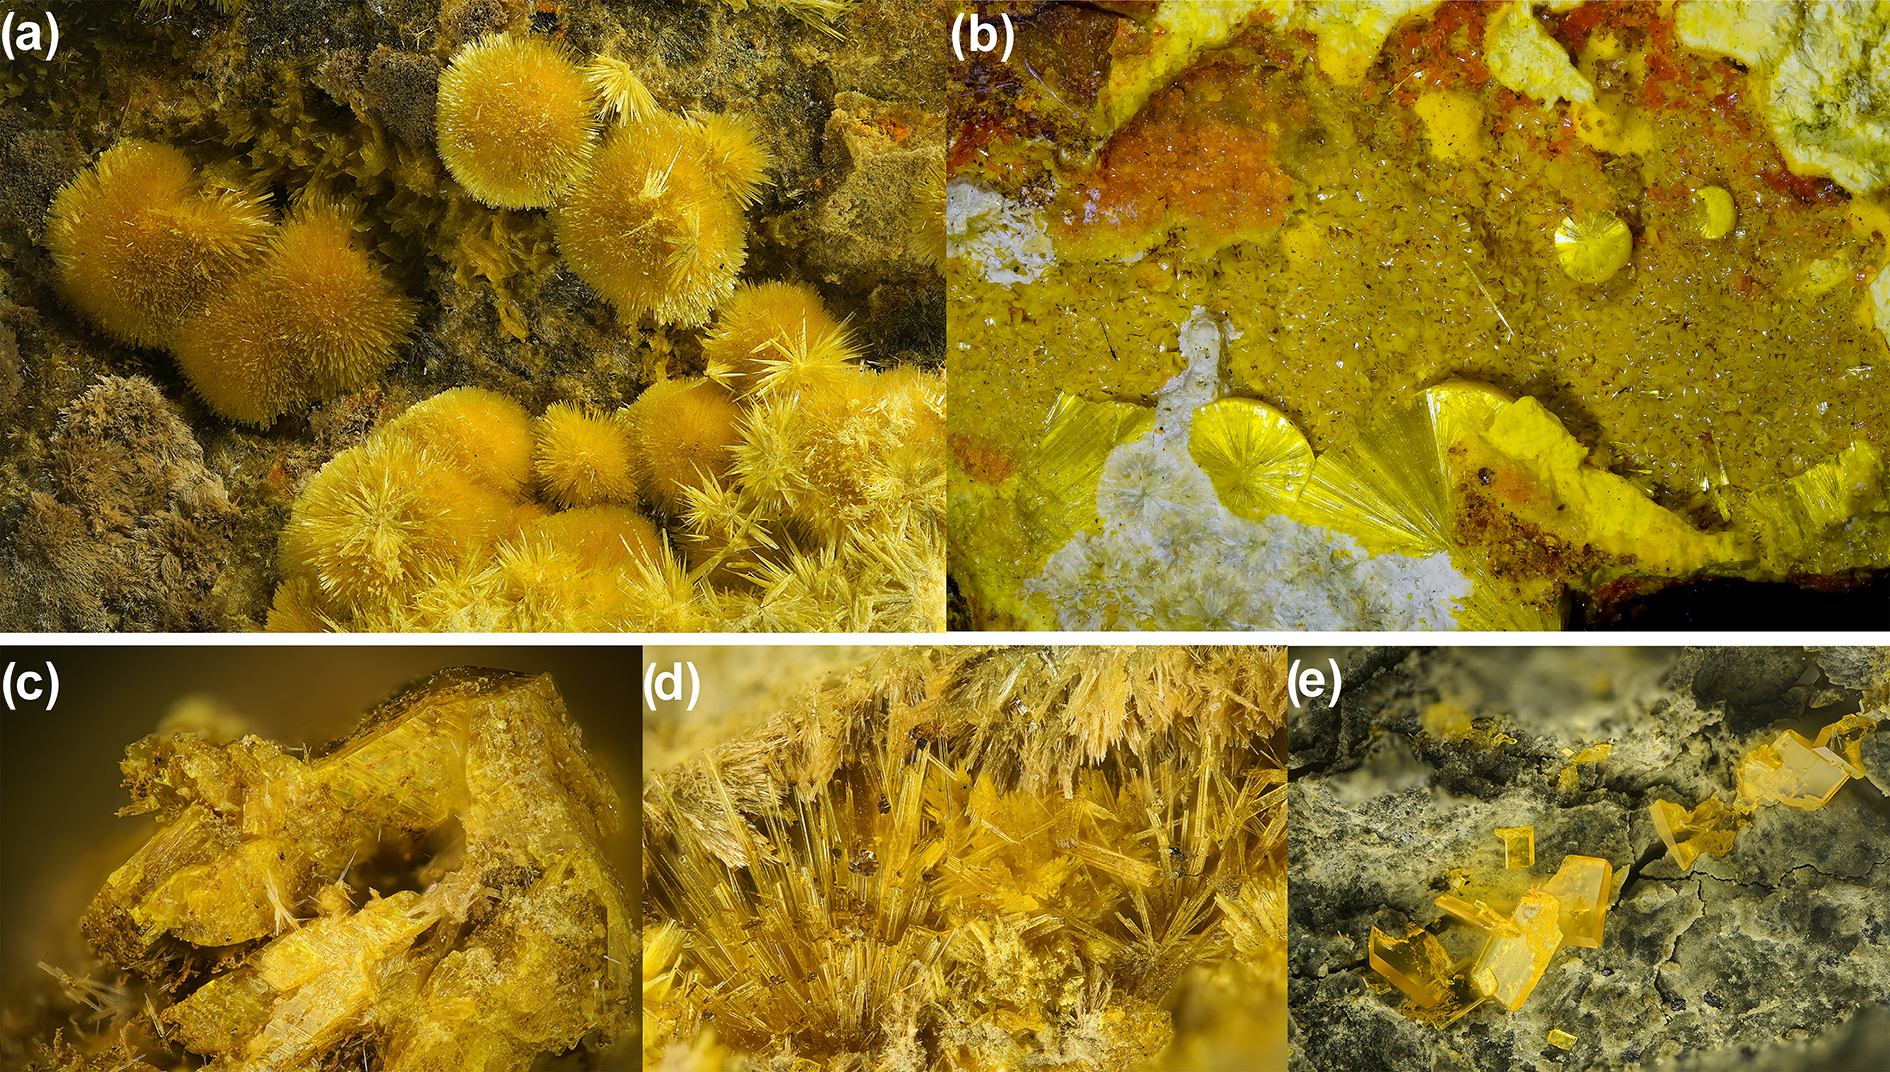
Both minerals, lepersonnite-(Gd) and -(Nd), and their mineral associations are displayed in Fig. 1a,b. The new data for lepersonnite-(Gd) were obtained from the specimen from the Shinkolobwe mine. Initially, a larger specimen with approximate dimensions of 25 × 15 × 10 cm was trimmed to inspect and study the mineral makeup. In addition to abundant lepersonnite-(Gd) (Fig. 1a), we identified, based on single-crystal and powder X-ray diffraction, the following minerals within the specimen: bijvoetite-(Y) (scarce crystals with typical habits) (Fig. 1c), oursinite (relatively abundant pale yellowish-green prismatic crystals) (Fig. 1d), becquerelite (partially massive, partially in crystals up to 0.5 cm in length) (Fig. 1e), sklodowskite (abundant greenish-yellow crystals), and uranophane, with massive to blocky uraninite in the matrix. The new analytical data for lepersonnite-(Gd) and the crystals used for electron diffraction study were obtained from part of this specimen deposited by one of the authors (JP) in the mineralogical collections of the National Museum in Prague. Two larger pieces originating from this specimen are deposited in the collections of the Musée d’Histoire Naturelle, Luxembourg, and at the Department of Geology, Muséum cantonal des Sciences naturelles in Lausanne, Switzerland (specimen no. 088310).
Minerals studied: (a) acicular aggregates of lepersonnite-(Gd) crystals (field of view, FOV = 5 mm; personal collection of SW) and (b) radial aggregates of lepersonnite-(Nd) crystals with a crust of soddyite (bipyramidal flattened yellow crystals), orange curite (needle-like crystal) and whitish studtite (cotype specimen no. WPV020, Luxembourg; FOV = 8.9 mm; photo by Eddy Van der Meersche), and some of the associated minerals: (c) bijvoetite-(Y) (FOV = 0.8 mm); (d) oursinite (FOV = 5 mm); and (e) becquerelite (FOV = 5 mm). Photos except for lepersonnite-(Nd) courtesy of Stephan Wolfsried.

Lepersonnite-(Nd) was found on three specimens originating from the Swambo deposit, which is situated 36 km to the west of Shinkolobwe, near the Mindigi mine in the Democratic Republic of Congo (Africa). The samples studied comprise two cotype specimens, one deposited in the Musée d’Histoire Naturelle, Luxembourg (specimen no. WPV020), the second cotype specimen is deposited in the Musée royal de L’Afrique centrale, Tervuren, Belgium (specimen no. RGM11529.1) and the third is a specimen deposited in the collection of the Department of Geology at the Muséum Cantonal des Sciences Naturelles in Lausanne, Switzerland (specimen no. 079986) and originates from Shinkolobwe mine.
The uranium-bearing mineralisation at Swambo is accompanied by cobalt, nickel and other precious metals in the orebody. The oxidation zone is strongly developed, with massive uraninite still present throughout the oxidation zone (Derricks and Oosterbosch, Reference Derricks and Oosterbosch1958). The Swambo mine is the type locality for the mineral swamboite-(Nd) (Deliens and Piret, Reference Deliens and Piret1981; Plášil et al., Reference Plášil, Petříček, Locock, Škoda and Burns2017). Associated minerals on the two cotype specimens are soddyite, swamboite-(Nd), curite, studtite and gold.
The specimen labelled originally as ‘lepersonnite-(Gd)’ from Shinkolobwe mine, deposited in the collection of the Department of Geology at the Muséum Cantonal des Sciences Naturelles in Lausanne, Switzerland (specimen no. 079986) has been found, according to EDXS and PXRD analyses, to be lepersonnite-(Nd). The specimen originates from a collection of the renowned specialist in Katanga minerals, Mr. Gilbert Joseph Gauthier (1924–2006). In it, lepersonnite-(Nd) is associated with curite, quartz and relics of uraninite. Thus, after the Swambo mine, Shinkolobwe is the second known locality for this mineral.
Physical and optical properties of lepersonnite-(Nd)
Lepersonnite-(Nd) occurs in radial sprays and subparallel aggregates of needle-like crystals (Fig. 1b) growing on a crust of soddyite, present as small bipyramidal flattened crystals. Crystals have a yellow colour and a very pale yellow streak. The mineral is non-fluorescent in SW and LW ultraviolet light. Its Mohs hardness is estimated at 1.5 based on scratch tests. Lepersonnite-(Nd) is brittle; multiple cleavages have been observed, but it is hard to determine the crystallographic orientations due to the intergrown nature of crystal aggregates. The fracture is irregular. Optically, lepersonnite-(Nd) is biaxial (–), with α = 1.621(3), β = 1.657(3), γ = 1.677(3) (measured in white light), 2V (meas.) = 68(5)° and 2V (calc.) = 72.0°. Dispersion was not observed. Optical orientation is X = a, Y = c and Z = b. Lepersonnite-(Nd) is pleochroic, with X = yellow, Y = yellow and Z = light yellow; X ≈ Y > Z. We emphasise that the interference figure is quite diffuse, which could be due to twinning. Lepersonnite-(Nd) is soluble in dilute hydrochloric acid (10%), releasing CO2 and leaving a residue of amorphous silica.
Chemical composition
Lepersonnite-(Gd)
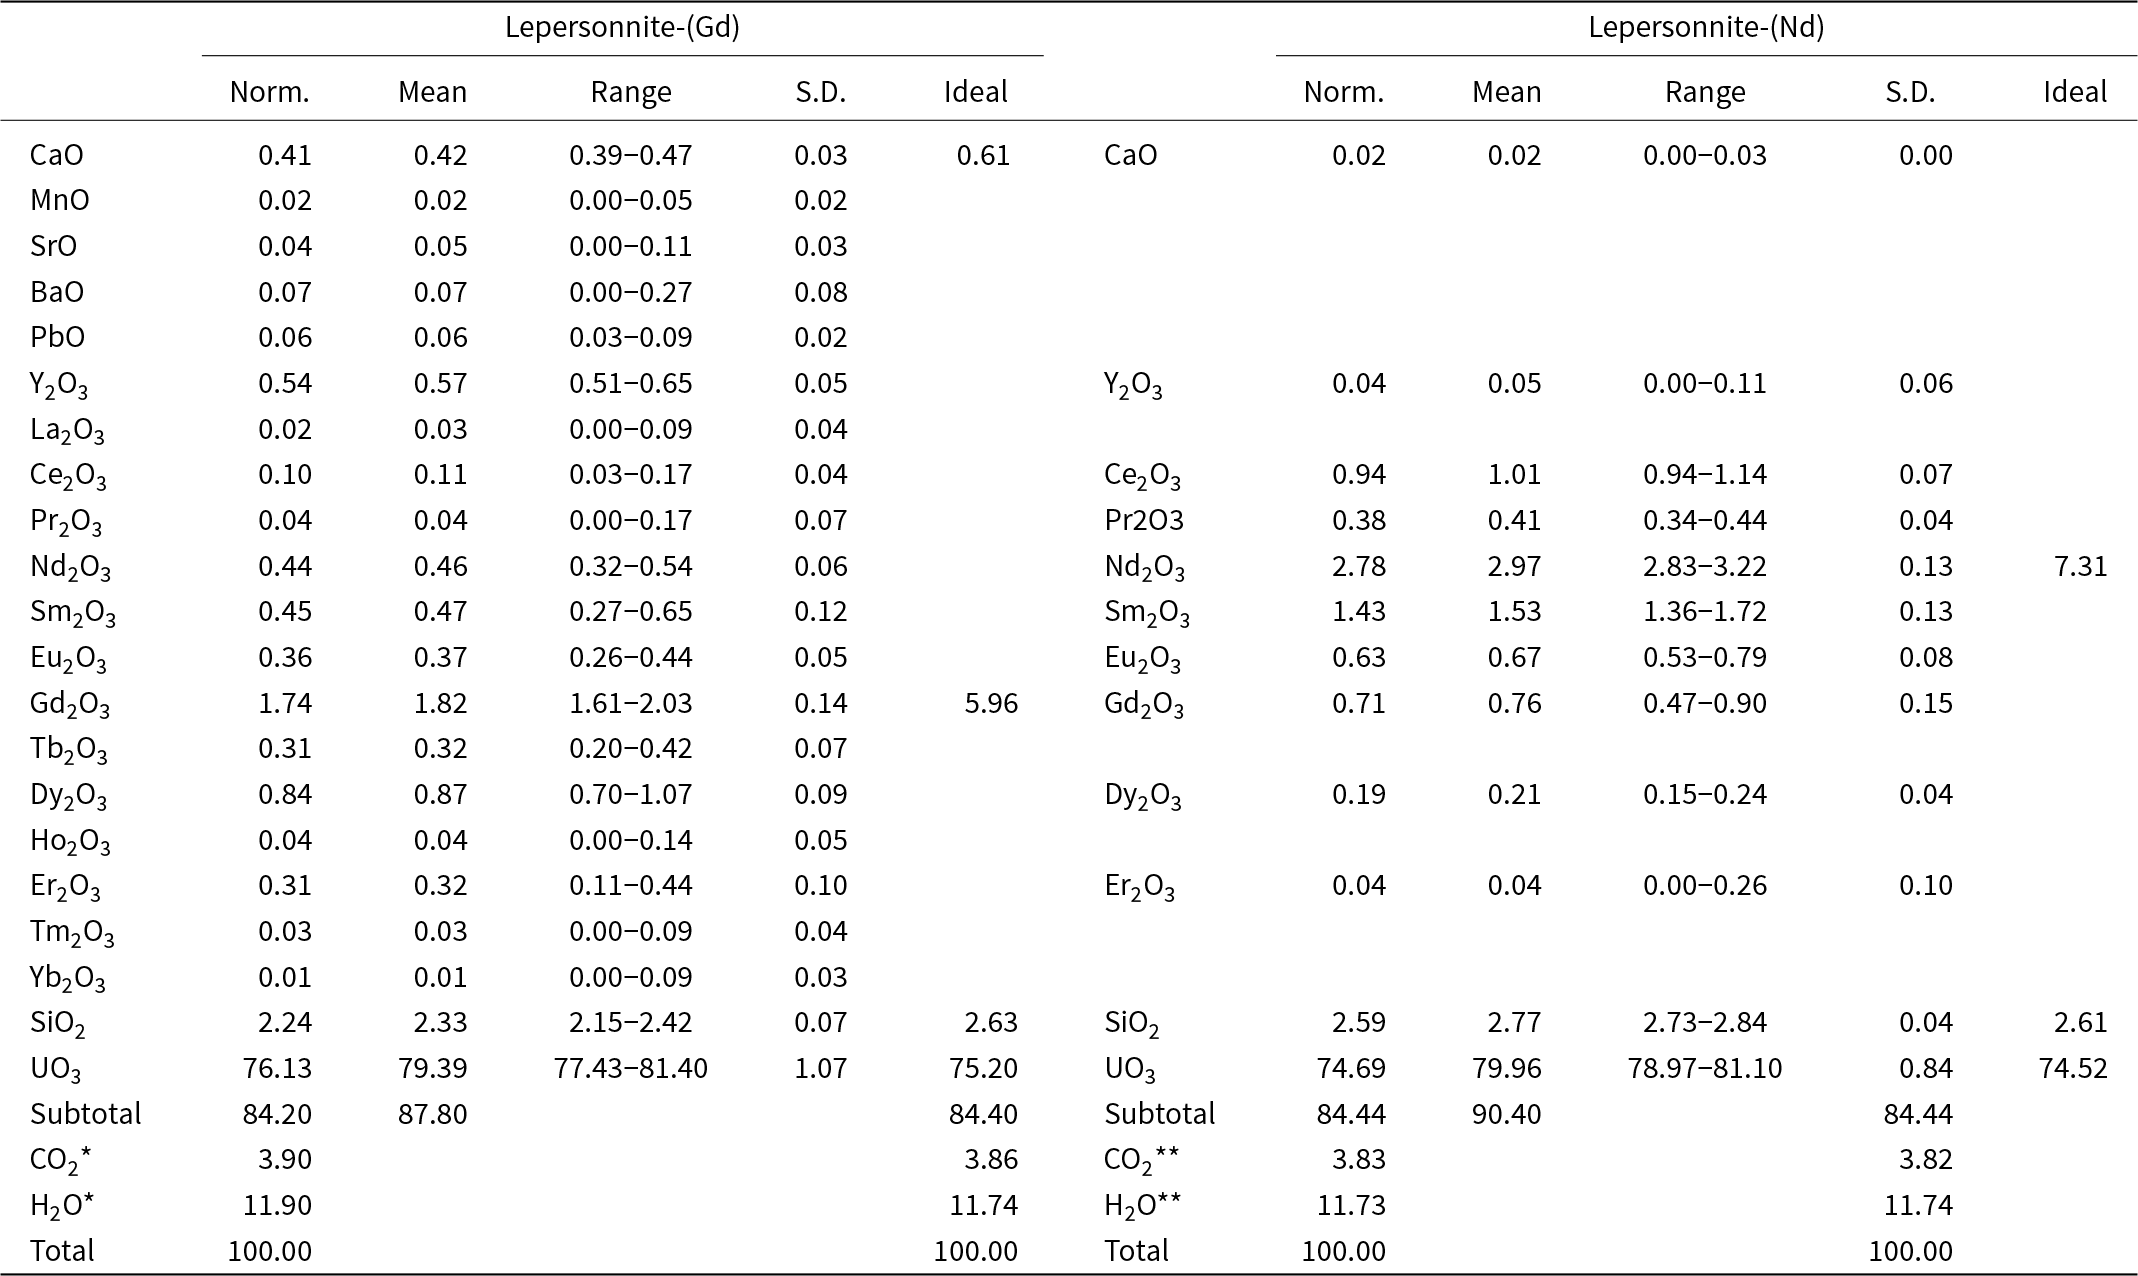
The lepersonnite-(Gd) investigated (sample RO-548) occurs as fan-shaped aggregates of acicular crystals, homogeneous under back-scattered electron (BSE) images. Quantitative chemical electron microprobe analyses (EPMA, 13 points) were carried out using a Jeol JXA 8530 FE electron microprobe at the Geological Institute of Slovak Academy of Sciences, Banská Bystrica, Slovak Republic. Experimental conditions were: wavelength-dispersive spectroscopy mode, accelerating voltage 15 kV, beam current 15 nA and beam diameter 10 μm. Standards (element, emission line) were: baryte (S, Kα and Ba, BaLα), apatite (P, Kα), GaAs (As, Lα), orthoclase (Si, Kα and K, Kα), thorianite (Th, Mα), UO2 (U, Mβ), albite (Al, Kα and Na, Kα), YPO4 (Y, Lα), LaPO4 (La, Lα), CePO4 (Ce, Lα), PrPO4 (Pr, Lβ), NdPO4 (Nd, Lα), SmPO4 (Sm, Lα), EuPO4 (Eu, Lα), GdPO4 (Gd, Lα), TbPO4 (Tb, Lα), DyPO4 (Dy, Lα), HoPO4 (Ho, Lα), ErPO4 (Er, Lα), TmPO4 (Tm, Lα), YbPO4 (Yb, Lα), LuPO4 (Lu, Lα), diopside (Ca, Kα, and Mg, MgKα), hematite (Fe, Kα), rhodonite (Mn, Kα), crocoite (Pb, Mβ), celestite (Sr, Lα), fluorite (F, Kα) and tugtupite (Cl, Kα). Peak counting times were 20 s for all elements and 10 s for each background. Matrix correction by ZAF software was applied to the data. Inter-REE coincidences were corrected by empirically determined correction factors (Åmli and Griffin, Reference Åmli and W.L1975). Water and CO2 contents were calculated based on thermogravimetric analysis (see below) and stoichiometry derived from the crystal structure analysis. The high analytical total (Table 1) is probably caused by the partial loss of H2O in the vacuum during the deposition of the conductive carbon coating and in the microprobe chamber. The empirical formula (calculated on the basis of U = 12 atoms per formula unit) is (Ca0.33Ba0.02Sr0.02Pb0.01Mn0.01)Σ0.39(Gd0.43Y0.22Dy0.20Nd0.12Sm0.12Eu0.09Tb0.08Er0.07Ce0.03La0.01Pr0.01Ho0.01Tm0.01)Σ1.39(UO2)12(CO3)4(SiO3OH)1.68O2(OH)11.92·22.98H2O. The calculated density for the empirical formula (Z = 4) and unit-cell parameters refined from powder X-ray diffraction data is 4.05 g·cm–3, which corresponds closely to the measured density of 4.0 g·cm–3 for the holotype sample (Deliens and Piret, Reference Deliens and Piret1982).
Chemical composition (wt.%) of lepersonnite-(Gd) and lepersonnite-(Nd)

Notes: Norm. = normalisation; S.D. = standard deviation. CO2* and H2O* contents calculated based on thermogravimetric analysis and stoichiometry derived from the crystal structure analysis; CO2** and H2O** calculated based on the ideal stoichiometry and charge balance; ideal: ideal composition for formulae [Ca0.5Gd0.5(H2O)18(OH)1.5][Gd(UO2)12(SiO3OH)2(CO3)4(OH)10O2(H2O)5] and [Nd(H2O)18(OH)2][Nd(UO2)12(SiO3OH)2(CO3)4(OH)10O2(H2O)5], respectively.
Lepersonnite-(Nd)
Electron probe microanalyses (7 points on a homogeneous aggregate of crystals) were performed at the Masaryk University in Brno (Czech Republic) on a Cameca SX-100 electron microprobe operating in WDS mode. Analytical conditions were 15 kV accelerating voltage, 10 nA beam current, and 10 μm beam diameter. Raw X-ray intensities were corrected for matrix effects with a ϕρ(z) algorithm “PAP” (Pouchou and Pichoir, Reference Pouchou and Pichoir1991). Inter-REE coincidences were corrected by empirically determined correction factors. The high analytical total is probably attributable to the partial loss of H2O in the vacuum during the deposition of the conductive carbon coating and in the microprobe chamber, which resulted in higher concentrations of the remaining constituents. No other elements were detected. Because insufficient material is available for directly determining H2O and CO2, they have been calculated based on analogy with lepersonnite-(Gd) and charge balance. Analytical data are given in Table 1. The empirical formula (calculated on the basis of U = 12 apfu) is Ca0.02(Nd0.76Sm0.38Ce0.26Gd0.18Eu0.16Pr0.11Dy0.05Y0.02Er0.01)Σ1.92(UO2)12(CO3)4(SiO3OH)1.98O2(OH)11.86·23H2O. The calculated density for the empirical formula (Z = 4) and unit-cell parameters obtained from powder X-ray diffraction data is 4.12 g·cm–3.
Thermogravimetric analysis
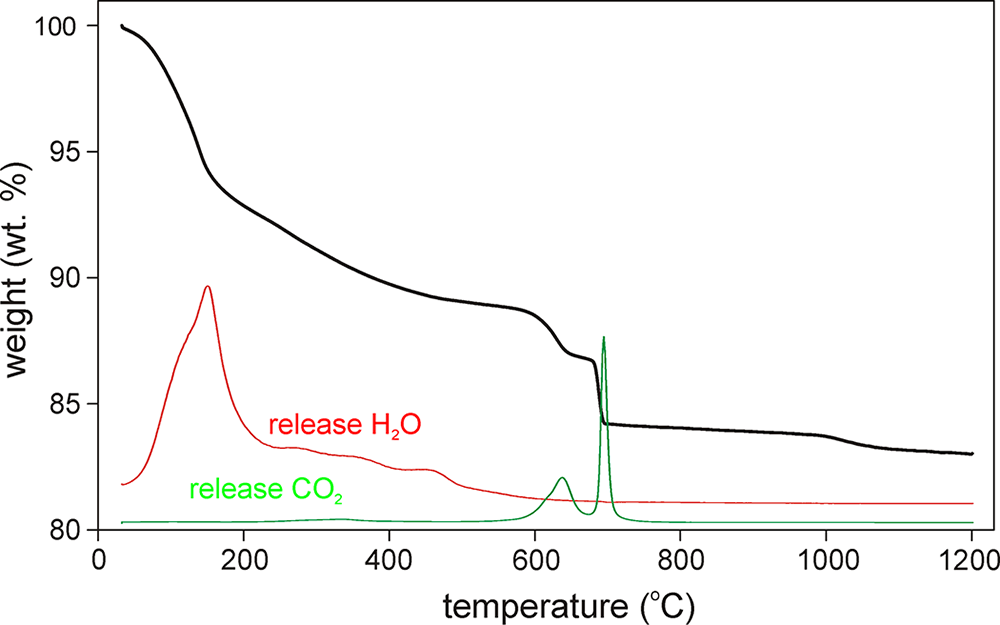
Thermogravimetric (TG) data on lepersonnite-(Gd) were collected at the University of Chemistry and Technology (Prague, Czech Republic) using a Thermobalance SETSYS (Setaram, France) equipped with a mass spectrometer GSD 320 03 OmniStar (Pfeiffer Vacuum, Austria). A sample weighing 19.537 mg was analysed between 30 and 1200°C in air with a heating rate 10°C·min–1. The collected thermogravimetric curve is shown in Fig. 2. Three main weight loss steps can be identified: (1) between 30 and 610°C; (2) between 610 and 700°C; and (3) between 700 and 1200°C. The first step (11.50 wt.%) corresponds to the loss of ca. 28.8 H2O groups. The second weight loss (4.30 wt.%) is connected to the dominant loss of CO2 (ca. 3.90 wt.% ≈ 4 CO2) in two distinct steps partly accompanied by the loss of a small fraction of H2O (ca. 0.4 wt.%, ≈1 H2O). The loss of both chemical constituents is documented by mass spectrometry. The total observed weight loss, 15.80 wt.% in the range 30–700°C, is comparable with the contents 4.02 wt.% CO2 and 12.12 wt.% H2O (total 16.14 wt.%) given for lepersonnite-(Gd) by Deliens and Piret (Reference Deliens and Piret1982). The third step of weight loss (1.17 wt.%) corresponds to the partial reduction of uranyl groups, the greyish black end-product is U3O8 with an admixture of cubic REEO1.86 phase.
Thermogravimetric curve for lepersonnite-(Gd).

Raman and infrared spectroscopy
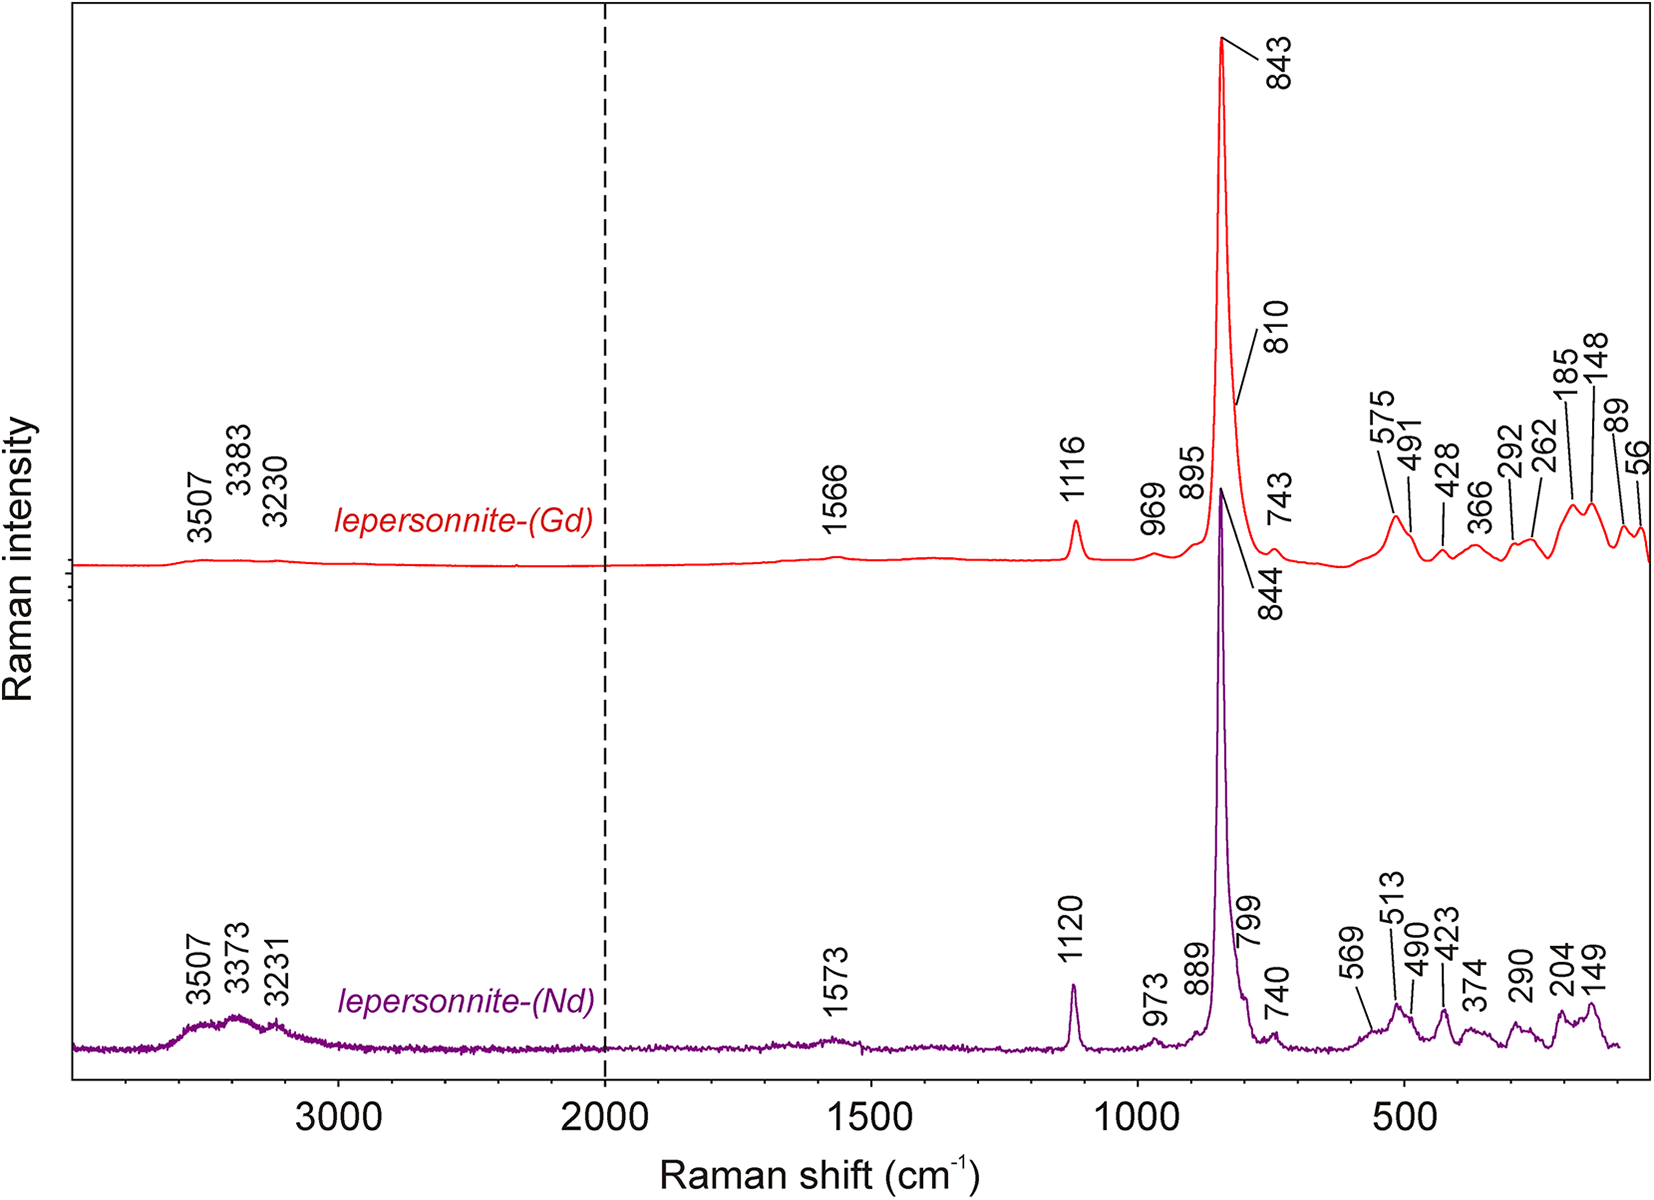
The Raman spectroscopic study of lepersonnite-(Nd) was conducted on a Renishaw inVia micro-Raman spectrometer in the range 4000–95 cm–1 at the Department of Physics and Materials Science, University of Luxembourg. Because of the significant fluorescence that appeared using a 532 nm diode laser, the spectrum was finally recorded using a 633 nm laser, which appeared to have the best signal-to-noise ratio (along with lower thermal load to avoid damaging or dehydrating the sample analysed). The final spectra were recorded with a laser power of ∼1 mW through a 50× microscope objective with a numerical aperture N.A. = 0.5. For comparison, the Raman spectrum of lepersonnite-(Gd) was collected in the range 4000–40 cm–1 using a DXR dispersive Raman Spectrometer (Thermo Scientific) mounted on a confocal Olympus microscope at the National Museum, Prague (Czech Republic). The Raman signal was excited by an unpolarised red 633 nm He–Ne gas laser and detected by a CCD detector. The experimental parameters were: 100× objective, 10 s exposure time, 400 exposures, 50 μm pinhole spectrograph aperture and 8 mW laser power level. The spectra were repeatedly acquired from different grains to obtain a representative spectrum with the best signal-to-noise ratio. The eventual thermal damage of the measured point was excluded by visual inspection of the excited surface after measurement, by observation of possible decay of spectral features at the start of excitation and by checking for thermal downshift of Raman lines.
A comparison of both spectra is shown in Fig. 3. In general, the spectra are very similar. The major difference is that the lepersonnite-(Nd) spectrum is much noisier but has a better signal in the range of vibration of (OH)– bonds. For band assignments, we emulate the interpretations of Čejka (Reference Čejka, Burns and Ewing1999) for uranyl carbonates and silicates. A broad composite band, consisting of at least three overlapping bands, appearing at ∼3500 to 3200 cm–1 is attributed to stretching O–H vibrations of the molecular H2O and (OH)–. The nature of overlapping vibrational bands in this region indicates the presence of multiple independent H-bonds in the structure. Using the empirically derived equation of Libowitzky (Reference Libowitzky1999), the calculated O···O distances of the corresponding hydrogen bonds are between ∼3.0 and ∼2.8 Å. This is in line with the crystal structure model for lepersonnite-(Gd). A weak band located in the spectra of both minerals at around 1570 cm–1 is attributed to the ν2 (δ) (H2O) of the molecular water. Some authors have speculated that these bands can be assigned, with some uncertainty, to the stretching vibrations of SiO–H (e.g. Frost et al., Reference Frost, Čejka, Weier, Martens and Kloprogge2006). The sharp band of medium intensity at 1120 (Nd) and 1116 cm–1 (Gd) is attributed to the ν1 (CO3)2– symmetric stretching vibrations. No evidence exists for the ν3 (CO3)2– antisymmetric stretching vibrations at higher vibration energies. The weak bands at 973 cm–1 (Nd) and at 969 cm–1 (Gd) are attributed to the ν3 (SiO4)4– antisymmetric stretching vibrations. The bands of highest intensity, 844 (Nd) and 843 cm–1 (Gd), are assigned to the ν1 (UO2)2+ symmetric stretching vibrations and very weak shoulders at 889 (Nd) and 895 cm–1 (Gd) to the ν3 (UO2)2+ antisymmetric stretching vibrations. These may overlap with ν2 (δ) (CO3)2– bending vibrations. Using the empirical relation of Bartlett and Cooney (Reference Bartlett and Cooney1989), we can infer the corresponding U–Oyl bond lengths from the wavenumbers mentioned above, 1.77 Å (from ν1) and 1.79 Å (from ν3), respectively. These values are in line with most typical U6+≡O bond lengths in minerals and synthetics (Lussier et al., Reference Lussier, Lopez and Burns2016) and conform to the structure data. Shoulders at ∼ 810 (Gd) and 799 cm–1 (Nd) may relate to the deformation vibrations of SiO–H bonds. The low-intensity bands at 743 (Nd) and 740 cm–1 (Gd) can be related to the librations of H2O or ν4 (δ) CO32– in-plane bending vibration. A multi-component band, composed of overlapping bands at 569 to 490 cm–1 (Nd) and 515 to 491 cm–1 (Gd), is related either to (δ) (O–Si–O) or (δ) (Si–O–H) and librations of H2O (e.g. Colmenero et al., Reference Colmenero, Plášil and Sejkora2019). An isolated composite band centred at 423 (Nd) and 428 cm–1 (Gd) is related to the ν4 (δ) (SiO4)4–. Bands at 374 (Nd) and 366 cm–1 (Gd) are probably also assignable to (δ) (Si–O–H) and librations of H2O (Colmenero et al., Reference Colmenero, Plášil and Sejkora2019). Composite bands at ∼290 cm–1 (Nd) and 292 to 262 cm–1 (Gd) are attributed to ν2 (δ) (UO2)2+ split doubly-degenerated bending vibrations. Bands of the lowest energies have been attributed to the lattice modes.
Raman spectra of lepersonnite-(Gd) and lepersonnite-(Nd) (split at 2000 cm–1).

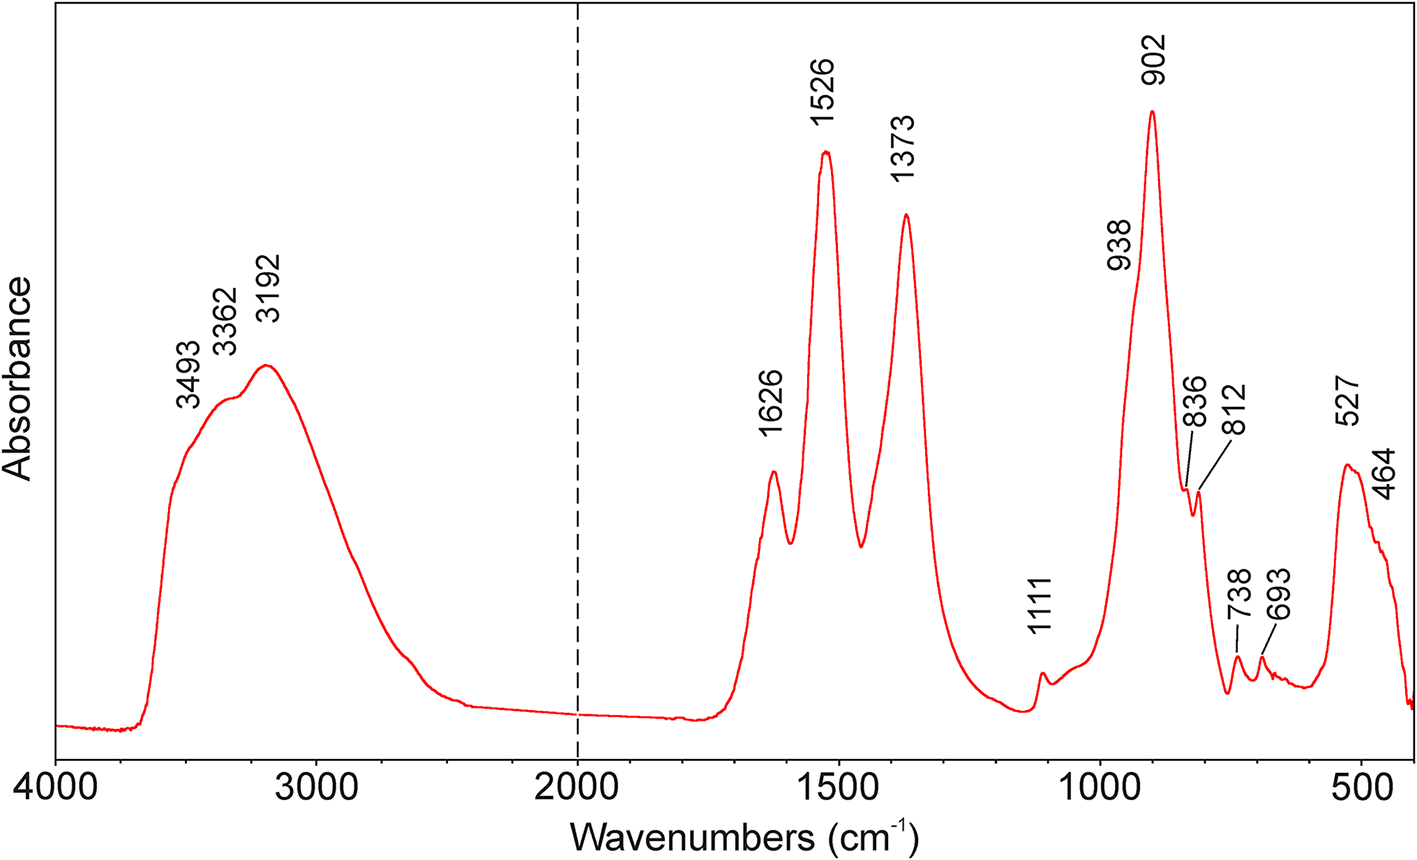
The infrared vibrational spectrum of lepersonnite-(Gd) was recorded using the attenuated total reflection (ATR) method with a diamond window on a Nicolet iS5 spectrometer at the National Museum, Prague (Czech Republic). Spectra over the 4000–400 cm–1 range were obtained by the co-addition of 64 scans with a resolution of 4 cm–1 and a mirror velocity of 0.4747 cm/s. Spectra were co-added to improve the signal-to-noise ratio. The IR spectrum of lepersonnite-(Gd) is given in Fig. 4. A strong and broad infrared band with components at 3493, 3362 and 3192 cm–1 is assigned to the ν O–H stretching vibration of hydrogen-bonded water molecules and OH groups. According to the Libowitzky (Reference Libowitzky1999) correlation function, O–H···O hydrogen-bond lengths vary from approximately 3.0 to 2.8 Å, which are comparable with values inferred from crystal structure data. A medium-strong infrared band at 1626 cm–1 is attributed to the ν2 H2O bending vibration of water molecules. Strong bands at 1526 and 1373 cm–1 are a typical manifestation of the doubly degenerate ν3 (CO3)2– antisymmetric stretching vibrations, and a weak band at 1111 cm–1 is attributed to the ν1 (CO3)2– symmetric stretching vibrations. A strong infrared band at 902 cm–1 and shoulder at 836 cm–1 are related to ν3 antisymmetric and ν1 symmetric stretching vibrations of (UO2)2+. The calculated uranyl U–O bond length (Bartlett and Cooney, Reference Bartlett and Cooney1989) of 1.78 Å is comparable with the structure data. Shoulders at 938 and 812 cm–1 may be connected with the ν3 (SiO4)4– antisymmetric stretching and ν2 (δ) (CO3)2– bending vibrations, respectively. Weak bands at 738 and 693 cm–1 are probably related to ν4 (δ) CO32– in-plane bending vibrations; however, some overlap with libration modes of H2O groups may be expected. A medium-strong band at 527 cm–1 with a shoulder at 464 cm–1 is attributed to the ν4 (δ) (SiO4)4– vibrations.
Infrared spectrum of lepersonnite-(Gd) (split at 2000 cm–1).

Crystallography and 3D ED data collection
X-ray diffraction on lepersonnite-(Nd)
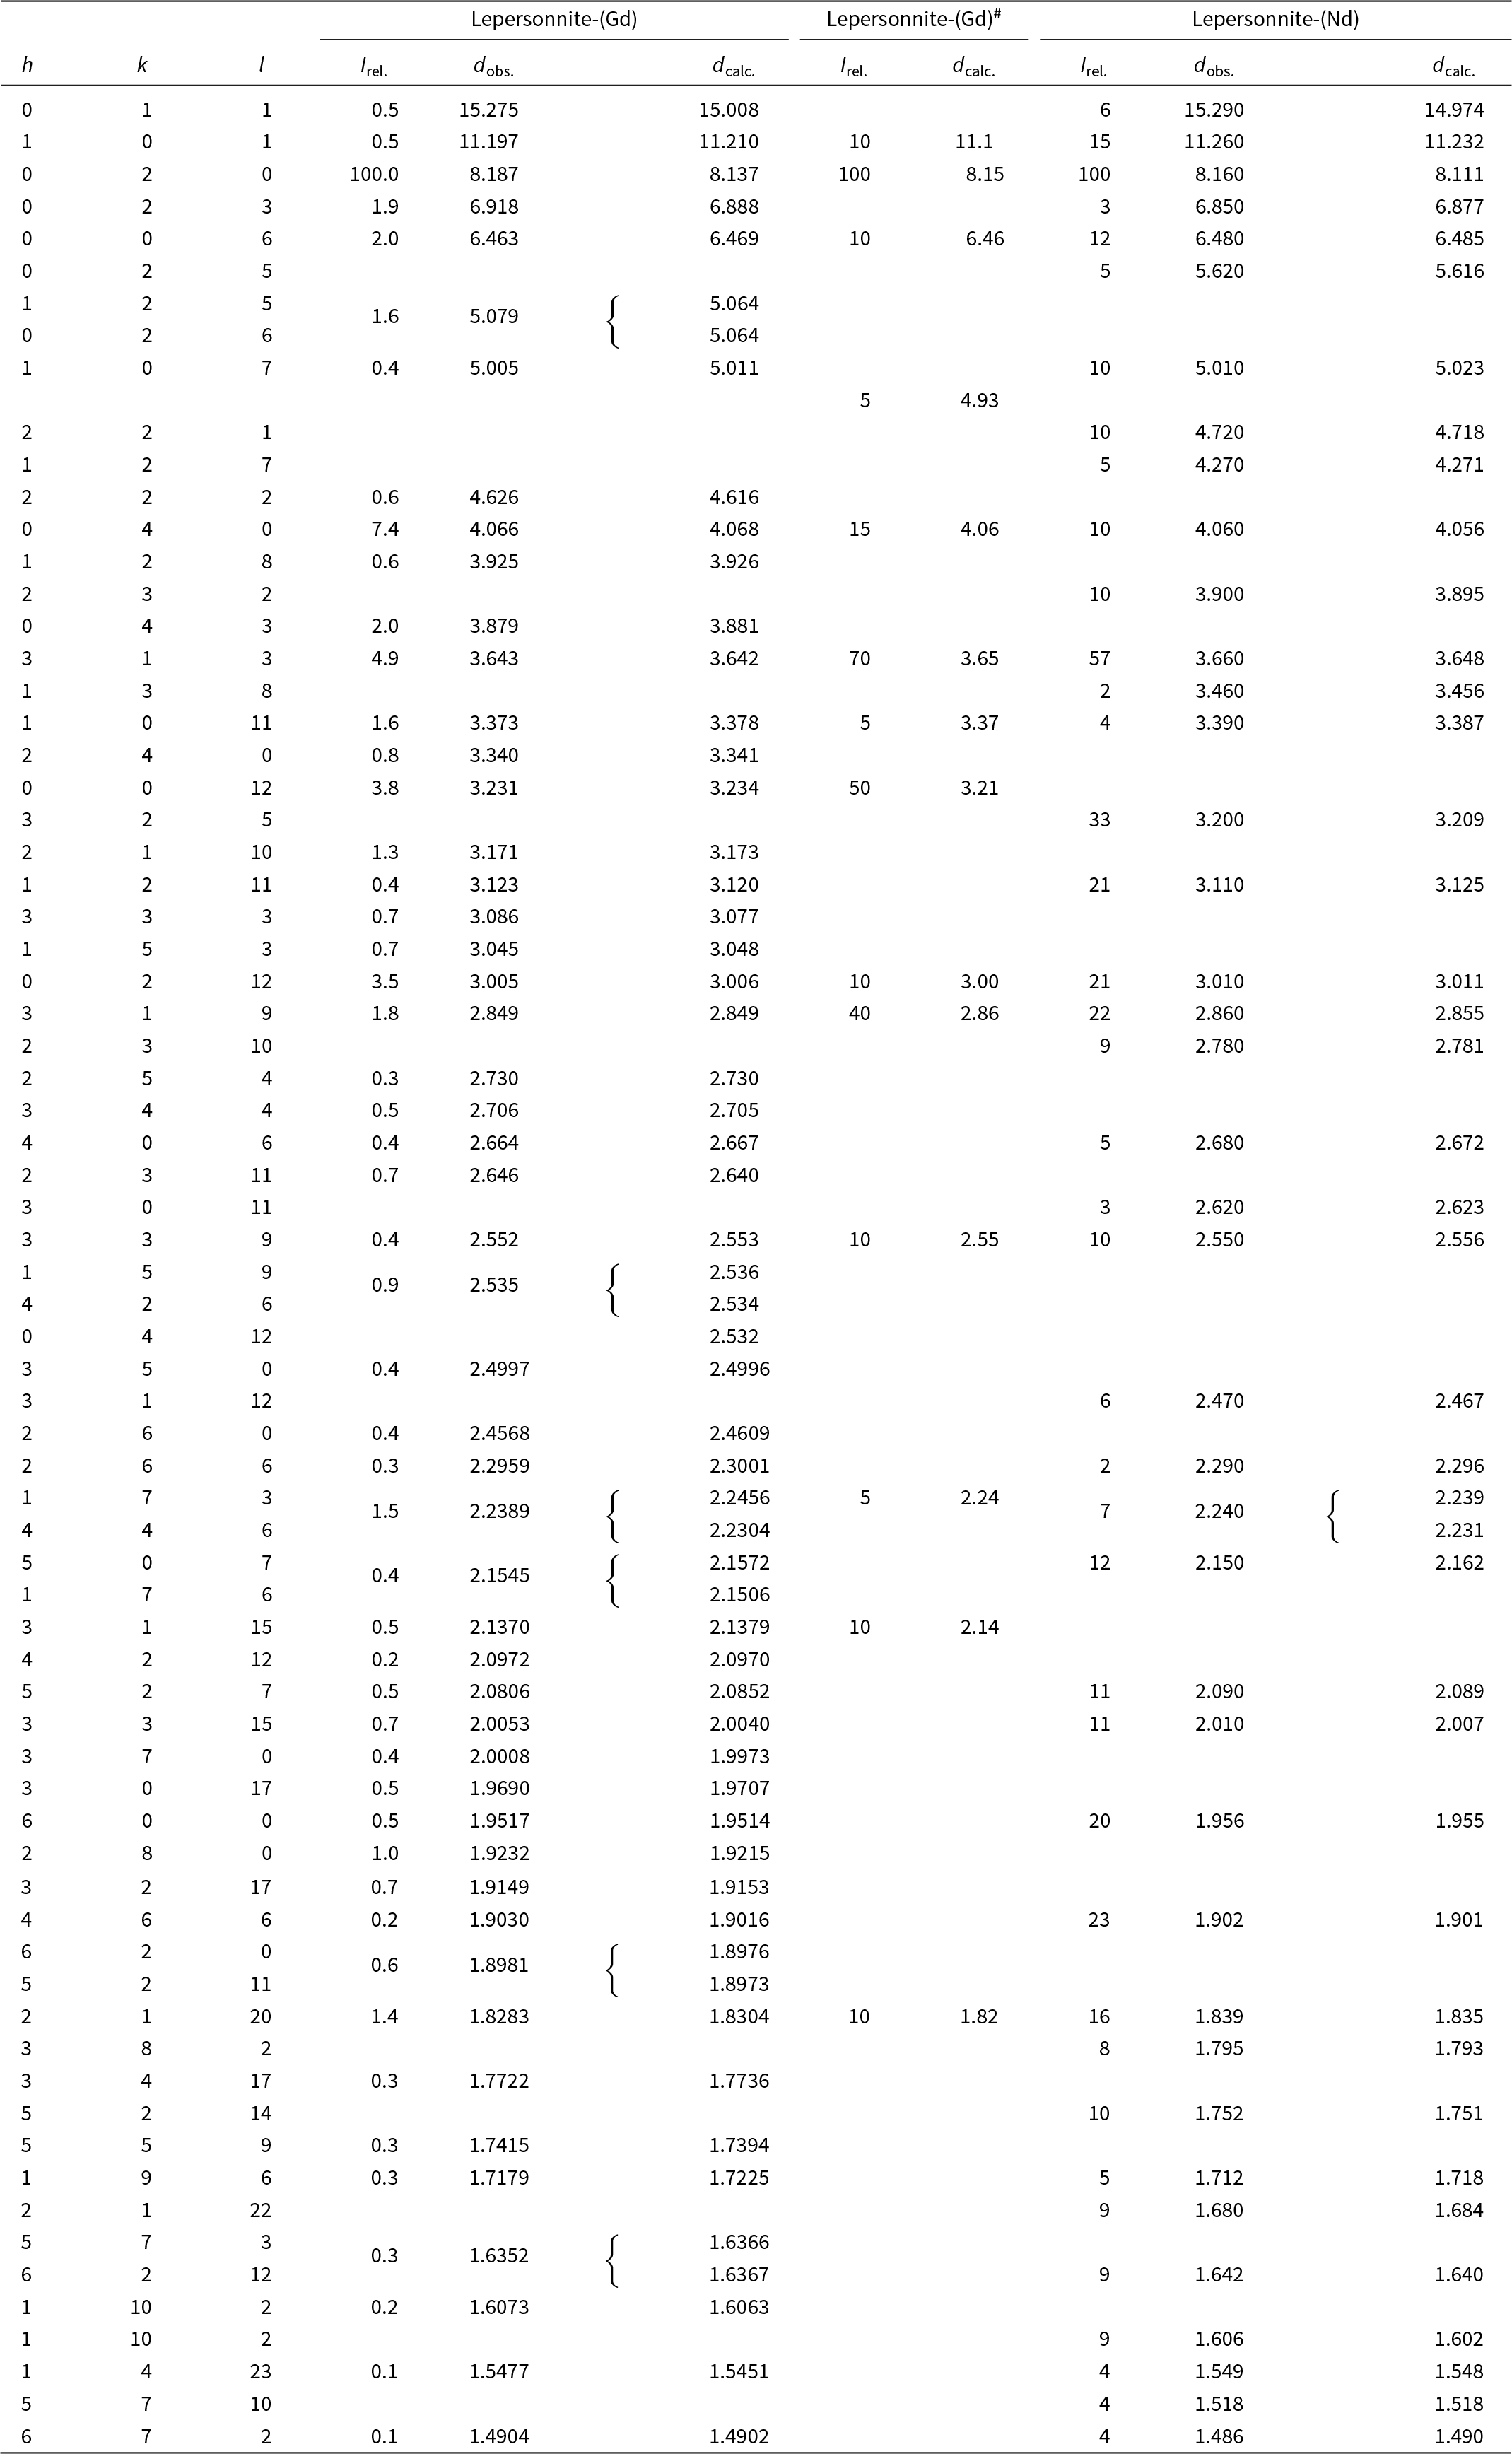
Powder X-ray diffraction (PXRD) data were recorded using a Rigaku R-Axis Rapid II curved imaging plate microdiffractometer with monochromatised MoKα radiation, at the Mineral Sciences Department, Natural History Museum of Los Angeles County. A Gandolfi-like motion on the ϕ and ω axes was used to randomise the sample. The pattern fits very well to the data given by Deliens and Piret (Reference Deliens and Piret1982) for lepersonnite-(Gd) from Shinkolobwe (Table 2). Positions and intensities of reflections were found and refined using the PearsonVII profile-shape function with the ZDS program package (Ondruš, Reference Ondruš1993) and the unit-cell parameters (Table 3) were refined by the least-squares algorithm implemented by Burnham (Reference Burnham1962).
Comparison of new powder X-ray diffraction data (d in Å) for lepersonnite-(Nd), lepersonnite-(Gd) and powder data reported originally by Deliens and Piret (Reference Deliens and Piret1982) for lepersonnite-(Gd)#

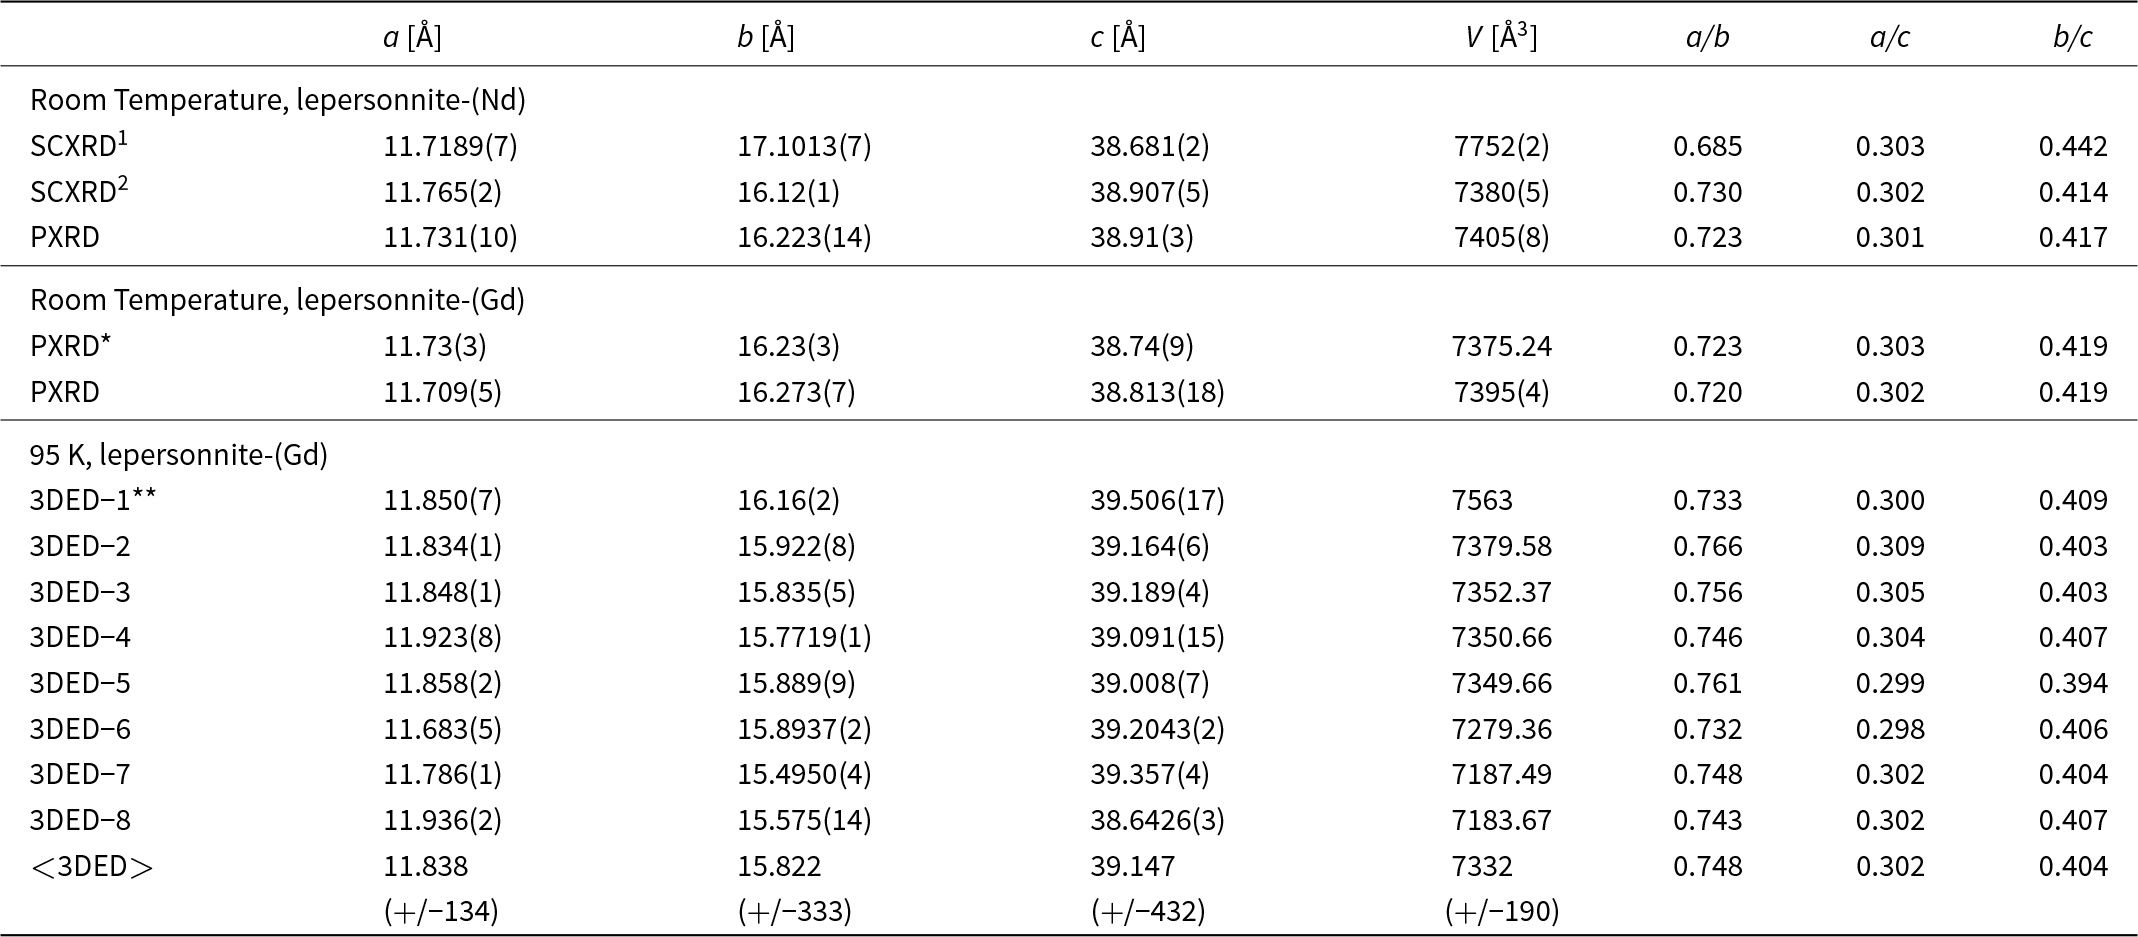
Lattice parameters of the different crystals of lepersonnite-(Gd) measured in 3D ED at 95 K. The lattice obtained from powder X-ray diffraction on the same sample and single crystal and powder X-ray data on the lepersonnite-(Nd) are likewise given

Notes: 1 – new crystal, this study; 2 – from the initial experiment (Plášil et al., Reference Plášil, Kampf, Škoda, Philippo, Guennou and Mees2021). PXRD* – Deliens and Piret (Reference Deliens and Piret1982); 3DED11** was used in the structure characterisation.
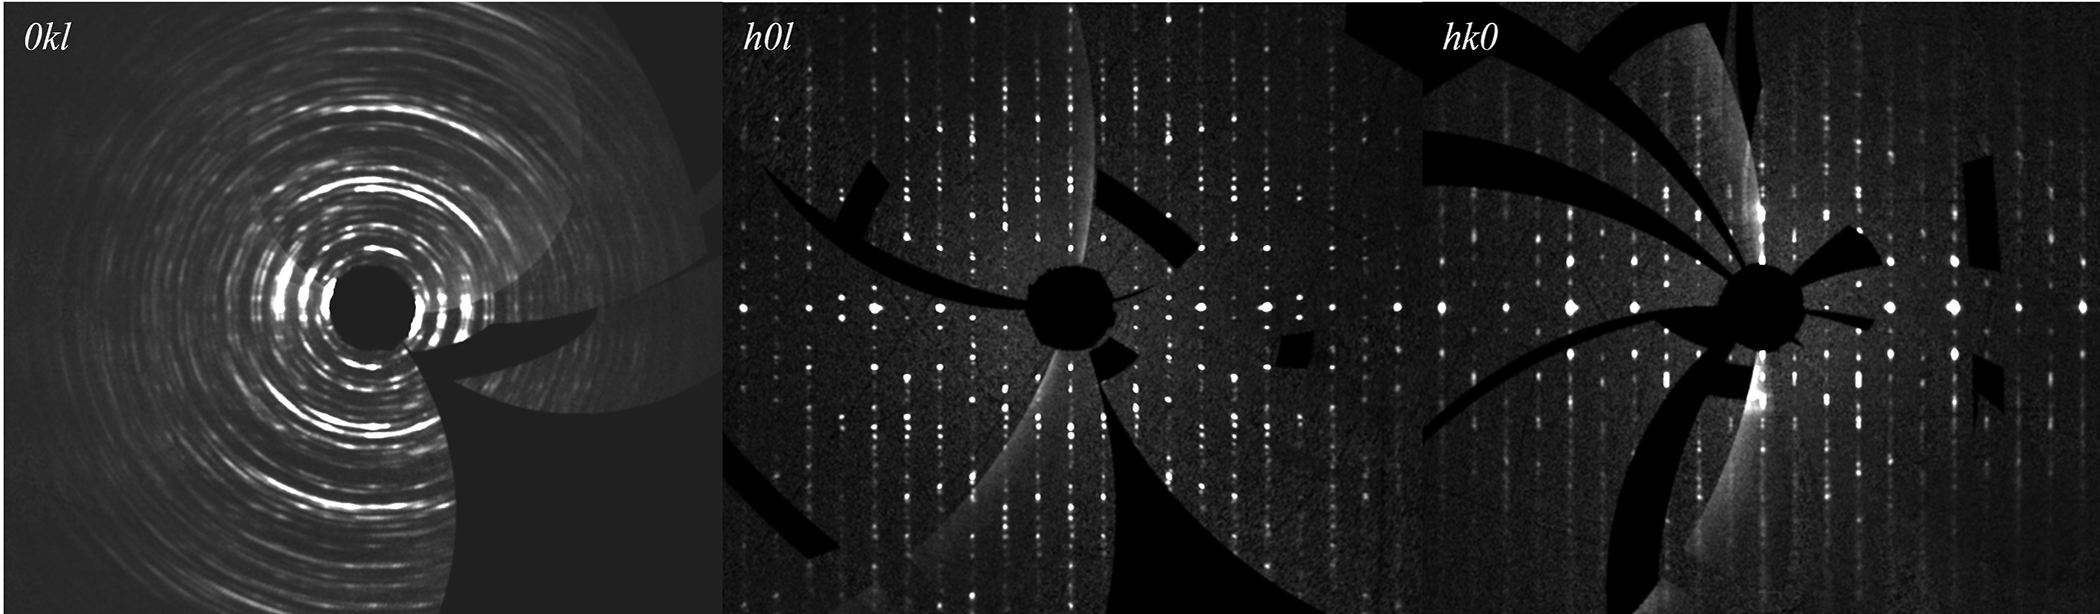
The small size, somewhat poor quality, and intergrown nature (see the discussion section) of lepersonnite-(Nd) crystals made structure determination through X-ray single-crystal diffraction study impossible. The single-crystal X-ray experiment on a Rigaku Synergy DW system at the Rigaku Application Laboratories, Rigaku Europe SE, Germany, with a 1.2 kW rotating Mo-anode and HyPix Arc 150 detector using a 115 × 8 × 1 μm crystal yielded the following unit-cell parameters based on 3855 observed reflections: a = 11.7189(7) Å, b = 17.1013(7) Å and c = 38.681(2) Å, with V = 7752(2) Å3. The corresponding reciprocal-space reconstructions (UNWARP) obtained from the diffraction data by the CrysAlis software (Rigaku, 2023) are provided in Fig. 5.
Sections of the reciprocal space for lepersonnite-(Nd) reconstructed from the single-crystal X-ray diffraction data.

X-ray diffraction on lepersonnite-(Gd)
Powder X-ray diffraction data were collected on a Bruker D8 Advance diffractometer at the National Museum, Prague (Czech Republic) with a solid-state 1D LynxEye detector using CuKα radiation and operating at 40 kV and 40 mA. The powder pattern was collected using Bragg–Brentano geometry in the range 2.5–70°2θ, in 0.01° steps with a counting time of 20 s per step. Positions and intensities of reflections were found and refined using the PearsonVII profile-shape function with the ZDS program package (Ondruš, Reference Ondruš1993). The pattern corresponds very well to published data for lepersonnite-(Gd) (Deliens and Piret, Reference Deliens and Piret1982) and measured data for lepersonnite-(Nd) (Table 2). Unit-cell parameters refined from the powder data using Burnham’s (Reference Burnham1962) program based on the least-squares algorithm are given in Table 3.
The small size, somewhat poor quality, and intergrown nature (see the discussion section) of lepersonnite-(Gd) crystals also made structure determination through X-ray single-crystal diffraction study impossible.
3D ED data collection for lepersonnite-(Gd)
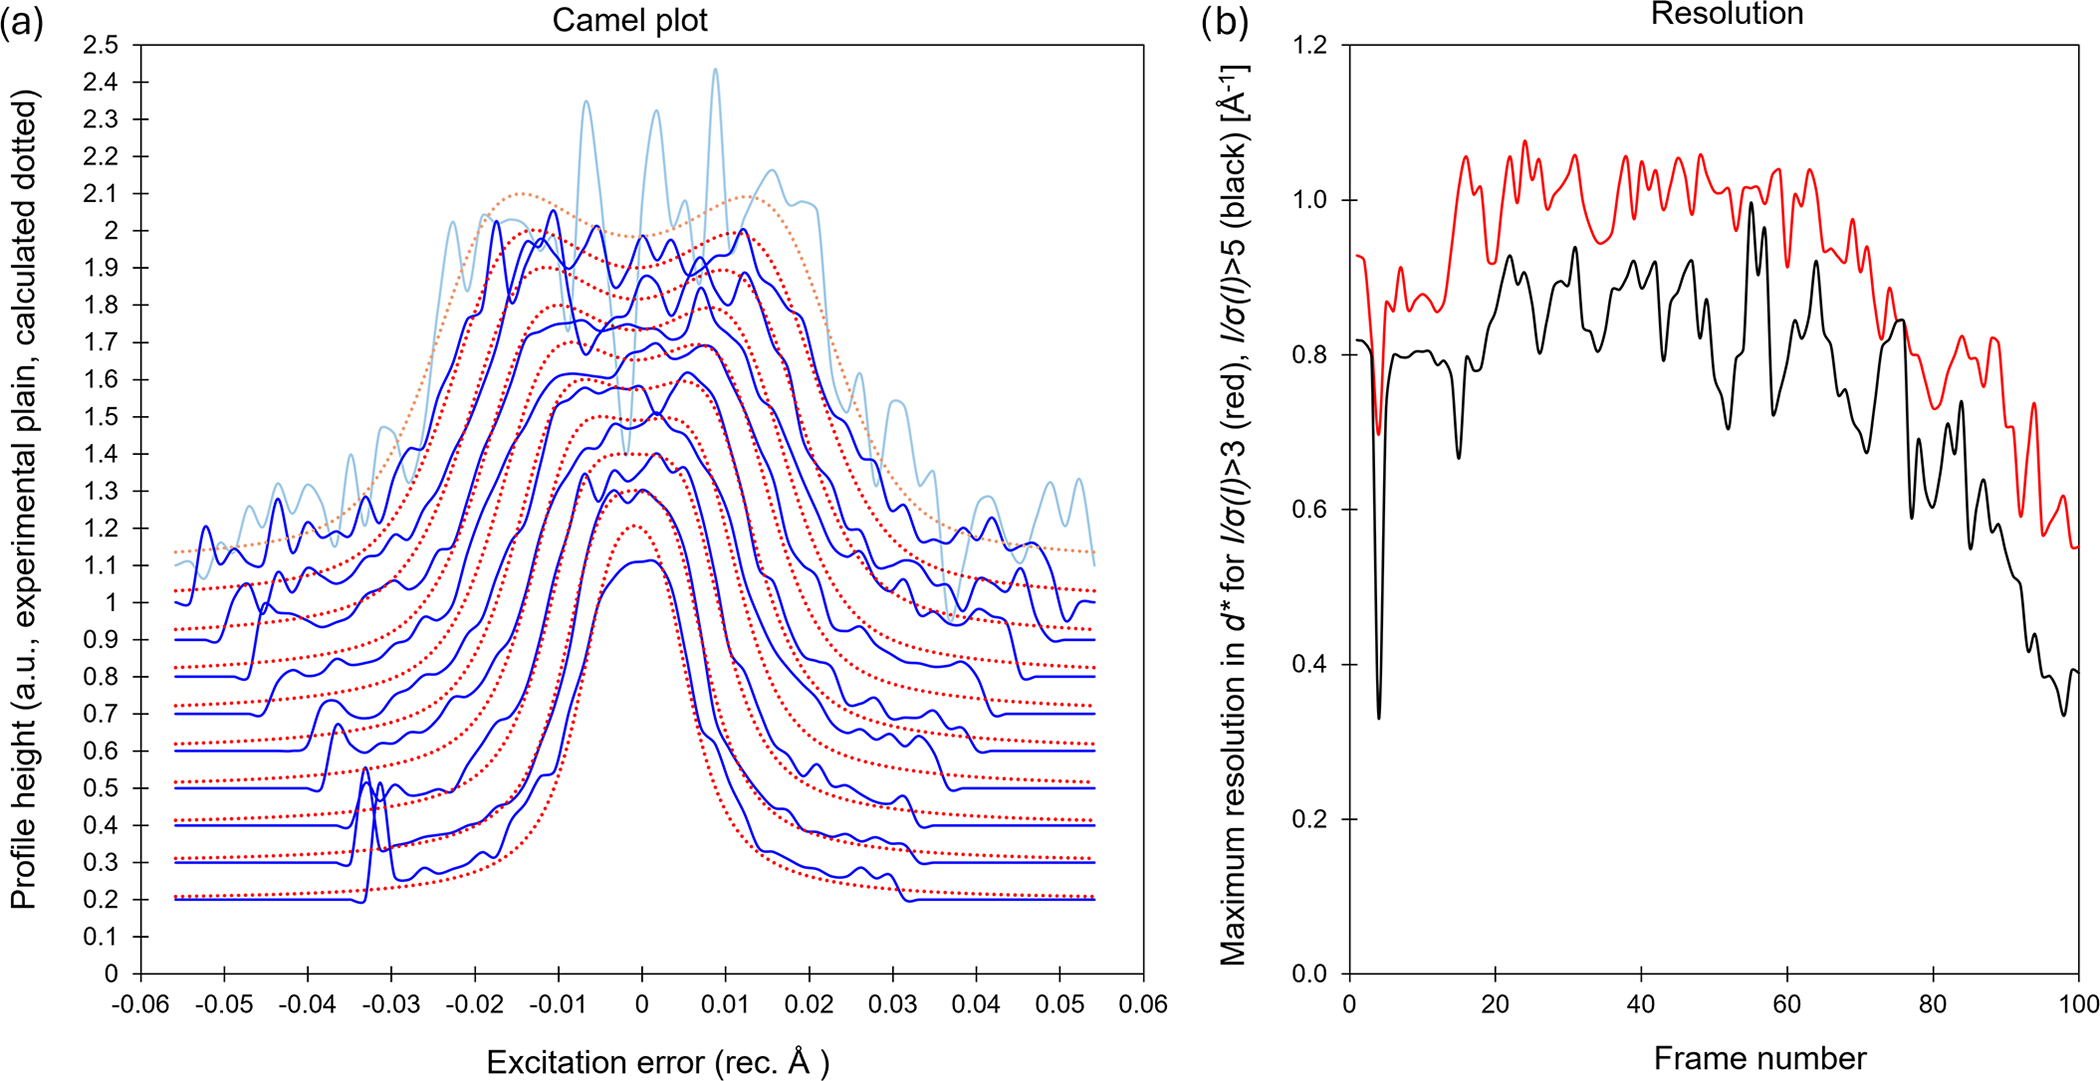
To obtain data for the determination of the crystal structure of lepersonnite-(Gd), three-dimensional electron diffraction (3D ED) was used (Gemmi and Lanza, Reference Gemmi and Lanza2019; Gemmi et al., Reference Gemmi, Mugnaioli, Gorelik, Kolb, Palatinus, Boullay, Hovmöller and Abrahams2019). For TEM analysis, a powdered portion of the lepersonnite-(Gd) sample was diluted in acetone and deposited on a Cu-grid coated by a thin film of holey amorphous carbon. 3D ED data were collected with a FEI Tecnai G2 20 transmission electron microscope (TEM) (Institute of Physics of the CAS, Prague) (acceleration voltage of 200 kV and LaB6) equipped with a side-mounted hybrid single-electron detector ASI Cheetah M3, 512 × 512 pixels with high sensitivity and a fast readout. To preserve the hydrated structure of the mineral under the high vacuum in the instrument, the grid was plunged into liquid nitrogen and transferred to the TEM using a Gatan cryo-transfer holder. The PEDT technique (tilt step = 1° and precession semi-angle = 1°) was chosen to reduce the dynamical effects further and to obtain dynamical intensities, using the Nanomegas Digistar precession device (Vincent and Midgley, Reference Vincent and Midgley1994). Each dataset was collected at 95 K from several single crystals (Fig. 6a,b). To limit the beam-induced damage to the crystals, low illumination settings were used. 3D ED data reduction was performed using the computer program PETS2 (Palatinus et al., Reference Palatinus, Brázda, Jelínek, Hrdá, Steciuk and Klementová2019; Brázda et al., Reference Brázda, Klementová, Krysiak and Palatinus2022; Khouchen et al., Reference Khouchen, Klar, Chintakindi, Suresh and Palatinus2023). The structural analysis was performed from the best dataset (3DED-1 in Fig. 6b), which presents the most ordered stacking associated with the highest data coverage, the lowest Rocking curve width and the lowest apparent mosaicity of the crystal (Fig. 6). For each 3D ED dataset, the data reduction yielded two hkl-type files. The first one assumes the kinematical approximation (for structure solution and the so-called kinematical refinement) with Rint(obs/all) = 0.1979/0.2955 and 95% coverage for sinθ/λ = 0.6Å–1 (Laue class mmm). The second hkl-type output file is dedicated to the dynamical refinement where all frames of the data set are independently refined. The structure was solved assuming the kinematical approximation using Superflip (Palatinus and Chapuis, Reference Palatinus and Chapuis2007; Palatinus, Reference Palatinus2013) implemented in Jana2020 (Petříček et al., Reference Petříček, Palatinus, Plášil and Dušek2023). The refinement considering the dynamical theory of diffraction was carried out through DYNGO in Jana2020 (Palatinus et al., Reference Palatinus, Corrêa, Steciuk, Jacob, Roussel, Boullay, Klementová, Gemmi, Kopeček, Domeneghetti, Cámara and Prtříček2015a, Reference Palatinus, Petříček and C.A2015b).
(a) Plots of the rocking-curve profiles (Camel plot) of the experimental 3D ED data at 95 K (3DED-1). The lowest blue curve is the averaged observed rocking curve in the range of 0.2 to 0.3 Å−1, and those subsequent are obtained by steps of 0.1 Å−1. The red curves are calculated from the Rocking curve width = 0.00250 Å–1, apparent mosaicity = 0.25°, and precession semi-angle = 1°. Reflections considered in the Camel plot have I > 7*σ(I). (b) Plot showing the peak of highest resolution in reciprocal space (Å–1) for each frame (red: d* for I/σ(I)>3, black: d* for I/σ(I)>5).

Structure solution and refinement
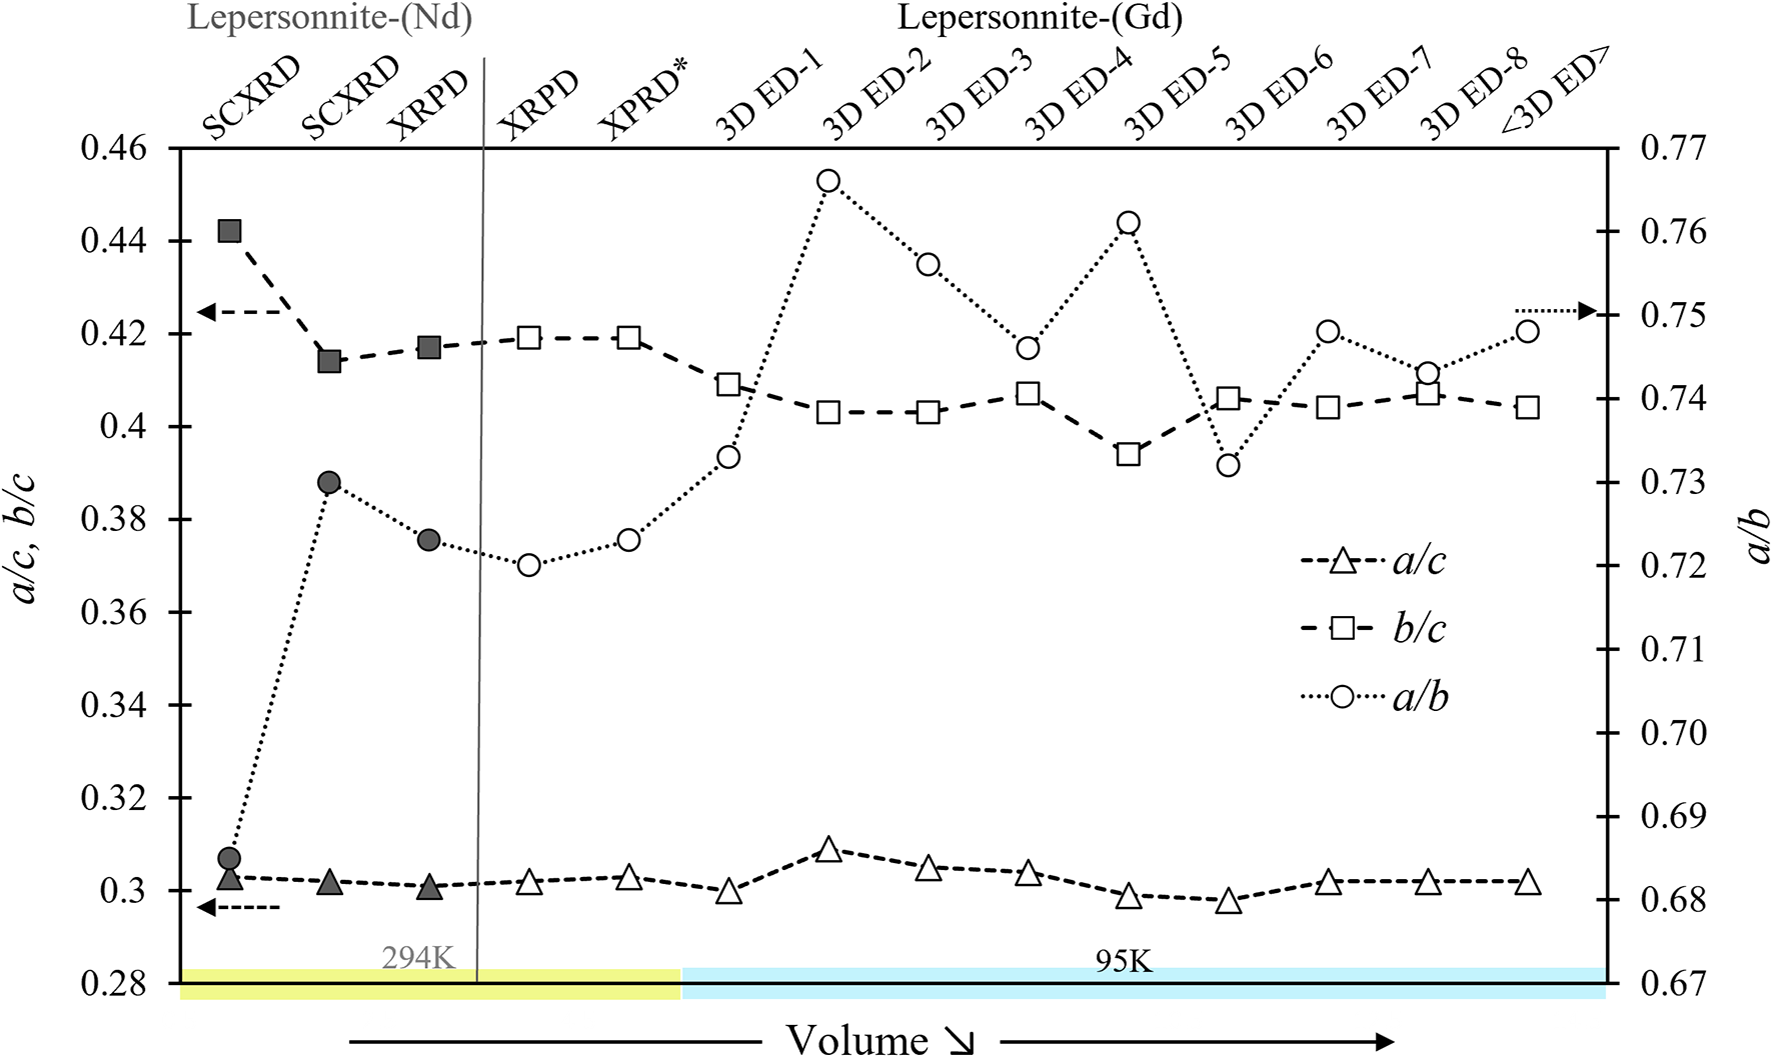
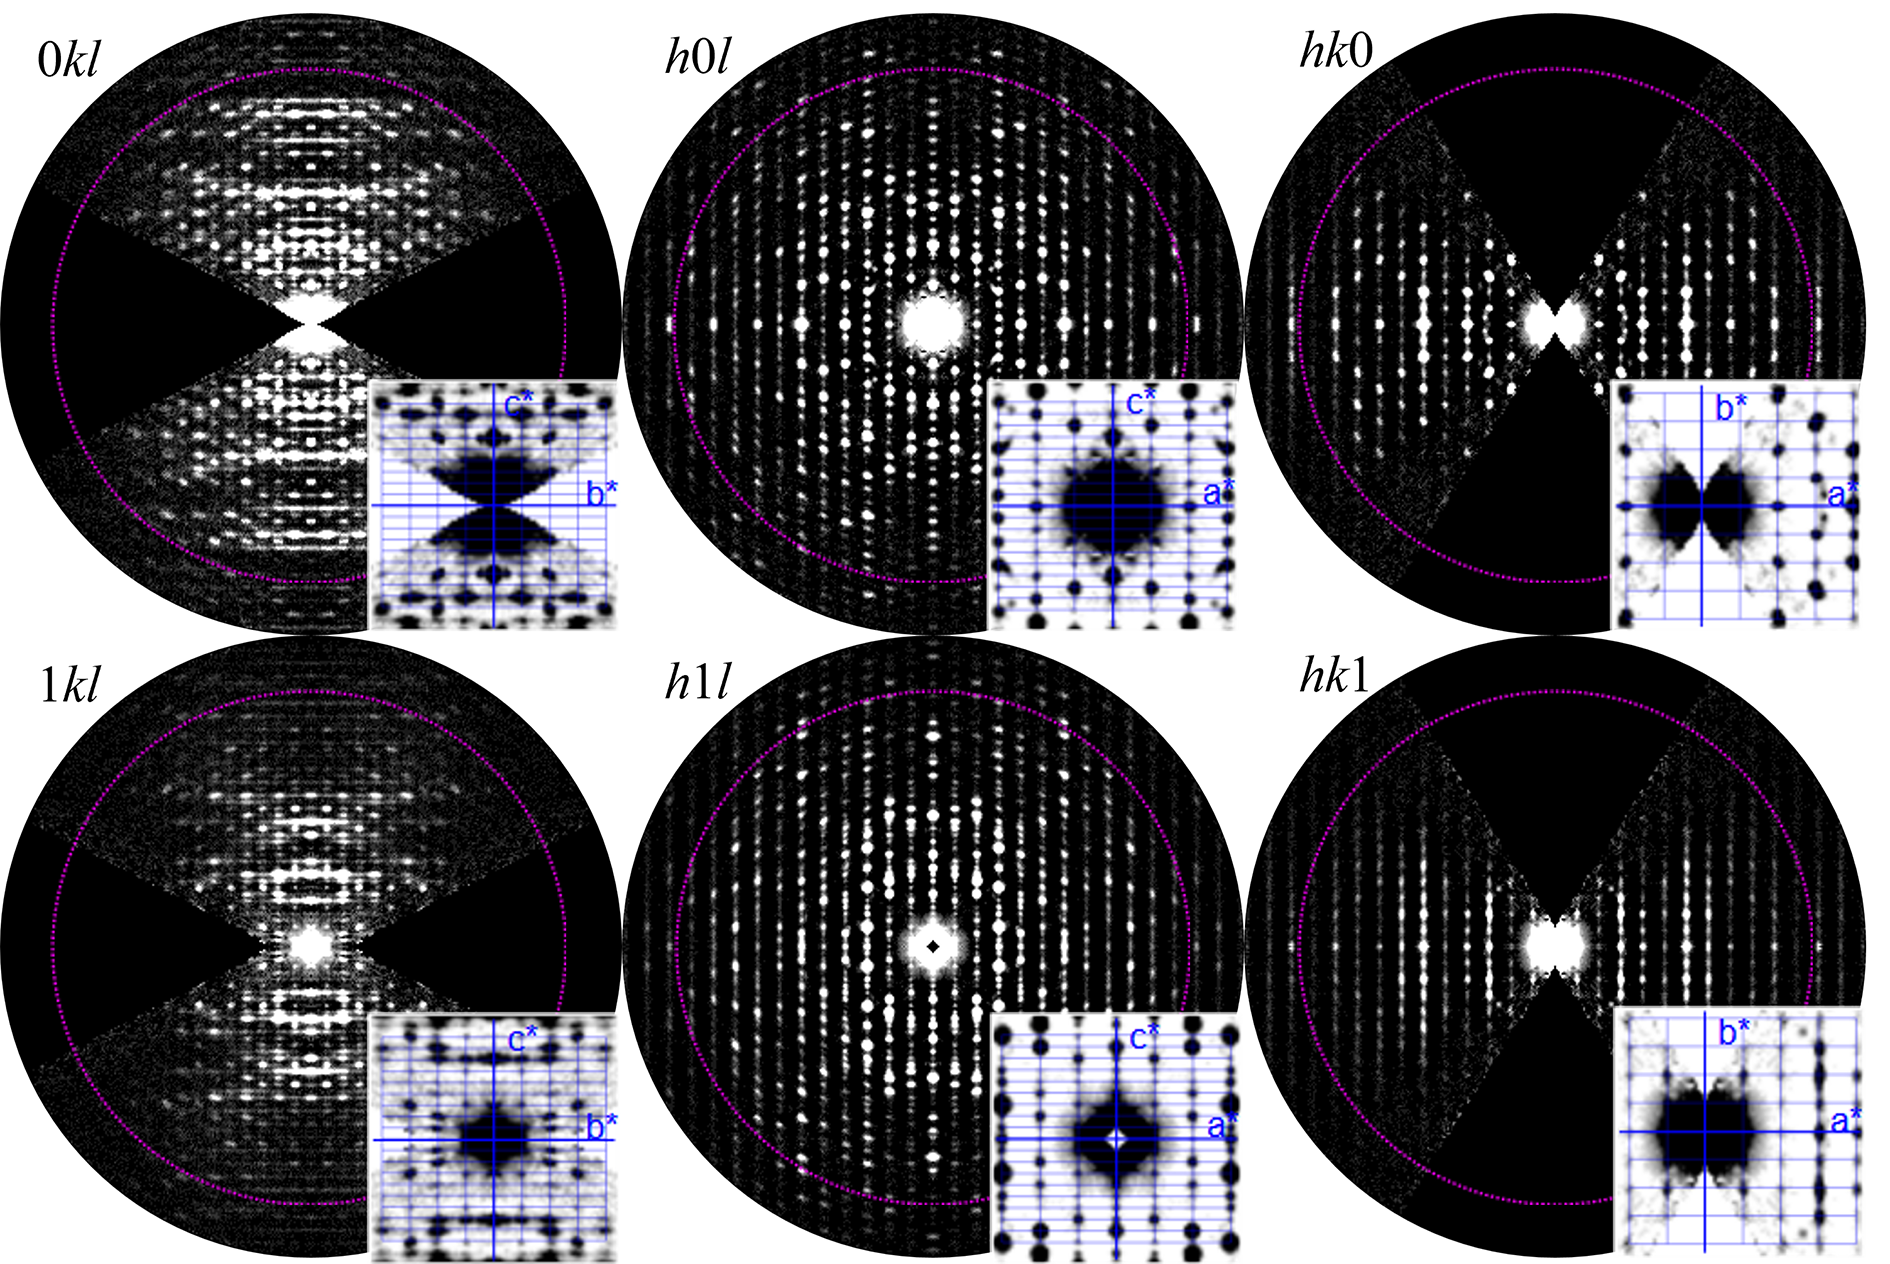
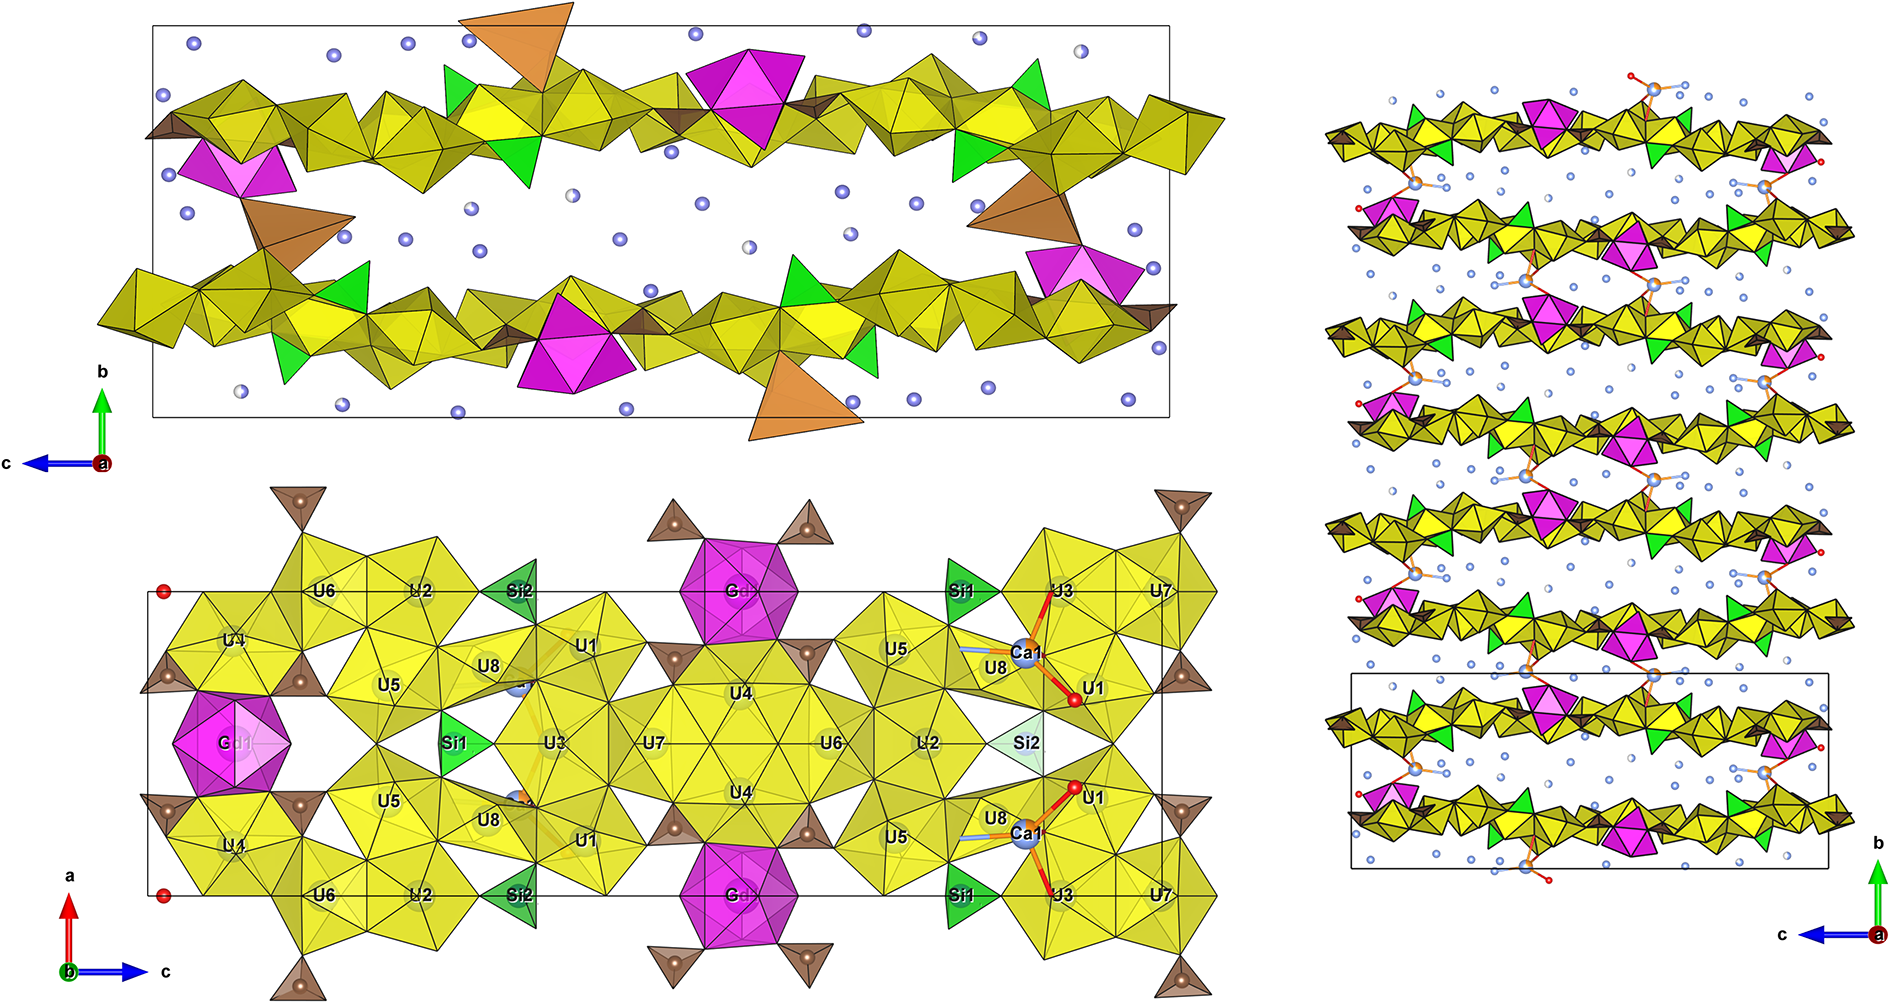
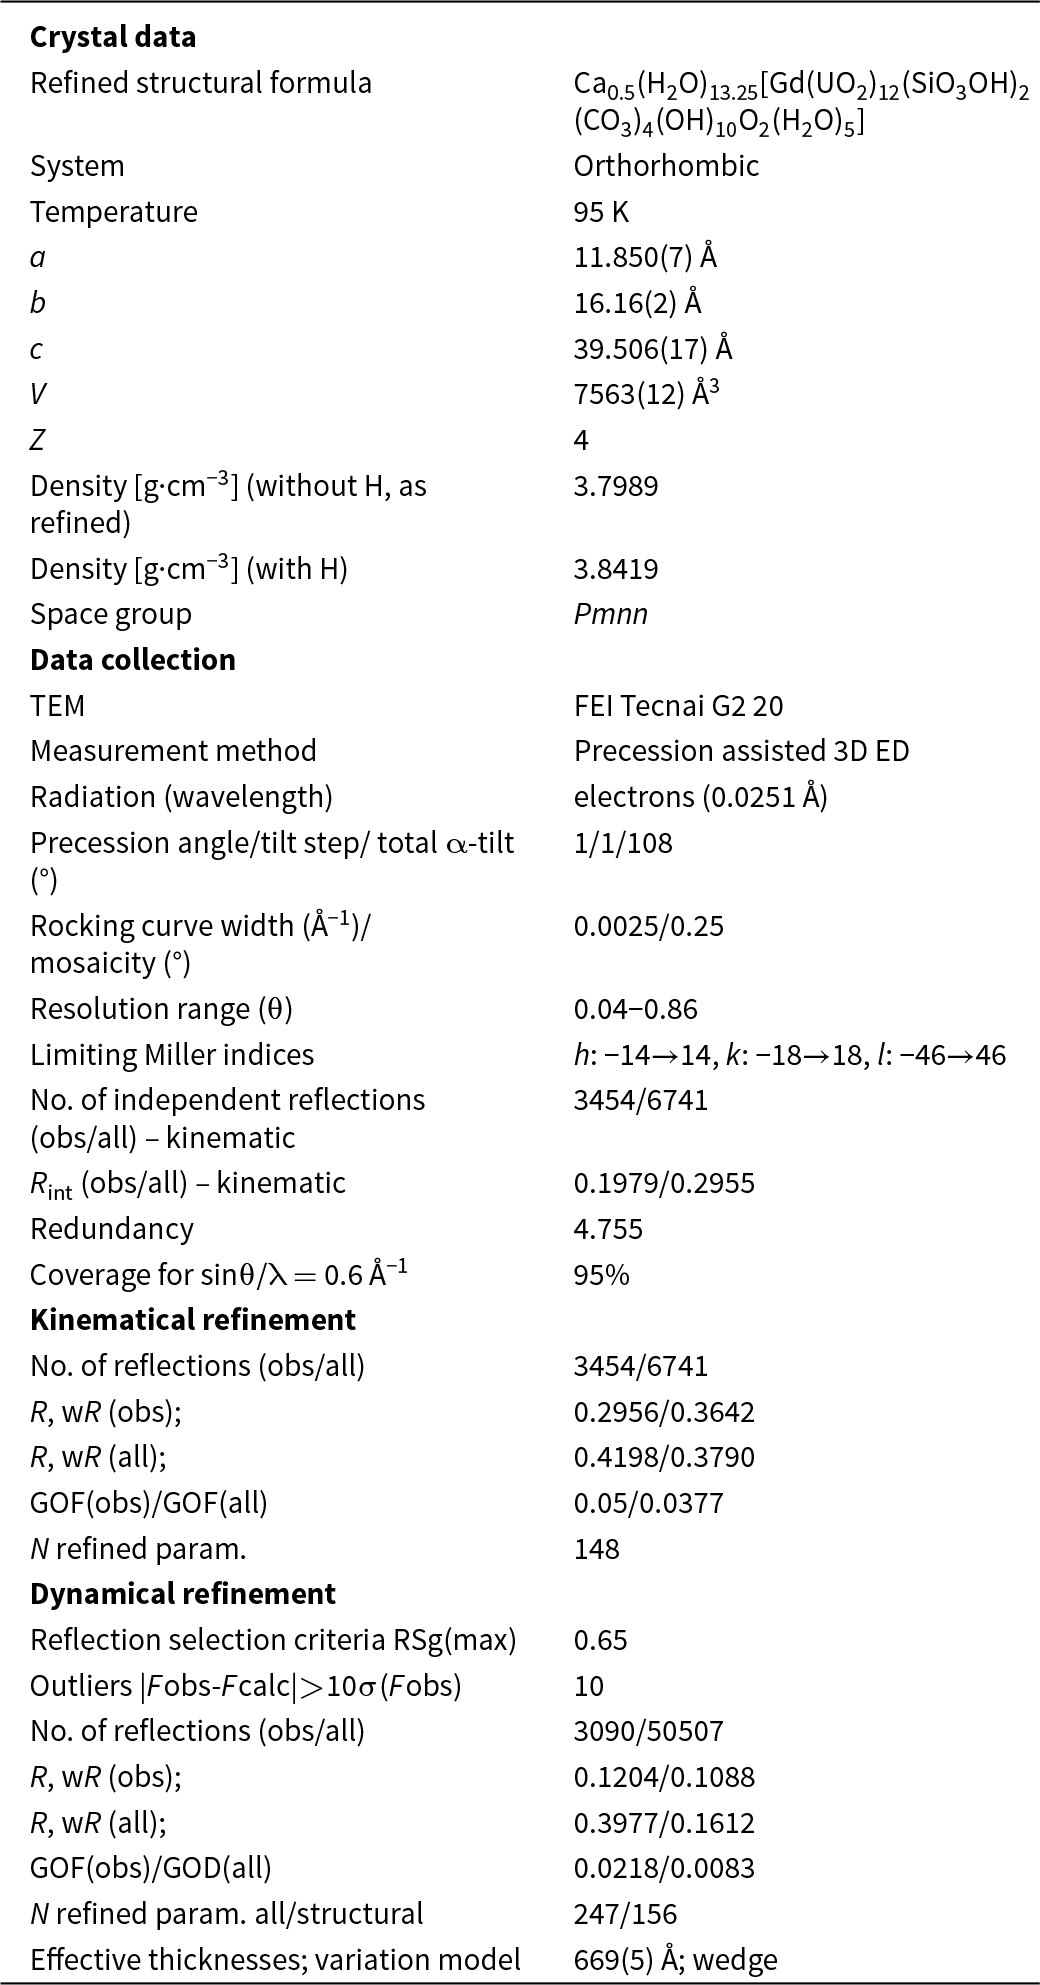
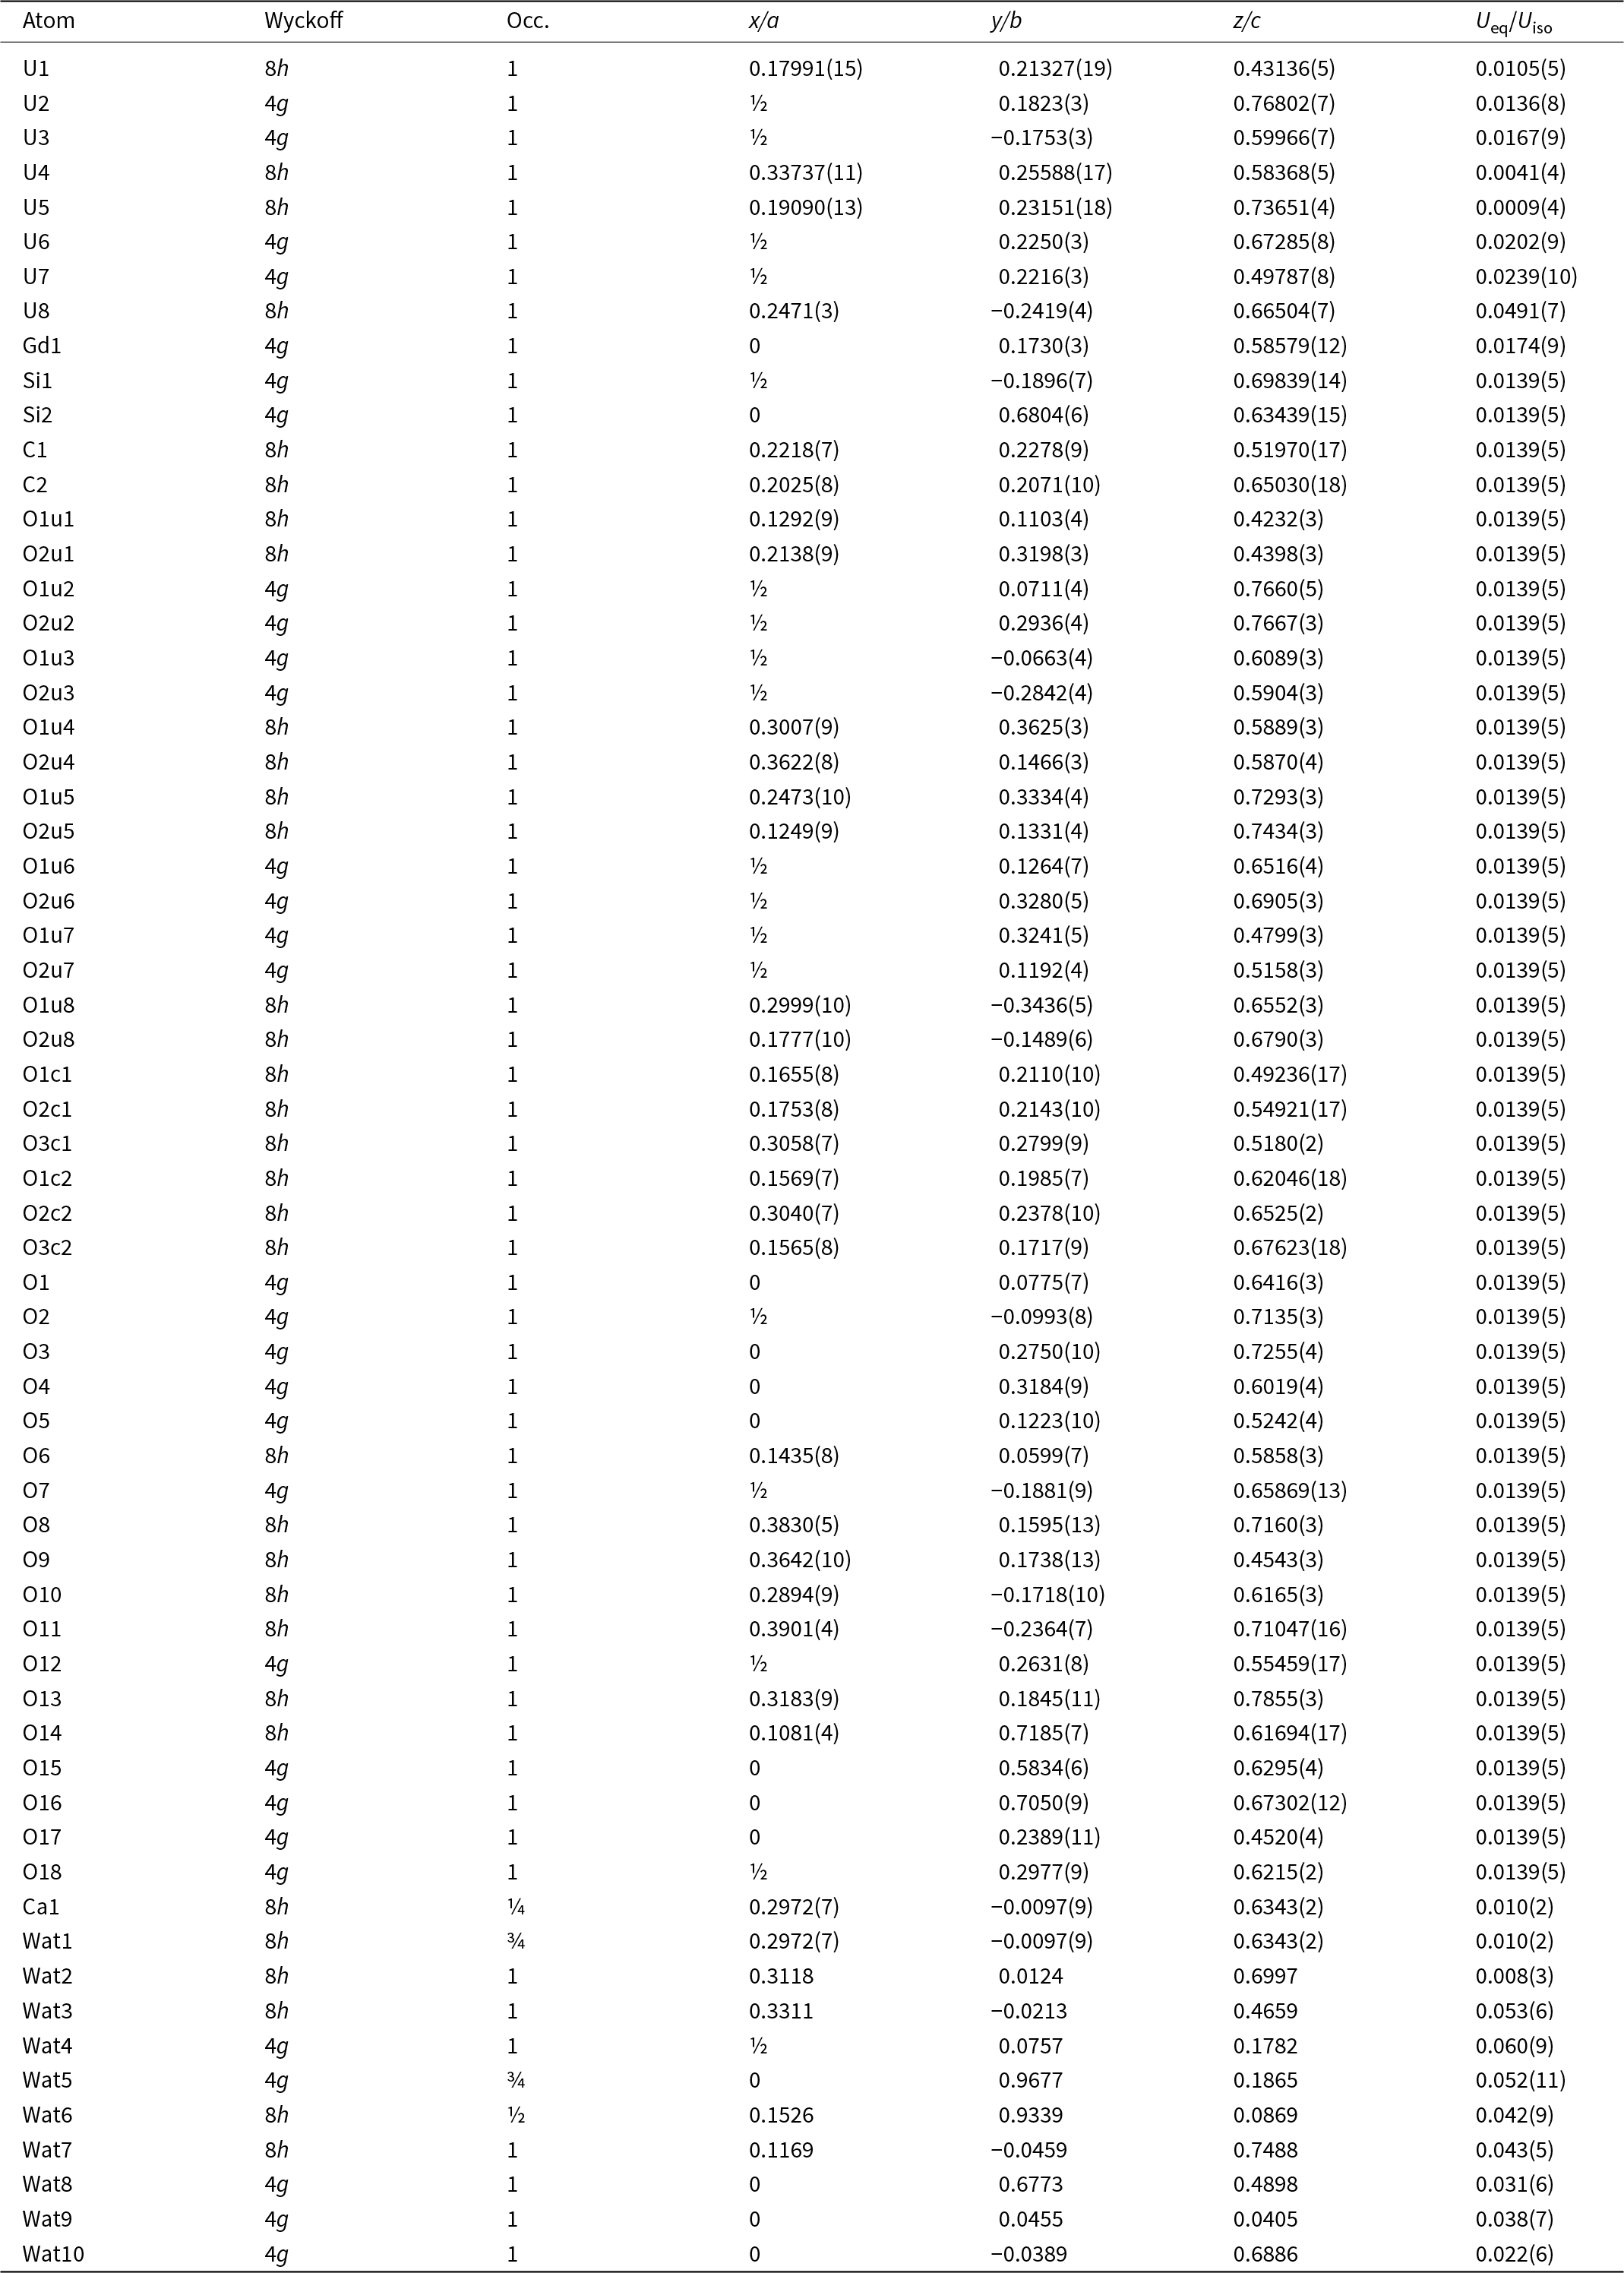
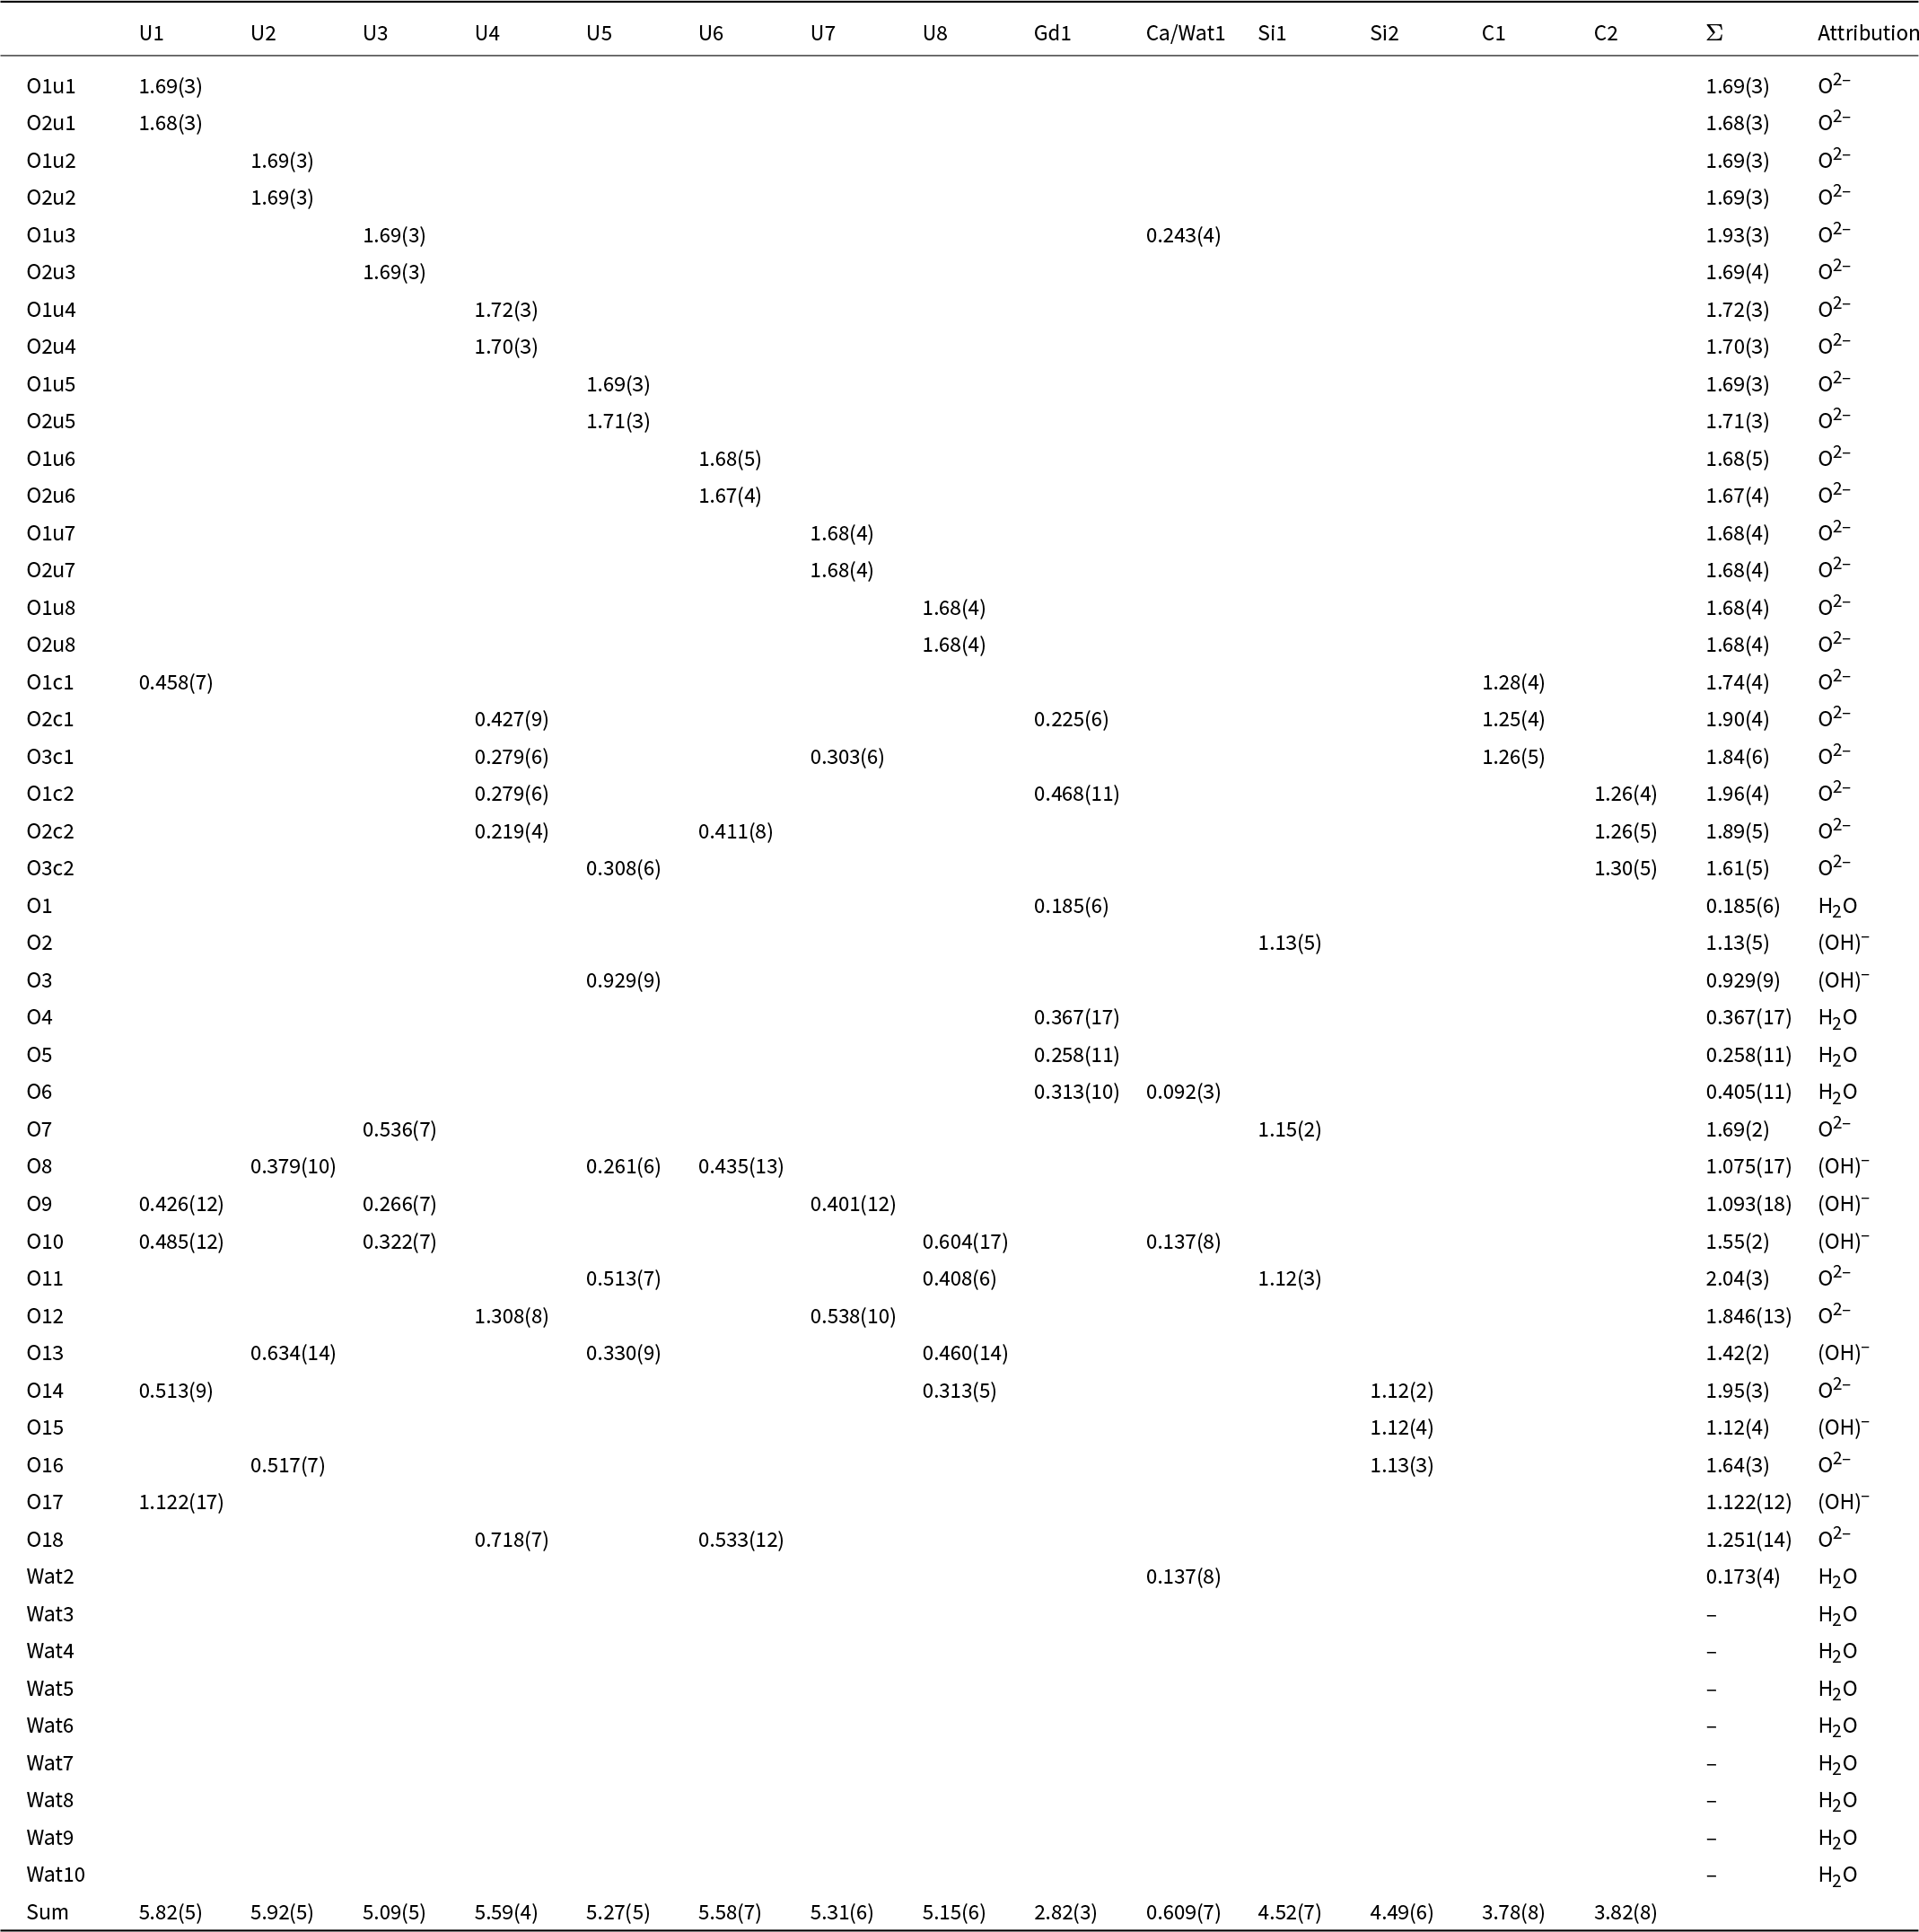
From single-crystal ED data obtained at 95 K, the best indexing choice is the orthorhombic unit cell a = 11.838 ± 0.134 Å, b = 15.822 ± 0.333 Å, c = 39.147 ± 0.190 Å and V = 7353 ± 282 Å3. The individual lattice parameters and the lattice ratio for each measured crystal are provided in Table 3 and Fig. 7, demonstrating significant dispersion across the sample while maintaining the same structure. Most crystals showed strong disorder along the stacking direction [010] and along [100], as evidenced by the single-crystal data obtained from lepersonnite-(Nd), leading to an ambiguous space group determination (compare Figs 5 and 8). The symmetry analysis and structure characterisation relies on the most ordered crystals. Sections through reciprocal space show a possible space group to be Pmnn, despite a noisy 0kl and above sections (h+l = 2n on h0l, k+l = 2n on hk0, h00: h = 2n, 00l: l = 2n, 0k0 was not visible in our data) (Fig. 8). Only a few 3D ED datasets collected on different single crystals were suitable for structure solution (and kinematical refinement). The 3DED-1 dataset was selected based on good data coverage and on the criteria for refinement using the dynamical theory of diffraction, i.e. reasonable values for Rocking curve width = 0.00250 Å–1 and apparent mosaicity = 0.25° (Fig. 7). The two values are nevertheless not ideal and were affected by the rather poor crystallinity and stacking disorder. The structure was solved ab initio from a data set with 95% completeness up to a resolution of sin(θ)/λ = 0.6 Å–1. The completeness is limited due to the (010) preferred orientation of the crystals on the grid and the incomplete rotation of the goniometer. The initial model revealed a layered structure with alternating high-density layers connected along the stacking direction [010], mainly through hydrogen bonds with interlayer water molecules. The dense layers are composed of predominantly uranyl cations (O=U=O)2+ in pentagonal and hexagonal bipyramids, two SiO3(OH) tetrahedra and one Gd polyhedron. A partially occupied Ca site was found among the water molecules bridging the two dense layers. The water molecules were added during the refinement and are mostly partially occupied. The dynamical refinement converged to R(obs)/wR(obs) = 0.1204/0.1088, R(all)/wR(all) = 0.1204/0.1088 for 3090/50507 observed/all reflections and 247 refined parameters. Few distance restrictions were applied to the model during the refinement to compensate for the inaccuracy brought by the diffuse scattering along b: The U–Oyl distances were set at ∼1.8 (0.004) Å, while the C–O and the O–O distances of the carbonate groups were maintained at ∼1.3 (0.005) Å and 2.25 (0.005) Å, respectively. Additionally, a few additional O–O distances were restricted to 2.8 (0.015) Å. For a comparison, the kinematical refinement gives R(obs)/wR(obs) = 0.2956/0.3642, R(all)/wR(all) = 0.4198/0.3790 and 3454 observed reflections. The R-values decreased significantly when the dynamical theory was applied; however, they remained higher than usual because of the imperfect ordering and the high mosaicity of the crystal, as observed in other layered highly hydrated minerals (Steciuk et al., Reference Steciuk, Škoda, Rohlíček and Plášil2020, Reference Steciuk, Sejkora, Čejka, Plášil and Hloušek2021, Reference Steciuk, Majzlan, Rohlíček, Škoda, Sejkora and Plášil2024). The formula derived from 3D ED is Ca0.5(H2O)13.25[Gd(UO2)12(SiO3OH)2(CO3)4(OH)10O2(H2O)5] (Z = 4). Hydroxyl and water molecule oxygen atoms were deduced from the bond-valence analysis. The data quality did not allow localisation of the hydrogen atoms. Further refinement details are given in Table 4, positional parameters are given in Table 5, and the bond-valence analysis was performed using the bond-valence parameters of Gagné and Hawthorne (Reference Gagné and F.C2015) in Table 6. The crystal structure of lepersonnite-(Gd) is displayed in Fig. 9. The crystallographic information file was deposited in the CCDC database under the deposition number 2417019, and is also available as Supplementary material (see below).
Lattice parameter ratios of lepersonnite-(Nd) (grey) and lepersonnite-(Gd) (white) measured by different X-ray diffraction techniques (single-crystal, powder diffraction, and 3D ED at 294 K or 95 K). Measurements are sorted by decreasing volume (Table 3).

Sections of the reciprocal space reconstructed from 3D ED data collected on a crystal of lepersonnite-(Gd) at 95 K.

Crystal structure of lepersonnite-(Gd) represented by uranyl coordination polyhedra (UO7 and UO8 = yellow), Si-tetrahedra (green), CO3 groups (dark brown), Gd3+-polyhedra (violet) and Ca2+-polyhedra (orange). Infinite sheets containing uranyl polyhedra (structural units) are stacked perpendicular to b; the overview of the stacking configuration is given in the last picture (8 individual layers). Structure drawing by Vesta program (Momma and Izumi, Reference Momma and Izumi2011).

Summary of 3D ED data collection and refinements for lepersonnite-(Gd)

Atom positions, occupational factors (Occ.) and atomic displacement parameters for the lepersonnite-(Gd)

Bond-valence analysis for the lepersonnite-(Gd) structure (values given in valence units)

Crystal structure of lepersonnite-(Gd)
The structure of lepersonnite-(Gd) contains eight symmetrically distinct U sites, one Gd, two Si, two C, 41 O sites and 10 O sites in the interlayer belonging to H2O groups. One of the H2O groups is bonded to the Ca site. The structure consists of wave-like sheets stacked along [010] (Fig. 9). All U in the structure was found to be in the hexavalent state as the uranyl (UO2)2+ cation. Six of the eight U atoms are coordinated as pentagonal uranyl bipyramids. One U site is present as a hexagonal bipyramid sharing edges with two carbonate groups, yielding a uranyl bicarbonate complex, [(UO2)O2(CO3)2]6–. Gadolinium is in [8]-coordination with four oxygen sites of the carbonate groups on the equatorial plane (a,c) and four out-of-plane H2O molecules. Within the sheet, (UO2)O2(CO3)2, (UO2)O5 and GdO4(H2O)4 polyhedra are connected through edges, creating some space to host SiO3(OH) tetrahedra bonded to uranyl polyhedra via three corners. The longer Si–OH bond points towards the interlayer. The sheets are slightly wavy, and their stacking forms an interlayer ranging from ∼2.7 Å to ∼5.8 Å thick. The Ca site was identified during the refinement as a mixed O/Ca site in the interlayer, where two neighbouring uranyl sheets (structural units) are at the closest distance. Even though it seems to create a bridge between adjacent layers, the Ca site is only partially occupied. Therefore, most connectivity between layers occurs via hydrogen bonds between the two H2O molecules bonded to Gd3+ and the apical oxygen of one uranyl ion of the layer above. The interlayer also hosts water molecules that contribute, to a lesser extent, to the connectivity. The weak bonding between layers explains the disorder observed in most diffraction patterns.
Topology of the structural units and structural complexity of lepersonnite-(Gd)
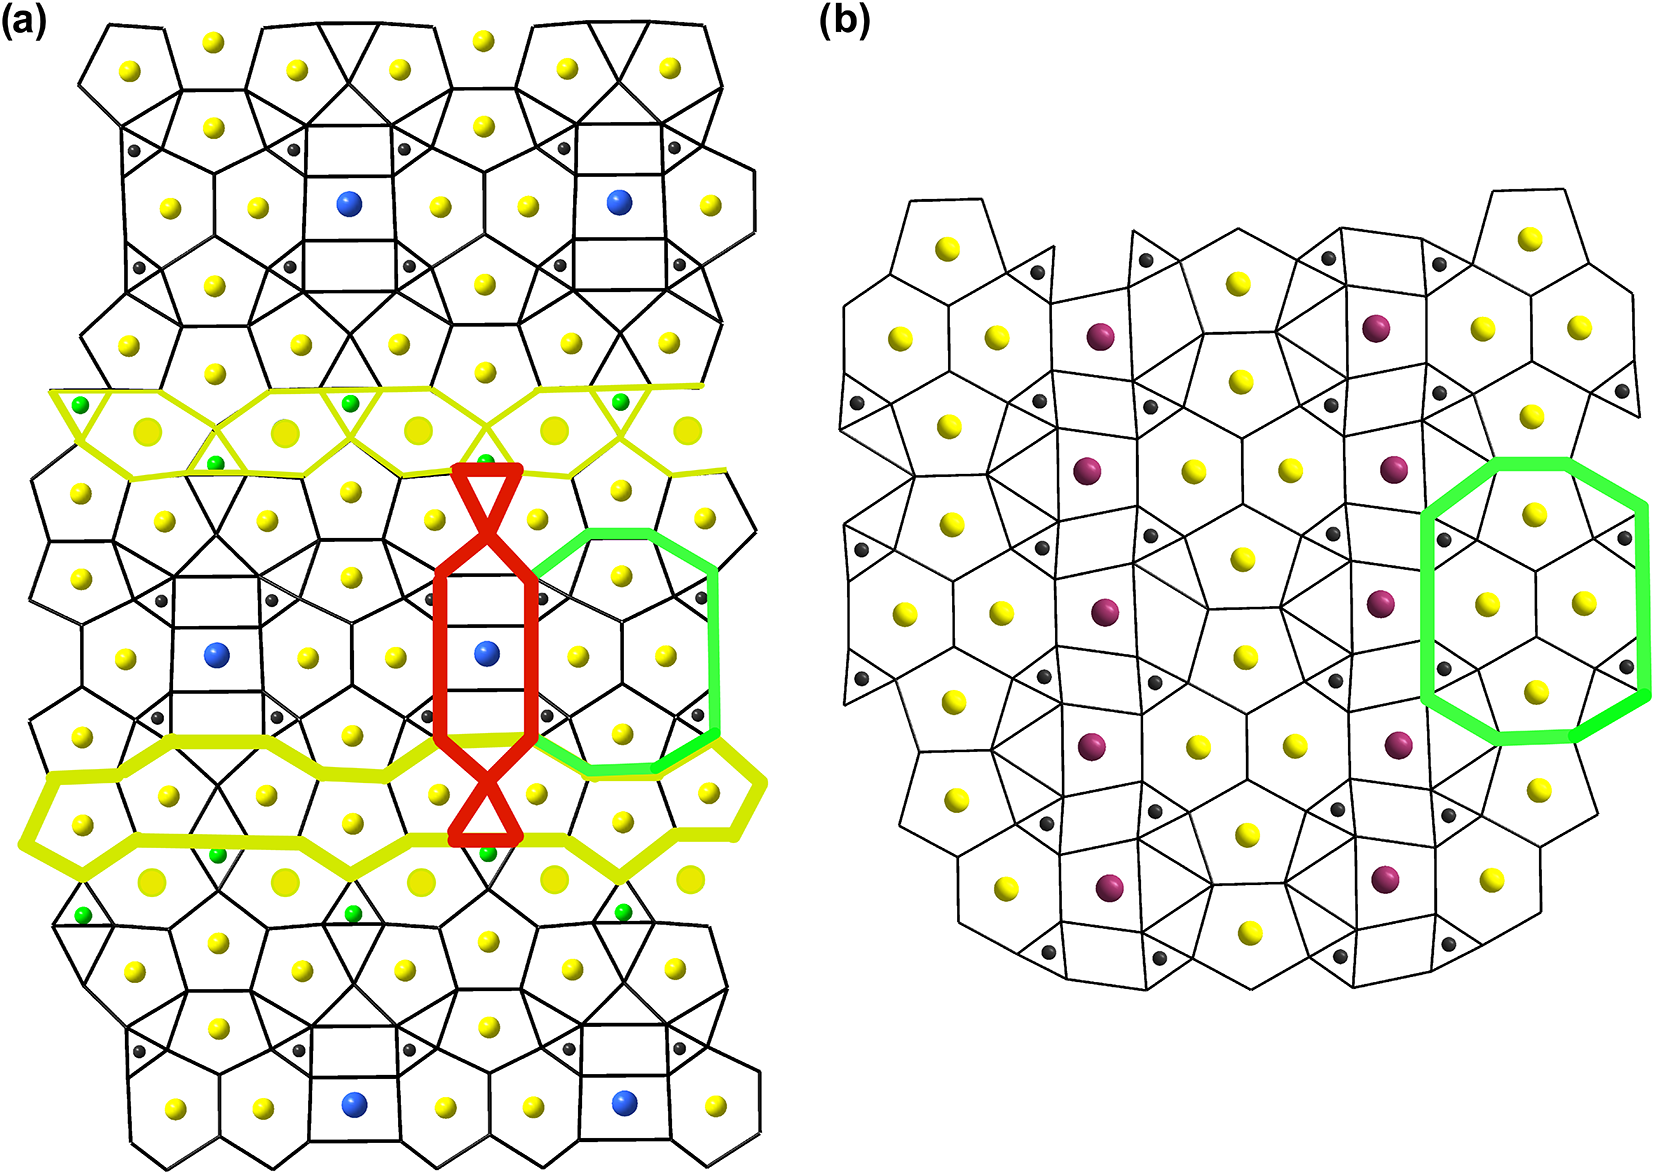
The sheet anion topology for lepersonnite-(Gd) was generated following the routine described by Burns et al. (Reference Burns, Miller and Ewing1996) and is provided in Fig. 10a. It is an intriguing topology comprising combinations of hexagons, pentagons, squares and triangles, and exhibits more complexity than the previously most complex sheet topology found in minerals and synthetic compounds (Gurzhyi et al., Reference Gurzhiy, Kalashnikova, Kuporev and Plášil2021), bijvoetite-type sheets (Fig. 10b). This sheet occurs in the minerals bijvoetite-(Y) (Li et al., Reference Li, Burns and Gault2000) and the closely related mineral kamotoite-(Y) (Plášil and Petříček, Reference Plášil and Petříček2017). The bijvoetite topology is characterised by infinite chains of alternating dimers of edge-sharing uranyl hexagonal and pentagonal bipyramids. The dimers are arranged along the chain’s length, while dimers of hexagonal bipyramids are arranged perpendicularly. Each hexagonal bipyramid shares two equatorial edges, not participating in the linkage between U polyhedra, with CO3 groups. These chains are linked into two-dimensional sheets via irregular Y3+-centred coordination polyhedra through the 6th non-shared equatorial edge from one chain and two O atoms of two carbonate groups from the neighbouring chain. The chains are electroneutral, so neighbouring structural units are linked only by hydrogen bonds provided by H2O molecules from the coordination sphere of Y/REE atoms and the interlayer H2O groups. In lepersonnite-(Gd) (Fig. 10a), we can find some similarities to the above-described bijvoetite topology. It is a cluster consisting of two hexagons, two perpendicularly stacked pentagons, four triangles occupied by C and four void triangles (marked in green in Fig. 10). In bijvoetite-(Y) and kamotoite-(Y), those clusters repeat and thus form infinite chains. In lepersonnite-(Gd), each of these clusters is a neighbour with perpendicularly running infinite chains of pentagons (in yellow in Fig. 10a). This chain consists of trimers of edge-sharing pentagons, which in turn share a common edge, thus also producing two oppositely staggered triangles (sharing a vertex). Those triangles are part of the ‘rolled-bonbon’-like cluster (red) – consisting of squares and triangles, orientated parallel to the elongation (edge) of the U tetramers (green). The central square of this cluster is occupied in lepersonnite-(Gd) by Gd3+, and two smaller adhering squares are voids. Together, each of these subunits forms compact blocks that are separated from each other by an additional infinite chain of vertex-sharing hexagons (occupied by U6+; atom U8) and triangles (occupied by Si4+) (in yellow with Si in green) (Fig. 10a). This chain runs parallel to the chain of pentagons and each of the neighbouring large blocks is then shifted relative to each other.
Sheet anion topologies for (a) lepersonnite-(Gd) and (b) bijvoetite-(Y) or kamotoite-(Y). Colour scheme for atoms: U (yellow), Gd (blue), Si (green), C (dark grey) and Y (violet).

Despite the apparent complexity of the uranyl–anion sheet found in lepersonnite-(Gd), the structure itself is not as complex as one would expect. The structural complexity of lepersonnite-(Gd) was determined as the Shannon information content per atom (I G) and per unit cell (I G,total). This approach was developed by Krivovichev (Reference Krivovichev2012, Reference Krivovichev2013, Reference Krivovichev2014, Reference Krivovichev2016, Reference Krivovichev2017): the complexity of a crystal structure can be quantitatively characterised by the amount of Shannon information, which is measured in bits (binary digits) per atom (bits/atom) and per unit cell (bits/cell), respectively. The amount of Shannon information reflects the diversity and relative proportion of different objects, e.g. the number and relative proportion of different sites in an elementary unit cell of a crystal structure. The information-based structural complexity values were calculated using the software package TOPOS (Blatov et al., Reference Blatov, Shevchenko and Proserpio2014). The chemical complexity (after Siidra et al., Reference Siidra, Zenko and Krivovichev2014) is estimated by considering the chemical formula as a message, where symbols correspond to different chemical elements. Calculated values for the structural complexity of lepersonnite-(Gd) (without contribution of the H-atoms undetermined by the refinement) are 5.896 bits/atom and 2240.545 bits/cell, reflecting that lepersonnite-(Gd) has a complex structure, at a similar extent to kamotoite-(Y), with 1733.33 bits/cell, or meyrowitzite, 2023.17 bits/cell (Gurzhiy et al., Reference Gurzhiy, Kalashnikova, Kuporev and Plášil2021). The chemical complexity, I chem, of lepersonnite-(Gd) is 231.88 bits/formula. That makes lepersonnite-(Gd) a particularly chemically complex mineral structure, similar to, e.g. the uranyl–oxide minerals richetite, 225.48 bits/formula (Plášil, Reference Plášil2017) or wölsendorfite, 178.36 bits/formula (Burns, Reference Burns1999). The furthermost chemically complex uranyl mineral is uranyl carbonate ewingite, Mg8Ca8(UO2)24(CO3)30O4(OH)12(H2O)138 (Olds et al., Reference Olds, Plášil, Kampf, Simonetti, Sadergaski, Chen and Burns2017), with 1024.18 bits/formula.
Discussion
Cell-size variation within lepersonnite-(Gd)
Data collected on lepersonnite-(Gd) show a broad range of lattice parameters for the same sample. The difference cannot be solely due to the different diffraction methods (single-crystal or powder) and temperatures (ambient or low T), as all 3D ED data collected at the same temperature with the same settings also highlight the same discrepancy (3% for b, 1.05% for a and 1.2% for c). Moreover, tools in PETS2 allow the correction of geometrical and optical distortion of 3D ED data (Brázda et al., Reference Brázda, Klementová, Krysiak and Palatinus2022), allowing accurate lattice parameters. Therefore, the observed discrepancy is a property of the mineral itself, as illustrated by the broad peaks in the powder data. In Fig. 8, a plot displays the lattice ratios for all the reported and measured data for lepersonnite-(Gd) sorted by decreasing lattice volume. Ratios were chosen instead of nominal lattice parameters due to the different diffraction methods and measurement temperatures. The volume strongly affects both ratios b/c and a/b, while a/c remains almost constant in all the reported data (Nd/Gd; room T/95 K). Therefore, the unit-cell volume mainly increases with b, which corresponds to the stacking direction and is affected by the amount of Ca (or other possible cations) and water in the interlayer. The a/c ratio depends only on the topology of the layer: a concomitant increase of a and c would preserve the ratio and could originate from the presence of heavier REE3+ at the site with a Wyckoff symmetry 4g (similar to lepersonnite-(Nd)) or in the U sites. The plot in Fig. 8 also indicates that the lepersonnite-(Gd) samples measured in the TEM experienced only slight dehydration (lower b/c) compared to the powder X-ray data collected on the same sample, because of the cryo-plunging method.
Lepersonnite-(Gd) experiences variation at the micro-scale regarding its water content and, probably, Ca levels. However, these changes do not account for the significant disorder seen in the data from single crystals. Like other minerals with sheet structures, cleavage easily occurs when dense layers of heavy atoms covalently bonded alternate thick interlayers connected primarily through strong hydrogen bonds. When the dense layers shift randomly, diffuse reflections along [010] are observed (as seen here) and probably result in other ordered polymorphs with lower symmetry.
Ideal formula of lepersonnite-(Gd)
The original formula assigned to lepersonnite-(Gd) by Deliens and Piret (Reference Deliens and Piret1982), CaGd2(UO2)24(SiO4)4(CO3)8(OH)24·48H2O (Z = 2), basically agrees with the results of our recent EPM and TG analyses. Given that no structure data was available during the original description, it was not possible to elucidate the presence of protonated (acid) SiO3OH groups and the distribution of OH– and H2O within the structural units. The sheet [Gd(UO2)12(SiO3OH)2(CO3)4(OH)10O2(H2O)5] found in the crystal structure of lepersonnite-(Gd) corresponds well to the results of the EPMA data, only the (SiO3OH) group is partially substituted by (OH).
The situation in the interlayer is a bit more complicated due to disorder effects and partial occupancy. The crystal structure data indicate an interlayer content of Ca0.5(H2O)13.25, but microprobe and TG analyses, considering bond valence and charge balance calculations, show Ca*0.39Gd*0.39(H2O)17.98(OH)0.96 (where Ca* is Ca+Ba+Sr+Pb+Mn and Gd* is the sum of REE+Y). The ideal formula for lepersonnite-(Gd) would therefore be best expressed as [Ca0.5Gd0.5(H2O)18(OH)1.5][Gd(UO2)12(SiO3OH)2(CO3)4(OH)10O2(H2O)5], or as the simplified formula Ca0.5Gd1.5(UO2)12(SiO3OH)2(CO3)4(OH)11.5O2·23H2O. Based on our observations, there is no indication that either the site hosting for REE within the sheet or the site hosting for Ca/REE in interlayer shows any preferential occupation by Gd/Nd/Ca or Y.
Implications for the structure of lepersonnite-(Nd)
The current structure determination serves as a reference for defining the formula of the recently described mineral lepersonnite-(Nd), the Nd-dominant analogue of lepersonnite-(Gd). Nevertheless, essential differences exist between the chemical compositions of the -(Gd) and -(Nd) members. Though lepersonnite-(Gd) contains Ca in all measured chemistries, the -(Nd) analogue does not. Moreover, the content of REE in lepersonnite-(Nd) is higher (2: 12: 2), concerning the REE:U:Si ratio, than in lepersonnite-(Gd) (1.5: 12: 2). Given the fact that the Gd site in the structure of lepersonnite-(Gd) has a Wyckoff symmetry 4g, resulting in one Gd atom per unit cell (Z = 4), ‘excess’ Nd in lepersonnite-(Nd) must occupy an additional site somewhere within the interlayer. As the sheets could not accommodate additional large cations as REE 3+,Nd (plus other REE), additional Nd may either occur at the same site that hosts Ca2+ in lepersonnite-(Gd), or another O (of H2O) site in the interlayer. The corresponding Ca site (and several of the O of H2O groups) have a multiplicity of 8; thus, additional Nd may be distributed ∼sub-equitably among these O sites, but a structure analysis is yet required. Though the uranyl-REE-silicate-carbonate sheets are topologically the same, this is probably the most significant difference between the two structures. Thus, the ideal formula of lepersonnite-(Nd) can be expressed as [Nd(H2O)18(OH)2][Nd(UO2)12(SiO3OH)2(CO3)4(OH)10O2(H2O)5] and the simplified formula Nd2(UO2)12(SiO3OH)2(CO3)4(OH)12O2·23H2O.
Supplementary material
The supplementary material for this article can be found at https://doi.org/10.1180/mgm.2025.29
Acknowledgements
We thank Stephan Wolfsried (Waiblingen, Germany) and Eddy Van Der Meersche (Gent, Belgium) for providing us with the microphotos of the studied minerals. The helpful, thorough comments of Travis Olds, Oleg Siidra, and an anonymous referee are greatly appreciated. We thank Jana Ederová (University of Chemistry and Technology, Prague) for her kind assistance with the TG analyses.
Financial statement
This study was supported by the CzechNanoLab Research Infrastructure supported by MEYS CR (LM2023051) (GS and JP). Additionally, we acknowledge the support by the Ministry of Culture of the Czech Republic (long-term project DKRVO 2024–2028/1.II.b; National Museum, 00023272) for JS and ZD and a OP VVV project (Geobarr CZ.02.1.01/0.0/0.0/16_026/0008459 to RS).
Competing interests
The authors declare none.