Implications
Market globalization and climate changes threaten beef cattle grazing on east Mediterranean rangelands. Profitability requires adequate stocking rate and timely supplementation. Clipped samples of vegetation are seldom representative of the consumed diet. We present a methodology that obviates the need to obtain representative diet samples, based on the hypothesis that faeces contain ample information on diets consumed. We show how faecal near-IR spectroscopy calibrations can be obtained from confined animals fed a wide range of plant species from different taxonomic families, and how the relevance of such calibrations to on-farm grazing conditions can be verified.
Introduction
Nutritional value of herbage plays an important role in cattle productivity and is an important consideration in the design and implementation of grazing systems (Briske et al., Reference Briske, Derner, Brown, Fuhlendorf, Teague, Havstad, Gillen, Ash and Williams2008). In the rangelands of Northern Israel, the rainy season starts in October and ends in April, with annual rainfall varying unpredictably in a range between 300 and 900 mm. Rangelands may be very productive, but plant growth extends from January to April, and herbaceous biomass consists mainly of short-lived annuals characterized by high seasonality (Sternberg et al., Reference Sternberg, Gutman, Perevolotsky, Ungar and Kigel2000). Consequently, free-grazing beef cattle face a reduction in the nutritional value of forage during the hot and dry summer season (Brosh et al., Reference Brosh, Henkin, Rothman, Aharoni and Arieli2004). In particular, fall-calving cows face a nutrient shortage during pregnancy and nursing and require supplementary feed. Accurate assessment of diet quality is necessary to implement adequate supplementation, and thereby improve the probability of a high calf crop.
Determining nutrient intake in free-ranging animals has long been a challenge. Estimation of the pasture components that disappear during the grazing process is generally flawed because clipped samples are seldom representative of animal diet. Oesophageally fistulated animals have been extensively used in the past to determine diets ingested at pasture, but extrusa samples may not reflect the selectivity exhibited by non-fistulated resident animals (Jones and Lascano, Reference Jones and Lascano1992); grazing time is limited by the size of the collection bag; and in recent years the technique is banned by animal welfare regulations. The alkane marker method is used for research and it is too expensive for commercial utilization. Moreover, it may be flawed, among other reasons, because of impaired recovery of the marker (Brosh et al., Reference Brosh, Aharoni, Shargal, Choshniak, Sharir and Gutman2003) and the limited number of alkanes available. It also requires extraction with polluting agents.
The collection of faeces is easy and does not harm or interfere with animals. The chemical information contained in faeces is inherently representative of the consumed diet and is related to intake and digestibility. Using faecal indices to elucidate dietary attributes has long been practised (faecal N; Lancaster, Reference Lancaster1949) and is still in use: in a recent study of sheep grazing a sward of Pennisetum americanum, David et al. (Reference David, Poli, Savian, Amaral, Azevedo, Carvalho and McManus2014) found that the faecal concentration of N and NDF explained 98% of the variation in organic matter (OM) intake.
Interest in the use of faecal chemical attributes to evaluate diets heightened following the development of near-infrared spectroscopy (NIRS): not only did investigators analyze faecal chemistry, they attempted also to associate faecal spectra with diets consumed. For example, Brooks (Reference Brooks1984) hypothesized that the chemical information contained in the near-infrared (NIR, 1100 to 2500 nm) range of spectra of elk faeces is related to dietary attributes. It was found that, in hand-fed elks, faecal spectra explained >95% of the variation in in vitro dry matter digestibility (IVDMD) and in the concentrations of CP, NDF and ADF, with high accuracy of prediction. Use of the NIR spectra of faeces to predict attributes of herbivore diets was an unorthodox application of the methodology in that measurements were not being made on the material of interest – the diet – but rather on a derived material – the faeces. Later, the term ‘faecal NIRS’ (FNIRS) was coined for the indirect prediction of dietary attributes using calibrations based on pairs of known diets (reference values) and resulting faecal spectra (Lyons and Stuth, Reference Lyons and Stuth1992). Studies in the United States (Lyons and Stuth, Reference Lyons and Stuth1992) and Australia (Coates, Reference Coates1998 and Reference Coates2004) established FNIRS calibrations for the contents of dietary CP and dry and OM digestibility in vitro or in vivo in cattle, to which Boval et al. (Reference Boval, Coates, Lecomte, Decruyenaere and Archimede2004) added calibrations for fibre attributes. Most calibrations were developed for diets consisting entirely of forage, but Gibbs et al. (Reference Gibbs, Coates, Poppi, McLennan and Dixon2002) and Glasser et al. (Reference Glasser, Landau, Ungar, Muklada, Perevolotsky, Dvash, Muklada, Kababya and Walker2008) demonstrated the value of FNIRS in assessing CP and dry matter (DM) digestibility of pasture diets supplemented with concentrates in cattle and goats, respectively.
The feed samples needed to obtain FNIRS reference values were first obtained with oesophageally fistulated cows (Lyons and Stuth,Reference Lyons and Stuth1992). However, due to welfare regulations, alternatives have been used: only 4 of 32 FNIRS studies reviewed by Dixon and Coates (Reference Dixon and Coates2009) relied on fistulated animals; all others were based on confined animals fed hay or mown pasture. The application of calibrations established in confinement to assess diets in free-grazing animals is probably justified for mono-specific artificial pastures (Boval et al., Reference Boval, Coates, Lecomte, Decruyenaere and Archimede2004) and has been tested in Australia under various conditions (Coates and Dixon, Reference Coates and Dixon2010), but lacks supporting evidence for highly heterogeneous pastures. This is because the spectral variation in the sample population must be contained in that of the calibration population (Shenk, Reference Shenk1989). One of the metrics used in NIRS analysis to determine if a sample is contained in the calibration spectral population is the Mahalanobis, or H, statistic (see formula in the study by Naes et al., Reference Naes, Isakson, Fearn and Davies2002). This defines the sample distance from the population centroid (i.e., the population mean in multi-dimensional space) and, being standardized to have unit variance, is expressed as standard deviations from the centroid. Shenk (Reference Shenk1989) suggested that H values>3 should be regarded with caution.
It is possible to calculate the H distance between individual faecal spectra, such as that between the faecal spectrum of a given goat to that of a counterpart whose diet is also known. In one such analysis it was found that H<0.5 provided 95% confidence that the pair of goats selected the same diet; at pasture H was <3.0 in >80% of comparisons between resident goats and a focal goat grazing in the same paddock (Landau et al., Reference Landau, Giger-Reverdin, Rapetti, Dvash, Dorléans and Ungar2005). This is not to rule out the possibility that larger H distances can be tolerated. Walker et al. (Reference Walker, Clark and McCoy1998) reported that the prediction accuracy for the amount of leafy spurge in the diet of goats was no worse for faecal samples that were spectral outliers (H>3) than it was for samples that were spectrally similar to the calibration data set.
Cattle grazing in east Mediterranean rangelands consume a large variety of grasses, forbs and legumes, at times with grain and poultry litter supplementation. The challenge in applying FNIRS in such conditions is to construct a database with sufficient and relevant variation. The aim of the present study was to construct and validate FNIRS calibration equations that could be applied under farm conditions where cattle graze natural Mediterranean rangelands.
Material and methods
Development of FNIRS calibrations to predict dietary attributes requires a database of diet–faeces pairs; each pair consisting of the NIRS spectrum of a faecal sample, on one hand, and the attributes of the diet from which the faecal sample originated, on the other. The latter, determined by conventional laboratory procedures (wet chemistry), are termed the ‘reference values’ (Landau et al., Reference Landau, Glasser and Dvash2006).
Database construction
We used one database to construct two sets of predictive equations: one set for the direct determination of faecal chemical components and the other for the indirect prediction of dietary composition. The database included 125 pairs of consumed diets and their associated faeces (see schedule, Figure 1), comprising:
-
a) 38 pairs (2004) and 24 pairs (2005) collected from cows fed mowed fodder crops grown at the Migda experimental farm in the Northern Negev desert (31°22'N, 34°34'E). Feeds were fresh-cut green fodder of barley, wheat, garden pea and safflower at various phenological stages, from young vegetative to mature and senescent, alone, in combination (wheat and safflower), or with the addition of poultry litter (with wheat) or wheat straw (with safflower).
-
b) 15 pairs collected from cows fed mowed senescent natural pasture from the Upper Jordan Valley (Karei Deshe station, 32°55'N, 35°35'E), alone or with the addition of poultry litter and/or barley grain).
-
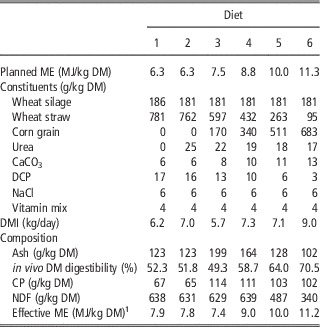
c) 48 pairs obtained from a digestion trial at the Newe Yaar experimental station (32°42'N, 35°10'E), comprising complete six mixed diets containing wheat silage, wheat straw, corn grain and urea in varying proportions (Table 1).
Time schedule for the collection of diets and associated faeces in feeding trials conducted at the Migda, Karei Deshe and Newe Yaar stations. Crops at Migda and natural pasture at Karei Deshe were fed as fresh-cut fodder. I, II and III represent 10-day periods in each month. n is the number of diet–faeces pairs. ME=metabolizable energy.

Planned ME content, diet composition and DMI from complete mixed diets fed in a digestion trial conducted at the NeweYaar experimental station in 2004

ME=metabolizable energy; DMI=dry matter intake; DM=dry matter; DCP=di-calcium phosphate.
1 Calculated from in vitro analyses (Tilley and Terry, 1963).
For calibrations of faecal chemical composition, we merged this database with 28 records of faecal composition from previous trials conducted at ARO with grazing beef cattle in Northern Israel (Landau et al., Reference Landau, Muklada, Dvash, Barkai and Yehuda2011). Poultry litter was included in some of the diets because it is the most widespread supplement fed in cow–calf operations in Israel although excess is a health hazard (Silanikove and Tiomkin, Reference Silanikove and Tiomkin1992).
Animals
All feeding trials were conducted with non-lactating, mixed-breed Simmental×Hereford (known locally as Israeli Simford) cows of average (±SE) liveweight 628 kg (±35 kg). The number of cows used in each trial was four, five and eight for Migda, Karei Deshe and Newe Yaar, respectively. In the 2004 trials at Migda, cows were replaced if they were expected to give birth within 2 months and, as a result, a total of nine different cows were used. In 2005 at Migda, and at the other two sites, cows were barren and the same animals were used throughout the trials. During the trials animals were kept in individual stalls (16 m2) for consecutive periods of 10 days each – the time required to determine one diet–faeces pair – and were weighed after each 10-day period. Water and salt-licks were provided ad libitum. Welfare regulations of the Israel Council on Animal Care Guidelines (ICACG, 1994) were followed throughout.
Feeds and dietary management
In each 10-day cycle, cows adapted to diets for 7 days and diet residue collection was carried out on days 8 and 9. Residues were weighed and dried at 70°C for 48 h in an aerated oven. A composite sample was then ground to pass through a 1-mm sieve and stored in a dark, dry environment. Daily feed intake was expressed per animal and per unit BW or BW0.75.
Migda
Rainfall in Migda in 2004 and 2005 was 186 (drought) and 340 mm (favourable), respectively. In 2004, sowing of barley (cv. Maanit, Shuval, Israel; 50 kg/ha) and wheat (cv. Nirit, Zeraim Seed Co., Israel; 130 kg/ha) was in mid-December following N (urea) and P (super-phosphate) fertilization; sowing of garden pea (Zeraim Seed Co.; 150 kg/ha) was in early January, and that of safflower (produced on farm; 50 kg/ha) was in mid-February. In 2005, barley and wheat were sown in mid-November and safflower was sown in mid-January, following favourable autumn rainfall. Broadleaf weeds were controlled in monocots by spreading 2-4D (Makhsteshim, Beer Sheva, Israel) where needed. Dicot crops (safflower and pea garden) were clear of weeds following post-emergence herbicide spray (Roundup; Agan Chemicals, Israel). Barley developed fastest and was harvested in mid-March (3.5 tons of DM/ha), as soon as plant height enabled collection by a mechanical hand harvester. The other crops were harvested in the order: garden pea, wheat and safflower. Fresh fodders were collected daily between 0630 and 0800 h, weighed and fed immediately. Feed scattered by cows beyond the trough was collected and returned four times a day. Where relevant, supplements of barley grain and poultry litter were fed twice daily, at 0800 and 1400 h.
Karei Deshe
Senescent grass-dominated pasture was mechanically harvested in early June at two sites in the Upper Jordan Valley and baled. Diets consisted of dry pasture plus: 1.0 kg (on fresh matter basis) of barley grain (period 1); 0.45 kg barley grain and 2.25 kg of poultry litter (period 2); and 4.5 kg of poultry litter (period 3).
Newe Yaar
Feeds were formulated to represent a wide range of energy concentrations, with or without urea (Table 1). Feed components were reduced to particles of 1 cm length and mixed in a wagon as a complete ration before being fed.
Faecal samples
Faeces were collected rectally on the evenings of 10th day of each feeding period, inferring a 48-h rate of passage for feeds in the gastro-intestinal tract (Lyons et al., Reference Lyons, Stuth and Angerer1995). The faecal samples were dried for 3 days at 60°C in a ventilated oven and ground to pass a 1-mm sieve (Cyclotec 1093 Sample Mill; Foss Tecator, Höganas, Sweden).
Chemical analyses
Feeds and residues were analyzed separately for each combination of diet, animal and period. Analyses were for IVDMD (Tilley and Terry, Reference Tilley and Terry1963), CP concentration (automated Kjeldahl, method 976.05; AOAC, 1990) and dietary fibre attributes of NDF (with α-amylase), ADF and ADL (Goering and Van Soest, Reference Goering and Van Soest1970). Given the low variation of gross energy content among diets, we assumed gross energy to be 18.39 MJ/kg DM for all grass samples (Goley, Reference Goley1961) and 16.3 MJ/kg DM for poultry litter (Bhattacharya and Fontenot, Reference Bhattacharya and Fontenot1966). A coefficient of 0.82 was used to convert digestible energy (from IVDMD data) to metabolizable energy (ME), being an average value between different ruminant nutrition systems (INRA, 1989; NRC, 1996). Faecal samples were assayed for ash, CP, NDF, ADF and ADL, using the same methods.
NIRS spectra collection and processing
Faecal samples were re-dried at 50°C for 1 h and put into a dessicator for 20 min before being packed into sample cells with a NIR transparent quartz cover glass. Samples were scanned in 2 nm increments in the range 1104 to 2492 nm using a Foss NIR Systems model 5000 monochromator spectrometer (Foss Tecator). Spectra were collected as log (1/R) where R=reflectance. Raw spectral data was transformed with the standard normal variate and detrending procedures to remove non-linearity that results from light scattering (Barnes et al., Reference Barnes, Dhanoa and Lister1989). Mathematical treatments used to enhance spectral differences where ‘1,4,4,1’ or ‘2,6,6,2’, where the numbers represent: the derivative; gap width over which the derivative is calculated; the number of points in a moving average, that is, first smoothing procedure; and the number of nm over which the second smoothing is applied, respectively (ISI, 1999).
Calibration equations
Calibration equations were developed from the treated spectral data using the modified partial least-squares routine of the WinISI II software (ISI, 1999) and after making outlier passes to remove observations with T>2.5 (ISI, 1999). The quality of prediction by equations was expressed by the coefficient of determination (R 2cal, encompassing linearity and precision), which defines the proportion of variability in the reference data accounted for by the regression equation, and by the standard error of calibration (SEC), which defines the variability in the difference between predicted values and reference values. A first estimation of the accuracy of calibrations was by aid of cross-validation (with SEcv as estimate of quality), in which one-sixth of the calibration samples were randomly sampled and used to validate calibrations calculated with five-sixths of the sample: SEcv was calculated as the average SE of partial validations. A criterion of quality for NIRS calibrations is that the ratio of performance to deviation (RPD, calculated as the ratio of SD to standard error of prediction (SEP) or, in the case of cross-validation, to SEcv) be >2.5 (Williams, Reference Williams2001; Coates, Reference Coates2004; see also Dixon and Coates, Reference Dixon and Coates2009; Coates and Dixon, Reference Coates and Dixon2010).
Evaluation of FNIRS predictions in grazing animals
The FNIRS equations were evaluated with external data that consisted of 87 pairs of diets and faeces from grazing cows at Migda in 2004 (n=43). Cows grazed a monoculture of sown barley from 17 March to 14 April, then barley and safflower in two undivided contiguous paddocks from 15 April to 10 May, and later the same mixture with free access to poultry litter. Paddocks used for validation were not the ones used for calibrations. We did not use external markers (such as alkanes, Cr oxides or Polyethylene-glycol) to determine intake and true dietary quality because they alter faecal NIR spectra (Dove and Mayes, Reference Dove and Mayes1991; Landau et al., Reference Landau, Friedman, Devash and Mabjeesh2002), thereby impairing the comparison between validation and calibration samples. Instead, the responses of predicted dietary values to grazing management and feed supplementation were used as qualitative criteria for validation.
In a further evaluation, the Mahalanobis distance (H) was calculated between the calibration spectra and spectra to which calibrations were applied. Faecal samples were collected from cows that grazed January to November at Karei Deshe in 2013 (n=130, four paddocks stocked at 1.8 and 0.9 ha/head). Faecal samples were also collected from three herds, representative of beef cattle herds in Northern Israel, located in the Golan Heights. These were Ortal (Northern Golan, 2013, 1000 cows, 700 to 900 m elevation, 3 ha/head, n=105), Tel Juhader (Central Golan, 2012 and 2013, 1000 cows, 600 to 700 m elevation, 2.5 ha/head, n=419) and Neot Golan (Southern Golan, 2012 and 2013, 140 cows, 300 to 400 m elevation, 2.5 ha/head, n=202).
Long-term on-farm implementation
FNIRS equations were applied to commercial herds grazing on the Golan Heights from November 2008. Here, we present the example of the herd kept at Tel Juhader spanning the period October 2008 to February 2011. Rainfall was similar in the 2008/09 (604 mm) and 2009/10 (612 mm) seasons, but distributed over a relatively short (202 days in 2008/09) or long period (223 days in 2009/10). Poultry litter and agricultural residues were offered from mid-May to end of November. The herd was visited monthly and five faecal samples (≈200 g fresh weight) were collected from the ground immediately after defecation from every stocked paddock. Feed supplements were also sampled. Faecal samples (n=461) were dried in an aerated oven for 48 h at 70°C, ground through a 1-mm sieve and scanned as explained above. As we had no calibration data for very young pasture – because it is difficult to harvest and to feed to cows – we assumed that in early spring, when all vegetation is of similar nutritional value, cows are less selective, and we used the average chemical composition of pasture samples clipped at bite height in each field as reference value for 2 months of the 1st year. This sampling yielded six pairs of vegetative green pasture and associated faeces which were added to the basic database.
Results
Calibrations to determine faecal composition
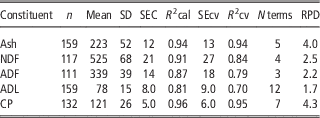
Calibrations for the determination of faecal ash and CP contents (Table 2) yielded excellent linearity in the relationship between predicted and reference values (R 2cal and R 2cv>0.90) and good accuracy (SEcv=13 and 6 g/kg DM, respectively). The 1,4,4,1 procedure of spectral transformation resulted in the most accurate and precise equations. The linearity of calibrations for faecal fibre attributes, with the exception of NDF, was low. SEcv values for NDF, ADF and ADL were 27, 18 and 9 g/kg DM, respectively. The RPD estimate of the value of NIRS equations was >2.5 for ash, NDF and CP.
Calibration performance of the equations for faecal composition (g/kg dry matter)

SD is the standard deviation of faecal chemical attributes; SEC and SEcv are the standard errors of calibration and cross-validation; R 2cal and R 2cv represent linearities of calibration and cross-validation, respectively. N-terms is the number of scores used in the calibration; RPD, is calculated as the ratio of SD to SEcv.
Calibrations to determine dietary nutrient content and intake
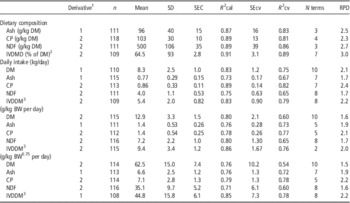
Calibrations for the determination of dietary quality (Table 3) yielded linearity values close to 0.90 and accuracy values of 16, 13, 39 and 31 g/kg DM, for ash, CP, NDF and IVDMD, respectively. For ash, NDF and IVDMD the RPD value was >2.5 whereas for dietary CP it was 2.3.
Calibration performance of the faecal NIRS equations for dietary composition and intake

NIRS=near-infrared reflectance spectroscopy; DM=dry matter.
SD is the standard deviation of nutritional attributes; SEC and SEcv are the standard errors of calibration and cross-validation; R 2cal and R 2cv represent linearities of calibration and cross-validation, respectively. n<125 denotes outlier withdrawal.
1 Mathematical treatment on NIR spectra.
2 In vitro dry matter digestibility (Tilley and Terry, 1963).
3 In vitro digested dry matter.
Calibrations for the determination of nutrient intake yielded R 2cal and R 2cv values that were lower than those for dietary nutrient contents for all attributes except CP. For example, R 2cal values for NDF content and NDF intake were 0.90 and 0.75, respectively; and corresponding R 2cv values were 0.86 and 0.65, respectively. Expressing nutrient intake on the basis of BW or BW0.75 did not improve R 2cal or R 2cv values. None of the calibrations for nutrient intake achieved an RPD value >2.5.
Validation with grazing cows
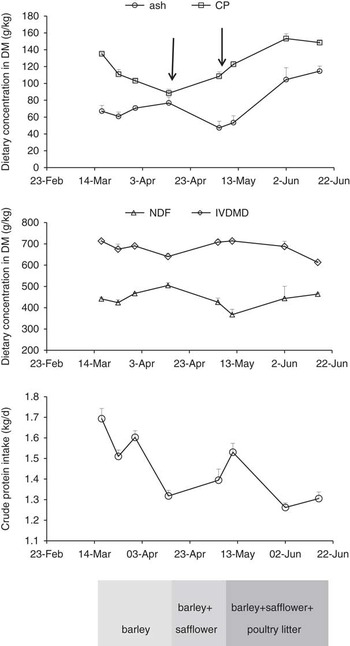
Predicted values for dietary quality were responsive to management (Figure 2). In particular, when predicted values for dietary CP were 135, 111, 103 and 88 g/kg DM, the corresponding values for monoculture barley clipped at estimated bite height were 130, 108, 99 and 80 g/kg DM, respectively. However, NDF from clipped pasture was lower than FNIRS-predicted dietary NDF. The decrease in predicted CP from March to mid-April was concomitent with increased NDF and maturing of the barley crop. A similar trend was noted for IVDMD. Predicted dietary CP increased from 88 to 108 g/kg DM when cows were allowed access to vegetative, green safflower crop, and increased further to ~150 g/kg DM when poultry litter was offered as a supplement. In addition, the predicted concentration of dietary ash increased when cows were given access to ash-rich poultry litter. In other words, calibrations were qualitatively responsive to cows being provided with fresh paddocks and poultry litter.
Predicted values (averages of eight to nine cows±SE) for dietary CP, ash, NDF concentration (NDF) and in vitro dry matter digestibility (IVDMD) and CP intake for the external validation data set, Migda, 2004. Left arrow indicates opening of safflower paddock and right arrow indicates initiation of poultry litter supplementation.

As CP intake was the only calibration of intake that met minimal quality requirements, it is shown in Figure 2. Predicted CP intake decreased while barley matured, and increased when cows were given access to safflower, but not later, when cows had access to poultry litter.
Spectral distances between grazing cow populations and the calibration population
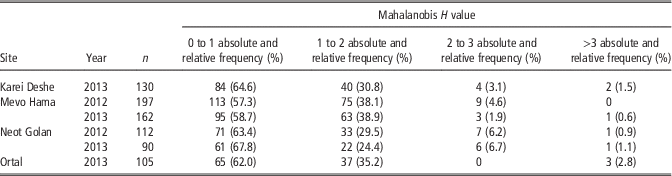
This analysis was based on faecal samples collected from beef cattle herds at Karei Deshe and three other locations in Northern Israel. Out of 796 faecal samples, only eight (≈1%) had an H value>3.0 (Table 4). In other words, calibrations had predictive relevance for 99% of samples with most (>60%) H values being <1.0.
The frequency distribution of spectral distance (Mahalanobis H value) between 796 faecal samples collected monthly throughout 1 or 2 years from beef cattle grazing on rangelands of Northern Israel and the spectral centroid of the calibration population of faecal samples

Implementation at Tel Juhader
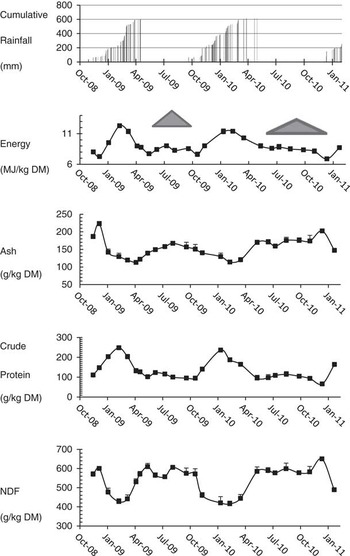
For the 2-year implementation at Tel Juhader, 62.8%, 33.9% and 1.9% of faecal samples had H values in the ranges 0 to 1, 1 to 2 and 2 to 3, respectively, and 1.4% of the population were outliers (H>3). The seasonal progression in FNIRS-predicted concentrations of ME, ash, CP and NDF, as well as rainfall, are shown in Figure 3. A clear seasonal trend in dietary quality is apparent, with low dietary energy and CP, and high NDF being associated with senescent and dry pasture. Very young, vegetative green pasture was associated with high dietary ash content, which decreased as the vegetation matured. NDF rose abruptly in the dry season (after April). The responses of faecal composition (not shown) and FNIRS-predicted diet quality to the start of supplementation with poultry litter showed an increase in CP and a decrease in NDF. Subsequently, supplementation of poultry litter resulted in a very steady concentration of NDF, energy and CP until rainfall resumed at the beginning of the next hydrological year. In 2009, which had a short rainfall season, the decline in dietary quality was more abrupt than it was in 2010, which had a longer rainfall season.
Cumulative rainfall and FNIRS-predicted concentrations of dietary metabolizable energy (MJ/kg DM), ash, CP and NDF (g/kg DM) for 2 consecutive years: each point represents the average of all stocked paddocks (n=3 to 5) on each sampling day (average±SE). Triangles correspond to poultry litter supplementation. FNIRS=faecal near-infrared reflectance spectroscopy, DM=dry matter.

Discussion
Faecal composition
A full discussion of calibration performance and comparison with published data is beyond our current scope, and we focus on three calibrations that were eventually used to monitor nutritional status in field studies: those for ash, CP and NDF.
A rapid evaluation of ash content is important in order to assess if faecal samples are contaminated with soil. The R 2 value for the calibration of faecal ash (0.94, Table 2) is in the top range of values compilated from six studies by Dixon and Coates (Reference Dixon and Coates2009). Our result for SEcv (13 g/kg DM), that is, the accuracy of prediction, is better than all values reported in the above review. The SD of our data is similar to that given by Dixon and Coates (Reference Dixon and Coates2009), even though their data set encompassed 967 faecal samples. In addition, the low ratio of SEC to SEcv is indicative that the calibration equation is not over-fitted. The wide variety of dietary combinations in our database may well have been conducive to a good calibration and all criteria indicate robustness to external variation.
The R 2 value for the calibration of faecal CP (0.96, Table 2) is in the top of the range (between 0.61 and 0.98) of values compilated from 21 studies by Dixon and Coates (Reference Dixon and Coates2009). The RPD value of 4.7 is also in the top of those reported (in a range between 1.6 and 4.9) and the low ratio of SEC to SEcv is indicative that the calibration equation is not over-fitted. The wide variety of dietary combinations in our database may well have been conducive to a good calibration and all criteria indicate robustness to external variation.
Finally, our calibration for faecal NDF yielded a SEcv of 27 g/kg DM. Dixon and Coates (Reference Dixon and Coates2009) cite SEcv values of 13 to 32 g/kg DM. Given that R 2 (0.89) and the ratio of SD to SEcv were both high, the calibration of faecal NDF presented here has the potential of being useful.
In contrast with our results, Purnomoadi et al. (Reference Purnomoadi, Kurihara, Nishida, Shibata, Abe and Kameoka1996) obtained very precise and accurate calibrations for ADF and ADL, which enabled lignin (as estimated by ADL) to be used as a marker of digestibility.
To summarize, our results suggest that the direct NIRS calibrations for ash, CP and NDF contents can provide an accurate, and inexpensive alternative to wet chemistry procedures.
Dietary intake and composition
As reported previously for confined goats (Landau et al., Reference Landau, Giger-Reverdin, Rapetti, Dvash, Dorléans and Ungar2005 and Reference Landau, Glasser, Muklada, Dvash, Perevolotsky, Ungar and Walker2008), FNIRS calibrations to predict dietary composition are more precise and accurate than those of absolute rates of intake (Table 5). Dixon and Coates (Reference Dixon and Coates2009) reported on 25 studies in which FNIRS calibrations were developed for intake, and not even one was of adequate quality. Notably, Boval et al. (Reference Boval, Coates, Lecomte, Decruyenaere and Archimede2004) reported values of 0.61 and 0.52 for R 2cal and R 2cv, respectively, for OM intake per unit BW in cattle, and Fanchone et al. (Reference Fanchone, Boval, Lecomte and Archimede2007) obtained R 2cal=0.77 and R 2cv=0.45 for the same variable in sheep. Coates (Reference Coates1998) found that the SEcv for DM intake and digestible DM intake, per unit BW, depended on the cross-validation procedure and was therefore not robust. Only one study, conducted with very homogeneous groups of confined ewes fed complete mixed diets (Decandia et al., Reference Decandia, Giovanetti, Boe, Scanu, Cabiddu, Molle, Cannas and Landau2007), obtained R 2cv>0.8, and Decruyenaere et al. (Reference Decruyenaere, Froidmont, Bartiaux-Thill, Buldgen and Stilmant2012) succeeded in developing an intake model for a very homogeneous grass sward in Belgium that used FNIRS, grass growth measurements and milk yield. Such a model is not relevant to beef cattle grazing highly heterogeneous rangelands of the east Mediterranean region.
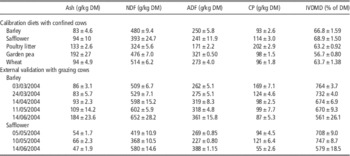
Nutrient contents of feeds offered during the calibration with confined cows and of clipped samples from paddocks used for external validation at the Migda experimental farm in 2004 (means±SE)

DM=dry matter.
It is clear that, for a given physiological state in terms of maintenance, pregnancy and lactation requirements, voluntary feed ingestion is a function of gastro-intestinal size, itself related to BW. We would therefore expect calibrations for daily intake per unit BW or BW0.75 to be superior in quality to calibrations of daily intake per animal. This was not the case in our study (Table 3) and the calibrations for intake, with the exception of CP intake, were of low quality. As many dietary and physiological factors affect voluntary intake, we concur with Dixon and Coates (Reference Dixon and Coates2009) that FNIRS calibrations can be developed to predict voluntary DM intake of forage diets by ruminants ‘in at least some circumstances’, but these are probably rare in semi-arid pastures of the Middle-East.
Our finding that FNIRS can predict CP intake more precisely than it can total DM intake (Table 3) is puzzling. Could the intake of a nutrient be predicted more precisely than that of the whole diet? This appears to be the case also in an Australian study (Coates, Reference Coates2004) in which digested DM intake was predicted better than total DM intake. This issue merits further research as it raises the possibility of using FNIRS to predict DM intake from the ratio of the intake of a nutrient to its dietary concentration.
A more well-founded application of FNIRS is for the prediction of feed composition. Four robust calibrations emerged from our study: dietary ash, CP, dietary IVDMD (hence ME concentration) and NDF contents. We found no published calibrations for dietary ash. This is surprising because excellent calibrations for the prediction of faecal ash have been reviewed by Dixon and Coates (Reference Dixon and Coates2009). Faecal ash can increase with OM digestibility but also when ash intake increases. Our calibrations for faecal ash, combined with dietary ash concentration and in vitro DMD can distinguish between these two nutritional situations. Published calibration statistics for dietary CP were typically R 2⩾0.92, SEcv=9 to 15 g CP/kg DM and RPD⩾2.9, and for diet digestibility of DM or OM, R 2=0.80 to 0.95, SEcv=11 to 32 g/kg DM and RPD⩾2.5 (Dixon and Coates, Reference Dixon and Coates2009). Our findings are fully consistent with their results (Table 3). For dietary NDF, the precision found here (R 2 slightly below 0.90) was well within the range reported by Dixon and Coates based on seven studies, but SEcv (39 g/kg DM) was at the high end of the range (8 to 39 g/DM) reported in their review. Our calibration statistics for in vitro DMD – high precision (R 2), accuracy of 31 g/kg DM, RPD=3.0 – was well within the top range of 40 calibrations surveyed by Dixon and Coates (Reference Dixon and Coates2009) for which SEcv was 6 to 66 g/kg DM.
As the basis of nutrition science is additive, a methodology such as FNIRS that is aimed at making nutrition explicit through faecal analysis must endorse the concept of additiveness. According to Dixon and Coates (Reference Dixon and Coates2009), ‘some diet components (e.g. urea) which are likely to be entirely digested apparently cannot be predicted from faecal NIR spectra because they cannot contribute to faecal spectra except though modifying the microbial and endogenous components’. Our results with cattle consuming poultry litter, in which 60% of the CP consists of uric acid (Bhattacharya and Fontenot, Reference Bhattacharya and Fontenot1966) do not support this statement: when cows had access to poultry litter at Migda in 2004 (Figure 2), dietary CP concentration increased from 122 to 153 g/kg DM during the period 11 May to 6 June 2004, even though the barley and safflower stands decreased in quality during this period. In addition, when FNIRS was implemented with the commercial flock at Tel Juhader, the supplementation was always accompanied by an increase in dietary CP.
External validation and relevance of calibrations
The question of validation is fundamental to the development of calibrations that will be robust under farm conditions. Cross-validation is valid for small databases but does not ensure robustness in the long run. Although not perfect, the best available methods of external validation for FNIRS involve oesophageally fistulated animals or markers. Neither method was feasible for reasons detailed before. We preferred to look at the qualitative performance of our calibrations under fluctuating conditions. In Migda, the predicted dietary CP and IVDMD in barley (Figure 2) matched those in forage (Table 5), but dietary NDF was lower compared with clipped samples, possibly because cows selected less coarse forage components than present in the clipped samples. One cannot determine if the problem lay with the calibration or selectivity at pasture, but Figure 3 shows seasonal trends in diet that are in perfect agreement with rainfall and the provision of supplementation. Walker et al. (Reference Walker, McCoy, Launchbaugh, Fraker and Powell2002), working on the validation of dietary botanical composition by FNIRS, proposed that the results of FNIRS calibrations be considered interval scales of measure (see Osherson and Lane, Reference Osherson and Lane2014). Interval scales are numerical scales – in our case, values of g/kg DM – in which equal distances have the same interpretation throughout and differences in the distance along the scale can be interpreted without defining a real zero value. Interval scale data can use parametric statistical techniques including calculation of mean and standard deviation, correlations, regression, ANOVA and factor analysis. When looking at the Tel Juhader FNIRS predictions (Figure 3) as an interval scale measure, it is clear that supplementation of poultry litter in June was successful in arresting the sharp decrease in dietary CP content and energy content. Indeed, our experience indicates that users of FNIRS are more interested in qualitative responses to management than in absolute values. In other words, a long-term evaluation of FNIRS has greater value than a short-term external validation as performed by early FNIRS workers.
As found also by Coates (Reference Coates2004) in Australia, FNIRS was instrumental in elucidating seasonal changes in nutrition (Figure 3): ash contents peaked at the end of January, decreased till April and abruptly increased from October to November to January. NDF nadirs were found in January to March, peaks in April, and faecal CP also showed well-organized peaks and nadirs of amplitude related clearly to climatic events. There was not even one case of management intervention (turning to a new paddock, supplementation) that was not detected by FNIRS.
Conclusion
Reliable FNIRS calibrations for the prediction of dietary quality of cattle grazing east Mediterranean rangelands can be constructed by collecting pairs of faeces and diets encompassing a large variety of plant species and phenological states, with and without supplements. Approximately 120 pairs with 30 animals are sufficient to cover the diversity of diets grazed by cattle in rangelands in Northern Israel, and probably in all the east Mediterranean region. As classical methods of validation are not feasible, predictions from FNIRS calibrations are best regarded as interval scales of measure that allow the qualitative tracking of the response of dietary attributes to changes in the foraging environment and management decisions.
Acknowledgement
The authors are indebted to Dr Arieh Brosh from ARO who contributed 48 samples of faeces with all the relevant nutritional information to our calibration database.