



1. Introduction
A buoyant body in a stratified fluid is acted upon by a variety of forces, shown in figure 1. Its weight is  $m\boldsymbol {g}$, with
 $m$ the mass of the body, and the Archimedes’ force is
 $-m_{f}\boldsymbol {g}$, with
 $m_{f}$ the mass of the displaced fluid; here,
 $\boldsymbol {g} = -g\boldsymbol {e}_z$, with
 $g$ the acceleration due to gravity, and
 $\boldsymbol {e}_z$ a unit vector in the direction of the upward vertical coordinate
 $z$. Together, these forces combine into the gravitational restoring force which, for small vertical displacement
 $\zeta$ of the body away from its neutral level where the two forces are equal and opposite, is given by
 \begin{equation} (m-m_{f})\boldsymbol{g} ={-}m N^2\zeta\boldsymbol{e}_z, \end{equation}
causing the body to oscillate at the buoyancy frequency  $N = [-(g/\rho _{00})(\mathrm {d}\rho _0/\mathrm {d}z)]^{1/2}$ about this level, with
 $\rho _0(z)$ the density of the fluid, and
 $\rho _{00}$ its reference value. See Lighthill (Reference Lighthill1978, § 4.1) and Sutherland (Reference Sutherland2010, § 3.2).
Dynamics of a buoyant body in a viscous stratified fluid.

In the absence of any dissipative mechanism, the oscillations would go on indefinitely and the body would never reach its neutral level. Two such mechanisms are available. The first is wave damping, acting through the hydrodynamic pressure force  $\boldsymbol {F}$. Introducing the added mass coefficients
 $C_{ij}(\omega )$ of the body (Ermanyuk Reference Ermanyuk2002; Voisin Reference Voisin2024), we have in the frequency domain, for time variation as
 $\exp (-\mathrm {i}\omega t)$,
 \begin{equation} F_i(\omega) = \mathrm{i}\omega m_{f}\,C_{ij}(\omega)\,U_j(\omega),\end{equation}
where suffix notation is used, with  $i$ ranging over
 $1$,
 $2$ and the vertical direction
 $3$, and
 $U_i(\omega )$ is the velocity of the body. Taking inverse Fourier transforms and introducing the impulse response function
 \begin{equation} C_{ij}^{M}(t) = \frac{1}{2{\rm \pi} N} \int [C_{ij}(\omega)-C_{ij}^\infty] \exp(-\mathrm{i}\omega t)\,\mathrm{d}\omega,\end{equation}
where  $C_{ij}^\infty = C_{ij}(\omega = \infty )$, the hydrodynamic force appears as
 \begin{equation} F_i(t) ={-}m_{f}C_{ij}^\infty\,\frac{\mathrm{d}U_j}{\mathrm{d}t}(t) -m_{f}N\int_0^\infty C_{ij}^{M}(\tau)\,\frac{\mathrm{d}U_j}{\mathrm{d}t}(t-\tau) \,\mathrm{d}\tau,\end{equation}
namely a combination of two terms: the same acceleration reaction as in a homogeneous fluid (Batchelor Reference Batchelor1967, § 6.4; Landau & Lifshitz Reference Landau and Lifshitz1987, § 11), with coefficients  $C_{ij}^\infty$ equal to
 $\delta _{ij}/2$ for a sphere, where
 $\delta _{ij}$ is the Kronecker delta symbol; and a memory integral representing the effect of internal wave radiation, with a kernel given at large time
 $Nt \gg 1$ for the vertical motion of a sphere by
 \begin{equation} C_{33}^{M}(t) \sim \frac{1}{Nt} - \left(\frac{2}{\rm \pi}\right)^{3/2} \frac{\cos(Nt-{\rm \pi}/4)} {(Nt)^{3/2}}, \end{equation}
exhibiting an aperiodic decay as  $t^{-1}$, together with oscillations of frequency
 $N$ and amplitude decay as
 $t^{-3/2}$.
The second dissipative mechanism is viscous drag  $\boldsymbol {F}_{v}$, which may assume different forms depending on the flow parameters: Stokes resistance, leading to linear drag proportional to the velocity; boundary-layer dissipation for steady flow, leading to quadratic drag proportional to the square of the velocity; boundary-layer dissipation for accelerated flow, giving the Basset–Boussinesq memory integral; and turbulent dissipation. See Batchelor (Reference Batchelor1967, §§ 4.9, 5.11 and 5.13) and Landau & Lifshitz (Reference Landau and Lifshitz1987, §§ 20, 24 and 45).
When the size of the body becomes small, all these mechanisms, together with molecular diffusivity, combine their effects and the forces no longer act independently. A variety of regimes is observed, discussed by Ardekani, Doostmohammadi & Desai (Reference Ardekani, Doostmohammadi and Desai2017), Magnaudet & Mercier (Reference Magnaudet and Mercier2020) and More & Ardekani (Reference More and Ardekani2023).
An important buoyant body is the oceanographic float; namely a float that targets a given isopycnal surface in the ocean, being dropped at the surface, sinking down to its intended depth, then stabilizing itself at this depth. A similar device is the weather balloon, used to probe the atmosphere. The first oceanographic float (Stommel Reference Stommel1955; Swallow Reference Swallow1955) was calibrated at build to have a given buoyancy. The ability was added afterwards to adjust the buoyancy in situ, by expanding or contracting an external trim chamber (Aagaard & Ewart Reference Aagaard and Ewart1973) or an external bellows (Cairns Reference Cairns1975). Several generations of floats followed, described by Rossby, Dorson & Fontaine (Reference Rossby, Dorson and Fontaine1986), Swift & Riser (Reference Swift and Riser1994), D'Asaro et al. (Reference D'Asaro, Farmer, Osse and Dairiki1996) and D'Asaro (Reference D'Asaro2003), among others, leading to the autonomous Lagrangian floats of today. Accounts of this evolution have been given by Gould (Reference Gould2005) and Rossby (Reference Rossby2007).
The study of float dynamics in the laboratory started with Larsen (Reference Larsen1969), who held a buoyant sphere of radius  $2$–
 $8\ \mathrm {cm}$ a small distance away from its neutral level in a linearly stratified tank, then released it at time
 $t = 0$. The subsequent motion of the sphere was inviscid and satisfied an equation of the form
 \begin{equation} m\,\frac{\mathrm{d}^2\zeta}{\mathrm{d}t^2} +mN^2\zeta = F_z, \end{equation}
with  $F_z$ the hydrodynamic force. Small-amplitude analysis of the fluid motions gave
 $\zeta (t)/\zeta (0) = ({\rm \pi} /2)\,\operatorname {{\boldsymbol {E}}}_1(Nt)$ for
 $t > 0$, with
 $\operatorname {{\boldsymbol {E}}}_1$ a Weber function. Accordingly, the sphere was predicted to oscillate at frequency
 $N$ with an amplitude decay as
 $t^{-1/2}$, consistent with experiment. The oscillations satisfied the equation
 \begin{equation} \frac{\mathrm{d}^2\zeta}{\mathrm{d}t^2} + N^2\zeta +\frac{1}{t}\,\frac{\mathrm{d}\zeta}{\mathrm{d}t} +\frac{\zeta(0)-\zeta(t)}{t^2} = 0,\end{equation}
providing an a posteriori expression of the hydrodynamic force.
Winant (Reference Winant1974) proceeded differently, dropping the sphere (a ping-pong ball partially filled with salt water) at the surface of the tank and observing its fall down to its neutral level then the subsequent oscillations. The theory assumed quadratic viscous drag and negligible wave radiation, so that
 \begin{equation} (1+C^\infty)\,\frac{\mathrm{d}^2\zeta}{\mathrm{d}t^2} +\frac{3}{8}\,\frac{C_{d}}{a}\left|\frac{\mathrm{d}\zeta}{\mathrm{d}t}\right| \frac{\mathrm{d}\zeta}{\mathrm{d}t} + N^2\zeta = 0, \end{equation}
with  $C^\infty$ and
 $C_{d}$ the added mass and drag coefficients of the sphere in the absence of stratification, respectively. Agreement with experiment was found satisfactory, provided that
 $C^\infty$ was taken as
 $0.21$ instead of its usual value
 $0.5$, and
 $C_{d}$ as
 $0.72$, within the range of expected values
 $0.6$–
 $0.8$. Measurements in a deep stratified lake by Cairns, Munk & Winant (Reference Cairns, Munk and Winant1979) with a buoyant capsule of radius
 $41\ \mathrm {cm}$ confirmed this analysis.
Winant (Reference Winant1974) also considered the two mechanisms together, solving numerically an equation combining (1.7) and (1.8). He concluded that
the dynamics of displaced neutrally buoyant floats depend critically on the value of the ratio of the initial displacement to the float dimension. For small displacements, the important contribution to drag seems to be internal wave drag, as reported by Larsen. For larger displacements, such as when a float is dropped from the surface to some position in the thermocline, the drag is closer to the classical square law, which pertains in the case of large Reynolds number steady homogeneous flow.
Actual oceanographic floats are typically cylinders with lengths of a few metres and diameters ranging from a few centimetres to tens of centimetres. Voorhis (Reference Voorhis1971) considered their dynamics in detail, taking thermodynamic effects into account together with the rotation of the float. Aagaard & Ewart (Reference Aagaard and Ewart1973) adopted an approach similar to Winant (Reference Winant1974), ignoring wave radiation and retaining both linear and quadratic terms for the drag. Goodman & Levine (Reference Goodman and Levine1990) did the same but assumed the drag to arise from steady boundary-layer dissipation, hence being quadratic for a sphere and varying as the  $3/2$th power of the velocity for a streamlined float. D'Asaro (Reference D'Asaro2003, Reference D'Asaro2018) added the effect of wave radiation on the hydrodynamic force, based on numerical studies of the steady vertical motion of a sphere by Torres et al. (Reference Torres, Hanazaki, Ochoa, Castillo and Van Woert2000) and Hanazaki, Nakamura & Yoshikawa (Reference Hanazaki, Nakamura and Yoshikawa2015). These studies, whose applicability was clarified by Zhang, Mercier & Magnaudet (Reference Zhang, Mercier and Magnaudet2019) and More & Ardekani (Reference More and Ardekani2023) – see especially their table 2 – exhibited a linear variation of this force with the velocity of the sphere. This led D'Asaro (Reference D'Asaro2003, Reference D'Asaro2018) to use a hydrodynamic force varying linearly with the velocity of the float, and a drag force varying quadratically.
We argue, consistent with Winant (Reference Winant1974), that this approach is relevant for the fall of the float down to its neutral level, an essentially steady process; and that the subsequent oscillations about this level are an unsteady process, governed by added mass effects modelled according to (1.2) and (1.4) for the hydrodynamic force, and Basset–Boussinesq memory effects for the drag force. This latter assumption is consistent with the observation by Ermanyuk (Reference Ermanyuk2000, Reference Ermanyuk2002), Ermanyuk & Gavrilov (Reference Ermanyuk and Gavrilov2002a,Reference Ermanyuk and Gavrilovb, Reference Ermanyuk and Gavrilov2003) and Brouzet et al. (Reference Brouzet, Ermanyuk, Moulin, Pillet and Dauxois2017), for the oscillations of vertical pendulums, that the viscous damping of the oscillations varies as the square root of the frequency.
The present paper applies this analysis to the oscillations of three systems, displaced away from their equilibrium position in a linearly stratified fluid then released, and the outcome is compared with available laboratory measurements.
The first system, described above, is a buoyant body displaced vertically then released. This system has been studied extensively for surface gravity waves, involving a float at the free surface of a homogeneous fluid. The mathematical formulation in this case is a pair of coupled integro-differential equations (Wehausen Reference Wehausen1971), one for the boundary condition at the float, and the other for its motion. Sretenskii (Reference Sretenskii1937) assumed the float to be elongated along the vertical; this provided an immediate solution to the boundary condition and left a single equation of motion, solved numerically. The analysis, in Russian, was applied to a horizontal cylinder of cross-section  $|x|/a = \exp (-|z|/b)$, with
 $a \ll b$, and is described in detail by Wehausen & Laitone (Reference Wehausen and Laitone1960, pp. 619–620). Analytical progress for other float shapes has been limited to the asymptotic form of their position for large time, which combines algebraic decay and an exponentially damped oscillation; see Ursell (Reference Ursell1964) for a horizontal circular cylinder, and Kotik & Lurye (Reference Kotik and Lurye1964) and McIver & McIver (Reference McIver and McIver2011) for arbitrary two- and three-dimensional bodies.
Most often, the equations have been solved numerically, using boundary elements for their spatial dependence while their temporal dependence was treated either in the time domain, using a uniform discretization, or in the frequency domain, using exact or approximate representations of the contributions of the singular frequencies of the system. The former approach has been applied to a circular cylinder, either horizontal (Yeung Reference Yeung1982) or vertical (Newman Reference Newman1985), and a sphere (Beck & Liapis Reference Beck and Liapis1987; Pot & Jami Reference Pot and Jami1991), and the latter approach to a circular cylinder, either horizontal (Maskell & Ursell Reference Maskell and Ursell1970; Damaren Reference Damaren2000; Fitzgerald & Meylan Reference Fitzgerald and Meylan2011) or vertical (Wolgamot, Meylan & Reid Reference Wolgamot, Meylan and Reid2017), a sphere (Kotik & Lurye Reference Kotik and Lurye1968; Damaren Reference Damaren2000; Wolgamot et al. Reference Wolgamot, Meylan and Reid2017) and a horizontal plate (Meylan Reference Meylan2014). Comparison with experiment has been performed for the horizontal circular cylinder (Yeung Reference Yeung1982) and the sphere (Beck & Liapis Reference Beck and Liapis1987; Pot & Jami Reference Pot and Jami1991).
These approaches have been extended to include the elasticity of the floating body, and wave resonance or trapping for multiple bodies or a multiply connected body. They have now reached a degree of sophistication such that they can be applied to real-life problems such as the landing and take-off of an aeroplane on a pontoon-type very large floating structure, or the seakeeping of a floating production storage and offloading vessel.
For internal waves, a vertical disc floating at the interface of a two-layer fluid has been studied theoretically by Warren (Reference Warren1968), and Sretenskii's float theoretically by Akulenko & Nesterov (Reference Akulenko and Nesterov1987) and Akulenko et al. (Reference Akulenko, Mikhailov, Nesterov and Chaikovskii1988), and experimentally by Pyl'nev & Razumeenko (Reference Pyl'nev and Razumeenko1991), while Akulenko, Mikhailov & Nesterov (Reference Akulenko, Mikhailov and Nesterov1990), Akulenko & Baidulov (Reference Akulenko and Baidulov2019) and Baidulov (Reference Baidulov2022) considered the effect of the shape of the cross-section.
For a linearly stratified fluid, the experiments of Larsen (Reference Larsen1969) and Winant (Reference Winant1974) for a buoyant sphere had been focused on the motion of the sphere. Further attention was paid to the flow around it by Levitskii & Chashechkin (Reference Levitskii and Chashechkin1999), Chashechkin & Levitskii (Reference Chashechkin and Levitskii1999, Reference Chashechkin and Levitskii2003), Prikhod'ko & Chashechkin (Reference Prikhod'ko and Chashechkin2006), Chashechkin & Prikhod'ko (Reference Chashechkin and Prikhod'ko2006, Reference Chashechkin and Prikhod'ko2007) and Vasil'ev & Chashechkin (Reference Vasil'ev and Chashechkin2009), while Prikhod'ko & Chashechkin (Reference Prikhod'ko and Chashechkin2006) and Chashechkin & Prikhod'ko (Reference Chashechkin and Prikhod'ko2006) also considered a finite-length horizontal or vertical circular cylinder, and Biró et al. (Reference Biró, Szabó, Gyüre, Jánosi and Tél2008) a smaller sphere dropped at the surface and observed over hundreds of oscillation periods. Finally, Hurlen (Reference Hurlen2006) and Hurlen & Llewellyn Smith (Reference Hurlen and Llewellyn Smith2024) considered theoretically, experimentally and numerically the free translational and rotational oscillations of a horizontal elliptic cylinder.
The second system is the Cartesian diver, namely a hollow glass cylinder that is open at one end, partially filled with air and placed vertically in a fluid with its open end down, in a diver's bell configuration. Changes to the hydrostatic pressure will expand or contract the entrapped air, altering the diver's buoyancy and setting it into motion up or down, respectively. In a homogeneous fluid, the diver will keep moving until it emerges at the surface or sinks to the bottom; its dynamics has been studied by Güémez, Fiolhais & Fiolhais (Reference Güémez, Fiolhais and Fiolhais2002). In a stratified fluid, the diver will oscillate about its neutral level, thus behaving as a passive analogue of the autonomous Lagrangian float.
Le Gal et al. (Reference Le Gal, Castillo Morales, Hernandez-Zapata and Ruiz Chavarria2022) introduced a new experimental set-up, in which the diver was put in a closed stratified tank, and the pressure inside the tank was varied by moving a piston inside an open pipe at the top. Several configurations were tested, including one in which the piston oscillated sinusoidally for a large number of periods, causing the diver to oscillate steadily with it, then stopped abruptly, causing the diver to oscillate freely back to equilibrium.
The third system involves a cross-shaped pendulum having its vertical arm immersed in a stratified tank, with a buoyant body attached at the end of the arm. At time  $t = 0$, an impulse is applied to the pendulum, causing it to oscillate back to equilibrium. During the oscillations, the horizontal position
 $\xi$ of the body satisfies an equation of the form
 \begin{equation} M\,\frac{\mathrm{d}^2\xi}{\mathrm{d}t^2} +M\omega_0^2\xi = F_x,\end{equation}
with  $M$ the inertia of the system,
 $\omega _0$ the eigenfrequency of the pendulum in the absence of stratification, and
 $F_x$ the hydrodynamic force. Measuring the oscillations, Ermanyuk (Reference Ermanyuk2000) was able to deduce the added mass from their spectrum, by (1.9) and (1.2), thereby devising an original method for the measurement of added mass in a stratified fluid.
The method was developed for horizontal cylinders of circular (Ermanyuk Reference Ermanyuk2000) and diamond-shaped (Ermanyuk & Gavrilov Reference Ermanyuk and Gavrilov2002b) cross-sections, and for spheroids (Ermanyuk Reference Ermanyuk2002), all in effectively unbounded fluids. The effect of finite depth was investigated for a circular cylinder (Ermanyuk & Gavrilov Reference Ermanyuk and Gavrilov2002a; Brouzet et al. Reference Brouzet, Ermanyuk, Moulin, Pillet and Dauxois2017) and a sphere (Ermanyuk & Gavrilov Reference Ermanyuk and Gavrilov2003), together with a vertical plate and a conversion-free object (Brouzet et al. Reference Brouzet, Ermanyuk, Moulin, Pillet and Dauxois2017), namely an object, designed after Maas (Reference Maas2011), such that the successive reflections of the generated waves at the top and bottom of the tank interfere destructively and suppress energy radiation.
We consider the three systems in turn in §§ 2–4. For each system, the equation of motion is written for an arbitrary body, and the Fourier transform of its solution is expressed in terms of the added mass of the body. Then, depending on what is relevant in each case, the added masses derived for an elliptic cylinder of horizontal axis and a spheroid of vertical axis in Voisin (Reference Voisin2024), hereafter referred to as Part 1, from the boundary integral calculations in Voisin (Reference Voisin2021), are used. The Fourier transform is inverted exactly, in analytical or numerical form, and its expansion for large time  $Nt \gg 1$ is calculated. The predictions are compared with available measurements, and the role of viscous drag is assessed. The main conclusions are summarized in § 5.
2. Free oscillations
2.1. Inviscid analysis
We start with the free oscillations of a buoyant body. The fluid is assumed inviscid and the Boussinesq approximation valid, according to which the stratification has no inertial effect and induces only buoyancy forces. The stratification is linear with buoyancy frequency  $N$. The distributions of pressure
 $p_0(z)$ and density
 $\rho _0(z)$ at rest satisfy
 \begin{equation} \frac{\mathrm{d}p_0}{\mathrm{d}z} ={-}\rho_0g, \quad \frac{\mathrm{d}\rho_0}{\mathrm{d}z} ={-}\rho_{00}\,\frac{N^2}{g}, \end{equation}
with  $z$ the upward vertical coordinate,
 $g$ the acceleration due to gravity, and
 $\rho _{00}$ a reference density. The body, of mass
 $m$ and volume
 $\mathcal {V}$, is assumed to have the horizontal
 $x$- and
 $y$-axes and the vertical
 $z$-axis as principal directions, so that its added mass tensor is diagonal with elements
 $(m_x,m_y,m_z)$. The origin
 $z = 0$ is taken at the level where the body is neutrally buoyant, so that when the body reaches the level
 $\zeta$, the surrounding fluid has density
 \begin{equation} \rho_0(\zeta) = \rho_0(0)\left(1-\frac{N^2}{g}\,\zeta\right),\end{equation}
and its displaced mass is
 \begin{equation} m_{f}(\zeta) = \rho_0(\zeta)\,\mathcal{V} = m \left( 1-\frac{N^2}{g}\,\zeta \right), \end{equation}
with  $m = m_{f}(0) = \rho _0(0)\,\mathcal {V}$.
The body is held at the level  $\zeta _0$ for times
 $t < 0$, then released at
 $t = 0$. Its motion satisfies the equation
 \begin{equation} [m+m_z(t)\ast]\,\frac{\mathrm{d}^2\zeta}{\mathrm{d}t^2} +mN^2\,\zeta(t)= mN^2\zeta_0\,H({-}t),\end{equation}
where the acting forces are the hydrostatic force
 \begin{equation} F_{s}(t) = (m_{f}-m)g ={-}mN^2\,\zeta(t),\end{equation}
representing the combination of weight and Archimedes’ force, the hydrodynamic force
 \begin{equation} F_{d}(t) ={-}m_z(t)\ast\frac{\mathrm{d}^2\zeta}{\mathrm{d}t^2} ={-}\int m_z(\tau)\,\frac{\mathrm{d}^2\zeta}{\mathrm{d}t^2}(t-\tau)\,\mathrm{d}\tau,\end{equation}
with  $\ast$ the convolution operator, and the external force
 \begin{equation} F_{e}(t) = mN^2\zeta_0\,H({-}t), \end{equation}
with  $H(t)$ the Heaviside step function. We note that (2.5) is exact for linear stratification, and as discussed in Part 1, (2.6) is valid irrespective of the amplitude of the motion, provided that the velocity
 $\mathrm {d}\zeta /\mathrm {d}t$ remains small. Thus no assumption of small initial displacement
 $\zeta _0$ has been made yet.
We define Fourier transforms according to
 \begin{equation} f(\omega) = \int f(t)\exp(\mathrm{i}\omega t)\,\mathrm{d}t, \quad f(t) = \frac{1}{2{\rm \pi}}\int f(\omega)\exp(-\mathrm{i}\omega t)\,\mathrm{d}\omega. \end{equation}
The abrupt release at  $t = 0$ induces a singularity at
 $\omega = 0$, which is removed by writing
 \begin{equation} \zeta(t) = \zeta_0\,H({-}t)+\zeta_+(t), \quad \zeta(\omega) ={-}\frac{\mathrm{i}\zeta_0}{\omega-\mathrm{i}0} +\zeta_+(\omega), \end{equation}
where  $\omega -\mathrm {i}0$ means that a small negative imaginary part is added to
 $\omega$, while
 $\zeta _+(t)$ is causal and its transform
 $\zeta _+(\omega )$ is analytic in the upper half of the complex
 $\omega$-plane. We obtain
 \begin{equation} \frac{\zeta_+(\omega)}{\zeta_0} = \mathrm{i}\, \frac{[m+m_z(\omega)]\omega}{[m+m_z(\omega)]\omega^2-mN^2}. \end{equation}
At this stage, we introduce the added mass coefficient  $C_z(\omega ) = m_z(\omega )/m_{f}$ and write, consistent with the Boussinesq approximation,
 $m_{f}(\zeta ) \approx m_{f}(0) = m$. The solution becomes
 \begin{equation} \frac{\zeta_+(\omega)}{\zeta_0} = \mathrm{i}\, \frac{\omega[1+C_z(\omega)]}{\omega^2[1+C_z(\omega)]-N^2},\end{equation}
a transform to invert for any particular body.
We consider an elliptic cylinder, typical of two-dimensional bodies, and a spheroid, typical of three-dimensional bodies. The difference from the same investigations for surface gravity waves, discussed in § 1, is that the boundary condition has been solved in analytical form for these bodies by Voisin (Reference Voisin2021), and  $C_z(\omega )$ deduced from the solution in Part 1. Accordingly, all that is left now is the inversion of (2.11).
2.2. Elliptic cylinder
The cylinder has horizontal  $y$-axis and semi-axes
 $a$ and
 $b$ in the
 $(x,z)$-plane, respectively, with aspect ratio
 $\epsilon = b/a$. Its added mass coefficient for vertical motion is
 \begin{equation} C_z(\omega) = \frac{1}{\epsilon} \left(1-\frac{N^2}{\omega^2}\right)^{1/2},\end{equation}
yielding
 \begin{equation} \frac{\zeta_+(\omega)}{\zeta_0} = \frac{\mathrm{i}}{(\omega^2-N^2)^{1/2}}\, \frac{\epsilon\omega+(\omega^2-N^2)^{1/2}} {\omega+\epsilon(\omega^2-N^2)^{1/2}},\end{equation}
where the branch cuts away from the singularities  $\omega = \pm N$ are taken vertically downwards. This transform is inverted by an adaptation of the method of Larsen (Reference Larsen1969), presented in Appendix A, to give
 \begin{equation} \frac{\zeta_+(t)}{\zeta_0} = \frac{2}{\rm \pi}\,\epsilon \int_0^{{\rm \pi}/2} \frac{\cos(Nt\cos\theta)} {\cos^2\theta+\epsilon^2\sin^2\theta} \,\mathrm{d}\theta.\end{equation}
For  $\epsilon = 1$, namely the circular cylinder, a Bessel function of order
 $0$ is obtained,
 \begin{equation} \frac{\zeta_+(t)}{\zeta_0} = {\rm J}_0(Nt),\end{equation}
whereas for arbitrary  $\epsilon$, the use of Jacobi's expansion
 \begin{equation} \cos(Nt\cos\theta) = \sum_{n=0}^\infty ({-}1)^n\epsilon_n\, {\rm J}_{2n}(Nt)\cos(2n\theta),\end{equation}
where  $\epsilon _n = 1$ for
 $n= 0$, and
 $\epsilon _n = 2$ for
 $n \geq 1$, is the Neumann factor – followed by term-by-term integration and evaluation of each integral by the residue theorem, yields
 \begin{equation} \frac{\zeta_+(t)}{\zeta_0} = \sum_{n=0}^\infty \epsilon_n \left(\frac{1-\epsilon}{1+\epsilon}\right)^n {\rm J}_{2n}(Nt),\end{equation}
a summation of Bessel functions of even order. These results were derived previously by Larsen (Reference Larsen1969) for (2.15), and Hurlen (Reference Hurlen2006) and Hurlen & Llewellyn Smith (Reference Hurlen and Llewellyn Smith2024) for (2.14) and (2.17).
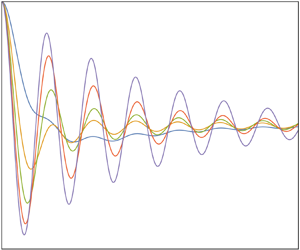
The oscillations are shown in figure 2, where time is normalized by the buoyancy period  $T = 2{\rm \pi} /N$, evaluating (2.14) numerically with Mathematica's NIntegrate. Horizontally flat bodies, with
 $\epsilon < 1$, take several periods to reach their neutral level, while vertically elongated bodies,
 $\epsilon > 1$, experience symmetrical oscillations almost from the start.
Exact (solid lines) and asymptotic (dashed lines) free oscillations of (a,c,e,g,i) elliptic cylinders and (b,d,f,h,j) spheroids of aspect ratios (a,b)  $\epsilon = 0.2$, (c,d)
 $\epsilon = 0.5$, (e,f)
 $\epsilon = 1$, (g,h)
 $\epsilon = 2$ and (i,j)
 $\epsilon = 5$, in an inviscid fluid.

In order to model these behaviours analytically, we proceed as in Part 1 for the memory integral and derive the asymptotic expansion of the oscillations for large time  $Nt \gg 1$. The analysis is presented in Appendix B. As a rule, here and later in §§ 3 and 4, the expansion combines two terms. One,
 $\zeta _2$, is present for all parameter values. It is made up of algebraically decaying oscillations at the buoyancy frequency, and – except for the pathological case of the resonance in § 4.1 – dominates ultimately for very large
 $Nt$. Depending on the case, it may need to be taken into account from the start, or after only a few periods. The other term,
 $\zeta _1$, is present only in some parameter range. Except for the resonance in § 4.1, it is significant for moderately large
 $Nt$ and vanishes afterwards.
We have here
 \begin{equation} \frac{\zeta_1(t)}{\zeta_0} \sim H(1-\epsilon) \exp(-\omega_{s}t),\end{equation}
where  $\omega _{s} = N\varOmega _{s}$, and
 \begin{equation} \varOmega_{s} = \frac{\epsilon}{(1-\epsilon^2)^{1/2}},\end{equation}
which is observed only for  $\epsilon < 1$ and gives a gradual exponential return to the neutral level. Also,
 \begin{equation} \frac{\zeta_2(t)}{\zeta_0} \sim \epsilon \left(\frac{2}{\rm \pi}\right)^{1/2} \frac{\cos(Nt-{\rm \pi}/4)}{(Nt)^{1/2}},\end{equation}
which is observed for all  $\epsilon$ and exhibits a decay of the oscillations as
 $t^{-1/2}$. The superposition of
 $\zeta _1$ and
 $\zeta _2$ is shown as a dashed line in figure 2. It provides a satisfactory description of the motion for almost any
 $t/T$ at
 $\epsilon < 1$, but requires larger values of
 $t/T$ as
 $\epsilon$ increases above
 $1$. At
 $\epsilon = 5$, for example, the expansion is valid only for
 $t/T > 15$, say (outside the displayed range).
2.3. Spheroid
Switching to a spheroid of vertical  $z$-axis, with semi-axes
 $a$ and
 $b$ along the horizontal and the vertical, respectively, and the same definition
 $\epsilon = b/a$ of the aspect ratio, the physical behaviour remains the same, but the mathematical analysis is more involved. The added mass coefficient is
 \begin{equation} C_z(\omega) = \left(1-\frac{N^2}{\omega^2}\right) \frac{D(\varUpsilon)}{1-D(\varUpsilon)},\end{equation}
where the auxiliary variable  $\varUpsilon$ is defined as
 \begin{equation} \varUpsilon = \epsilon \left(1-\frac{N^2}{\omega^2}\right)^{1/2},\end{equation}
and the auxiliary function  $D(\varUpsilon )$ as
 \begin{equation} D(\varUpsilon) = \frac{1}{1-\varUpsilon^2} \left[ 1-\varUpsilon\,\frac{\arccos\varUpsilon}{(1-\varUpsilon^2)^{1/2}} \right]. \end{equation}
The variations of  $D(\varUpsilon )$ and
 $C_z(\omega )$ in the planes of the complex variables
 $\varUpsilon$ and
 $\varOmega = \omega /N$ were discussed in Part 1. The transform (2.11) becomes
 \begin{equation} \frac{\zeta_+(\omega)}{\zeta_0} = \frac{\mathrm{i}}{\omega}\, \frac{\omega^2-N^2\,D(\varUpsilon)}{\omega^2-N^2},\end{equation}
and inverts to
 \begin{equation} \frac{\zeta_+(t)}{\zeta_0} = \epsilon \int_0^{{\rm \pi}/2} \frac{\cos(Nt\cos\theta)\cos\theta} {(\cos^2\theta+\epsilon^2\sin^2\theta)^{3/2}} \,\mathrm{d}\theta. \end{equation}
For  $\epsilon = 1$, namely the sphere, a Weber or Struve function is obtained,
 \begin{equation} \frac{\zeta_+(t)}{\zeta_0} = \frac{\rm \pi}{2}\,\operatorname{{\boldsymbol{E}}}_1(Nt) = 1-\frac{\rm \pi}{2}\,\operatorname{{\boldsymbol{H}}}_1(Nt),\end{equation}
consistent with Larsen (Reference Larsen1969). For arbitrary  $\epsilon$, the use of Jacobi's expansion yields
 \begin{equation} \frac{\zeta_+(t)}{\zeta_0} = \epsilon \sum_{n=0}^\infty ({-}1)^n\epsilon_n\,{\rm J}_{2n}(Nt) \int_0^{{\rm \pi}/2} \frac{\cos(2n\theta)\cos\theta} {(\cos^2\theta+\epsilon^2\sin^2\theta)^{3/2}} \,\mathrm{d}\theta,\end{equation}
where each integral may be evaluated by a change of variable but does not exhibit a general form for arbitrary  $n$ leading to an equivalent of (2.17).
The oscillations in figure 2 exhibit behaviour similar to that of the cylinder, except for a slight overshoot of the neutral level for  $\epsilon < 1$. This overshoot is linked to the presence of Dawson's integral
 $F(t) = \exp (-t^2)\int _0^t\exp (\tau ^2)\,\mathrm {d}\tau$ in the intermediate contribution
 \begin{equation} \frac{\zeta_1(t)}{\zeta_0} \sim H(1-\epsilon)\, \frac{1-2(\omega_{s}t)^{1/2}\,F[(\omega_{s}t)^{1/2}]} {2^{1/2}(1-\epsilon^2)^{1/2}},\end{equation}
while the ultimate contribution
 \begin{equation} \frac{\zeta_2(t)}{\zeta_0} \sim \epsilon \left(\frac{\rm \pi}{2}\right)^{1/2} \frac{\cos(Nt-{\rm \pi}/4)}{(Nt)^{1/2}},\end{equation}
is identical up to a factor  ${\rm \pi} /2$ to that for the cylinder.
2.4. Comparison with experiment
Several data sets are available in the literature, to which these predictions can be compared. Their characteristics are listed in table 1. The only similarity parameter at this stage is the Keulegan–Carpenter number  ${Ke} = \zeta _0/a$, representing the ratio of the oscillation amplitude to the size of the body. As already mentioned, the analysis assumes small oscillation velocity. With
 $Na$ the only velocity scale, and
 $N\zeta _0$ the typical oscillation velocity, this condition becomes
 ${Ke} \ll 1$, namely small displacement of the body compared with its size.
Parameters in figures 3–6 and 8.

Most measurements are for the sphere. Larsen (Reference Larsen1969) and Hurlen (Reference Hurlen2006) used big spheres with relatively small  ${Ke}$ from
 $0.5$ to
 $2$, while Levitskii & Chashechkin (Reference Levitskii and Chashechkin1999), Chashechkin & Levitskii (Reference Chashechkin and Levitskii2003) and Prikhod'ko & Chashechkin (Reference Prikhod'ko and Chashechkin2006) used smaller spheres with larger
 ${Ke}$ from
 $2$ to
 $5$, say. The comparison with theory, shown in figures 3 and 4, does not exhibit any systematic effect of
 ${Ke}$. Indeed, Vasil'ev & Chashechkin (Reference Vasil'ev and Chashechkin2009) presented statistical averages over experiments for different values of
 ${Ke}$, keeping all other parameters constant; the averages were spline-interpolated then resampled. Some experiments belonged to the earlier series by Levitskii, Prikhod'ko and Chashechkin, while others were performed specially by Y. Prikhod'ko for the purpose of the study (A. Vasil'ev, personal communication). The outcome, shown in figure 5, does not differ significantly from the direct measurements in figures 3 and 4, confirming minimal effect of
 ${Ke}$ if any.
Comparison of inviscid (blue lines) and viscous (brown lines) theories with the data (circles) in figure 2 of Larsen (Reference Larsen1969) and figure 4.3 of Hurlen (Reference Hurlen2006). Parameters values are given in table 1.

Same as figure 3 for the data in figures 2 and 7 of Levitskii & Chashechkin (Reference Levitskii and Chashechkin1999), figure 5 of Chashechkin & Levitskii (Reference Chashechkin and Levitskii2003) and figure 2 of Prikhod'ko & Chashechkin (Reference Prikhod'ko and Chashechkin2006).

Same as figure 3 for the data in figures 1 and 2 of Vasil'ev & Chashechkin (Reference Vasil'ev and Chashechkin2009).

What appears, however, is an increasing discrepancy between theory and experiment as the size of the sphere decreases, independent of  ${Ke}$. Viscous damping is the most likely explanation, for which the appropriate similarity parameter is the Stokes number
 ${St} = Na^2/\nu$ representing the ratio of the viscous time scale
 $a^2/\nu$ to the buoyancy time scale
 $1/N$, with
 $\nu$ the kinematic viscosity. The agreement between theory and experiment is good for
 ${St} > 1000$, say. As
 ${St}$ decreases below this value, the oscillations are damped faster than predicted by inviscid theory.
Measurements were done by Hurlen (Reference Hurlen2006) for elliptic cylinders of varying aspect ratio  $\epsilon$. In most cases, emphasis was on the rotational motion of the cylinder, whose elliptic cross-section was inclined. The three cases involving the translation of a straight ellipse are shown in figure 6, providing too limited a sample to draw conclusions on the role of
 $\epsilon$.
Same as figure 3 for the data in figures 4.5 and 4.6 of Hurlen (Reference Hurlen2006).

2.5. Viscous analysis
The viscous damping of the oscillations of the sphere was considered by Vasil'ev, Kistovich & Chashechkin (Reference Vasil'ev, Kistovich and Chashechkin2007) and Vasil'ev & Chashechkin (Reference Vasil'ev and Chashechkin2009). Using a no-slip boundary condition, the oscillations were obtained as a series
 \begin{equation} \frac{\zeta_+(t)}{\zeta_0} = \sum_{n=0}^\infty h_n\left(\frac{Nt}{St}\right) {\rm J}_{2n}(Nt), \end{equation}
of the same general form as the inviscid result (2.27), with the functions  $h_n$ satisfying an integro-differential system to be solved by the method of multiple scales. Inspection of this system led to the variational representation
 \begin{equation} \frac{\zeta_+(t)}{\zeta_0} = \operatorname{erf}\left[\alpha\left(\frac{St}{Nt}\right)^{1/2}\right] \sum_{n=0}^\infty\beta_n\,{\rm J}_{2n}(Nt), \end{equation}
with  $\operatorname {erf} t$ the error function. The coefficients
 $\alpha$ and
 $\beta _n$ had to be set by fit to the measurements. Eventually, only the first term of the series was retained,
 \begin{equation} \frac{\zeta_+(t)}{\zeta_0} = \operatorname{erf}\left[\alpha\left(\frac{St}{Nt}\right)^{1/2}\right] {\rm J}_0(Nt), \end{equation}
leaving a single coefficient  $\alpha$ to set.
We proceed differently, based on the observation by Ermanyuk (Reference Ermanyuk2000, Reference Ermanyuk2002), Ermanyuk & Gavrilov (Reference Ermanyuk and Gavrilov2002a,Reference Ermanyuk and Gavrilovb, Reference Ermanyuk and Gavrilov2003) and Brouzet et al. (Reference Brouzet, Ermanyuk, Moulin, Pillet and Dauxois2017) for the problem considered in § 4, that at sufficiently large  ${St}$, say
 ${St} > 100$, viscous damping is unaffected by the stratification. It is thus the same boundary-layer dissipation that gives the Basset–Boussinesq memory force in a homogeneous fluid. The modelling of this force is recalled in Appendix C, yielding the Fourier transform
 \begin{equation} F_{v}(\omega) = mN^{1/2}\omega^{3/2} \,\mathrm{e}^{{\rm i}{\rm \pi}/4}\, \frac{B_z}{{St}^{1/2}}\,\zeta(\omega),\end{equation}
where the coefficient  $B_z$, equal to
 $9/2$ for the sphere and
 $4$ for the circular cylinder, varies with the aspect ration
 $\epsilon$. The expression of
 $B_z(\epsilon )$ is given in table 4, and its variations are represented in figure 21. The Fourier transform (2.11) becomes
 \begin{equation} \frac{\zeta_+(\omega)}{\zeta_0} = \mathrm{i}\, \frac{\omega[1+C_z(\omega)] +\mathrm{e}^{{\rm i}{\rm \pi}/4} (B_z/{St}^{1/2})N^{1/2}\omega^{1/2}} {\omega^2[1+C_z(\omega)]-N^2 +\mathrm{e}^{{\rm i}{\rm \pi}/4} (B_z/{St}^{1/2})N^{1/2}\omega^{3/2}},\end{equation}
where the assumption  ${St} \gg 1$ is implicit, and the branch cut away from the singularity
 $\omega = 0$ is taken vertically downwards.
This gives for the elliptic cylinder
 \begin{equation} \frac{\zeta_+(\omega)}{\zeta_0} = \mathrm{i}\, \frac{\epsilon\omega+(\omega^2-N^2)^{1/2} +\mathrm{e}^{{\rm i}{\rm \pi}/4} (\epsilon B_z/{St}^{1/2})N^{1/2}\omega^{1/2}} {\omega(\omega^2-N^2)^{1/2}+\epsilon(\omega^2-N^2) +\mathrm{e}^{{\rm i}{\rm \pi}/4} (\epsilon B_z/{St}^{1/2})N^{1/2}\omega^{3/2}},\end{equation}
with inverse transform, obtained by the method of Appendix A,
 \begin{align} \frac{\zeta_+(t)}{\zeta_0} & = \frac{2}{\rm \pi}\,\epsilon \operatorname{Re} \left\{ \int_0^{{\rm \pi}/2} \frac{\exp(-\mathrm{i}Nt\cos\theta)\sin^2\theta} {\sin^2\theta\cos^2\theta+\epsilon^2 [ \sin^2\theta- \mathrm{e}^{{\rm i}{\rm \pi}/4} (B_z/{St}^{1/2}) \cos^{3/2}\theta ]^2} \,\mathrm{d}\theta \right\} \nonumber\\ & \quad- \frac{\epsilon^2}{\rm \pi}\, \frac{B_z}{{St}^{1/2}} \int_0^\infty \frac{\exp({-}Nt\sinh\alpha)\sinh^{1/2}\alpha\cosh\alpha} {\cosh^2\alpha\,(\sinh\alpha+\epsilon\cosh\alpha)^2+ \epsilon^2(B_z^2/{St}) \sinh^3\alpha} \,\mathrm{d}\alpha. \end{align}
Similarly, for the spheroid we have
 \begin{equation} \frac{\zeta_+(\omega)}{\zeta_0} = \frac{\mathrm{i}}{\omega}\, \frac{\omega^2-N^2\,D(\varUpsilon)+ \mathrm{e}^{{\rm i}{\rm \pi}/4} (B_z/{St}^{1/2})N^{1/2}\omega^{3/2} [1-D(\varUpsilon)]} {\omega^2-N^2+ \mathrm{e}^{{\rm i}{\rm \pi}/4} (B_z/{St}^{1/2})N^{1/2}\omega^{3/2} [1-D(\varUpsilon)]}, \end{equation}
with inverse transform
 \begin{align} \frac{\zeta_+(t)}{\zeta_0}
& = \epsilon \operatorname{Re} \left\{
\vphantom{\left\{\left[\frac{\epsilon
B_z}{{St}^{1/2}}\right]^2\right\}^{{-}1}} \int_0^{{\rm \pi}/2}
\frac{\exp(-\mathrm{i}Nt\cos\theta)}
{(1+\epsilon^2\tan^2\theta)^{3/2}} \tan^2\theta \left\{
\vphantom{\left[\frac{\epsilon B_z}{{St}^{1/2}}\right]^2}
\mathrm{i}\,\frac{{\rm \pi}^2}{4}\,
\frac{\epsilon^2B_z^2}{St}\,
\frac{\cos\theta}{(1+\epsilon^2\tan^2\theta)^3} + \left[
\vphantom{\frac{\epsilon B_z}{{St}^{1/2}}} \sin\theta
\right. \right. \right. \nonumber\\ & \quad -\! \left.\left.\left.\mathrm{e}^{{\rm i}{\rm \pi}/4}\,\frac{\epsilon
B_z}{{St}^{1/2}} \cos^{1/2}\theta\,
\frac{\operatorname{arcsinh}(\epsilon\tan\theta)+
\epsilon\tan\theta (1+\epsilon^2\tan^2\theta)^{1/2}}
{(1+\epsilon^2\tan^2\theta)^{3/2}} \right]^2
\right\}^{{-}1} \mathrm{d}\theta \right\} \nonumber\\ &\quad
-\frac{\epsilon^2}{\rm \pi}\, \frac{B_z}{{St}^{1/2}}
\int_0^{\operatorname{arctanh}\epsilon}
\frac{\exp({-}Nt\sinh\alpha)}{\sinh^{3/2}\alpha}
\cosh\alpha \left\{\frac{\epsilon^2B_z^2}{St}
\sinh\alpha\right. \nonumber\\ & \quad
+ \left. \frac{\cosh^2\alpha\,(\epsilon^2\coth^2\alpha-1)^3}
{[\epsilon\coth\alpha\,(\epsilon^2\coth^2\alpha-1)^{1/2}-
\operatorname{arccosh}(\epsilon\coth\alpha)]^2}
\vphantom{\frac{\epsilon^2B_z^2}{St}}\right\}^{{-}1} \mathrm{d}\alpha \nonumber\\ & \quad-
\frac{\epsilon^2}{\rm \pi}\, \frac{B_z}{{St}^{1/2}}
\int_{\operatorname{arctanh}\epsilon}^\infty
\frac{\exp({-}Nt\sinh\alpha)}{\sinh^{3/2}\alpha}
\cosh\alpha\left\{ \frac{\epsilon^2B_z^2}{St}
\sinh\alpha\right. \nonumber\\ & \quad +\left.
\frac{\cosh^2\alpha\,(1-\epsilon^2\coth^2\alpha)^3}
{[\arccos(\epsilon\coth\alpha)-\epsilon\coth\alpha\,
(1-\epsilon^2\coth^2\alpha)^{1/2}]^2} \vphantom{\frac{\epsilon^2B_z^2}{St}}\right\}^{{-}1}
\mathrm{d}\alpha,
\end{align}
where for  $\epsilon > 1$, the third integral is absent and the second goes from
 $0$ to
 $\infty$.
These expressions of the inverse transforms are somewhat tedious compared with their inviscid counterparts, and they do not provide any insight into the physics of the oscillations. They are, however, computationally efficient, since the Fourier integral over the semi-infinite range  $|\omega | > N$, brought in by viscosity, is turned into an integral with an exponentially decaying integrand. Each plot is then obtained within seconds. Unfortunately, the associated deformation of contour is not always possible, as discussed in Appendix A. The affected cases reveal themselves immediately, as the application of (2.36) or (2.38) to them gives an oscillation that does not start from
 $1$ at
 $t = 0$.
To deal with these cases, we take advantage of the causal nature of  $\zeta _+(t)$ and rewrite it as an inverse Laplace transform
 \begin{equation} \zeta_+(t) = \frac{1}{2\mathrm{i}{\rm \pi}} \int_{c-\mathrm{i}\infty}^{c+\mathrm{i}\infty} \zeta_+(\omega = \mathrm{i}p) \exp(pt)\,\mathrm{d}p,\end{equation}
where the real number  $c$ is on the right of all singularities of
 $\zeta _+(\omega = \mathrm {i}p)$. This transform is evaluated numerically using Mathematica's InverseLaplaceTransform, which implements a variety of standard methods (Davies & Martin Reference Davies and Martin1979; Abate, Choudhury & Whitt Reference Abate, Choudhury and Whitt2000; Cohen Reference Cohen2007). In so doing, the calculation time is multiplied by a factor
 $50$ to
 $200$, yielding
 $10$ to
 $30$ minutes, say, sometimes even more, for a single plot. For the limited number of affected cases this was deemed acceptable, but it was pointed out and demonstrated by S. Llewellyn Smith (personal communication) that implementing den Iseger's (Reference den Iseger2006) algorithm in MATLAB brings the calculation time down to a few seconds.
The oscillations are shown in figure 7 for Stokes number  ${St} = 500$. Compared with figure 2, viscosity is seen to damp the oscillations rapidly and increase their period slightly. To model this evolution, we resort again to asymptotics. For the cylinder, (2.18) and (2.20) become
 \begin{equation} \frac{\zeta_1(t)}{\zeta_0} \sim H(1-\epsilon) \exp (-\omega_{s}t) \cos \left[ Nt\, \frac{B_z}{{St}^{1/2}}\, \frac{\epsilon^{5/2}}{(1-\epsilon^2)^{5/4}} \right] \end{equation}
and
 \begin{equation} \frac{\zeta_2(t)}{\zeta_0} \sim \epsilon \cos\left(Nt-\frac{\rm \pi}{4}\right) \left\{ \left(\frac{2}{{\rm \pi} Nt}\right)^{1/2}- \frac{\epsilon B_z}{{St}^{1/2}} \exp\left(\epsilon^2B_z^2\,\frac{Nt}{2{St}}\right) \operatorname{erfc}\left[\epsilon B_z\left(\frac{Nt}{2{St}}\right)^{1/2}\right] \right\}, \end{equation}
respectively. Similarly, for the spheroid, (2.28) and (2.29) become
 \begin{align} \frac{\zeta_1(t)}{\zeta_0} & \sim \frac{{\rm \pi}^{2/3}}{3}\,\frac{{St}^{1/6}}{B_z^{1/3}}\, \frac{H(1-\epsilon)}{\epsilon^{1/2}(1-\epsilon^2)^{1/12}} \exp \left[ -\omega_{s}t -\frac{{\rm \pi}^{2/3}}{4}\, Nt\,\frac{B_z^{2/3}}{{St}^{1/3}}\, \frac{\epsilon^2}{(1-\epsilon^2)^{4/3}} \right] \nonumber\\ & \quad\times \cos \left[ \frac{3^{1/2}{\rm \pi}^{2/3}}{4}\,Nt\, \frac{B_z^{2/3}}{{St}^{1/3}}\, \frac{\epsilon^2}{(1-\epsilon^2)^{4/3}} +\frac{\rm \pi}{6} \right] \end{align}
and
 \begin{align}
\frac{\zeta_2(t)}{\zeta_0} &\sim \epsilon
\cos\left(Nt-\frac{\rm \pi}{4}\right) \left\{\vphantom{\left.\quad -\,
\frac{{\rm \pi}^2}{4}\,\frac{\epsilon B_z}{{St}^{1/2}}
\exp\left(\frac{{\rm \pi}^2}{4}\,\epsilon^2B_z^2\,\frac{Nt}{2{St}}\right)
\operatorname{erfc}\left[\frac{\rm \pi}{2}\,\epsilon
B_z\left(\frac{Nt}{2{St}}\right)^{1/2}\right] \right\}}
\left(\frac{\rm \pi}{2Nt}\right)^{1/2}\right.\nonumber\\ &\left.\quad -\,
\frac{{\rm \pi}^2}{4}\,\frac{\epsilon B_z}{{St}^{1/2}}
\exp\left(\frac{{\rm \pi}^2}{4}\,\epsilon^2B_z^2\,\frac{Nt}{2{St}}\right)
\operatorname{erfc}\left[\frac{\rm \pi}{2}\,\epsilon
B_z\left(\frac{Nt}{2{St}}\right)^{1/2}\right] \right\},
\end{align}
respectively.
Same as figure 2 in a viscous fluid at Stokes number  ${St} = 500$.

The general trend (2.40) for the cylinder includes a low-frequency modulation added by viscosity, while (2.42) for the spheroid points out a singularity of the inviscid limit  ${St} \to \infty$. A more physical result is the transition, described by (2.41) and (2.43), between two ultimate regimes: one inviscid, for
 ${St} \gg Nt \gg 1$, given by (2.20) and (2.29), made of buoyancy oscillations decaying as
 $t^{-1/2}$; and another viscous, for
 $Nt \gg {St} \gg 1$, given by
 \begin{equation} \frac{\zeta_2(t)}{\zeta_0} \sim \left(\frac{2}{\rm \pi}\right)^{1/2}\, \frac{St}{\epsilon B_z^2} \frac{\cos(Nt-{\rm \pi}/4)}{(Nt)^{3/2}} \end{equation}
for the cylinder, and
 \begin{equation} \frac{\zeta_2(t)}{\zeta_0} \sim \left(\frac{2}{\rm \pi}\right)^{3/2} \frac{St}{\epsilon B_z^2}\, \frac{\cos(Nt-{\rm \pi}/4)}{(Nt)^{3/2}}\end{equation}
for the spheroid, made up of oscillations decaying faster as  $t^{-3/2}$.
The comparison of these asymptotics with the exact solution in figure 7 is less successful than in the inviscid case. It becomes even inconclusive for  $\epsilon = 5$: the asymptotics start by underestimating the amplitude, get it right after about ten periods, then overestimate it; all along, they underestimate the period slightly so that after ten periods there is a one-period shift with the actual oscillations. The mathematical explanation of this failure is discussed in Appendix B. The asymptotics must thus be viewed only as a qualitative tool, to point out the effects of viscosity.
The comparison with experiment in figures 3–6 shows that viscous effects are significant for  ${St} < 1000$ and are described satisfactorily by the present model in most cases. In figures 4(a,b,e) and 5(a,b,e,g), in particular, the model appears in full quantitative agreement with the measurements after one or two periods. The prediction of an ultimate decay as
 $t^{-3/2}$ is reminiscent of the observation by Biró et al. (Reference Biró, Szabó, Gyüre, Jánosi and Tél2008), in experiments carried over
 $400$ buoyancy periods, of a power decay as
 $t^{-3/2}$ during the first
 $200$ periods. This is confirmed by the comparison with their data in figure 8. These experiments, involving small spheres dropped at the surface of a
 $50\ \mathrm {cm}$ high tank, were originally thought irrelevant for the present study owing to their large initial displacement (
 ${St} = 66$ and
 ${Ke} = 33$ in figure 8), and suited instead for a description by the approach of Winant (Reference Winant1974), as discussed in § 1. The good agreement with small-amplitude theory may thus be entirely coincidental.
(a) Global and (b) local comparisons of inviscid (blue line) and viscous (brown lines) theories with the data (circles) for run 3 in figure 2 of Biró et al. (Reference Biró, Szabó, Gyüre, Jánosi and Tél2008). The other runs (1, 2 and 4) give similar results. In (b), only the viscous theory is shown, with the solid line representing the exact result (2.37) and (2.39), the dashed line the uniform expansion (2.43), and the dotted line the non-uniform expansion (2.45). The original data were shifted between runs to achieve the best fit in the period  $2 < t/T < 3$, making the slight time shift between the data and the theory insignificant.

Winant (Reference Winant1974) dropped ping-pong balls of radius  $a = 1.875\ \mathrm {cm}$ at the surface of a
 $1\ \mathrm {m}$ high tank stratified with buoyancy frequency approximately
 $N = 1\ \mathrm {s}^{-1}$. The balls were partially filled with salt water to be neutrally buoyant at the mid-height of the tank, so that for drop height
 $\zeta _0 = 50\ \mathrm {cm}$, the Stokes number was
 ${St} = 350$ and the Keulegan–Carpenter number was
 ${Ke} = 30$. The observed first overshoot was significantly smaller than that, about half the drop height, predicted by the present theory. Unfortunately the rescalings in figure 7 of Winant (Reference Winant1974), and the absence of any indication on the time taken by the ball to reach its neutral level, prohibit the same comparison as for Biró et al. (Reference Biró, Szabó, Gyüre, Jánosi and Tél2008). Cairns et al. (Reference Cairns, Munk and Winant1979) dropped a neutrally buoyant capsule of radius
 $a = 41.5\ \mathrm {cm}$ into Lake Tahoe, where it sank to an equilibrium depth of about
 $\zeta _0 = 240\ \mathrm {m}$, at which the buoyancy frequency was
 $N = 2\times 10^{-4}\ \mathrm {s}^{-1}$, so that
 ${St} = 30$ and
 ${Ke} = 600$, and observed a first overshoot of approximately one capsule diameter.
3. Cartesian diver
The Cartesian diver is a hollow glass cylinder that is open at one end, partially filled with air and placed vertically in a fluid with its open end down. The experiments of Le Gal et al. (Reference Le Gal, Castillo Morales, Hernandez-Zapata and Ruiz Chavarria2022) put the diver in a closed stratified tank and varied the pressure inside the tank by moving a piston inside an open pipe at the top. We consider the configuration illustrated in figure 9, where the piston oscillates sinusoidally for a large number of periods, causing the diver to oscillate steadily with it, then the piston stops abruptly, causing the diver to oscillate freely back to equilibrium.
Tracking of the Cartesian diver in the experiments of Le Gal et al. (Reference Le Gal, Castillo Morales, Hernandez-Zapata and Ruiz Chavarria2022). The data are similar to their figure 2, but correspond to the measurements in their figures 4(a) and 4(b), respectively. The red dot indicates the time when the diver reaches its first peak after the forcing has stopped.

3.1. Inviscid analysis
The modelling of this set-up follows the same lines as in § 2. The diver combines a fixed volume  $\mathcal {V}_{g}$ of glass with density
 $\rho _{g}$, and a varying volume
 $\mathcal {V}_{a}$ of air with negligible density. Its mass
 $m = \rho _{g}\mathcal {V}_{g}$ is thus constant, while the mass of the displaced fluid
 $m_{f} = \rho _0(\mathcal {V}_{g}+\mathcal {V}_{a})$ varies. The vertical origin
 $z = 0$ is taken at the neutral level where the weight of the diver is exactly opposed by Archimedes’ force, so that
 \begin{equation} m_{f}(0) = \rho_0(0)\,[\mathcal{V}_{g}+\mathcal{V}_{a}(0)] = m = \rho_{g}\mathcal{V}_{g}, \end{equation}
while the piston is at rest at the vertical position  $h = 0$ (with a different vertical origin). The piston then moves to a new position
 $h$, causing the diver to reach the position
 $\zeta$. Both displacements are assumed small. The ambient pressure changes hydrostatically to
 $p_0(\zeta ) = p_0(0)+\rho _0(0)\,g(h-\zeta )$, and the entrapped air volume changes adiabatically to
 \begin{equation} \mathcal{V}_{a}(\zeta) = \mathcal{V}_{a}(0) \left[ 1-\frac{g}{\gamma}\, \frac{\rho_0(0)}{p_0(0)}\,(h-\zeta) \right], \end{equation}
with  $\gamma$ the ratio of specific heats of air. Meanwhile, the ambient density has changed to
 $\rho _0(\zeta )$ given in (2.2). The new displaced fluid mass is
 \begin{equation} m_{f}(\zeta) = \rho_0(\zeta)\,[\mathcal{V}_{g}+\mathcal{V}_{a}(\zeta)] = m \left( 1-\frac{N^2-\omega_0^2}{g}\,\zeta-\frac{\omega_0^2}{g}\,h \right), \end{equation}
where
 \begin{equation} \delta = 1-\frac{\rho_0(0)}{\rho_{g}}, \quad \omega_0 = g\left[\frac{\delta}{\gamma}\,\frac{\rho_0(0)}{p_0(0)}\right]^{1/2}. \end{equation}
The diver is acted upon by the hydrostatic force
 \begin{equation} F_{s}(t) ={-}m(N^2-\omega_0^2)\,\zeta(t)-m\omega_0^2\,h(t), \end{equation}
together with the hydrodynamic force (2.6), yielding the equation of motion
 \begin{equation} [m+m_z(t)\ast]\,\frac{\mathrm{d}^2\zeta}{\mathrm{d}t^2} +m(N^2-\omega_0^2)\,\zeta(t) ={-}m\omega_0^2\,h(t),\end{equation}
first derived by Le Gal et al. (Reference Le Gal, Castillo Morales, Hernandez-Zapata and Ruiz Chavarria2022). As remarked by them, the diver is a stable oscillator provided that  $\omega _0 < N$, which is the case considered here. Taking Fourier transforms in time, we introduce the added mass coefficient
 $C_z(\omega )$, and write
 $m_z(\omega ) = m_{f}\,C_z(\omega ) \approx m\,C_z(\omega )$, consistent with the Boussinesq approximation.
In the experiments of Le Gal et al. (Reference Le Gal, Castillo Morales, Hernandez-Zapata and Ruiz Chavarria2022), the piston started by performing sinusoidal oscillations  $h(t) = h_0\exp (-\mathrm {i}\omega _{f}t)$ of frequency
 $\omega _{f}$, causing the diver to oscillate with it as
 $\zeta (t) = \zeta _0\exp (-\mathrm {i}\omega _{f}t)$, where
 \begin{equation} \frac{\zeta_0}{h_0} = \frac{\omega_0^2} {\omega_{f}^2[1+C_z(\omega_{f})]+\omega_0^2-N^2},\end{equation}
in phase with the piston in the supercritical case  $\omega _{f} > N$, and out of phase in the subcritical case
 $\omega _{f} < N$.
The piston was then stopped at a random instant, and the free oscillations of the diver were recorded after it reached its next peak, shown with a red dot in figure 9 (P. Le Gal, personal communication). For lack of a better way to model this process, we assume that the stop took place when the diver was at a peak. We thus set  $t = 0$ at the stop, and write
 $h_0 = A\exp (-\mathrm {i}\phi )$, where the real positive
 $A$ represents the amplitude of the piston's oscillations, and
 $\phi$ their initial phase, adjusting
 $\phi$ to make
 $\zeta _0$ real positive in (3.7). As in § 2, the motion of the diver is decomposed as
 \begin{equation} \zeta(t) = \zeta_0\exp(-\mathrm{i}\omega_{f}t)\,H({-}t)+\zeta_+(t), \quad \zeta(\omega) ={-}\frac{\mathrm{i}\zeta_0}{\omega-\omega_{f}-\mathrm{i}0} +\zeta_+(\omega), \end{equation}
with  $\zeta _+(t)$ causal and
 $\zeta _+(\omega )$ analytic in the upper half-plane, and given by
 \begin{equation} \frac{\zeta_+(\omega)}{h_0} = \frac{\mathrm{i}}{\omega-\omega_{f}} \left\{ \frac{\zeta_0}{h_0} - \frac{\omega_0^2} {\omega^2[1+C_z(\omega)] +\omega_0^2-N^2} \right\}. \end{equation}
To go further, a representation of the diver is required. No analytical result exists for the added mass of a finite-length cylinder. Le Gal et al. (Reference Le Gal, Castillo Morales, Hernandez-Zapata and Ruiz Chavarria2022) used the results of Voisin (Reference Voisin2007) for a sphere, adding adjustable coefficients and power laws to fit the experiments. We investigate whether a more predictive approach is possible, based on an approximate representation of the shape of the diver.
It is common practice in homogeneous fluids to model anisotropic bodies, either big (Korotkin Reference Korotkin2009) or small (Voth & Soldati Reference Voth and Soldati2017), as spheroids. In naval hydrodynamics, for which the bodies are usually elongated and streamlined, the equivalent spheroid has the same axial length and volume as the body (Korotkin Reference Korotkin2009, § 3.5.2). The situation here is different, with the main contribution to added mass coming from the blunt ends of the diver (P. Le Gal, personal communication). For rod-like particles, in the creeping flow regime, different recommendations have been made depending on the motion of the rod: for translation, the equivalent spheroid has the same axial and transverse lengths as the rod (Weinheimer Reference Weinheimer1987); for rotation, the spheroid has an axial to transverse aspect ratio equal to  $1.14 \epsilon ^{0.844}$, with
 $\epsilon$ the aspect ratio of the rod (Harris & Pittman Reference Harris and Pittman1975).
Loewenberg (Reference Loewenberg1993a,Reference Loewenbergb) considered the low- and high-frequency translational oscillations of a finite-length cylinder, looking at Stokes drag, added mass and the Basset–Boussinesq force, then studied the flow in greater detail (Loewenberg Reference Loewenberg1994a,Reference Loewenbergb). The way in which these three components of fluid resistance combine their effects, and the way in which they vary with the frequency, were seen to be the same for the cylinder and for a spheroid of the same aspect ratio  $\epsilon$, provided that
 $0.1 < \epsilon < 10$. However, the actual value of added mass and its variations with
 $\epsilon$ were predicted with only mild accuracy for transverse oscillations, and with poor accuracy for axial oscillations. This is in agreement with the above observation by P. Le Gal.
In the following, for lack of a better analytical model, we consider a spheroid with the same axial length  $2b$ as the diver and a volume-preserving transverse radius
 $a$ equal to
 $(3/2)^{1/2} \approx 1.22$ times the radius of the diver. With
 $C_z(\omega )$ given in (2.21), the amplitude of the oscillations in the forced regime becomes
 \begin{equation} \frac{\zeta_0}{h_0} = \frac{\omega_0^2[1-D(\varUpsilon_{f})]} {\omega_{f}^2-N^2 +\omega_0^2[1-D(\varUpsilon_{f})]},\end{equation}
where  $\varUpsilon _{f}$ denotes the value of the variable (2.22) at
 $\omega = \omega _{f}$, and the Fourier transform of the free oscillations afterwards becomes
 \begin{equation} \frac{\zeta_+(\omega)}{h_0} = \frac{\mathrm{i}}{\omega-\omega_{f}} \left\{ \frac{\zeta_0}{h_0} - \frac{\omega_0^2[1-D(\varUpsilon)]} {\omega^2-N^2 +\omega_0^2[1-D(\varUpsilon)]} \right\}.\end{equation}
Inverting this transform as before, we obtain
 \begin{align} \frac{\zeta_+(t)}{h_0} & =
\mathrm{i}\operatorname{Im} \left[ \frac{\zeta_0}{h_0}
\right] \exp(-\mathrm{i}\omega_{f}t) +
\frac{1}{\epsilon\varOmega_0^2}
{\unicode{x2A0D}}_0^{\pi/2}
\frac{\cos\theta\cos(Nt\cos\theta)
-\mathrm{i}\varOmega_{f}\sin(Nt\cos\theta)}
{\varOmega_{f}^2-\cos^2\theta} \nonumber\\ & \quad \times
\left\{ \vphantom{\left.
\left.\vphantom{\frac{\sin\theta\cos\theta}{\epsilon\varOmega_0^2}}
\times(1+\epsilon^2\tan^2\theta)^{3/2}
\right]^2\right\}^{{-}1}}
\frac{\pi^2}{4}+ \left[
\operatorname{arcsinh}(\epsilon\tan\theta)+
\epsilon\tan\theta\,(1+\epsilon^2\tan^2\theta)^{1/2}-
\frac{\sin\theta\cos\theta}{\epsilon\varOmega_0^2} \right.
\right. \nonumber\\ & \quad \times\! \left. \left. (1+\epsilon^2\tan^2\theta)^{3/2}
\vphantom{\frac{\sin\theta\cos\theta}{\epsilon\varOmega_0^2}}\right]^2\right\}^{{-}1} \sin^2\theta\cos\theta
(1+\epsilon^2\tan^2\theta)^{3/2}\,\mathrm{d}\theta,
\end{align}
where  $\varOmega _0 = \omega _0/N$ and
 $\varOmega _{f} = \omega _{f}/N$. For subcritical forcing,
 $\varOmega _{f} < 1$, the first term on the right-hand side is non-zero, and the integral in the second term must be interpreted as a principal value, denoted by a stroke. For supercritical forcing,
 $\varOmega _{f} > 1$, the first term vanishes and the integral becomes regular.
To exhibit the physical content of this expression, we turn again to its expansion for large time,  $Nt \gg 1$. The intermediate contribution for moderately large
 $Nt$ is an exponentially damped oscillation
 \begin{align} \frac{\zeta_1(t)}{h_0} & \sim 2\epsilon\, \frac{\exp(-\omega_{i}t)} {\varOmega_{r}^2+(\varOmega_{i}-\mathrm{i}\varOmega_{f})^2}\, [\varOmega_{r}\operatorname{Re}-(\varOmega_{i}-\mathrm{i}\varOmega_{f})\operatorname{Im}] \nonumber\\ & \quad \times \left\{ \frac{\varUpsilon_{c}^2-1} {2(\varOmega_0^2-1)(\epsilon^2-\varUpsilon_{c}^2)^2+ \epsilon^2-\varUpsilon_{c}^2+2\epsilon^2(\epsilon^2-1)}\, \frac{\varUpsilon_{c}^2\exp(-\mathrm{i}\omega_{r}t)} {(\epsilon^2-\varUpsilon_{c}^2)^{1/2}} \right\}, \end{align}
where  $\omega _{r} = N\varOmega _{r}$ and
 $\omega _{i} = N\varOmega _{i}$, and the real and imaginary parts apply to the term in curly braces afterwards. Here,
 $\varUpsilon _{c}$ and
 $\overline {\varUpsilon _{c}}$ are the complex conjugate solutions of the equation
 \begin{equation} \frac{\varUpsilon^2}{\epsilon^2-\varUpsilon^2}+\varOmega_0^2[1-D(\varUpsilon)] = 0, \end{equation}
with  $\operatorname {Re}\varUpsilon _{c} < 0$ and
 $\operatorname {Im}\varUpsilon _{c} > 0$, and
 $\pm \varOmega _{r}-\mathrm {i}\varOmega _{i}$ are the associated reduced frequencies, with
 \begin{equation} \varOmega_{r}-\mathrm{i}\varOmega_{i} = \frac{\epsilon}{(\epsilon^2-\varUpsilon_{c}^2)^{1/2}},\end{equation}
and the determination of the square root is chosen such that  $0 < \varOmega _{r} < 1$ and
 $\varOmega _{i} > 0$. The ultimate contribution for very large
 $Nt$ is the buoyancy oscillation
 \begin{equation} \frac{\zeta_2(t)}{h_0} \sim \left(\frac{2}{\rm \pi}\right)^{3/2} \frac{1}{\epsilon\varOmega_0^2(\varOmega_{f}^2-1)}\, \frac{\sin(Nt-{\rm \pi}/4) +\mathrm{i}\varOmega_{f}\cos(Nt-{\rm \pi}/4)} {(Nt)^{3/2}},\end{equation}
decaying as  $t^{-3/2}$.
Accordingly, once the forcing has stopped, the diver starts by performing oscillations  $\zeta _1$ of frequency
 $\omega _{r}$ and damping rate
 $\omega _{i}$, before oscillations
 $\zeta _2$ of frequency
 $N$ and amplitude decaying as
 $t^{-3/2}$ manifest themselves, to eventually take over. This evolution is shown in figure 10 for two cases, one subcritical (
 $\varOmega _{f} = 0.8$) and the other supercritical (
 $\varOmega _{f} = 1.2$). The contribution
 $\zeta _1$, with
 $\varOmega _{r} = 0.847$ and
 $\varOmega _{i} = 0.088$ for these
 $\epsilon$ and
 $\varOmega _0$, is shown alone for
 $t/T < 4$ in the subcritical case, and
 $t/T < 2.1$ in the supercritical case; then
 $\zeta _2$ is added at later times. The transition between a first regime with dominant
 $\zeta _1$ and a second regime with dominant
 $\zeta _2$ takes place during the periods
 $11 < t/T < 12$ in the subcritical case and
 $6 < t/T < 7$ in the supercritical case.
Exact (solid lines) and asymptotic (dashed lines) free oscillations of a diver of aspect ratio  $\epsilon = 2$ and intrinsic frequency
 $\varOmega _0 = 1/2$ after forcing at the frequencies (a)
 $\varOmega _{f} = 0.8$ and (b)
 $\varOmega _{f} = 1.2$.

These theoretical predictions are now compared with the measurements in figures 3 and 4 of Le Gal et al. (Reference Le Gal, Castillo Morales, Hernandez-Zapata and Ruiz Chavarria2022), for which the fluid was linearly stratified with buoyancy frequency  $N = 1.6\ \mathrm {s}^{-1}$. The diver had axial length
 $2b = 35\ \mathrm {mm}$ and transverse radius
 $6.25\ \mathrm {mm}$, yielding
 $a = 7.65\ \mathrm {mm}$ and
 $\epsilon = 2.3$ for the equivalent spheroid. The effective glass density, taking into account the fluid entrapped under the air pocket and transported with the diver, was
 $\rho _{g} = 1445\ \mathrm {kg}\ \mathrm {m}^{-3}$. The density of the fluid was
 $\rho _0(0) = 1030\ \mathrm {kg}\ \mathrm {m}^{-3}$ at the neutral level. The experiments were performed in Mexico City where the atmospheric pressure was
 $77\ \mathrm {kPa}$, yielding
 $\omega _0 = 0.5062\ \mathrm {s}^{-1}$ (P. Le Gal, personal communication) and
 $\varOmega _0 = 0.32$. The piston oscillated with amplitude
 $A = 28\ \mathrm {mm}$, corrected for surface tension.
Figure 11 compares the forced response (3.10) with its measurement. The position of the peak is predicted reasonably well, at a frequency slightly smaller than the buoyancy frequency, consistent with  $\varOmega _{r} = 0.956$ and
 $\varOmega _{i} = 0.055$ for these
 $\epsilon$ and
 $\varOmega _0$, but the value of the peak is overpredicted by a factor of about
 $3$. The free oscillations (3.12) are compared with their measurements in figure 12, showing that the damping is underpredicted together with the frequency. Again, the necessity arises of taking viscous dissipation into account.
Experimental data (circles) for the forced oscillations of the diver in figure 3 of Le Gal et al. (Reference Le Gal, Castillo Morales, Hernandez-Zapata and Ruiz Chavarria2022), and comparison with inviscid theory (blue line), viscous theory for Basset–Boussinesq damping (red line), and viscous theory for Stokes damping using the predicted (brown line) and estimated (green line) values of the resistance tensor.

Experimental data (black lines) in figure 4 of Le Gal et al. (Reference Le Gal, Castillo Morales, Hernandez-Zapata and Ruiz Chavarria2022) for the free oscillations of the diver after (a) subcritical and (b) supercritical forcing, and comparison with inviscid (blue lines) and viscous (brown lines) theories. The data are those appearing after the red dots in figure 9.

3.2. Viscous analysis
With  $\nu = 0.01\ \mathrm {cm}^2\ \mathrm {s}^{-1}$, the value of the Stokes number
 ${St} = 94$ suggests the same dissipative force (2.33), of the Basset–Boussinesq type, as in § 2.5, yielding the forced response
 \begin{equation} \frac{\zeta_0}{h_0} = \frac{\omega_0^2[1-D(\varUpsilon_{f})]} {\omega_{f}^2-N^2 +[\omega_0^2+\mathrm{e}^{{\rm i}{\rm \pi}/4}\, (B_z/{St}^{1/2})N^{1/2}\omega_{f}^{3/2}] [1-D(\varUpsilon_{f})]}.\end{equation}
The comparison with experiment in figure 11, using the value of  $B_z(\epsilon )$ taken from table 4, invalidates this assumption, consistent with the observation by Le Gal et al. (Reference Le Gal, Castillo Morales, Hernandez-Zapata and Ruiz Chavarria2022) that damping is of the Stokes resistance type. The dissipative force becomes
 \begin{equation} F_{v}(\omega) = \mathrm{i} mN\omega\, \frac{R_z}{St}\,\zeta(\omega),\end{equation}
yielding the response
 \begin{equation} \frac{\zeta_0}{h_0} = \frac{\omega_0^2[1-D(\varUpsilon_{f})]} {\omega_{f}^2-N^2 +[\omega_0^2+\mathrm{i}(R_z/{St})N\omega_{f}] [1-D(\varUpsilon_{f})]}.\end{equation}
This formula, either taking  $R_z(\epsilon )$ from table 4 or using its estimation by Le Gal et al. (Reference Le Gal, Castillo Morales, Hernandez-Zapata and Ruiz Chavarria2022) as
 $\lambda _z/m = N(R_z/{St}) = 0.16\ \mathrm {s}^{-1}$, improves the comparison significantly, regarding both the position of the peak and its value. Agreement is better using the estimated coefficient, which gives a peak value of about
 $1.6$ times its measurement, thus showing that, contrary to the Basset–Boussinesq force, Stokes damping is affected significantly by the stratification.
Retaining this model, the Fourier transform (3.11) becomes
 \begin{equation} \frac{\zeta_+(\omega)}{h_0} = \frac{\mathrm{i}}{\omega-\omega_{f}} \left\{ \frac{\zeta_0}{h_0} - \frac{\omega_0^2[1-D(\varUpsilon)]} {\omega^2-N^2 +[\omega_0^2+\mathrm{i}(R_z/{St})N\omega] [1-D(\varUpsilon)]} \right\}.\end{equation}
Numerical inversion and comparison with experiment in figure 12 show that the addition of Stokes resistance leads to a better prediction of the amplitude of the oscillations, but does not arrange the prediction of their frequency, which remains fully off.
A first explanation is the inadequacy of the model of the diver as a spheroid. This model, however, gives acceptable results for the frequency response. A second explanation is the random time at which the forcing is stopped, which the theory cannot account for.
4. Impulse response
Ermanyuk (Reference Ermanyuk2000, Reference Ermanyuk2002), Ermanyuk & Gavrilov (Reference Ermanyuk and Gavrilov2002a,Reference Ermanyuk and Gavrilovb, Reference Ermanyuk and Gavrilov2003) and Brouzet et al. (Reference Brouzet, Ermanyuk, Moulin, Pillet and Dauxois2017) introduced an original method for measuring the added mass of a body in a stratified fluid, by attaching the body to a pendulum to which an impulse was applied, then deducing the frequency variations of its added mass from the Fourier analysis of the response of the pendulum. We proceed the other way round, deducing the response of the pendulum from the known variations of the added mass of the body.
4.1. Inviscid analysis
The set-up involves a cross-shaped pendulum, with one arm horizontal along the surface of the tank, and the other arm vertical. The body is attached at the lower end of the vertical arm, and a movable counterweight is fitted at its upper end. The length  $L$ from the axis of the pendulum to the centroid of the body is large enough for the motion of the body to be considered as a horizontal translation, for which the ratio
 $M = J/L^2$, with
 $J$ the moment of inertia of the whole system (pendulum, body and counterweight), acts as a generalized inertia. The immersed part of the pendulum is streamlined, such that its volume is less than
 $1\,\%$ of the volume of the body, and its added mass may be neglected. The restoring force acting on the pendulum depends on the distance of the counterweight to the axis. It is measured prior to the experiment by in situ static calibration, yielding the restoring coefficient
 $K$, and from it the eigenfrequency
 $\omega _0 = (K/M)^{1/2}$.
At the start of the experiment, an impulsive force is applied,
 \begin{equation} F_{e}(t) = MN\xi_0\,\delta(t), \end{equation}
with  $\delta (t)$ the Dirac delta function, setting the pendulum into motion. The pendulum then oscillates under the combined effects of the hydrodynamic force
 \begin{equation} F_{d}(t) ={-}m_x(t)\ast\frac{\mathrm{d}^2\xi}{\mathrm{d}t^2}, \end{equation}
with  $m_x(t)$ the added mass of the body and
 $\xi$ its horizontal displacement, and the restoring force
 \begin{equation} F_{r}(t) ={-}K\,\xi(t). \end{equation}
Its motion satisfies the equation
 \begin{equation} [M+m_x(t)\ast]\,\frac{\mathrm{d}^2\xi}{\mathrm{d}t^2} +K\,\xi(t) = MN\xi_0\,\delta(t).\end{equation}
Taking Fourier transforms in time and introducing the mass  $m_{f}$ of the displaced fluid, its ratio
 $\sigma = m_{f}/M$ to the inertia of the system and the added mass coefficient
 $C_x(\omega ) = m_x(\omega )/m_{f}$, we obtain
 \begin{equation} \frac{\xi(\omega)}{\xi_0} = \frac{N}{\omega_0^2-\omega^2[1+\sigma\,C_x(\omega)]},\end{equation}
allowing the deduction of  $C_x(\omega )$ from the measurement of
 $\xi (\omega )$.
The experimental record of the oscillations was given in two cases, a circular cylinder (Ermanyuk Reference Ermanyuk2000) and a diamond-shaped cylinder (Ermanyuk & Gavrilov Reference Ermanyuk and Gavrilov2002b). We consider an elliptic cylinder of aspect ratio  $\epsilon$, for which
 \begin{equation} C_x(\omega) = \epsilon \left(1-\frac{N^2}{\omega^2}\right)^{1/2},\end{equation}
so that
 \begin{equation} \frac{\xi(\omega)}{\xi_0} = \frac{N} {\omega_0^2-\omega^2-\epsilon\sigma\omega(\omega^2-N^2)^{1/2}}.\end{equation}
A new feature, compared with the free oscillations in § 2.1, is the existence, in the plane of the complex variable  $\varOmega = \omega /N$, of poles that are not only imaginary, like
 $-\mathrm {i}\varOmega _{s}$ previously, but also complex or even real, implying a resonance. These poles are created by the presence of the intrinsic frequency
 $\varOmega _0 = \omega _0/N$ in the system. To find them, we look for the solutions of the squared equation
 $(\varOmega _0^2 -\varOmega ^2)^2 = \epsilon ^2\sigma ^2\varOmega ^2(\varOmega ^2-1)$, then check which of these satisfy the original equation
 $\varOmega _0^2 -\varOmega ^2 = \epsilon \sigma \varOmega (\varOmega ^2-1)^{1/2}$. For complex solutions, this means satisfying the conditions
 $|\operatorname {Re}\varOmega | < 1$ and
 $\operatorname {Im}\varOmega < 0$, which ensures that the solutions belong to the proper Riemann sheet.
The poles are linked to the sign of
 \begin{equation} \varDelta = 4\varOmega_0^2(\varOmega_0^2-1)+\epsilon^2\sigma^2 = (2\varOmega_0^2-1)^2+\epsilon^2\sigma^2-1. \end{equation}
Each of them is associated with a different type of response. When  $\varDelta > 0$, we define
 \begin{equation} \varOmega_\pm{=} \left| \frac{2\varOmega_0^2-\epsilon^2\sigma^2\pm\epsilon\sigma\varDelta^{1/2}} {2(1-\epsilon^2\sigma^2)} \right|^{1/2}.\end{equation}
When the quantity inside the modulus sign is positive, a sinusoidal oscillation is obtained,
 \begin{equation} \varXi_-^{(\mathrm{o})}(t) = 2\, \frac{(\varOmega_-^2-1)^{1/2}}{\varDelta^{1/2}} \sin(\omega_-t), \end{equation}
where  $\omega _- = N\varOmega _-$, coming from the real poles
 $\pm \varOmega _-$. When the quantity is negative, an exponential decay is obtained,
 \begin{equation} \varXi_\pm^{(\mathrm{d})}(t) ={\pm} \frac{(\varOmega_\pm^2+1)^{1/2}}{\varDelta^{1/2}} \exp(-\omega_\pm t), \end{equation}
where  $\omega _+ = N\varOmega _+$, coming from the negative imaginary poles
 $-\mathrm {i}\varOmega _\pm$. When
 $\varDelta < 0$, we define
 \begin{equation} \varOmega_{s} = \frac{\varOmega_0}{(1-\epsilon^2\sigma^2)^{1/4}}.\end{equation}
An exponentially damped oscillation is obtained,
 \begin{equation} \varXi_{s}(t) = 2\, \frac{(1-\varOmega_0^2)^{1/2}}{(1-\epsilon^2\sigma^2)^{1/4}\,|\varDelta|^{1/2}} \exp(-\omega_{i}t) \sin(\omega_{r}t-\varPsi_{s}),\end{equation}
where  $\omega _{r} = N\varOmega _{r}$ and
 $\omega _{i} = N\varOmega _{i}$, coming from the complex poles
 $\pm \varOmega _{r}-\mathrm {i}\varOmega _{i}$ with
 \begin{gather} \varOmega_{r} = \varOmega_{s}\cos\varPhi_{s} = \frac{1}{2} \left[ \frac{2\varOmega_0^2(1-\epsilon^2\sigma^2)^{1/2}+2\varOmega_0^2-\epsilon^2\sigma^2} {1-\epsilon^2\sigma^2} \right]^{1/2}, \end{gather}
 \begin{gather}\varOmega_{i} = \varOmega_{s}\sin\varPhi_{s} = \frac{1}{2} \left[ \frac{2\varOmega_0^2(1-\epsilon^2\sigma^2)^{1/2}-2\varOmega_0^2+\epsilon^2\sigma^2} {1-\epsilon^2\sigma^2} \right]^{1/2}, \end{gather}
and
 \begin{equation} \varPhi_{s} = \frac{1}{2}\arccos \left[ \frac{2\varOmega_0^2-\epsilon^2\sigma^2} {2\varOmega_0^2(1-\epsilon^2\sigma^2)^{1/2}} \right], \quad \varPsi_{s} = \frac{1}{2}\arccos \left[ \frac{2(1-\varOmega_0^2)-\epsilon^2\sigma^2} {2(1-\varOmega_0^2)(1-\epsilon^2\sigma^2)^{1/2}} \right]. \end{equation}
This gives the situation described in table 2, where the frequencies
 \begin{equation} \varOmega_1 = \left[\frac{1-(1-\epsilon^2\sigma^2)^{1/2}}{2}\right]^{1/2}, \quad \varOmega_2 = \frac{(4-3\epsilon^2\sigma^2)^{1/2}}{\epsilon\sigma}\, \varOmega_1, \end{equation}
Poles and their contributions to the impulse response of an elliptic cylinder.

such that  $\varDelta = 0$ and
 $\varOmega _{r} = 1$, respectively, determine for
 $\epsilon \sigma < 1$ the range of values of
 $\varOmega _0$ inside which damped oscillations may exist.
An important result is the existence, in the supercritical case  $\varOmega _0 > 1$, of a resonance manifesting itself as undamped oscillations at the frequency
 $\omega _-$. This resonance is visible in the exact expression of the response, obtained by the method of Appendix A as
 \begin{align} \frac{\xi(t)}{\xi_0} & = 2H(\varOmega_0-1)\, \frac{(\varOmega_-^2-1)^{1/2}} {\varDelta^{1/2}} \sin(\omega_-t) \nonumber\\ & \quad+ \frac{2}{\rm \pi}\,\epsilon\sigma \int_0^{{\rm \pi}/2} \frac{\sin(Nt\cos\theta)\sin^2\theta\cos\theta} {(\varOmega_0^2-\cos^2\theta)^2+ \epsilon^2\sigma^2\sin^2\theta\cos^2\theta} \,\mathrm{d}\theta. \end{align}
The expansion of the response for large time  $Nt \gg 1$ combines, as in § 2, an intermediate term
 $\xi _1$ given in table 2, and an ultimate term
 $\xi _2$ given by
 \begin{align} \frac{\xi_2(t)}{\xi_0} & \sim \left(\frac{2}{\rm \pi}\right)^{1/2} \frac{\sin(Nt\!-\!{\rm \pi}/4)}{\epsilon\sigma(Nt)^{1/2}} -2^{1/2}\,\frac{|\varOmega_0^2-1|}{\epsilon^2\sigma^2} \left\{ f \left[ \left(\frac{Nt}{\rm \pi}\right)^{1/2} \frac{|\varOmega_0^2-1|}{\epsilon\sigma} \right] \sin\left(Nt-\frac{\rm \pi}{4}\right) \right. \nonumber\\ & \quad + \left. g \left[\left(\frac{Nt}{\rm \pi}\right)^{1/2} \frac{|\varOmega_0^2-1|}{\epsilon\sigma} \right]\cos\left(Nt-\frac{\rm \pi}{4}\right) \right\}, \end{align}
where
 \begin{gather} f(z) =\left[\frac{1}{2}-S(z)\right]\cos\left(\frac{\rm \pi}{2}\,z^2\right)- \left[\frac{1}{2}-C(z)\right]\sin\left(\frac{\rm \pi}{2}\,z^2\right), \end{gather}
 \begin{gather}g(z) =\left[\frac{1}{2}-C(z)\right]\cos\left(\frac{\rm \pi}{2}\,z^2\right)+ \left[\frac{1}{2}-S(z)\right]\sin\left(\frac{\rm \pi}{2}\,z^2\right) \end{gather}
are auxiliary functions related to the Fresnel integrals  $C(z)$ and
 $S(z)$. When
 $\varOmega _0$ is close to
 $1$, a transition takes place from a regime
 \begin{equation} \frac{\xi_2(t)}{\xi_0} \sim \left(\frac{2}{\rm \pi}\right)^{1/2} \frac{\sin(Nt-{\rm \pi}/4)}{\epsilon\sigma(Nt)^{1/2}},\end{equation}
where the oscillations decay as  $t^{-1/2}$, for
 $(\varOmega _0^2-1)^{-2} \gg Nt \gg 1$, to another regime
 \begin{equation} \frac{\xi_2(t)}{\xi_0} \sim{-}\left(\frac{2}{\rm \pi}\right)^{1/2} \frac{\epsilon\sigma}{(\varOmega_0^2-1)^2}\, \frac{\cos(Nt-{\rm \pi}/4)}{(Nt)^{3/2}},\end{equation}
where the oscillations decay as  $t^{-3/2}$, for
 $Nt \gg (\varOmega _0^2-1)^{-2} \gg 1$. When
 $\varOmega _0$ is away from
 $1$, only the latter is observed.
The oscillations and their expansions are compared in figures 13 and 14. For  $\epsilon \sigma > 1$ in figure 13, the two contributions
 $\xi _1$ and
 $\xi _2$ are superposed for all values of
 $t/T$, while for
 $\epsilon \sigma < 1$ in figure 14,
 $\xi _1$ is plotted alone for
 $t/T < 1.8$, and
 $\xi _2$ is added to it for
 $t/T > 1.8$. There is one exception in figure 14(g), for which there is no
 $\xi _1$, and
 $\xi _2$ is plotted for all
 $t/T$; this is the only case for which there is a significant difference between the expansion and the exact value after the first buoyancy period, the two starting to agree after
 $t/T = 8$, say, using the non-uniform expansion (4.21) rather than the uniform expansion (4.18).
Impulse response (solid lines) and its asymptotics (dashed lines) for a cylinder of aspect ratio  $\epsilon = 4$ and mass ratio
 $\sigma = 1/2$ attached to pendulums of intrinsic frequencies (a,b)
 $\varOmega _0 = 0.2$, (c,d)
 $\varOmega _0 = 0.5$, (e,f)
 $\varOmega _0 = 0.8$ and (g,h)
 $\varOmega _0 = 1.2$, in a fluid either (a,c,e,g) inviscid or (b,d,f,h) viscous with Stokes number
 ${St} = 200$.

Same as figure 13 for aspect ratio  $\epsilon = 1$, such that
 $\varOmega _1 = 0.259$ and
 $\varOmega _2 = 0.933$, and intrinsic frequencies (a,b)
 $\varOmega _0 = 0.2$, (c,d)
 $\varOmega _0 = 0.5$, (e,f)
 $\varOmega _0 = 0.8$, (g,h)
 $\varOmega _0 = 0.95$ and (i,j)
 $\varOmega _0 = 1.2$.

The parameters in figure 14 were chosen to be of the same order as in the experiments by Ermanyuk (Reference Ermanyuk2000). Quantitative comparison will be performed later. We note for now that two experimental observations are recovered: for  $\varOmega _1 < \varOmega _0 < \varOmega _2$ in figures 14(c,e), the existence of exponentially damped oscillations; and for
 $\varOmega _0 < \varOmega _1$ in figure 14(a), the existence of a critically damped regime at ‘very small values of the restoring force coefficient’ for which ‘the pendulum, being disturbed, reaches a certain maximum inclination and then approaches its equilibrium position monotonously’. In all circumstances except figure 14(g), the impulse response is dominated by
 $\xi _1$, and
 $\xi _2$ plays only a minor role. There is, however, one important difference: for
 $\varOmega _0 > 1$, the oscillations in figure 14(i) are undamped, while the experiments show without ambiguity that the actual oscillations are damped. Again, this points to the necessity to include viscosity in the theory.
4.2. Viscous analysis
As for the free oscillations in § 2.5, viscous dissipation adds the Basset–Boussinesq force, of transform
 \begin{equation} F_{v}(\omega) = mN^{1/2}\omega^{3/2}\, \mathrm{e}^{{\rm i}{\rm \pi}/4}\, \frac{B_x}{{St}^{1/2}}\, \xi(\omega),\end{equation}
where the coefficient  $B_x$, equal to
 $4$ for the circular cylinder, is expressed in table 4 in terms of
 $\epsilon$, and its variations are represented in figure 21. The Fourier transform (4.7) becomes
 \begin{equation} \frac{\xi(\omega)}{\xi_0} = \frac{N} {\omega_0^2-\omega^2-\epsilon\sigma\omega(\omega^2-N^2)^{1/2} -\mathrm{e}^{{\rm i}{\rm \pi}/4}\,(\sigma B_x/{St}^{1/2})N^{1/2}\omega^{3/2}}.\end{equation}
The method of Appendix A may still be applied to its analytical inversion. However, not only is this method restricted to large enough  ${St}$, as seen in § 2.5, but also the position of the resonance frequency
 $\omega _-$, which becomes complex, is known only asymptotically. It was thus preferred to write
 \begin{equation} \xi(t) = \frac{1}{2\mathrm{i}{\rm \pi}} \int_{c-\mathrm{i}\infty}^{c+\mathrm{i}\infty} \xi(\omega = \mathrm{i}p) \exp(pt) \,\mathrm{d}p, \end{equation}
where  $c$ is a real number on the right of all singularities of
 $\xi (\omega = \mathrm {i}p)$, and to evaluate this inverse Laplace transform numerically.
For large time  $Nt \gg 1$, the intermediate response
 $\xi _1$ combines the same elements as before, slightly modified by viscosity: to the sinusoidal oscillation (4.10) is added a slow exponential decay and becomes
 \begin{align} \varXi_-^{(\mathrm{o})}(t) & = 2 \exp \left[ -\omega_-t\,\frac{\sigma B_x\varOmega_-^{1/2}(\varOmega_-^2-1)^{1/2}} {2^{1/2}\varDelta^{1/2}\,{St}^{1/2}} \right] \sin \left\{ \omega_-t \left[ 1- \frac{\sigma B_x\varOmega_-^{1/2}(\varOmega_-^2-1)^{1/2}} {2^{1/2}\varDelta^{1/2}{St}^{1/2}} \right] \right\} \nonumber\\ & \quad \times\frac{(\varOmega_-^2-1)^{1/2}}{\varDelta^{1/2}}; \end{align}
to the exponential decay (4.11) is added a low-frequency oscillation and becomes
 \begin{equation} \varXi_\pm^{(\mathrm{d})}(t) ={\pm} \exp(-\omega_\pm t) \cos \left[ \omega_\pm t\, \frac{\sigma B_x\varOmega_\pm^{1/2}(\varOmega_\pm^2+1)^{1/2}} {\varDelta^{1/2}\,{St}^{1/2}} \right] \frac{(\varOmega_\pm^2+1)^{1/2}}{\varDelta^{1/2}};\end{equation}
and the damped oscillation (4.13) has its damping and its period slightly increased, to
 \begin{align} \varXi_{s}(t) & = 2 \exp \left\{ -\omega_{s}t \left[ \sin\varPhi_{s}- \frac{\sigma B_x\varOmega_0^{1/2}(1-\varOmega_0^2)^{1/2}} {(1-\epsilon^2\sigma^2)^{3/8}\,|\varDelta|^{1/2}\,{St}^{1/2}} \sin\left(\frac{3}{2}\,\varPhi_{s}-\varPsi_{s}-\frac{\rm \pi}{4}\right) \right] \right\} \nonumber\\ & \quad \times\sin\left\{ \omega_{s}t \left[ \cos\varPhi_{s}- \frac{\sigma B_x\varOmega_0^{1/2}(1-\varOmega_0^2)^{1/2}} {(1-\epsilon^2\sigma^2)^{3/8}\,|\varDelta|^{1/2}\,{St}^{1/2}} \cos\left(\frac{3}{2}\,\varPhi_{s}-\varPsi_{s}-\frac{\rm \pi}{4}\right) \right] -\varPsi_{s} \right\} \nonumber\\ & \quad\times\frac{(1-\varOmega_0^2)^{1/2}}{(1 -\epsilon^2\sigma^2)^{1/4}\,|\varDelta|^{1/2}}, \end{align}
where  $\omega _{s} = N\varOmega _{s}$. The ultimate response
 $\xi _2$ comes as before in the form of a uniform expansion
 \begin{align} \frac{\zeta_2(t)}{\zeta_0}
& \sim \left(\frac{2}{\rm \pi}\right)^{1/2}
\frac{\sin(Nt-{\rm \pi}/4)}{\epsilon\sigma(Nt)^{1/2}} +
\operatorname{Im} \left\{ \operatorname{erfc} \left[
\left(\frac{Nt}{2}\right)^{1/2} \frac{\langle
\varOmega_0^2-1-\mathrm{e}^{{\rm i}{\rm \pi}/4}\,\sigma
B_x/{St}^{1/2} \rangle} {\epsilon\sigma}\,
\mathrm{e}^{-\mathrm{i}{\rm \pi}/4} \right] \right. \nonumber\\
& \quad \times \left. \exp \left\{ -\mathrm{i}Nt \left[
1+
\frac{(\varOmega_0^2-1-\mathrm{e}^{{\rm
i}{\rm \pi}/4}\,\sigma B_x/{St}^{1/2})^2} {2\epsilon^2\sigma^2}
\right] \right\} \frac{\langle
\varOmega_0^2-1-\mathrm{e}^{{\rm i}{\rm \pi}/4}\,\sigma
B_x/{St}^{1/2} \rangle} {\epsilon^2\sigma^2} \right\},
\end{align}
where  $\langle z\rangle$ means whichever of the two numbers
 $\pm z$ satisfies
 $-{\rm \pi} /4 < \arg \langle z\rangle < 3{\rm \pi} /4$. This expansion describes the transition, as
 $Nt$ increases, from the buoyancy oscillations (4.20), decaying as
 $t^{-1/2}$, to new buoyancy oscillations
 \begin{equation} \frac{\zeta_2(t)}{\zeta_0} \sim{-} \left(\frac{2}{\rm \pi}\right)^{1/2} \frac{\epsilon\sigma}{(Nt)^{3/2}} \operatorname{Re} \left\{ \frac{\exp[-\mathrm{i}(Nt-{\rm \pi}/4)]} {\left(\varOmega_0^2-1-\mathrm{e}^{{\rm i}{\rm \pi}/4}\, \sigma B_x/{St}^{1/2}\right)^2} \right\}, \end{equation}
decaying as  $t^{-3/2}$.
The plot of the response at  ${St} = 200$ in figures 13 and 14 shows that the effect of viscosity is minor for
 $\varOmega _0 < 1$ but essential for
 $\varOmega _0 > 1$, as it adds the damping that was otherwise missing, thus making the resonance at
 $\omega _-$ finite. The range of validity of the asymptotic expansion is also larger.
With viscosity added, the theory can now be compared quantitatively to the measurements by Ermanyuk (Reference Ermanyuk2000). The fluid was a linearly stratified solution of glycerine in water with buoyancy frequency  $N = 0.88\ \mathrm {s}^{-1}$. The cylinder was submerged at mid-depth, where the fluid had density
 $\rho _0 = 1.011\ \mathrm {g}\ \mathrm {cm}^{-3}$ and kinematic viscosity
 $\nu = 0.0128\ \mathrm {cm}^2\ \mathrm {s}^{-1}$. The cylinder was circular of radius
 $a = 1.85\ \mathrm {cm}$, yielding
 ${St} = 240$, and displaced a mass
 $m_{f} = 151\ \mathrm {g}$ of fluid. The pendulum had arm length
 $L = 60\ \mathrm {cm}$ and, including the cylinder, moment of inertia
 $J_0 = 112\ \mathrm {g}\ \mathrm {m}^2$. The counterweight, of mass
 $m = 188\ \mathrm {g}$, was placed at a distance
 $\ell$ from the axis, setting the total moment to
 $J = J_0+m\ell ^2$, hence the total inertia to
 $M = J/L^2$, and determining the restoring coefficient
 $K$, hence the intrinsic frequency
 $\omega _0 = (K/M)^{1/2}$.
Figures 2 and 3 of Ermanyuk (Reference Ermanyuk2000) present the impulse response for two such frequencies, one subcritical such that  $\varOmega _0 < 1$, and the other supercritical such that
 $\varOmega _0 > 1$, respectively. The associated parameters are given in table 3. The measurements are compared with the theory in figure 15. Viscous theory is seen to predict the oscillations accurately for the first period, then the agreement deteriorates gradually over the course of the next periods. When this happens, the damping is overestimated in the subcritical case, where it is caused mostly by wave radiation, and underestimated in the supercritical case, where it is caused entirely by viscous dissipation.
Experimental parameters for Ermanyuk (Reference Ermanyuk2000).

Data (black lines) for the impulse response in (a) figure 2 and (b) figure 3 of Ermanyuk (Reference Ermanyuk2000), together with inviscid (blue lines) and viscous (brown lines) theories.

When fitting the measurements to an exponentially damped sinusoid, Ermanyuk (Reference Ermanyuk2000) reported in the supercritical case an underestimation of the amplitude during the first period of oscillation. This might correspond to the difference in figure 14(j) between the exact value of the response and its asymptotic expansion (4.25).
The inviscid prediction (4.7) of the frequency response and its viscous prediction (4.23) are compared in figure 16 to the measurements in figure 6 of Ermanyuk (Reference Ermanyuk2000). The frequencies at which the response reaches its peak are  $\varOmega _\ast = 0.81$ and
 $1.14$ in the subcritical and supercritical cases, respectively, according to inviscid theory, becoming
 $\varOmega _\ast = 0.74$ and
 $1.11$, respectively, when viscosity is added. These last two predictions are identical to the reported positions of the peaks.
Data (circles) for the frequency response in figure 6 of Ermanyuk (Reference Ermanyuk2000), together with inviscid (blue lines) and viscous (brown lines) theories. The response is normalized by its maximum value, reached at frequency  $\omega _\ast$, except for (b) where the maximum for the viscous case is used to normalize the inviscid case.

5. Conclusion
The motion of a body under steady or unsteady forcing in a stratified fluid may be deduced from the frequency variations of its added mass. Three such forcings have been considered: in § 2, the displacement of a float away from its neutral level, followed by its release; in § 3, the imposition of sinusoidal oscillations of the hydrostatic pressure to a Cartesian diver, followed by the stop of the oscillations; in § 4, the application of an impulse to a pendulum to which the body is attached. In all three cases the free motion of the body back to equilibrium has been calculated both exactly and asymptotically for large time. Ultimately, for very large time, the motion is composed of oscillations at the buoyancy frequency  $N$, with an amplitude decaying algebraically with time
 $t$. Before that, for moderately large time, an intermediate motion is observed, dictated by the internal dynamics of the system.
When the system has no such dynamics, such as the float in § 2, the intermediate motion consists of an aperiodic return to equilibrium. It is present only for bodies that are horizontally flat (namely, with vertical to horizontal aspect ratio  $\epsilon < 1$) and is described by an exponential function for an elliptic cylinder and a composite of Dawson's integral for a spheroid.
When the set-up has an internal dynamics, materialized by an intrinsic frequency  $\omega _0$, like the Cartesian diver in § 3 and the pendulum in § 4, the intermediate motion represents the resonant response of the system. Depending on the experimental conditions, it may consist of a sinusoidal oscillation with no damping, or an exponential decay with no oscillation, or an exponentially damped oscillation. The existence of exponentially damped oscillations has been noticed in the experiments of Ermanyuk (Reference Ermanyuk2000) for the pendulum and Le Gal et al. (Reference Le Gal, Castillo Morales, Hernandez-Zapata and Ruiz Chavarria2022) for the diver. Exponentially damped oscillations have also been predicted theoretically by Akulenko et al. (Reference Akulenko, Mikhailov, Nesterov and Chaikovskii1988) and observed experimentally by Pyl'nev & Razumeenko (Reference Pyl'nev and Razumeenko1991) for a thin float oscillating back to equilibrium at the interface of a two-layer fluid.
Quantitative comparison with experiment requires the inclusion of viscous dissipation. Its effects are governed by the Stokes number  ${St} = Na^2/\nu$, where
 $a$ is the radius of the body, and
 $\nu$ is the kinematic viscosity. Consistent with Ermanyuk (Reference Ermanyuk2000, Reference Ermanyuk2002), Ermanyuk & Gavrilov (Reference Ermanyuk and Gavrilov2002a,Reference Ermanyuk and Gavrilovb, Reference Ermanyuk and Gavrilov2003) and Brouzet et al. (Reference Brouzet, Ermanyuk, Moulin, Pillet and Dauxois2017), at
 ${St}$ of order
 $100$ or above, as for the float in § 2 and the pendulum in § 4, the damping coefficient varies as the square root of the frequency
 $\omega ^{1/2}$, and is associated with the Basset–Boussinesq memory force, with no influence of the stratification. In that event, a transition is observed, for the ultimate buoyancy oscillations, from an inviscid regime for
 $1 \ll Nt \ll {St}$ to a faster decaying viscous regime for
 $1 \ll {St} \ll Nt$. For the buoyant sphere in § 2.5, this means an oscillation amplitude decaying first as
 $t^{-1/2}$ and then as
 $t^{-3/2}$, this latter variation observed by Biró et al. (Reference Biró, Szabó, Gyüre, Jánosi and Tél2008) during measurements over hundreds of buoyancy periods. At smaller
 ${St}$, as for the diver in § 3, the damping coefficient is associated with Stokes resistance and is independent of
 $\omega$, with significant influence of the stratification.
Mathematically, added mass gives access to the temporal Fourier transform of the position of the body. In the inviscid case, an adaptation of the method of Larsen (Reference Larsen1969) allows the inversion of this transform, yielding an integral over the frequency range  $0 < \omega < N$ of propagating internal waves. However, except for the simplest cases in § 2.1, this expression becomes rapidly undecipherable and carries no physical content. An asymptotic expansion for large time
 $Nt \gg 1$ exhibits this content; it is obtained by adding the contributions of the complex singularities of the transform.
When viscosity is included, the Larsen (Reference Larsen1969) method is valid only for large enough values of  ${St}$, and the large-time expansion does not perform as well as in the inviscid case. Numerical inversion of the Fourier transform, which, owing to the causal nature of the problem, may be reformulated as a Laplace transform, offers a way outside these limitations. The existing algorithms for numerical Laplace inversion may be applied; among these, the algorithm by den Iseger (Reference den Iseger2006) appears particularly promising.
The complexity of the mathematical analysis may be viewed as a consequence of the way in which the problem has been attacked, by bringing together two disconnected approaches, for added mass in an inviscid stratified fluid, and for dissipation in a viscous homogeneous fluid, respectively. Simplifications may be expected only with a consistent model built on the linearized equations of motion of a viscous stratified fluid. At high Stokes number, approaches of stratified oscillatory boundary layers have been proposed by Hurley & Hood (Reference Hurley and Hood2001), Davis & Llewellyn Smith (Reference Davis and Llewellyn Smith2010), Le Dizès & Le Bars (Reference Le Dizès and Le Bars2017) and Renaud & Venaille (Reference Renaud and Venaille2019). At small Reynolds and Péclet numbers, a model of stratified diffusive creeping flow has been proposed by Candelier, Mehaddi & Vauquelin (Reference Candelier, Mehaddi and Vauquelin2014); for more context, see the reviews by Ardekani et al. (Reference Ardekani, Doostmohammadi and Desai2017), Magnaudet & Mercier (Reference Magnaudet and Mercier2020) and More & Ardekani (Reference More and Ardekani2023).
The above results were all obtained on the assumption that the amplitude of the motion is small compared with the size of the body. Comparison with experiment for the buoyant sphere in § 2 suggests that this requirement is not very stringent. Another limitation, discussed in Part 1, is the restriction to the translational motion of the body. Rotation becomes important as soon as the body differs from a circular cylinder or a sphere. The free rotational oscillations of an elliptic cylinder have been investigated by Hurlen (Reference Hurlen2006) and Hurlen & Llewellyn Smith (Reference Hurlen and Llewellyn Smith2024), theoretically, experimentally and numerically.
Of the three systems considered in §§ 2–4, the most important is the first, related to the dynamics of Lagrangian floats in the ocean. Another application is penetrative convection, namely the motion of a buoyant fluid parcel up or down towards its equilibrium level, overshooting this level a little, then oscillating about it while also collapsing vertically. This mechanism is known to play a significant role in the atmosphere, where it is linked to the dynamics of cumulus clouds, the formation of clear-air turbulence and the generation of acoustic–gravity waves (Pierce & Coroniti Reference Pierce and Coroniti1966; Jones Reference Jones1982; Kumar Reference Kumar2007; Sharman & Trier Reference Sharman and Trier2019). Penetrative convection may be viewed as a combination of the oscillations of the buoyant float from § 2 with the collapse of a mixed region of fluid, studied experimentally by Wu (Reference Wu1969), Zatsepin et al. (Reference Zatsepin, Fedorov, Vorapayev and Pavlov1978), Sutherland, Flynn & Dohan (Reference Sutherland, Flynn and Dohan2004), Sutherland, Chow & Pittman (Reference Sutherland, Chow and Pittman2007), Holdsworth, Décamp & Sutherland (Reference Holdsworth, Décamp and Sutherland2010) and Holdsworth, Barrett & Sutherland (Reference Holdsworth, Barrett and Sutherland2012), among others, and modelled theoretically by Hartman & Lewis (Reference Hartman and Lewis1972), Meng & Rottman (Reference Meng and Rottman1988) and Gorodtsov (Reference Gorodtsov1991, Reference Gorodtsov1992) in the initial linear stage, Kao (Reference Kao1976) in the principal nonlinear stage, and Barenblatt (Reference Barenblatt1978) in the final viscous stage.
Penetrative convection has been studied experimentally by Morton, Taylor & Turner (Reference Morton, Taylor and Turner1956), McLaren et al. (Reference McLaren, Pierce, Fohl and Murphy1973) and Cerasoli (Reference Cerasoli1978), and numerically by Orlanski & Ross (Reference Orlanski and Ross1973), Cerasoli (Reference Cerasoli1978) and Lane (Reference Lane2008). For a hemispherical parcel, McLaren et al. (Reference McLaren, Pierce, Fohl and Murphy1973) found that the equilibrium level is reached in approximately  $0.85$ buoyancy periods, after which the collapsing parcel undergoes about two oscillations before stabilizing. For a semi-cylindrical parcel, Cerasoli (Reference Cerasoli1978) observed about
 $0.7$ buoyancy periods before the equilibrium level is reached, while the parcel starts to collapse earlier, after about
 $0.5$ buoyancy periods. These observations are to some extent consistent with the oscillation patterns obtained in § 2 for flat floats of aspect ratios
 $\epsilon < 1$, similar to a collapsing parcel, though of course any connection between two such different systems – a rigid body and a fluid parcel – is tentative at best.
Acknowledgements
P. Le Gal and S. Llewellyn Smith are thanked for conversations that revived the author's interest in the topic. S. Llewellyn Smith is also thanked for introducing the author to numerical Laplace inversion, and for suggesting the decomposition (2.9). Part of these conversations took place at Mathematisches Forschungsinstitut Oberwolfach, whose hospitality is acknowledged, during the workshop ‘Multiscale wave–turbulence dynamics in the atmosphere and ocean’ in September 2022. Y. Chashechkin, E. Ermanyuk, E. Hurlen, P. Le Gal, S. Llewellyn Smith and A. Vasil'ev are thanked for generously sharing their data, sometimes over a decade old, and helping with the subsequent processing.
Funding
This research received no specific grant from any funding agency, commercial or not-for-profit sectors.
Declaration of interests
The author reports no conflict of interest.
Appendix A. Fourier transform inversion
We present the technique used for inverting the Fourier transforms in §§ 2–4 analytically. When the function  $f(t)$ is real and causal, and its transform
 $f(\omega )$ is integrable, we may simply write, as in Part 1,
 \begin{equation} f(t) = \frac{2}{\rm \pi}\,H(t) \int_0^\infty \operatorname{Re}[f(\omega)]\cos(\omega t) \,\mathrm{d}\omega = \frac{2}{\rm \pi}\,H(t) \int_0^\infty \operatorname{Im}[f(\omega)]\sin(\omega t) \,\mathrm{d}\omega. \end{equation}
However, not all functions  $f(t)$ in the present Part 2 satisfy these requirements. We proceed differently, adapting the approach of Larsen (Reference Larsen1969) for Laplace transforms. In the following,
 $\varOmega = \omega /N$ stands for the reduced frequency.
A.1. Free oscillations
The simplest situation is that in §§ 2.2–2.3, where  $f(\omega )$ involves the square root
 $(\varOmega ^2-1)^{1/2}$, giving two branch points
 $\varOmega = \pm 1$, but has no other real singularity. We merge the two cuts stretching vertically downwards below these points into a single cut along the segment
 $[-1,1]$, and take the integration contour in (2.8b) along the upper edge of this segment. We introduce the inverse Joukowski transformation
 \begin{equation} s = \varOmega+(\varOmega^2-1)^{1/2},\end{equation}
which removes the multivaluedness of  $(\varOmega ^2-1)^{1/2}$ and maps the
 $\varOmega$-plane, cut along
 $[-1,1]$, onto the outside of the unit circle in the
 $s$-plane (Milne-Thomson Reference Milne-Thomson1968, § 6.30; Lavrentiev & Chabat Reference Lavrentiev and Chabat1972, § 7). Conversely, we have
 \begin{equation} \varOmega = \frac{1}{2}\left(s+\frac{1}{s}\right), \quad (\varOmega^2-1)^{1/2} = \frac{1}{2}\left(s-\frac{1}{s}\right). \end{equation}
The integration contour becomes a combination  $\varGamma$ of two half-lines along the portion
 $|s| > 1$ of the real axis, plus the upper half of the unit circle, as shown in figure 17(a). The inverse transform becomes
 \begin{equation} f(t) = \frac{N}{4{\rm \pi}} \int_\varGamma \left(1-\frac{1}{s^2}\right) f(\omega) \exp(-\mathrm{i}\omega t)\,\mathrm{d}s. \end{equation}
For (2.13) and (2.24), the integrand has singularities at
 \begin{equation} s = 0, \quad s ={\pm}\left(\frac{\epsilon-1}{\epsilon+1}\right)^{1/2}, \end{equation}
all situated inside the unit circle.
(a) Original and (b) deformed integration contours for free oscillations.

For  $t < 0$, we close the contour by a semicircle at infinity in the upper half-plane and recover, by Jordan's lemma, the causal property
 $f(t) = 0$. For
 $t > 0$, we deform the contour as shown in figure 17(b). On the unit circle, we set
 $s = \exp (\mathrm {i}\theta )$, with
 $0 < \theta < 2{\rm \pi}$, so that
 $\varOmega = \cos \theta$ and
 $(\varOmega ^2-1)^{1/2} = \mathrm {i}\sin \theta$. In the second, third and fourth quadrants, we change
 $\theta$ into
 ${\rm \pi} -\theta$,
 ${\rm \pi} +\theta$ and
 $2{\rm \pi} -\theta$, respectively, so as to obtain a sum of four integrals over
 $0 < \theta < {\rm \pi}/2$. This adds to the integrand its forms with
 $\cos \theta$ and
 $\sin \theta$ changed into their opposites, separately and together. The two integrals on either sides of the negative imaginary axis cancel out, and we obtain (2.14) and (2.25).
Viscous damping in § 2.5 adds new singularities in (2.35) and (2.37), and a branch cut along the negative imaginary axis in the  $s$-plane. On the right-hand side we set
 $s = \mathrm {e}^{-\mathrm {i}{\rm \pi} /2}\exp (\alpha )$, with
 $0 < \alpha < \infty$, so that
 $\varOmega = \mathrm {e}^{-\mathrm {i}{\rm \pi} /2}\sinh \alpha$ and
 $(\varOmega ^2-1)^{1/2} = \mathrm {e}^{-\mathrm {i}{\rm \pi} /2}\cosh \alpha$, and on the left-hand side
 $s = \mathrm {e}^{3\mathrm {i}{\rm \pi} /2}\exp (\alpha )$, so that
 $\varOmega = \mathrm {e}^{3\mathrm {i}{\rm \pi} /2}\sinh \alpha$ and
 $(\varOmega ^2-1)^{1/2} = \mathrm {e}^{3\mathrm {i}{\rm \pi} /2}\cosh \alpha$, yielding (2.36) and (2.38). However, the deformation of contour requires the singularities to remain within the unit circle. Figure 18 shows this is only true above some value of
 ${St}$, which increases as
 $\epsilon$ increases.
Variations of  $(N/2)(1-1/s^2)\zeta _+(\omega )/\zeta _0$ in the complex
 $s$-plane for spheroids of aspect ratios (a,b,c)
 $\epsilon = 0.2$, (d,e,f)
 $\epsilon = 1$ and (g,h,i)
 $\epsilon = 5$ at Stokes numbers (a,d,g)
 ${St} = \infty$, (b,e,h)
 ${St} = 1000$ and (c,f,i)
 ${St} = 100$. The surface height is set by the modulus of the function, and the colour by its argument. The solid line represents the image of the unit circle.

A.2. Cartesian diver
The forcing frequency  $\varOmega _{f}$ in § 3 is associated with two values of
 $s$, namely
 \begin{equation} s_{f} = \varOmega_{f}+(\varOmega_{f}^2-1)^{1/2}, \quad 1/s_{f} = \varOmega_{f}-(\varOmega_{f}^2-1)^{1/2}. \end{equation}
The singularity of the factor  $\mathrm {i}/(\omega -\omega _{f})$ at
 $s = s_{f}$ in (3.11) is removed by its product with the term in curly braces, which is zero. The singularity at
 $s = 1/s_{f}$, however, remains present since changing
 $s$ into
 $1/s$ changes
 $\varUpsilon$ into
 $-\varUpsilon$, and
 $D(\varUpsilon )$ into its complex conjugate, so that the term in curly braces is not zero. For
 $\varOmega _{f} > 1$, this new singularity is inside the unit circle and is of no consequence. For
 $\varOmega _{f} < 1$, it is situated on the circle and must be avoided by a small indentation, shown in figure 19, yielding a residue contribution, while the integral along the circle becomes a principal value.
(a) Original and (b) deformed contours for the Cartesian diver when  $\varOmega _{f} < 1$.

A.3. Impulse response
For  $\varOmega _0 > 1$ in § 4.1, two poles of the transform (4.7), namely
 $s = \pm s_-$ with
 \begin{equation} s_-= \left(\frac{2\varOmega_0^2-1+\varDelta^{1/2}}{1+\epsilon\sigma}\right)^{1/2}, \end{equation}
are real and outside the unit circle. They correspond to the resonant frequencies  $\varOmega = \pm \varOmega _-$, with
 $\varOmega _-$ given in (4.9). The integration contour is modified to include them, as shown in figure 20, adding the contribution (4.10) into (4.17).
(a) Original and (b) deformed contours for the impulse response when  $\varOmega _0 > 1$.

Appendix B. Asymptotic expansions
The large-time expansions of the inverse Fourier transforms in §§ 2–4 are derived by the same approach as for the memory integral in Part 1, adding the contributions of the singularities of each transform, retaining the singularities at which either (i) the modulus of the transform diverges or (ii) a branch cut starts across which the modulus is discontinuous. The contributions are evaluated by the residue theorem for poles, and in terms of the integrals from Appendix C of Part 1 otherwise. The real branch points  $\varOmega = \pm 1$, with
 $\varOmega = \omega /N$ the reduced frequency, yield the so-called ‘ultimate’ term
 $\zeta _2$ or
 $\xi _2$ of the expansion, while the other singularities yield the ‘intermediate’ term
 $\zeta _1$ or
 $\xi _1$. Except for the resonant case in § 4.1, these other singularities are all complex and must satisfy the conditions
 $|{\operatorname {Re}\varOmega }| < 1$ and
 $\operatorname {Im}\varOmega < 0$, namely be situated in the lower half-plane between the cuts stretching vertically downwards below
 $\varOmega = \pm 1$, in order to belong to the proper Riemann sheet.
B.1. Free oscillations
For the elliptic cylinder in § 2, in the inviscid case, the singularities are for  $\epsilon < 1$ the negative imaginary pole
 $-\mathrm {i}\varOmega _{s}$, and for all
 $\epsilon$ the real branch points
 $\varOmega = \pm 1$. Adding viscosity, the pole
 $-\mathrm {i}\varOmega _{s}$ separates into two,
 \begin{equation} -\mathrm{i}\varOmega_{s} \pm\frac{B_z}{{St}^{1/2}}\,\frac{\epsilon^{5/2}}{(1-\epsilon^2)^{5/4}},\end{equation}
situated a small distance away from it on either side of the cut along the negative imaginary axis. This distance is too small to allow the poles to be separated from the cut. Accordingly, only a half-circular path can be drawn around each, yielding a half-residue. The branch point  $\varOmega = 1$ arises via the combination
 \begin{equation} (\varOmega-1)^{1/2}+ \mathrm{e}^{{\rm i}{\rm \pi}/4}\, \frac{\epsilon B_z}{(2\,{St})^{1/2}}, \end{equation}
where the first term is  $O[1/(Nt)^{1/2}]$, and the second term is
 $O(1/{St}^{1/2})$. The situation is similar near
 $\varOmega = -1$. Both terms are small and must be kept, yielding the uniform expansion (2.41).
For the spheroid, in the inviscid case, the singularity  $-\mathrm {i}\varOmega _{s}$ is a branch point from which a cut stretches vertically upwards to
 $\varOmega = 0$. In the presence of viscosity, this point morphs into two poles
 \begin{equation} -\mathrm{i}\varOmega_{s} +(\mathrm{e}^{-\mathrm{i}{\rm \pi}/6},\mathrm{e}^{{-}5\mathrm{i}{\rm \pi}/6})\, \frac{{\rm \pi}^{2/3}}{2}\,\frac{B_z^{2/3}}{{St}^{1/3}}\, \frac{\epsilon^2}{(1-\epsilon^2)^{4/3}}.\end{equation}
This change of nature makes the expansion singular as  ${St} \to \infty$.
The poor performance of the expansions in the viscous case in figure 7 is caused by the assumed smallness of the separation of the singularities in (B1) and (B3) when  ${St} \gg 1$. Except when
 $\epsilon$ is very small, this separation is not actually small. As
 $\epsilon$ increases, the new poles move laterally towards the cuts below the branch points
 $\varOmega = \pm 1$; they get close to these cuts as
 $\epsilon$ reaches
 $1$, then persist for
 $\epsilon > 1$ and migrate up towards the branch points in such a way that at
 $\epsilon = 5$, they are in close proximity to them. In between, depending on the body and the value of
 ${St}$, the poles may have crossed the cuts at some
 $\epsilon < 1$, moved to another Riemann sheet, then come back to the current sheet at some
 $\epsilon > 1$.
B.2. Cartesian diver
For the Cartesian diver in § 3, the complexity of the transcendental function (3.11), comprising two parameters  $\epsilon$ and
 $\varOmega _0$ in addition to the forcing frequency
 $\varOmega _{f}$, makes it difficult to enunciate general results regarding its singularities. In the parameter range of the diver, namely
 $\epsilon > 1$ and
 $\varOmega _0$ midway between
 $0$ and
 $1$, the situation is similar to that for the memory integral for horizontal motion in Part 1, with poles at the complex frequencies
 $\pm \varOmega _{r}-\mathrm {i}\varOmega _{i}$, where
 $\varOmega _{r}$ and
 $\varOmega _{i}$ are defined in (3.15).
B.3. Impulse response
For the impulse response in § 4, in the inviscid case, the poles are those listed in table 2. The branch point  $\varOmega = 1$ appears through the combination
 \begin{equation} (\varOmega-1)^{1/2}-\frac{\varOmega_0^2-1}{2^{1/2}\epsilon\sigma}, \end{equation}
and similarly for  $\varOmega = -1$. Both terms must be kept when
 $\varOmega _0$ is close to
 $1$, say within
 $20$ % of it, giving (4.18). The modifications implied by viscosity are straightforward.
Appendix C. Hydrodynamic force in a viscous homogeneous fluid
We gather here results on the hydrodynamic force exerted on a body of size  $\ell$ oscillating with velocity
 $\boldsymbol {U}\exp (-\mathrm {i}\omega t)$ in a fluid of density
 $\rho$ and kinematic viscosity
 $\nu$. The formulation is based on Lawrence & Weinbaum (Reference Lawrence and Weinbaum1988), Pozrikidis (Reference Pozrikidis1989), Loewenberg (Reference Loewenberg1993a) and Zhang & Stone (Reference Zhang and Stone1998). Different behaviours are observed depending on the Stokes number
 $\omega \ell ^2/\nu$.
At high  $\omega \ell ^2/\nu$, to leading order, the flow is inviscid. The force is inertial and, in component notation, of the form
 \begin{equation} F_i = \mathrm{i}\omega\mu_{ij}U_j,\end{equation}
with  $\mu _{ij}$ the added mass tensor. The coefficients
 $C_{ij}$, defined by
 \begin{equation} \frac{\mu_{ij}}{m_{f}} = C_{ij}, \end{equation}
with  $m_{f} = \rho \mathcal {V}$ the mass of the displaced fluid, and
 $\mathcal {V}$ the volume of the body, depend only on the geometry of the body. To the next order, viscous dissipation takes place in the boundary layer. A drag force is exerted, of the form
 \begin{equation} F_i ={-}\lambda_{ij}U_j\,\mathrm{e}^{-\mathrm{i}{\rm \pi}/4},\end{equation}
where the tensor  $\lambda _{ij}$ is related to the rate of dissipation by
 \begin{equation} \lambda_{ij}U_iU_j = \rho(\nu\omega)^{1/2}\int_S(\boldsymbol{u}-\boldsymbol{U})^2\,\mathrm{d}^2S, \end{equation}
with  $S$ the surface of the body, and
 $\boldsymbol {u}$ the velocity of the irrotational flow outside the boundary layer; see Batchelor (Reference Batchelor1967, § 5.13) or Landau & Lifshitz (Reference Landau and Lifshitz1987, § 24). For arbitrary time dependence, this force is responsible for the Basset–Boussinesq memory integral. Associated coefficients
 $B_{ij}$ are introduced, such that
 \begin{equation} \frac{\lambda_{ij}}{m_{f}} = \frac{(\nu\omega)^{1/2}}{\ell}\,B_{ij}. \end{equation}
They depend only on the geometry of the body.
At low  $\omega \ell ^2/\nu$, to leading order, the flow behaves as a steady Stokes flow exerting the resistance
 \begin{equation} F_i ={-}\lambda_{ij}U_j,\end{equation}
with  $\lambda _{ij}$ a tensor independent of
 $\omega$; see Landau & Lifshitz (Reference Landau and Lifshitz1987, § 24). Coefficients
 $R_{ij}$ are introduced, writing
 \begin{equation} \frac{\lambda_{ij}}{m_{f}} = \frac{\nu}{\ell^2}\,R_{ij}. \end{equation}
As above, they depend only on the geometry of the body.
A specific property of the sphere (Stokes Reference Stokes1851; Boussinesq Reference Boussinesq1885; Basset Reference Basset1888; Landau & Lifshitz Reference Landau and Lifshitz1987, § 24) is that the force exerted on it at any  $\omega \ell ^2/\nu$ results from the mere superposition of the three terms (C1), (C3) and (C6). For a spheroid, Lawrence & Weinbaum (Reference Lawrence and Weinbaum1986, Reference Lawrence and Weinbaum1988), Pozrikidis (Reference Pozrikidis1989) and Zhang & Stone (Reference Zhang and Stone1998) showed that the mismatch between the expansions at high and low
 $\omega \ell ^2/\nu$ yields an additional memory term, for which Lawrence & Weinbaum (Reference Lawrence and Weinbaum1988) gave an approximate expression valid for aspect ratios
 $\epsilon$ between
 $0.1$ and
 $10$, noting that ‘for aspect ratios of order unity, [this additional term] should always be a small contribution to the force’. The case of a slender body was considered by Kabarowski & Khair (Reference Kabarowski and Khair2020).
The tensors  $C_{ij}$,
 $B_{ij}$ and
 $R_{ij}$ are given in table 4 for an elliptic cylinder and a spheroid, and their particular cases the circular cylinder and the sphere. The cylinder has its axis in the
 $y$ direction, while its cross-section has semi-axes
 $a$ and
 $b$ in the
 $x$ and
 $z$ directions, respectively. The spheroid has semi-axes
 $a$ in the transverse
 $x$ direction, and
 $b$ in the axial
 $z$ direction. The tensors are diagonal for both bodies and depend on the aspect ratio
 $\epsilon = b/a$. Their components are denoted with single indices
 $x$ and
 $z$, and the scale
 $\ell$ in their definition is taken as
 $a$. The variations of
 $B_x$ and
 $B_z$ with
 $\epsilon$ are plotted in figure 21.
Added mass, Basset–Boussinesq and Stokes resistance tensors for particular oscillating bodies.

Variations of the Basset–Boussinesq tensors of (a) an elliptic cylinder and (b) a spheroid, with aspect ratio  $\epsilon$.

The added mass tensor  $C_{ij}$ was obtained by applying the limit
 $\omega /N \to \infty$ to the results of Part 1. The outcome is consistent with Brennen (Reference Brennen1982) and Korotkin (Reference Korotkin2009, §§ 2.2.1 and 3.2). It involves for the spheroid
 \begin{align} D(\epsilon) & = \frac{1}{1-\epsilon^2} \left[ 1-\epsilon\,\frac{\arccos\epsilon}{(1-\epsilon^2)^{1/2}} \right] \quad {(\epsilon < 1)} \end{align}
 \begin{align} & = \frac{1}{1-\epsilon^2} \left[ 1-\epsilon\,\frac{\operatorname{arccosh}\epsilon}{(\epsilon^2-1)^{1/2}} \right]\quad {(\epsilon > 1)}, \end{align}
becoming  $D(1) = 1/3$ for the sphere.
For the Basset–Boussinesq tensor  $B_{ij}$, the irrotational flow was obtained as the limit
 $\omega /N \to \infty$ of the results of Voisin (Reference Voisin2021), then the dissipation rate was calculated using (C4). The outcome is consistent with Lawrence & Weinbaum (Reference Lawrence and Weinbaum1988), Pozrikidis (Reference Pozrikidis1989) and Loewenberg (Reference Loewenberg1993a) for the spheroid, Nuriev, Egorov & Kamalutdinov (Reference Nuriev, Egorov and Kamalutdinov2021) for the elliptic cylinder – it involves the complete elliptic integrals
 $K(k)$ and
 $E(k)$ of modulus
 $k$ – and Batchelor (Reference Batchelor1967, § 5.13) and Landau & Lifshitz (Reference Landau and Lifshitz1987, § 24) for the sphere and the circular cylinder.
The Stokes resistance tensor  $R_{ij}$ was obtained by applying the procedure of Lamb (Reference Lamb1932, § 339) and Happel & Brenner (Reference Happel and Brenner1983, § 5.11). The outcome is consistent with Weinheimer (Reference Weinheimer1987), Lawrence & Weinbaum (Reference Lawrence and Weinbaum1988) and Loewenberg (Reference Loewenberg1993a) for the spheroid, and Batchelor (Reference Batchelor1967, § 4.9) and Landau & Lifshitz (Reference Landau and Lifshitz1987, § 20) for the sphere. For the cylinder, the calculation would require a switch to Oseen's approximation of the equations of motion, and the introduction of a logarithmic dependence on the velocity (Lamb Reference Lamb1932, §§ 343 and 343a). It is not required for the present investigation and has been omitted.



