THE 1937/38 recession is prominent in economists' accounts of the interwar period and in current macro policy debates. After growing rapidly between 1933 and 1937, the U.S. economy plunged back into recession. From 1937 to 1938, real gross domestic product (GDP) fell 3.2 percent and the nonfarm unemployment rate rose 6.6 percentage points.Footnote 1 Because the recession was brief, annual numbers disguise the downturn's severity. Industrial production fell 32 percent between May 1937 and May 1938. This contrasts with a peak to trough industrial production decline in the 2007/09 U.S. recession of 17 percent.Footnote 2
Economists often take the 1937/38 recession as a lesson in the perils of reversing expansionary monetary and fiscal policy too soon. In June 2009, Christina Romer wrote a column for The Economist on “The Lessons of 1937.”Footnote 3 In January 2010, Paul Krugman wrote a New York Times column entitled “That 1937 Feeling.”Footnote 4 Both Romer and Krugman cautioned that a decline in government spending or shrinking of the Federal Reserve's balance sheet could push the economy back into recession. Their arguments reflect a near-consensus in the academic literature that the 1937/38 recession was caused by contractionary monetary policy, fiscal policy, or both (Eggertsson and Pugsley Reference Eggertsson2006; Eichengreen Reference Eichengreen1992; Friedman and Schwartz Reference Friedman and Schwartz1963; Romer Reference Romer1992; Velde Reference Velde2009; Irwin Reference Irwin2012).Footnote 5 Both the monetary and fiscal shock had multiple sources. The Federal Reserve raised reserve requirements in August 1936 and again in March and May 1937. At the same time, the Treasury began to sterilize gold inflows rather than passively allow the money supply to expand as gold flowed to the United States from Europe (Friedman and Schwartz Reference Friedman and Schwartz1963; Irwin Reference Irwin2012). Contemporaneously, a decline in outlays and an increase in revenues caused the federal budget deficit as a percent of GDP to fall 5.3 percentage points (Office of Management and Budget 2016, table 1.2). Outlays decreased after the payment of the veterans' bonus (Hausman Reference Hausman2014). Much of the revenue increase came from social security taxes, which were first collected in January 1937.
Relative to its importance for the interwar U.S. economy and contemporary policy debates, there is little research asking whether existing explanations of the recession are consistent with the timing, geographic, and sectoral patterns of output and employment in 1937/38. The first half of this article shows that there are in fact timing, geographic, and sectoral anomalies in the recession. Specifically: (1) The decline in industrial production from September to December 1937 is the largest three-month decline in the history of the Federal Reserve and Miron-Romer series going back to 1884. (2) Manufacturing employment rises in 8 states despite a 12 percent decline nationwide. (3) There is a lack of comovement between components of GDP. Durables consumption falls more than 17 percent while nondurables consumption rises. The 1937/38 recession is the only time since 1929 in which nondurables spending rises in a recession in which annual real GDP falls more than 2 percent. These facts are anomalous both in the sense of being unusual relative to other severe recessions and in the sense of not being easily explained by monetary or fiscal policy.
What could explain these facts? The analysis points strongly to a role for the auto industry in explaining the anomalous behavior of the economy: manufacturing employment falls most in Michigan, and auto sales and production fall more than 40 percent. Furthermore, auto prices rise at the same time as the overall price level falls. In the second half of the article, I ask what explains the peculiar behavior of the auto industry, and how exogenous developments in this industry affected the rest of the economy. I argue that a cost shock in the auto industry and consequent auto price increases explain the industry's extraordinary behavior. The unionization of General Motors and Chrysler and an increase in raw material costs led auto manufacturers to raise prices in fall 1937. Equally important, the increase in costs combined with nominal rigidity to make the price increase predictable. Expectations of price increases brought auto sales forward and thus sustained sales during the summer and early fall of 1937, despite negative monetary and fiscal factors. When auto prices did increase in fall 1937, sales plummeted. Narrative evidence confirms this explanation.
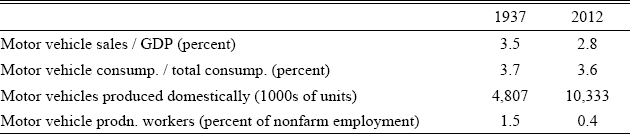
The auto industry was a significant part of the U.S. economy, so this large shock to auto sales almost certainly had large effects on the economy as a whole. Table 1 compares the macroeconomic importance of the U.S. auto industry in 1937 to its importance in 2012.Footnote 6 Along most dimensions, the industry was more important in 1937 than it is today. Sales were a larger share of GDP, and auto industry employment was a much larger share of total employment. Furthermore, in 1937, most inputs to car production were supplied domestically, so accounting for linkages to other sectors would increase the discrepancy between the industry's importance then and its importance now.
THE AUTO INDUSTRY IN 1937 AND 2012

Sources:
Rows 1 and 2: NIPA Tables 2.3.5 and 1.1.5; row 3: 1937-NBER macrohistory series m01107a and m01144a, 2012-Bureau of Transportation, National Transportation Statistics, Table 1–23; row 4: 1937-Federal Trade Commission (1939), p. 27 and NBER macrohistory series a08172, 2012-Bureau of Labor Statistics, establishment survey.
To quantify the impact on auto sales and aggregate output of the fall 1937 price shock, I perform a forecasting exercise. I construct a statistical model that fits the monthly pre-recession behavior of auto sales given fiscal and monetary factors and overall economic conditions. As expected, the model underpredicts sales in the summer of 1937, when consumers expected auto prices soon to increase, and overpredicts sales in 1938. I interpret the difference between predicted and actual sales as the effect of the auto sector supply shock. This implies that without the auto shock, the fall in auto sales between 1937 and 1938 would have been 0.8 million rather than the actual 1.6 million. Using data on the price of cars sold and an estimate of the multiplier, I find that positive price expectations added 0.1 to 0.2 percent to GDP in 1937, while the subsequent drop-off in sales subtracted 0.4 to 0.8 percent from GDP in 1938: absent the shock, the output decline in 1938 would have been as much as a third smaller.
In the final section of the article I explore how the auto shock contributed to the recession's anomalies. I use an unpublished 38×38 input-output table for the 1939 U.S. economy to quantify the links between the motor vehicle industry and other sectors. Using this information, I provide suggestive evidence that the auto industry shock contributed to the rapid decline in industrial production in fall 1937 and to the long left tail of negative state employment growth. I also suggest that the auto shock may resolve much of the mysterious lack of comovement in the recession. Without this shock, durables consumption would have fallen 12 rather than 18 percent. More speculatively, absent the relative price impact of the auto shock, nondurables spending may not have risen, and there may have been fewer states with positive employment growth.
This article contributes to our understanding of the 1937/38 recession by proposing an additional explanation of the recession and by refining our understanding of existing explanations. It also relates to a long-standing theoretical literature on the importance of sectoral and firm level shocks for explaining aggregate fluctuations. It provides support for Xavier Gabaix's (Reference Gabaix2011) hypothesis that shocks to large firms may account for a significant portion of aggregate fluctuations. And this article provides an example of how the auto industry played a significant role in aggregate fluctuations before WWII, just as it did after the war (Ramey and Vine Reference Ramey and Daniel J.2006).
I proceed in the next section by reviewing the literature on the 1937/38 recession. I then document anomalies in the timing, sectoral, and geographic incidence of the recession. This motivates a discussion and explanation of the auto price increase. I then quantify the impact on auto sales of the supply shock by constructing a forecast for the path of auto sales had sales only been affected by monetary policy, fiscal policy, and the business cycle. In the final section, I explore the link between the auto shock and the recession's anomalies.
PREVIOUS LITERATURE AND POLICY DEVELOPMENTS
Fiscal Policy
Many authors have placed full or partial blame for the 1937 recession on increasing taxes and decreasing transfers.Footnote 7 After rising to 5.4 percent of GDP in fiscal year 1936 (1 July 1935 to 30 June 1936), the federal government's budget deficit shrank to 2.5 percent of GDP in fiscal 1937 and 0.1 percent of GDP in fiscal 1938 (Office of Management and Budget 2016, table 1.2). This large swing was divided equally between an increase in receipts and a decrease in outlays. Much of the revenue increase came from social security taxes, which began to be collected in January 1937.Footnote 8 Both workers and firms paid a 1 percent payroll tax on the first $3,000 of earnings (Barro and Sahasakul Reference Barro and Sahasakul1986). The effect was contractionary since regular social security benefits were not paid until 1940.Footnote 9 Corporate tax rates also rose with the enactment of the undistributed profits tax in June 1936. Federal government transfers fell after the payment of the veterans' bonus in the summer of 1936.
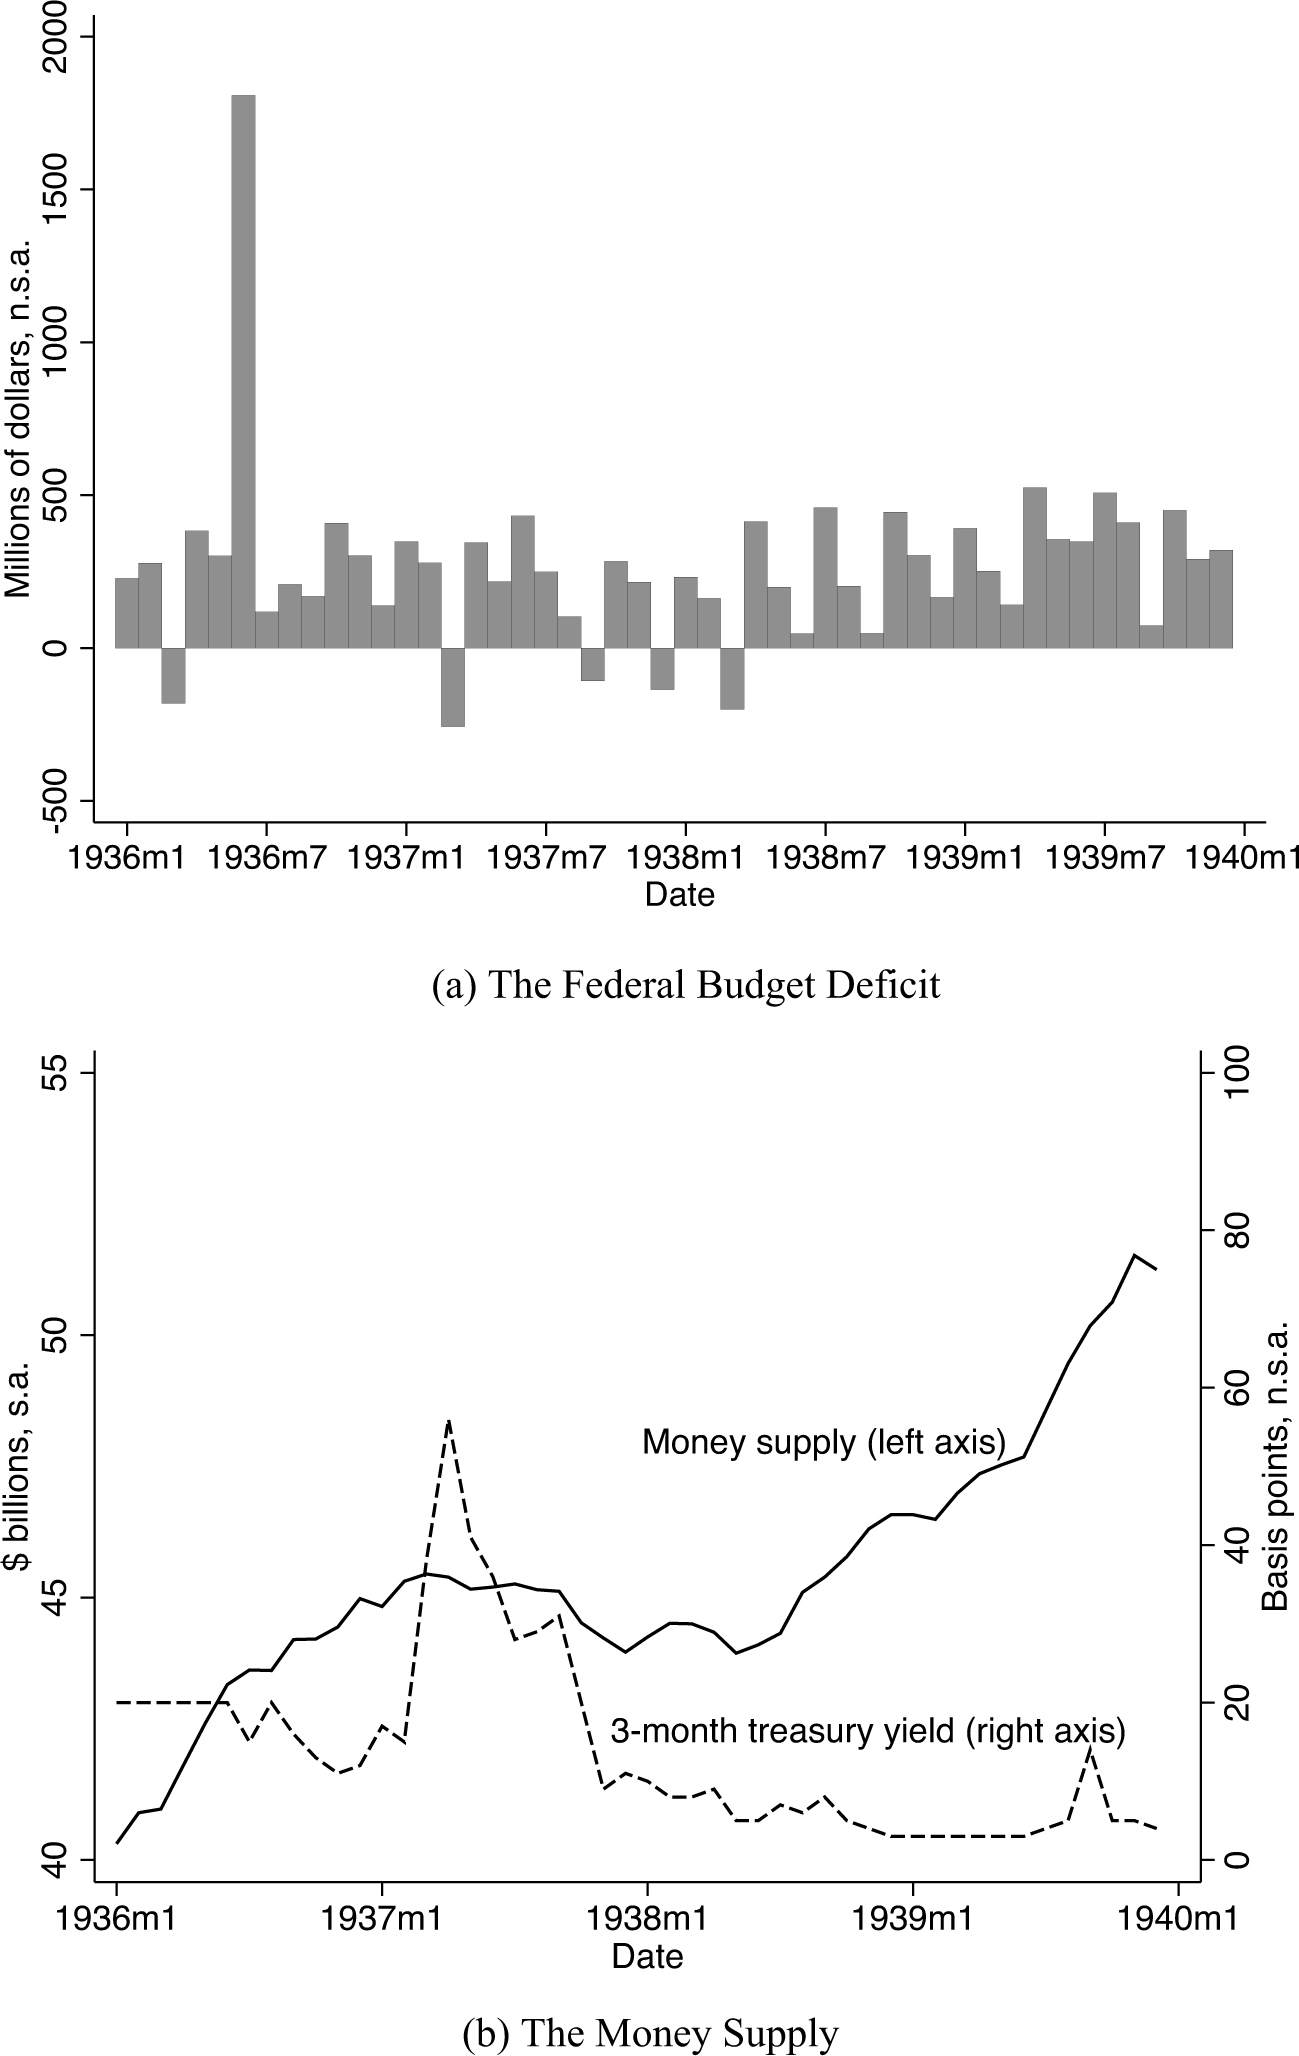
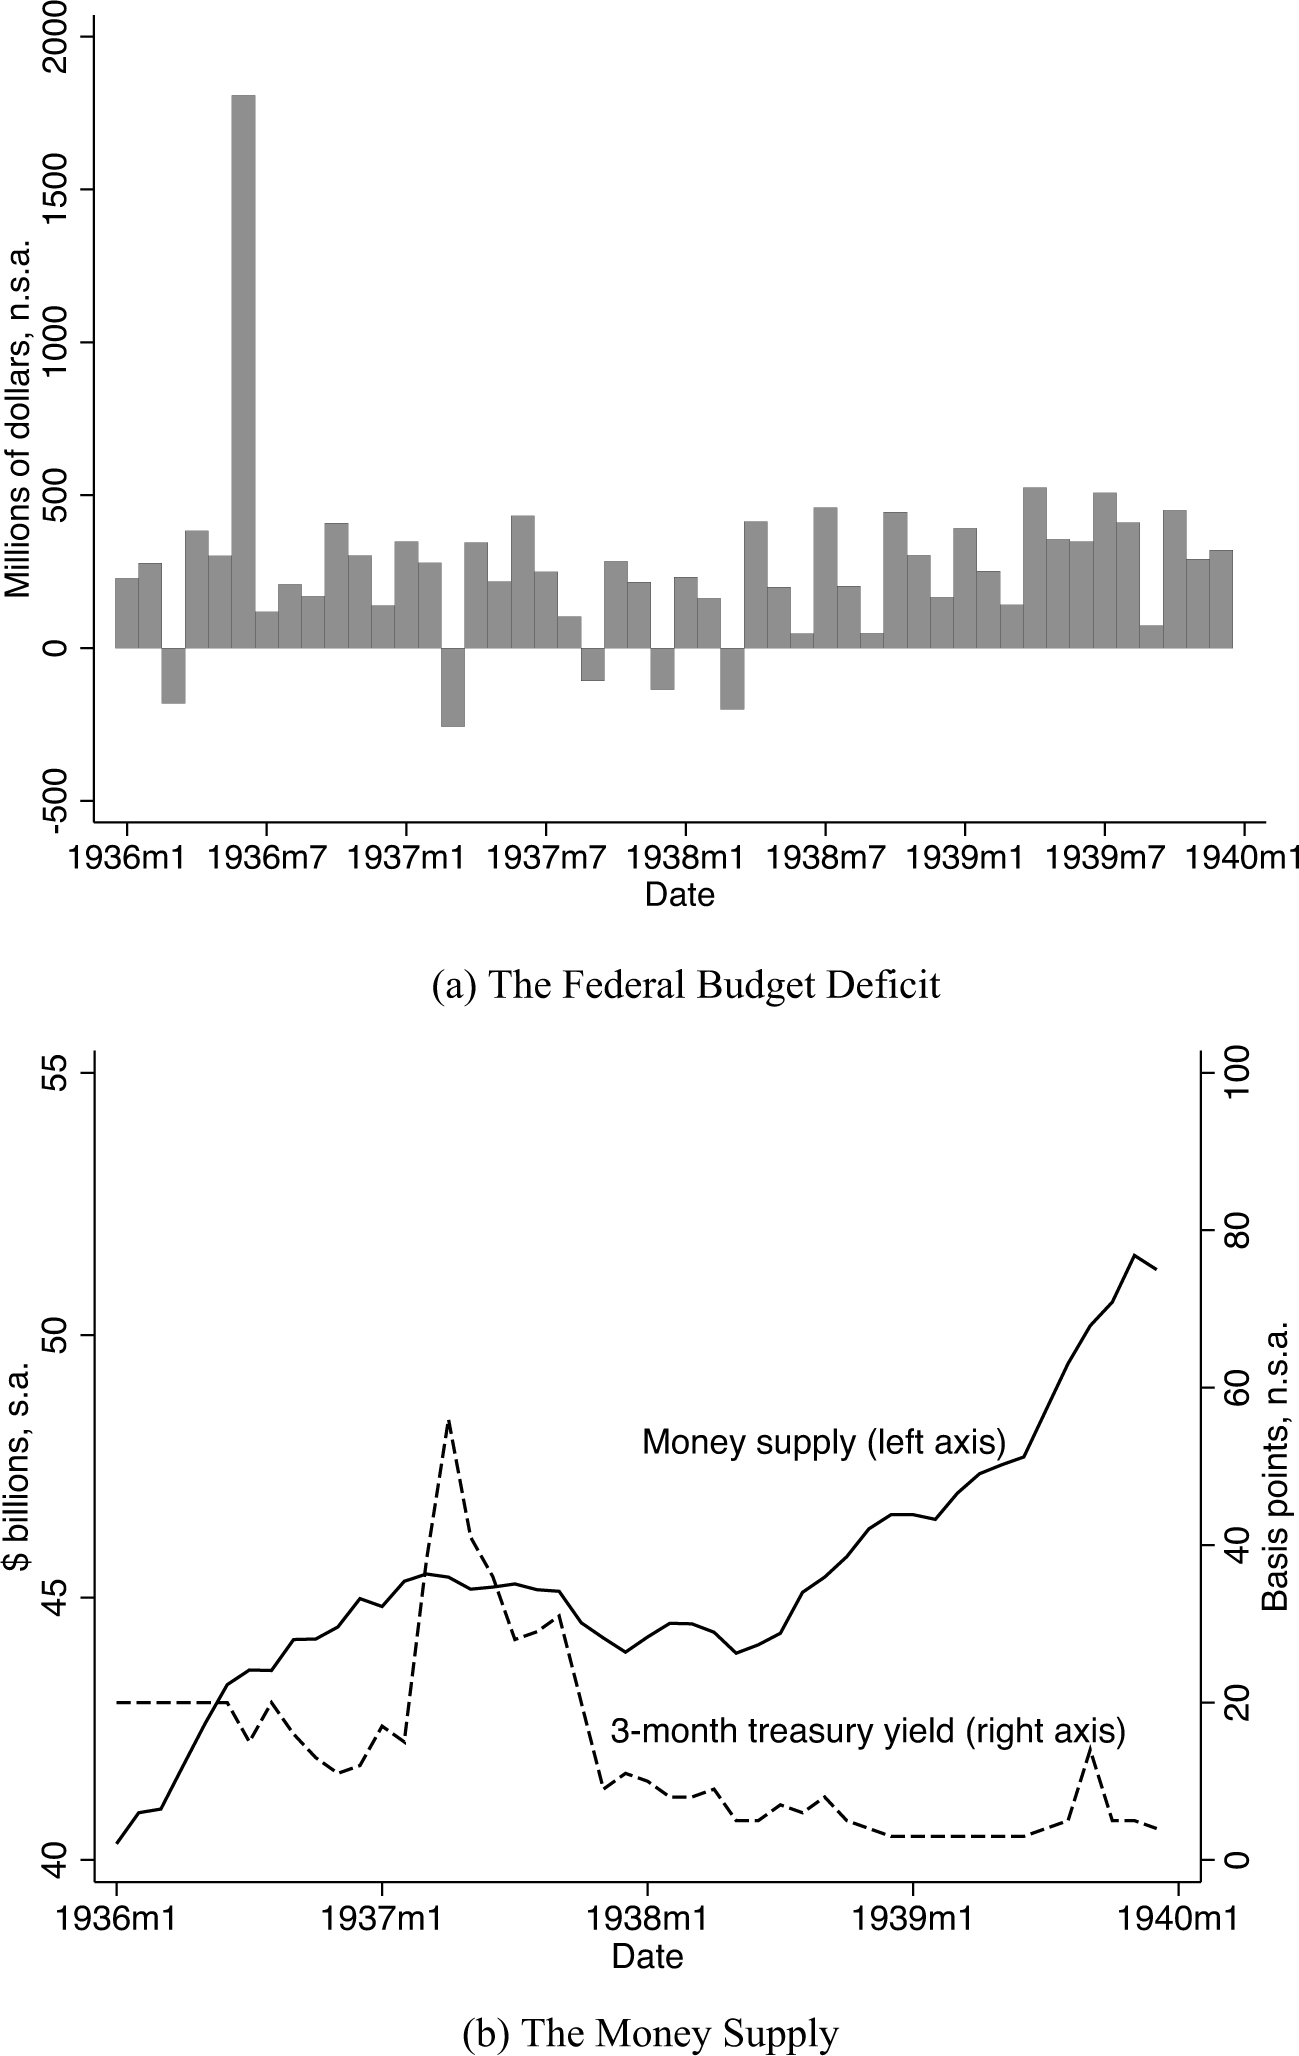
Figure 1(a) shows the monthly federal budget deficit between 1936 and 1939.Footnote 10 It makes clear the significance of the veterans' bonus. In June 1936, the federal government paid veterans cash and bonds worth roughly 2 percent of GDP. Not only was this payment to veterans enormous, Joshua Hausman (Reference Hausman2014) argues that it was mostly spent in 1936.
THE BUDGET DEFICIT AND THE MONEY SUPPLY
Monetary Policy
Along with fiscal policy, the most popular explanation for the 1937/38 recession is restrictive monetary policy.Footnote 11 The Federal Reserve raised reserve requirements in August 1936 and again in March and May 1937. In December 1936, the Treasury began sterilizing gold inflows. Milton Friedman and Anna Schwartz argue (1963, pp. 544–45):
The combined impact of the rise in reserve requirements and—no less important—the Treasury gold-sterilization program first sharply reduced the rate of increase in the money stock and then converted it into a decline. … The sharp retardation in the rate of growth of the money stock must surely have been a factor curbing expansion, and the absolute decline, a factor intensifying contraction.
Figure 1(b) shows the behavior of the money supply (currency held by the public plus demand and time deposits of commercial banks) from 1936 to 1939. The money stock plateaus in the spring and summer of 1937 and then declines in the fall. There is an emerging consensus that the key shock was gold sterilization rather than the increase in reserve requirements. Charles Calomiris, Joseph Mason, and David Wheelock (Reference Calomiris, Mason and Wheelock2011) use individual bank data to investigate how tighter reserve requirements affected bank behavior. They find no evidence that the changes in reserve requirements affected bank reserve demand in 1936 and 1937. Douglas Irwin (Reference Irwin2012) examines the time series of the deposit-reserve ratio and also cannot detect an effect of the reserve requirement changes. Finally, Haelim Park and Patrick Van Horn (2015) examine loan supply and find no effect of the reserve requirement increase.
Unlike the changes to reserve requirements, Irwin (Reference Irwin2012) argues that gold sterilization had quantitatively large impacts on the monetary base and thus on the money supply. He estimates that absent gold sterilization, the 1937 monetary base would have been as much as 10 percent larger. However, the channel through which money supply declines affected real activity is unclear. There was relatively little impact on interest rates. Figure 1(b) shows the path of the yield on three-month treasury bills. Although yields briefly spike by 10 to 40 basis points in the spring and summer of 1937, they remain close to zero over the period. Other interest rates rose only slightly. For example, in 1937 the prime commercial paper rate rose from 0.75 to 1 percent (Irwin Reference Irwin2012).
Of course when interest rates are near zero, monetary policy may still change inflation expectations and thus affect the real interest rate. This is the channel through which Christina Romer (Reference Romer1992) argues that money supply growth led to economic recovery after 1933. Gauti Eggertsson and Benjamin Pugsley (Reference Eggertsson2006) argue that policymakers' actions in the spring of 1937 lowered inflation expectations and through this channel caused the 1937/38 recession. This provides one way of explaining how monetary actions, despite little impact on interest rates, may have had large real effects.
Unionization
Harold Cole and Lee Ohanian (Reference Cole and Lee E.2001, Reference Cole and Lee E.2004)Footnote 12 argue that New Deal policies and unionization led to high manufacturing wages and a slow recovery of output and employment after 1933. In their working paper (Cole and Ohanian Reference Cole and Lee E.2001), they briefly suggest that a spike in wages due to the upholding by the Supreme Court of the National Labor Relations Act (the Wagner Act) in April 1937 contributed to the 1937/38 recession. Since this is not the focus of their work, they do not provide quantitative evidence—beyond the documentation of wage increases—for this effect. My work supports their argument insofar as it shows how unionization in the automobile industry did substantially contribute to the recession. The transmission mechanism in my article is, however, different from that in Cole and Ohanian. I argue that unionization had large impacts in the auto industry because it affected expectations of the future price of automobiles, leading to substantial intertemporal substitution of auto purchases. Furthermore, whereas Cole and Ohanian suggest that wage increases induced by unionization were the primary cause of the recession, I argue that understanding the auto industry shock still leaves much of the recession to be explained by monetary and fiscal policy.
ANOMALIES
Timing
The NBER dates the business cycle peak as May 1937. During the summer, however, aggregate production and employment declined only slightly. Indeed, Romer's (Reference Romer1994) business cycle dating algorithm selects August as the peak. The period between May and August was marked by a decoupling of nondurable and durable goods manufacturing. Nondurables peaked in May, with production falling by 6.1 percent over the ensuing three months. Durables production rose 3.7 percent over the same period, peaking in August.Footnote 13
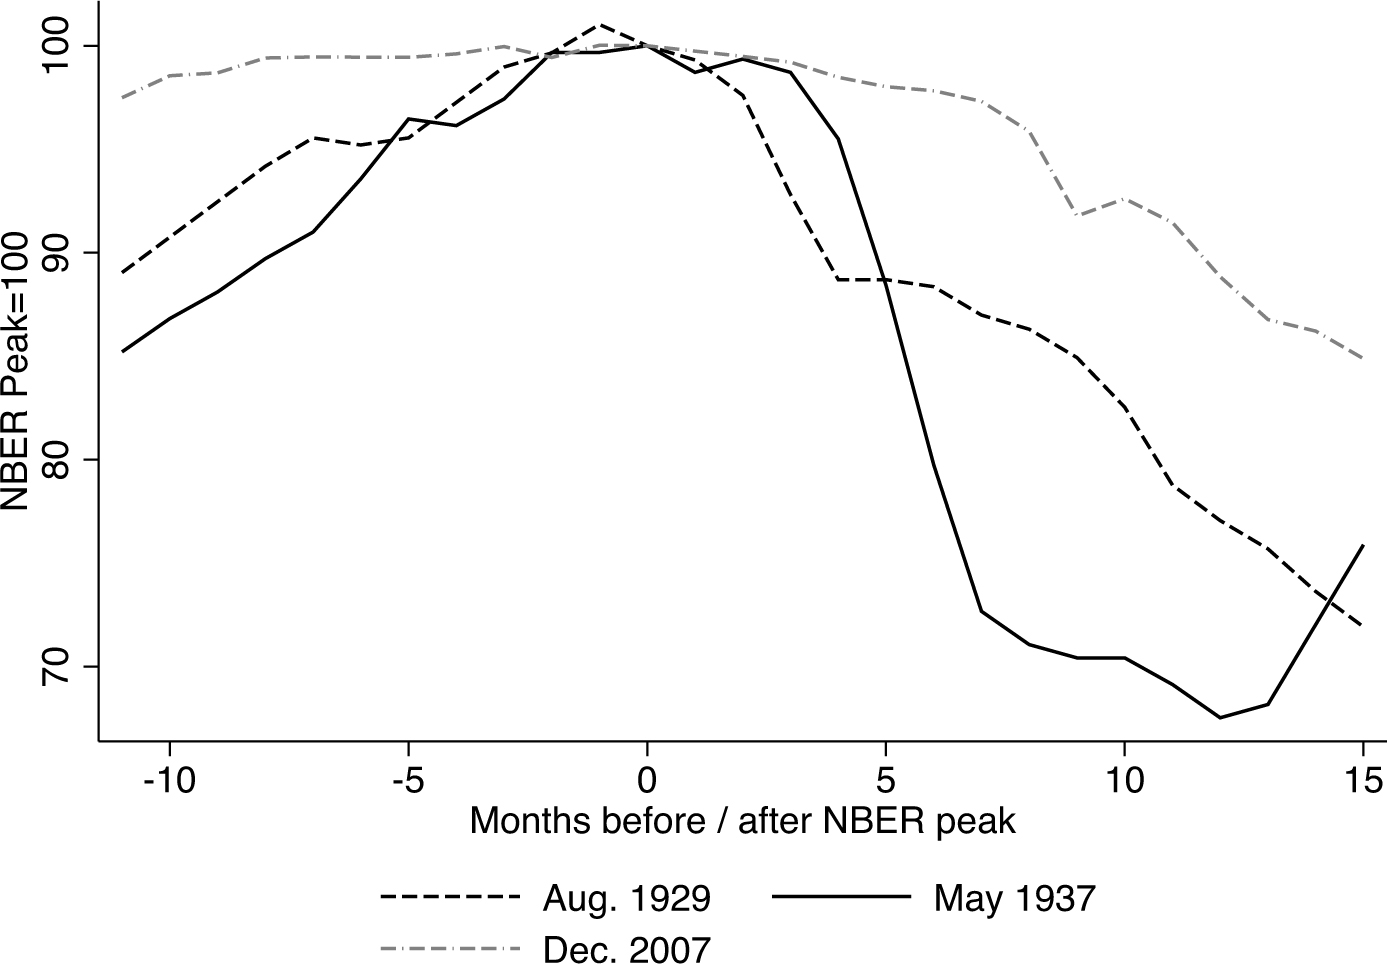
In early fall, the character of the recession changed entirely. Seasonally adjusted industrial production fell 24 percent from September to December 1937. Non-seasonally adjusted production fell 27 percent.Footnote 14 The decline in output was accompanied by large declines in employment. From September 1937 to January 1938, 22 percent of durable goods employment disappeared.Footnote 15 These job losses were reflected in a rapidly rising unemployment rate. The monthly, seasonally-adjusted, series from the National Industrial Conference Board shows the unemployment rate rising from 11.6 percent in September 1937 to 16.9 percent in January 1938.Footnote 16
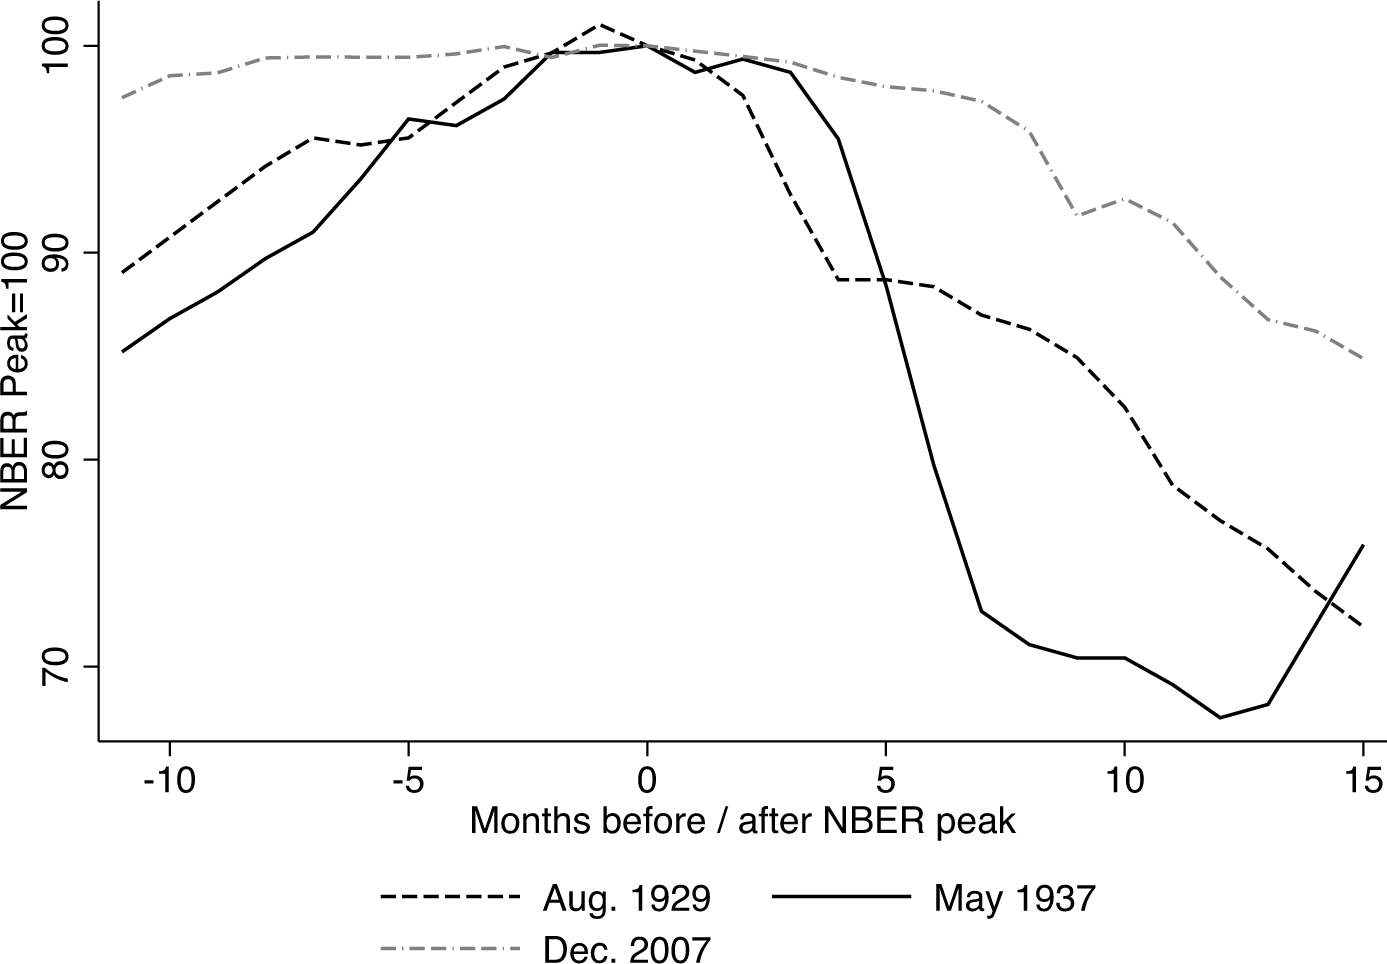
Figure 2 shows the path of industrial production around the business cycle peak in 1937, and, for comparison, in 1929 and 2007. It makes clear how extraordinarily rapid the contraction was in 1937. Indeed, the decline in industrial production from September to December 1937 is the largest three-month decline in the history of the Federal Reserve Board series (which begins in 1919), and is larger than any three-month decline in the Miron-Romer series that goes back to 1884.
SEASONALLY ADJUSTED INDUSTRIAL PRODUCTION AROUND THREE BUSINESS CYCLE PEAKS
I am unaware of existing work that emphasizes or offers explanations for the speed of the economy's collapse in fall 1937. Existing theories of the recession are unpromising in this regard. The timing of the decrease in transfers (the second half of 1936) or the increase in taxes (the beginning of 1937) fits poorly with the rapid economic decline in the fall of 1937. Theory and evidence suggest that changes in taxes and transfers should have immediate impacts. Jonathan Parker et al. (Reference Parker, Souleles and Johnson2013), for instance, find that the largest effect of the 2008 stimulus payments was in the quarter of payment. And Hausman (Reference Hausman2014) finds that veterans spent much of their 1936 bonus within six months.Footnote 17 The decline in the money supply in 1937 was also small compared to that in the Great Depression and is thus ill-suited to explain a much more rapid decline in industrial production. Finally, the collapse in production occurred six months after April 1937, the key date in Cole and Ohanian's (Reference Cole and Lee E.2001) unionization story.
Geography
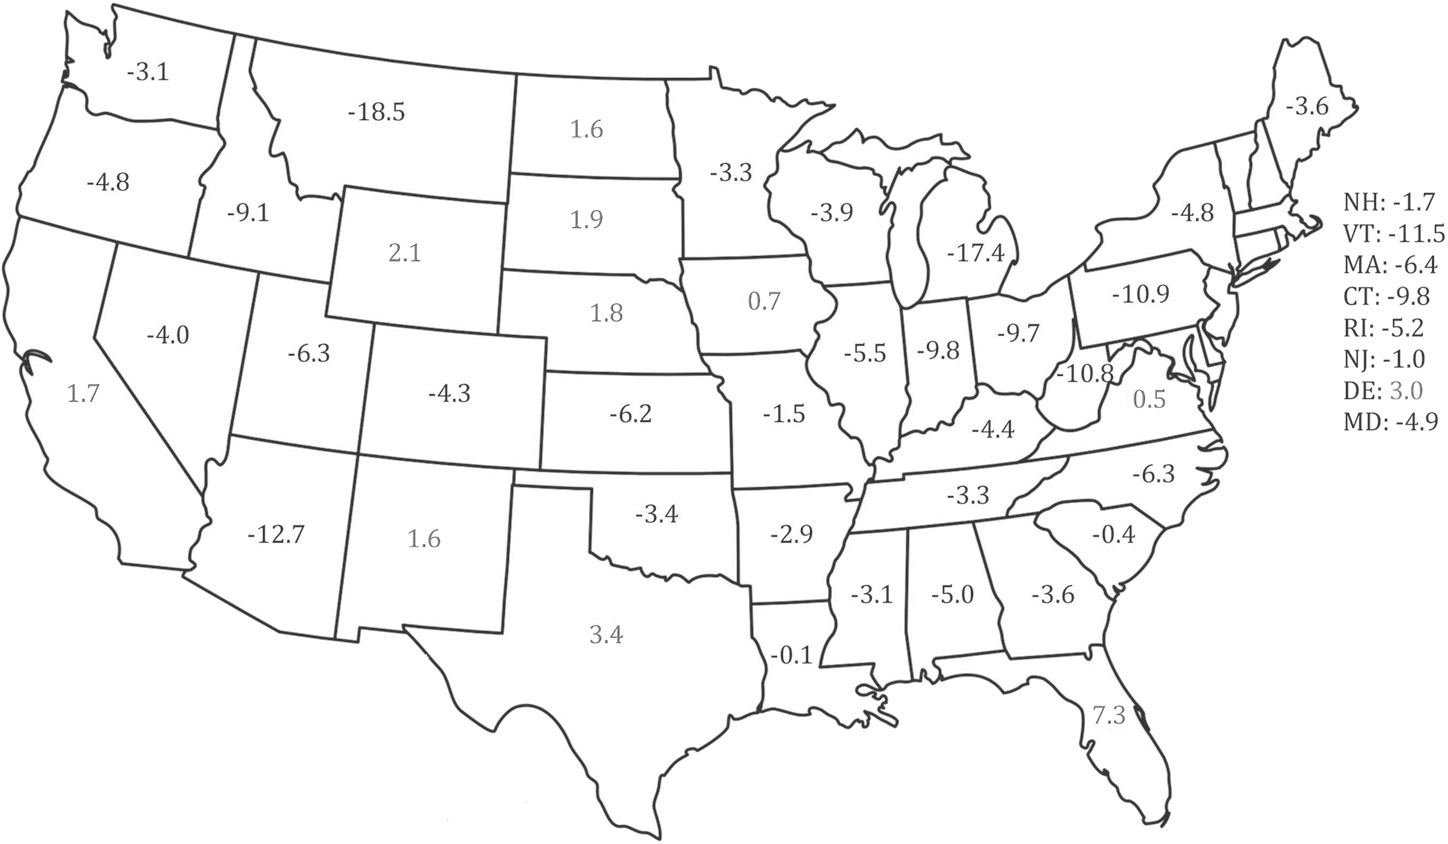
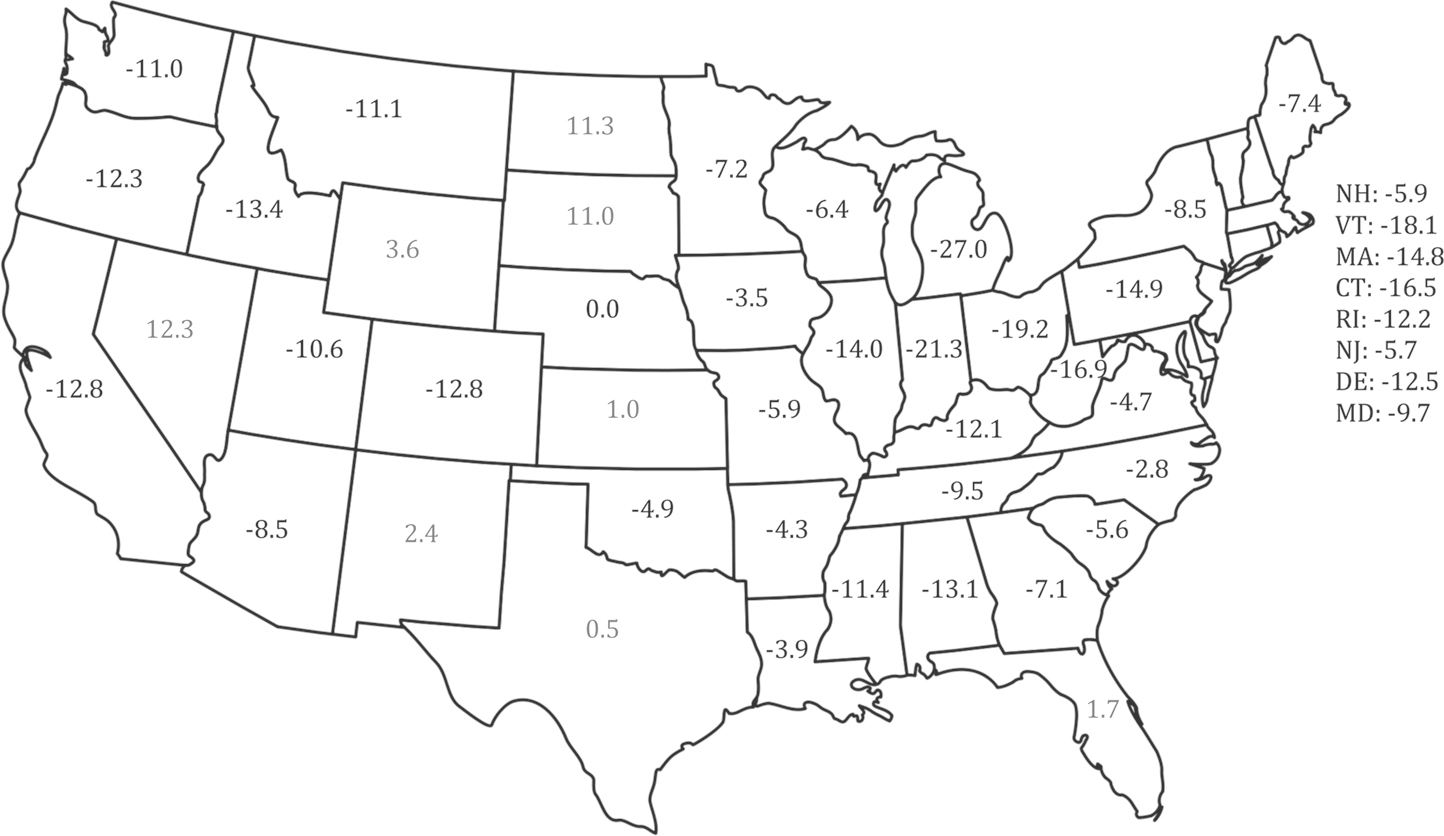
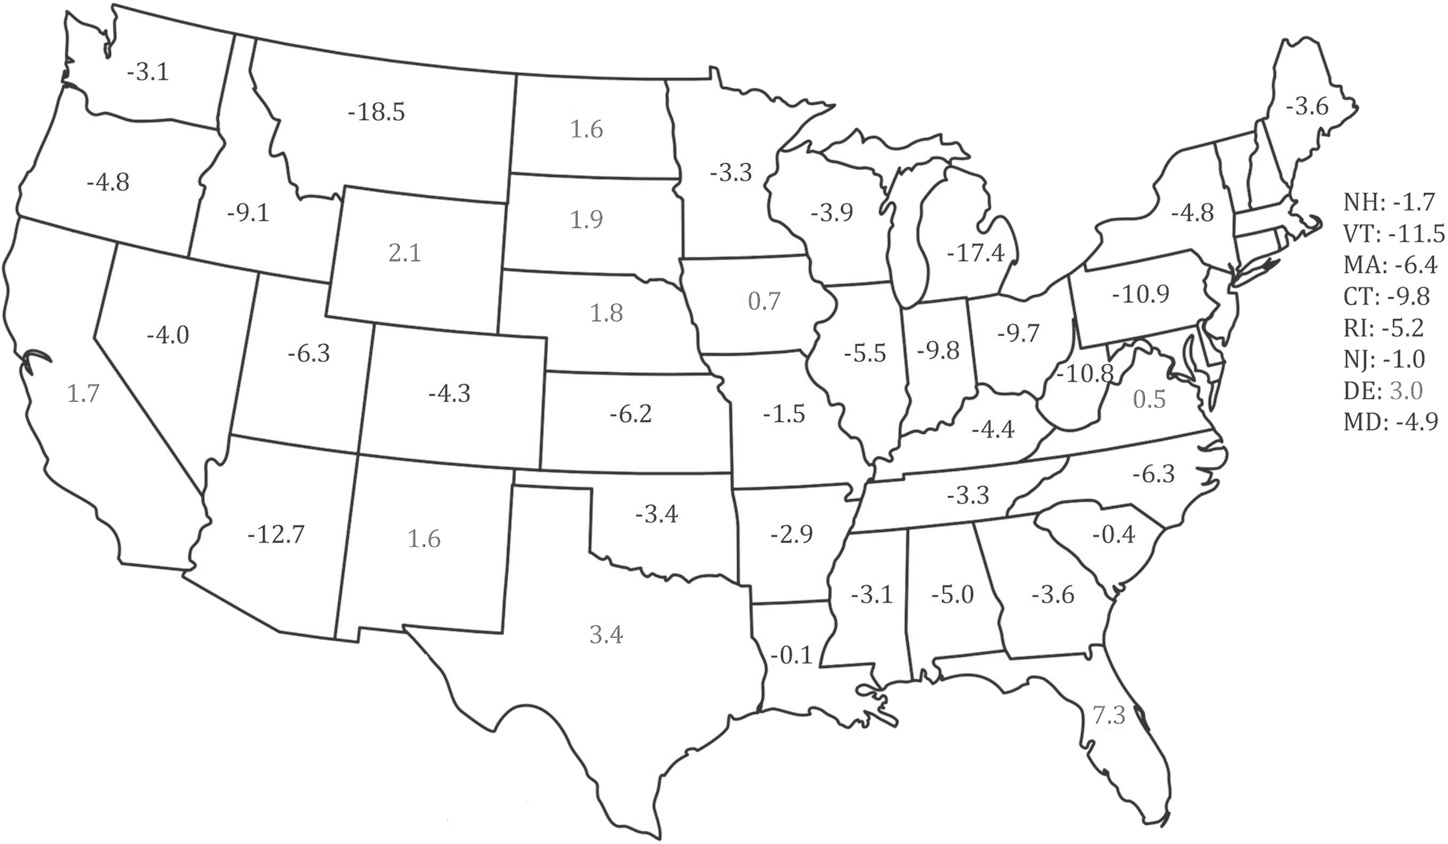
A generally unappreciated aspect of the 1937/38 recession was its varying impact across states.Footnote 18 Figures 3 and 4 show the percent change in private nonfarm and manufacturing employment between 1937 and 1938. Despite a 5 percent decline in the country as a whole, total private employment rose in 11 states. Perhaps more remarkably, while manufacturing employment fell 12 percent nationwide, it rose in 8 states.Footnote 19 Of course, recessions always affect some states more than others. States have different concentrations of cyclically sensitive industries and different pre-recession employment trends. But insofar as recessions are associated with production declines in most industries, it is unclear how these factors can explain actual increases in employment in some states during a severe recession. And there is strong evidence that the degree of geographic dispersion in 1937/38 was unusual relative to that in other interwar downturns.
CHANGE IN PRIVATE NONFARM PAYROLL EMPLOYMENT, 1937–1938 (PERCENT)
CHANGE IN MANUFACTURING EMPLOYMENT, 1937–1938 (PERCENT)
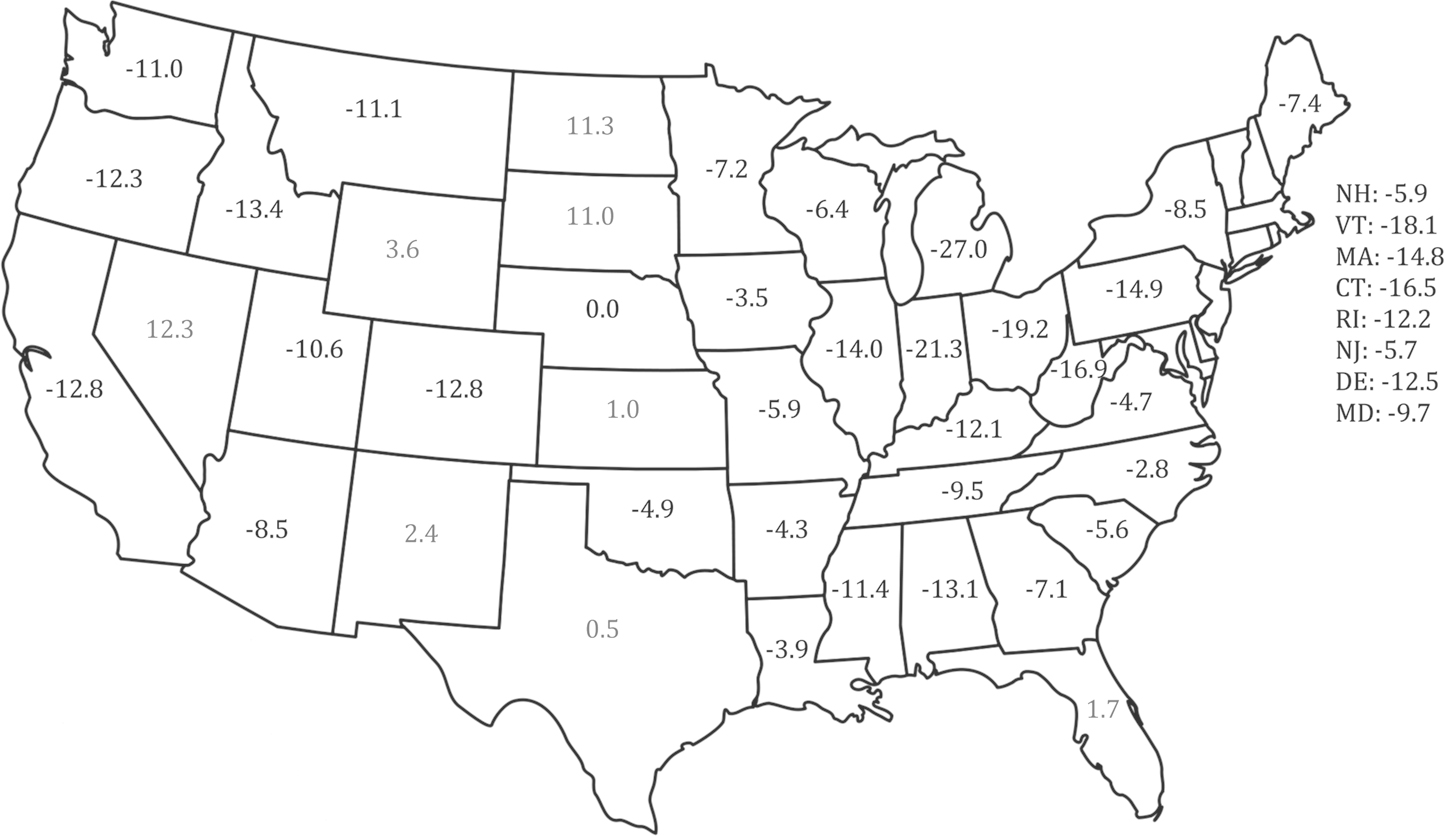
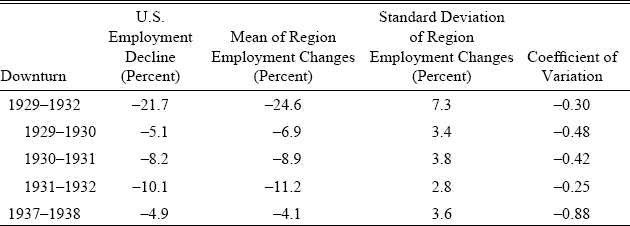
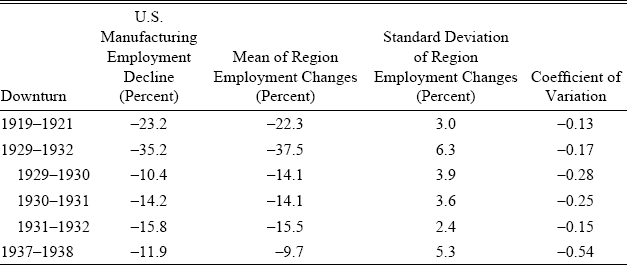
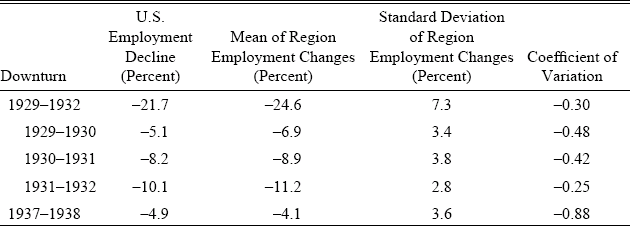
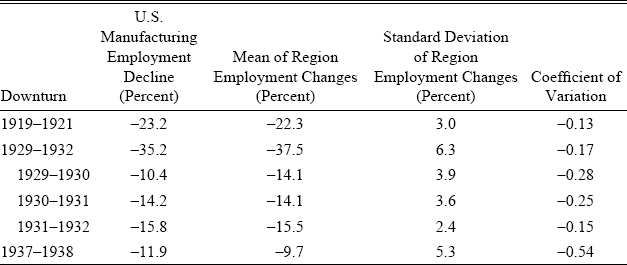
Tables 2 and 3 compare the variation in the change in private and manufacturing employment between 1937 and 1938 with that between 1929 and 1932. In the case of manufacturing, it is also possible to extend the comparison to 1919–1921. The comparison is done across regions rather than across states, since the Bureau of Labor Statistics (BLS) did not regularly publish state employment data before 1931.Footnote 20 The tables show a remarkably consistent story: regardless of whether one focuses on total employment or manufacturing employment, the coefficient of variation in 1937/38 is roughly double its value during any year of the Depression itself.
VARIATION IN EMPLOYMENT OUTCOMES ACROSS NINE REGIONS
Source:
Wallis (1989).
VARIATION IN MANUFACTURING EMPLOYMENT OUTCOMES ACROSS NINE REGIONS
Note:
Data for 1919–1921 are for wage earner employment only.
Source:
Wallis (Reference Wallis1989) for 1929–1938, the 1947 Census of Manufactures for 1919–1921.
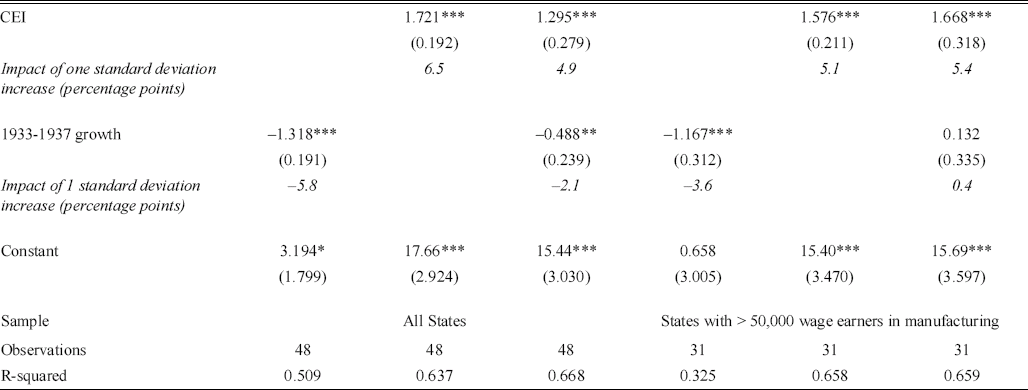
To understand to what extent this geographic variation reflects the interaction of state industry structure with industry-specific outcomes, I estimate the following regression:

The percent change in total manufacturing employment in state j is ΔEj ;Footnote 21 Trendj is the average annual growth rate of employment in state j from 1933 to 1937; CEIj + Σi Sij ΔEi , where Sij is the share of wage earner employment in industry i in state j in 1937, and ΔEi is the percent change in wage earner employment in industry i nationwide from 1937 to 1938.Footnote 22 Thus CEIj shows how employment in state j would have changed had employment changes in each industry in the state exactly matched the nationwide changes in employment by industry.Footnote 23 Put differently, variation in CEIj across states reflects only differences in industry structure across states. To compute state shares of employment by industry, I collected data on employment in every industry by state from the 1937 Census of Manufactures (Bureau of the Census 1939). Data on nationwide changes in employment by industry were taken from the October 1939 Federal Reserve Bulletin.
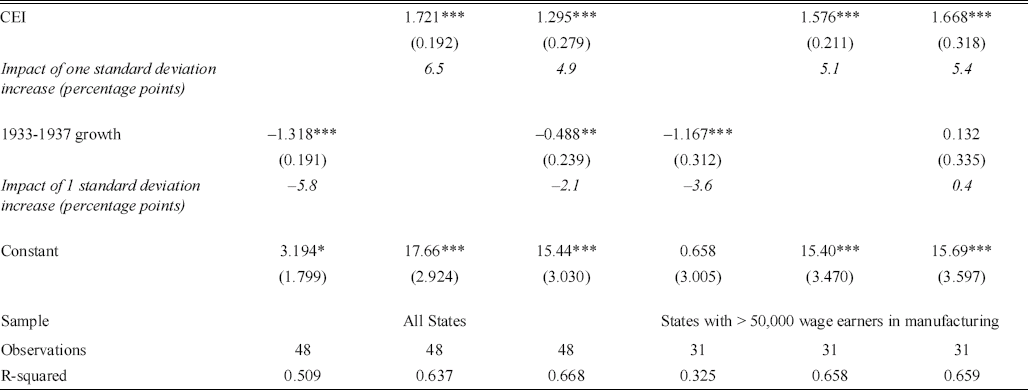
Table 4 shows results both for all states and for the 31 states with more than 50,000 wage earners in manufacturing in 1937.Footnote 24 The measure of industry structure, CEI, and to a lesser extent, trend employment growth in the state from 1933 to 1937 are robustly statistically and economically significant. A one standard deviation decline in CEI is associated with more than 5 percentage points lower manufacturing employment growth. Measured by the R2 , CEI alone explains nearly two-thirds of the variation in state employment changes. The negative coefficient on 1933–1937 growth means that on average states that grew faster after 1933 did worse in the 1937/38 recession. In the 31 state sample, however, this result disappears when the measure of industry structure is included.
EXPLAINING GEOGRAPHIC VARIATION
* + Significant at the 10 percent level.
** + Significant at the 5 percent level.
*** + Significant at the 1 percent level.
Notes:
The dependent variable is the percent change in state manufacturing employment from 1937–1938 (average decline is 7.8 percent). Standard errors are in parentheses.
Sources:
Author's calculations.
Industry structure's overwhelming importance suggests that the geographic anomalies in 1937/38 are primarily a manifestation of an unusual pattern of output movements across industries.Footnote 25 To understand why state outcomes were so different in 1937/38, one must understand sectoral output patterns in the recession. The next section turns to this topic.
Sectoral
Macroeconomists view comovement as a common element of recessions. There is widespread disagreement about the causes of particular recessions, but there is a widespread agreement that recessions are not simply the result of dramatic declines in output in one sector of the economy. Rather they are events in which nearly all sectors decline, albeit to different degrees. John Long and Charles Plosser (Reference Long and Charles I.1987) summarize this conventional view, stating: “Comovement among a wide variety of economic activities is an essential empirical characteristic of business cycles” (p. 333). This view of business cycles has shaped nearly all macroeconomic models. Models ranging from old Keynesian to real business cycle are constructed so that negative shocks lead to declines in output and employment across all forms of consumption and investment.
To a surprising degree, the 1937/38 recession does not fit this accepted wisdom. The following describes movements in components of consumption and investment in 1937/38 versus in other recession years.
Durables Consumption
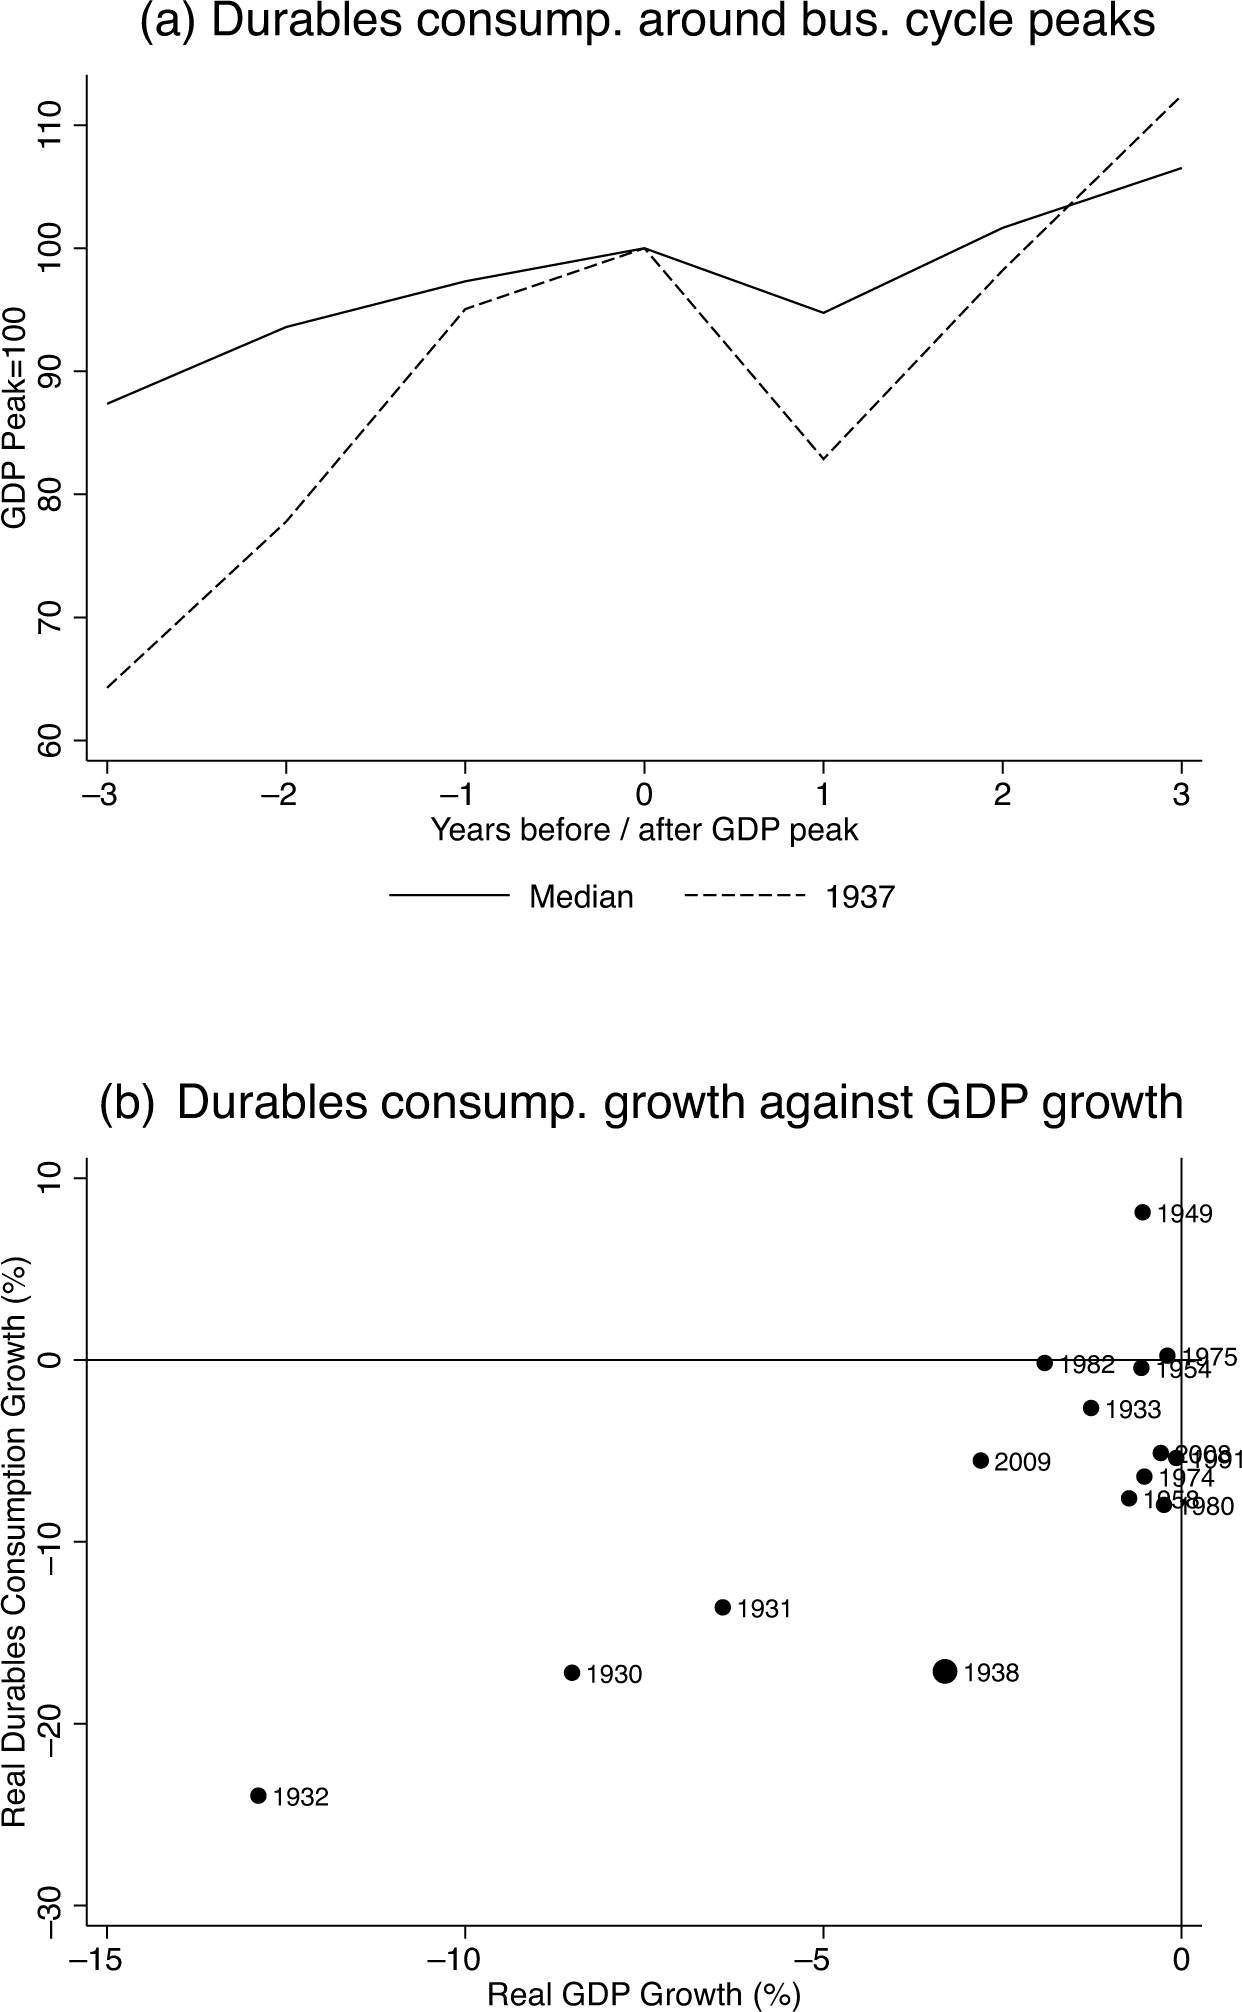
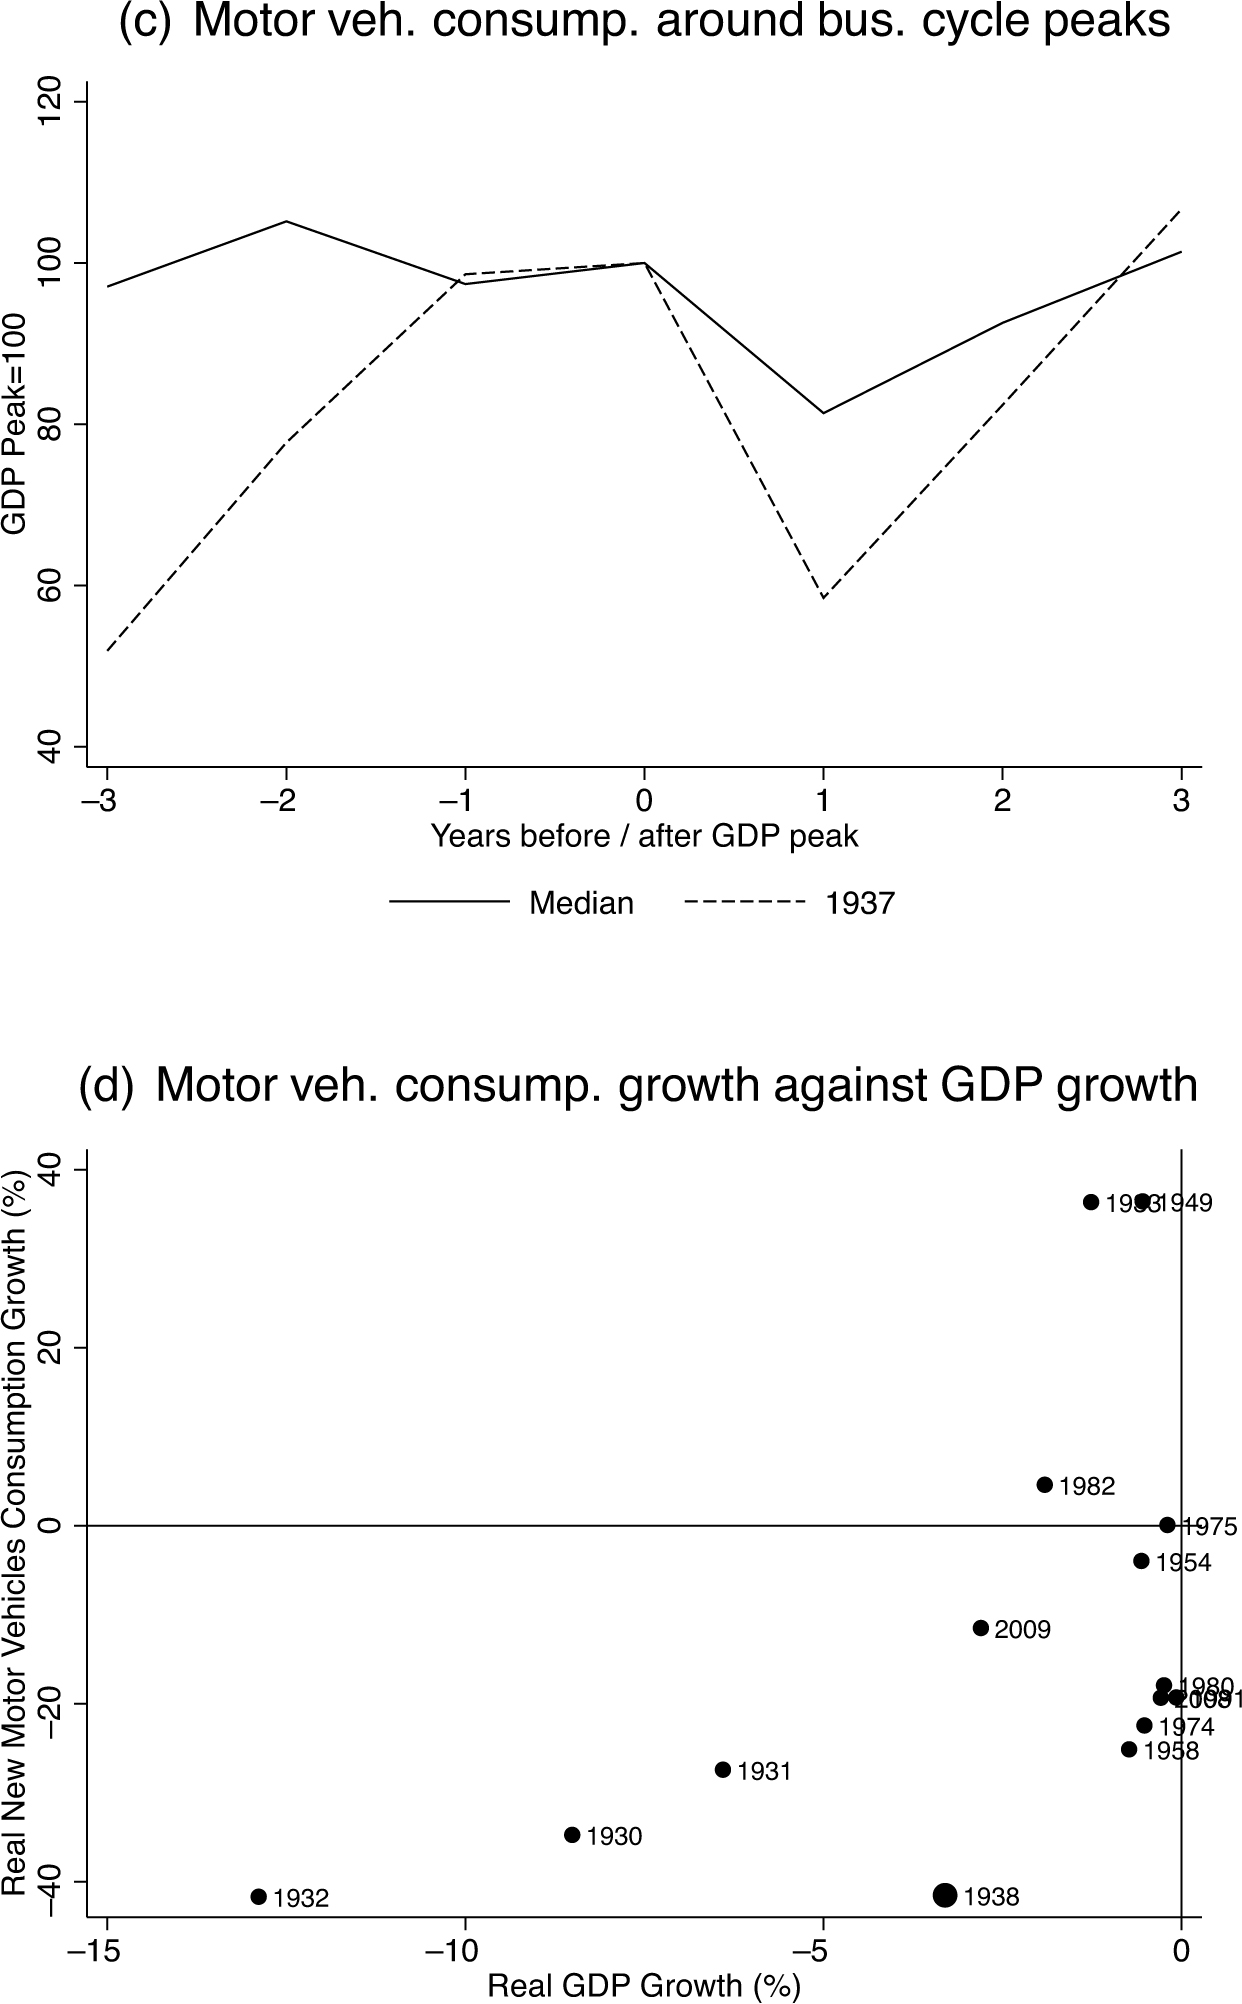
Between 1937 and 1938 real durables consumption fell 17.1 percent. New motor vehicles consumption fell 42 percent.Footnote 26 This decline in durables, and particularly motor vehicles, consumption was extraordinarily unusual given the behavior of GDP.
The solid line in Figure 5(a) shows the median behavior of durables consumption in postwar U.S. recessions. The dashed line shows the behavior in 1937. Of course, given that the decline in GDP was more severe in 1938, we would expect durables to fall more. To adjust for the decline in GDP, Figure 5(b) shows a scatter plot of the change in durables consumption and the change in GDP in all years with negative output growth since 1929, excluding 1945–1947.
CONSUMPTION
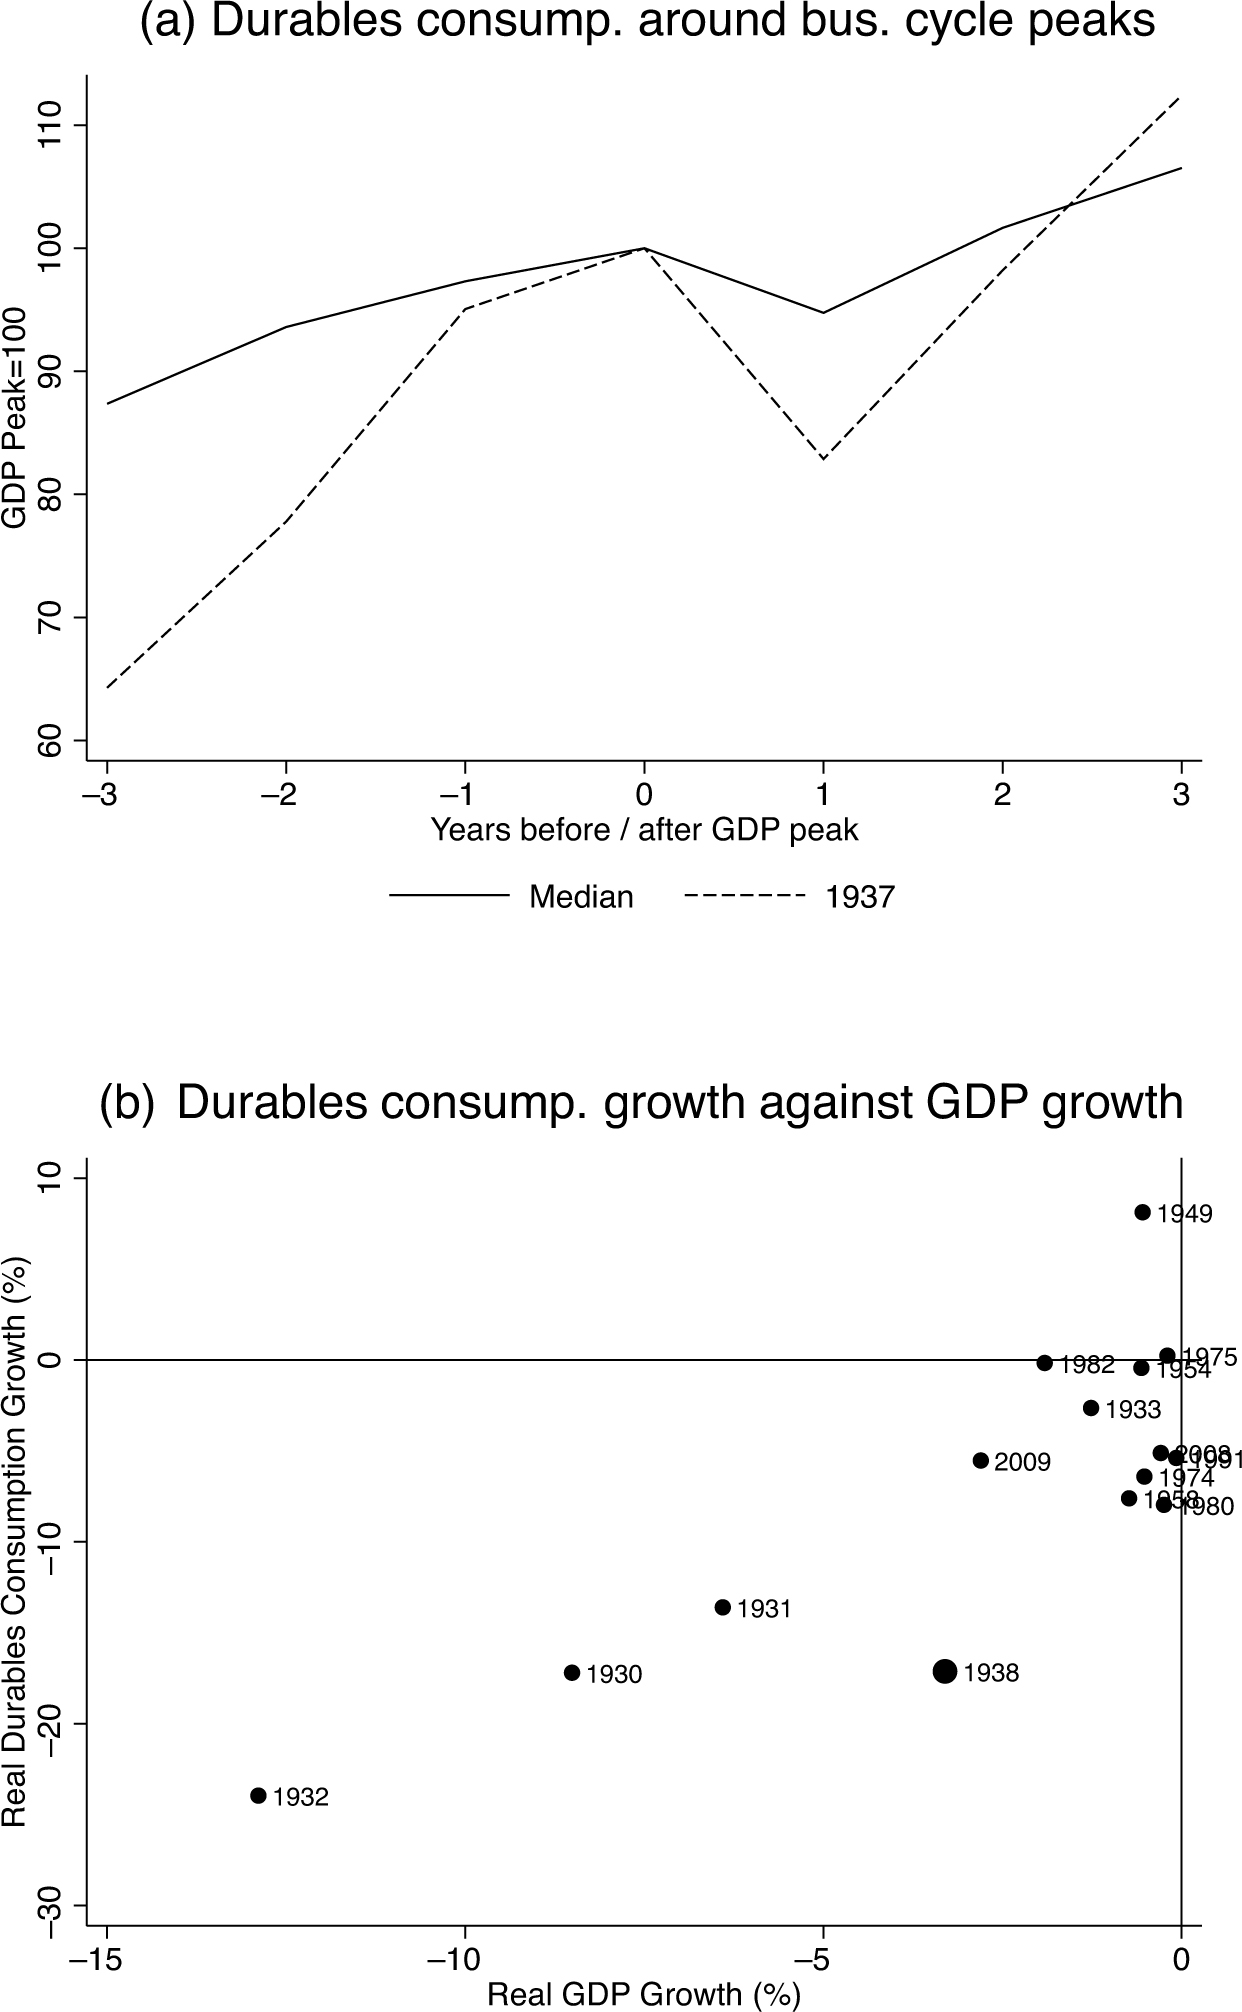
The decline in durables consumption spending in 1938 is anomalous when compared to postwar recessions or to the Great Depression. In postwar recessions, durables consumption spending has never fallen by more than 8 percent in a single year. In 2009, when GDP declined by 2.8 percent, just slightly less than the decline in 1938, durables consumption spending fell by “only” 5.5 percent.Footnote 27 Many economists have noted and attempted to explain the 17.2 percent decline in durables consumption in 1930 (Mishkin Reference Mishkin1978; Romer Reference Romer1990; Olney Reference Olney1999). Less noted is the fact that durables spending fell by almost exactly the same amount in 1938 (17.1 percent), despite a decline in output only 40 percent as large.
One can understand this pattern better by studying the two largest components of durables consumption spending, household durables including furniture and appliances, and new motor vehicles. From 1937 to 1938, household durables spending declined by 9.6 percent and new motor vehicles spending fell by 41.5 percent.Footnote 28 This decline in household durables spending was far larger than in a typical recession, but not extraordinary given the large decline in GDP. By contrast, the 41.5 percent decline in new motor vehicles spending was remarkable (Figures 5(c), 5(d)) even given the magnitude of the 1938 recession. Since the beginning of the Bureau of Economic Analysis (BEA) series in 1929, only one year saw a larger decline in auto spending: in 1932, spending fell by 41.7 percent, 0.2 percentage points more than in 1938. But whereas in 1938 real GDP fell 3.2 percent, in 1932 it fell 12.8 percent.Footnote 29
Nondurables Consumption
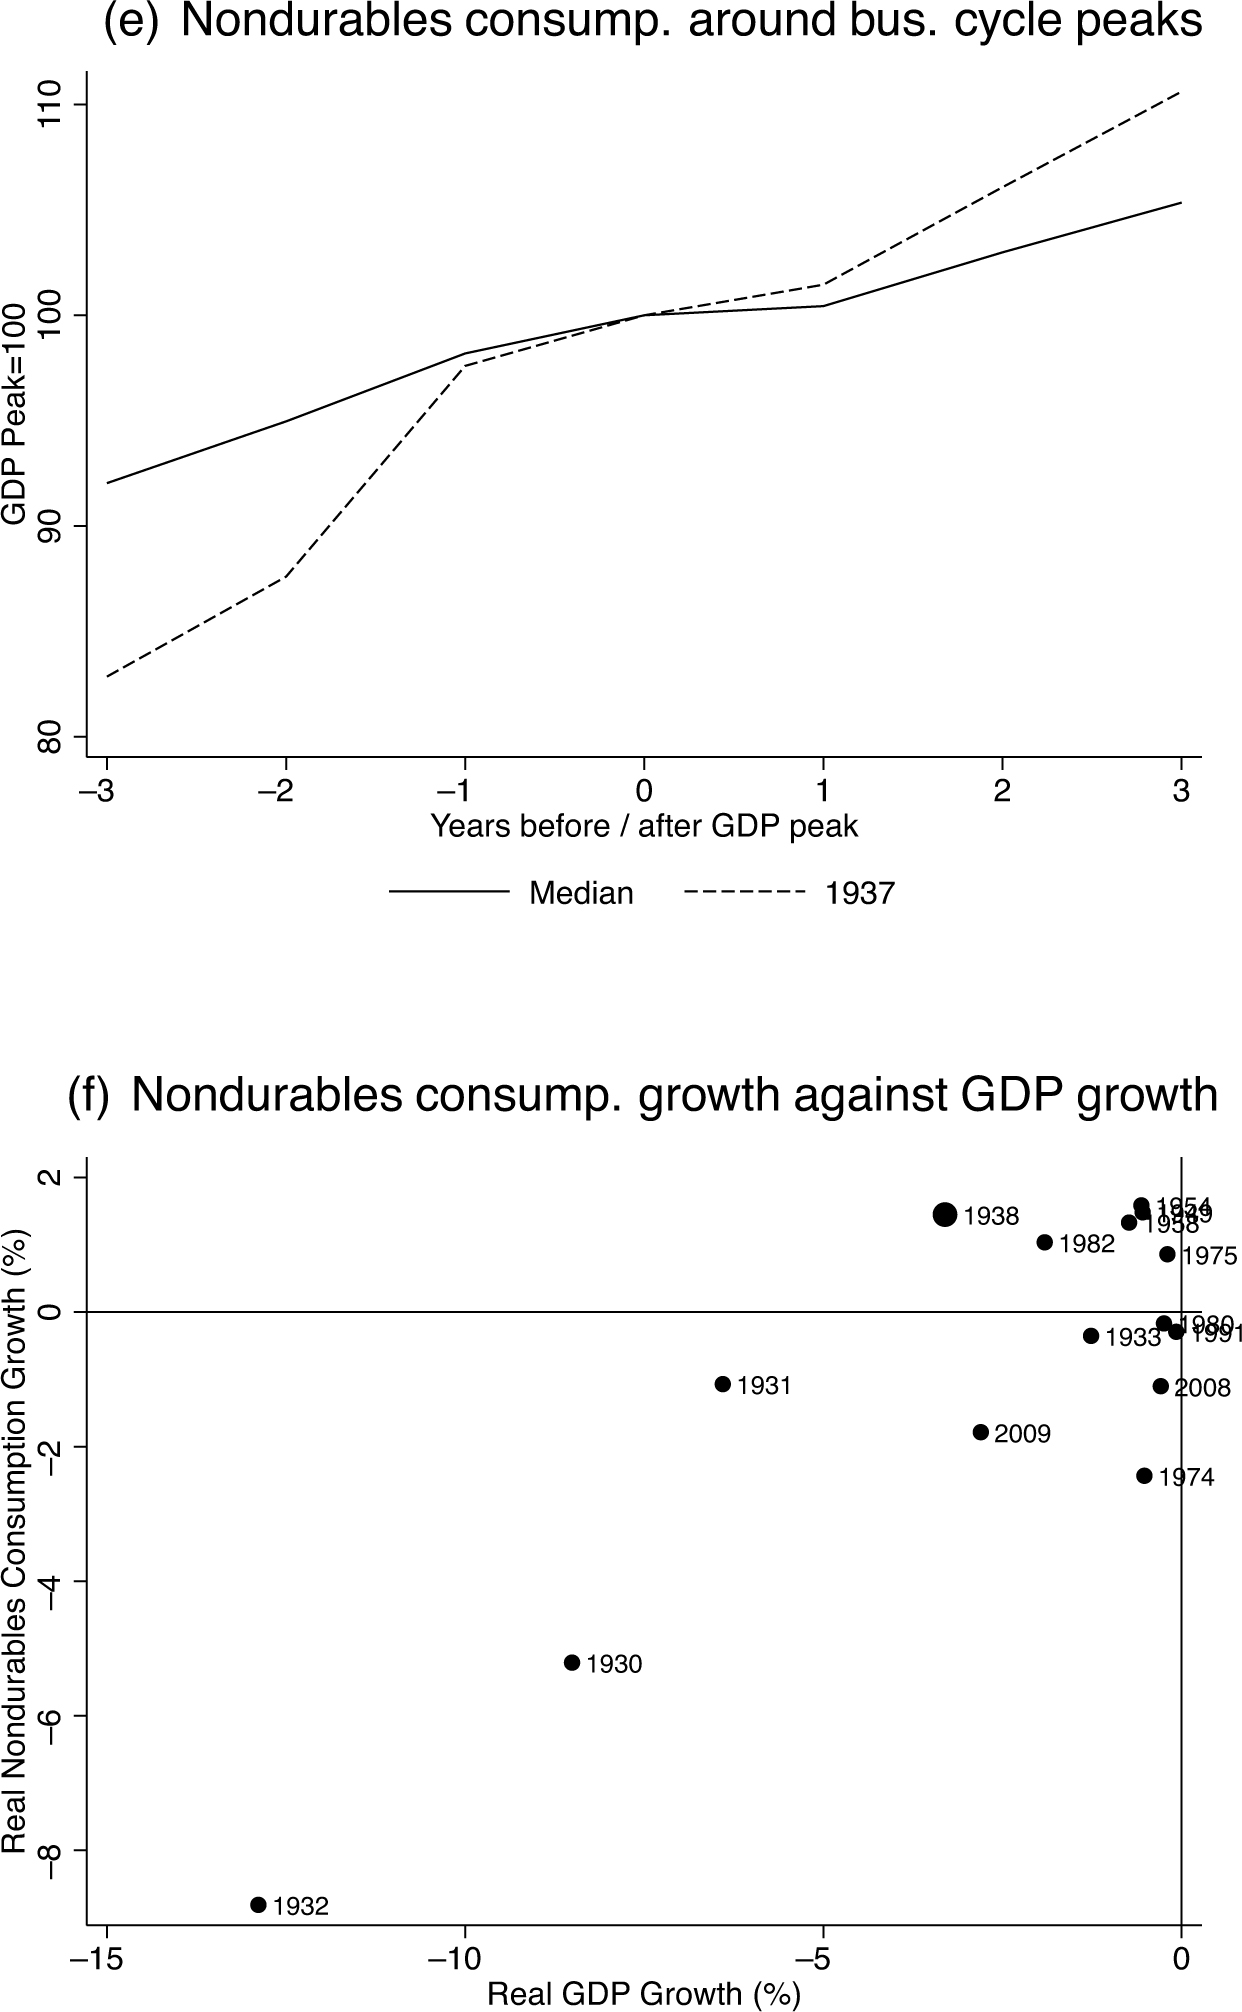
The poor performance of durables spending in 1937/38 was matched by unusually strong nondurables spending. From 1937 to 1938, nondurables spending rose by 1.4 percent (Figure 5(e)). This reflected an increase in real spending on food and beverages of 2.2 percent, an increase in spending on clothing and footwear of 1.4 percent, and a decrease in spending on energy of 1.1 percent.Footnote 30 A scatter plot of changes in GDP and nondurables spending (Figure 5(f)) shows how unusual it is for nondurables spending to rise during a large recession. The 1937/38 recession is the only time since 1929 in which nondurables spending rose during a recession in which annual GDP fell more than 2 percent.
Investment
Economists often expect that consumer durables and investment will behave similarly. Both are sensitive to interest rates and to expectations of future income. To some extent, this intuition holds true in 1937/38. Business investment—nonresidential structures, equipment, and inventories—did poorly. Oddly, on an annual basis, residential investment rose in 1938. This result is, however, sensitive to the use of annual data. Robert Gordon and Robert Krenn's (Reference Gordon and Krenn2013) quarterly estimates of residential investment show a 25.4 percent decline in residential investment between the second quarter of 1937 and the second quarter of 1938.Footnote 31
The 1920/21 Recession
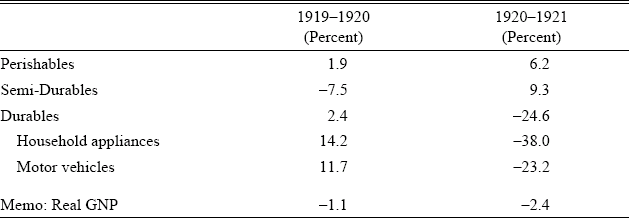
The preceding analysis uses data from the National Income and Product Accounts (NIPA), which begin only in 1929. It is also of interest to compare the 1937/38 recession with that in 1920/21. William Howard Shaw (Reference Shaw1947) provides data on commodity output for different components of consumption in this period. While not directly comparable to NIPA data, Romer (Reference Romer1989) argues that the Shaw data are accurate and unbiased. Table 5 shows the behavior of components of consumption between 1919 and 1921. Interestingly, as in 1937/38, nondurables consumption rose between 1920 and 1921 while durables consumption fell by a large amount. Relative to the decline in durables consumption as a whole, the decline in auto purchases was, however, not unusually large. Consumption of household appliances fell by significantly more than that of motor vehicles.
CHANGE IN REAL OUTPUT OF CONSUMER GOODS 1919–1921

Sources:
Consumption — Shaw (Reference Shaw1947); GNP — Romer (Reference Romer1989).
Sectoral Behavior and Existing Theories of the Recession
The sectoral pattern of output is not easily explained by any existing theories of the 1937/38 recession. Theory and empirics suggest that increases in federal taxes (and decreases in transfers) should decrease all forms of consumption, not only durables consumption. Parker et al. (Reference Parker, Souleles and Johnson2013), for example, find that the economic stimulus payments of 2008 increased nondurables consumption. And it is unclear why a monetary policy shock should affect one credit sensitive good, autos, so much more than it affects other durable goods or housing. Cole and Ohanian's (Reference Cole and Lee E.2001) union wage shock hypothesis also does not easily explain the disproportionate decline of the auto industry. If wages rose in many industries, why was the auto industry uniquely affected?
AN AUTO INDUSTRY SUPPLY SHOCK
The recession's anomalies strongly point to a role for the auto industry in causing the recession. I have shown that manufacturing employment fell most in Michigan, and that motor vehicle spending fell more than 40 percent. The mystery is deepened by the fact that auto prices rose in the fall of 1937.
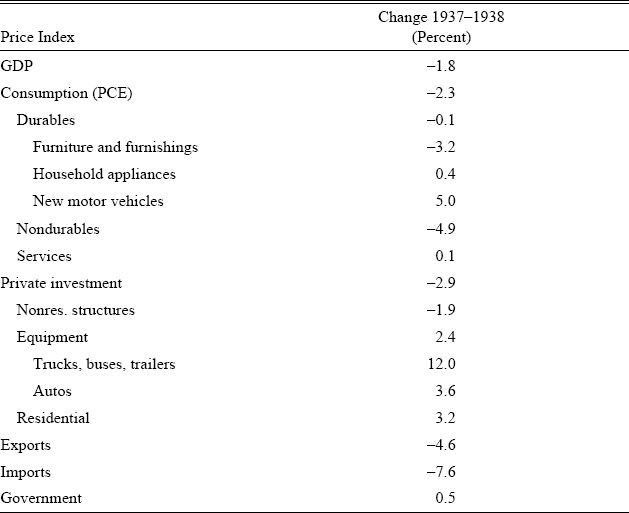
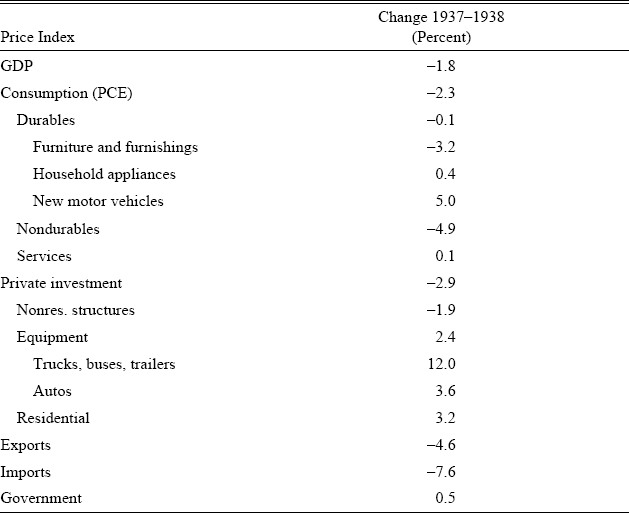
Table 6 shows the percent change from 1937 to 1938 in the price indexes for the major components of GDP. Measured by the GDP deflator, prices economy-wide fell 1.8 percent. Measured by the personal consumption expenditures deflator, consumer prices fell 2.3 percent. Prices for most sub-categories of output also fell. A notable exception was the price of autos. Prices of autos purchased by consumers rose 5.0 percent; prices of autos purchased by businesses increased 3.6 percent. Truck and bus prices rose 12 percent.
PRICES 1937–1938
Sources:
NIPA Tables 1.1.4, 2.4.4, and 5.5.4.
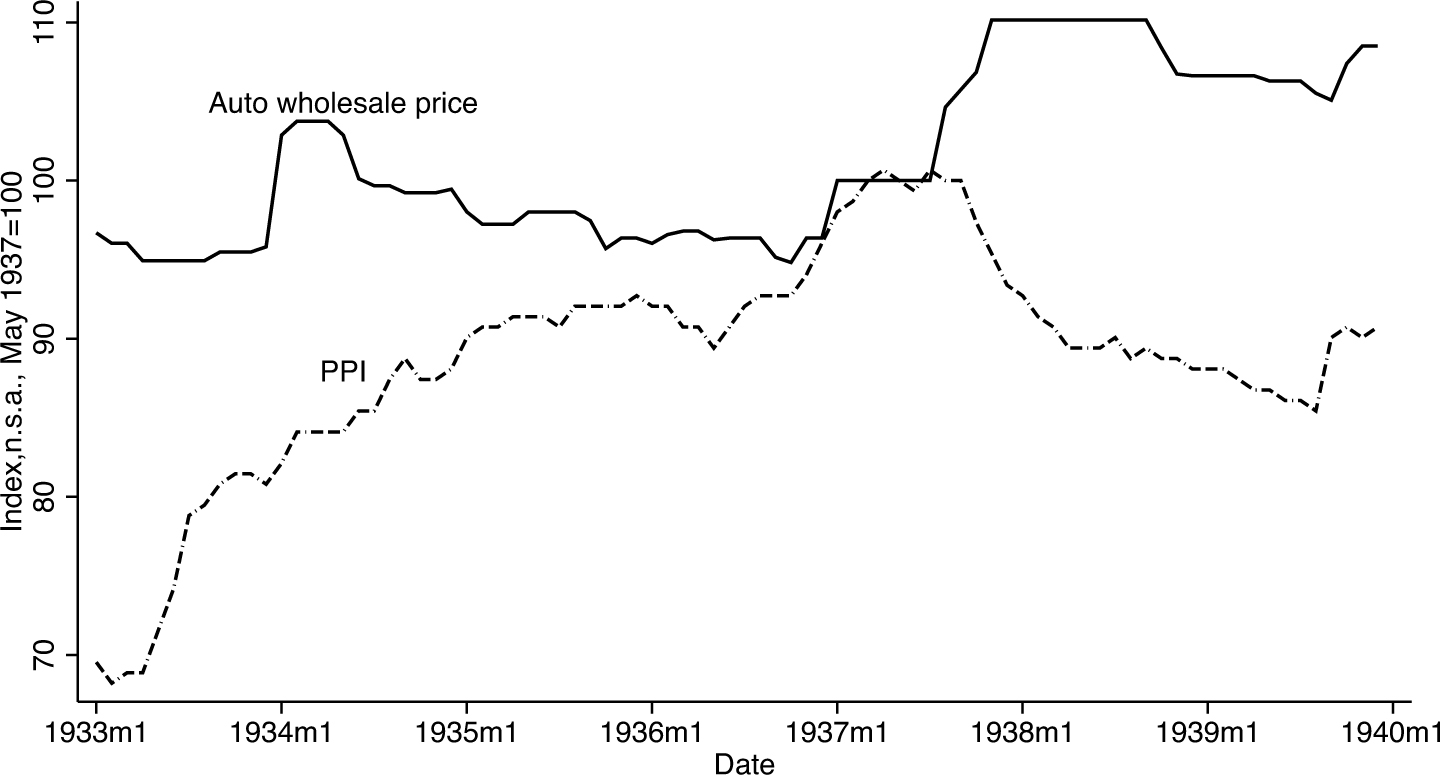
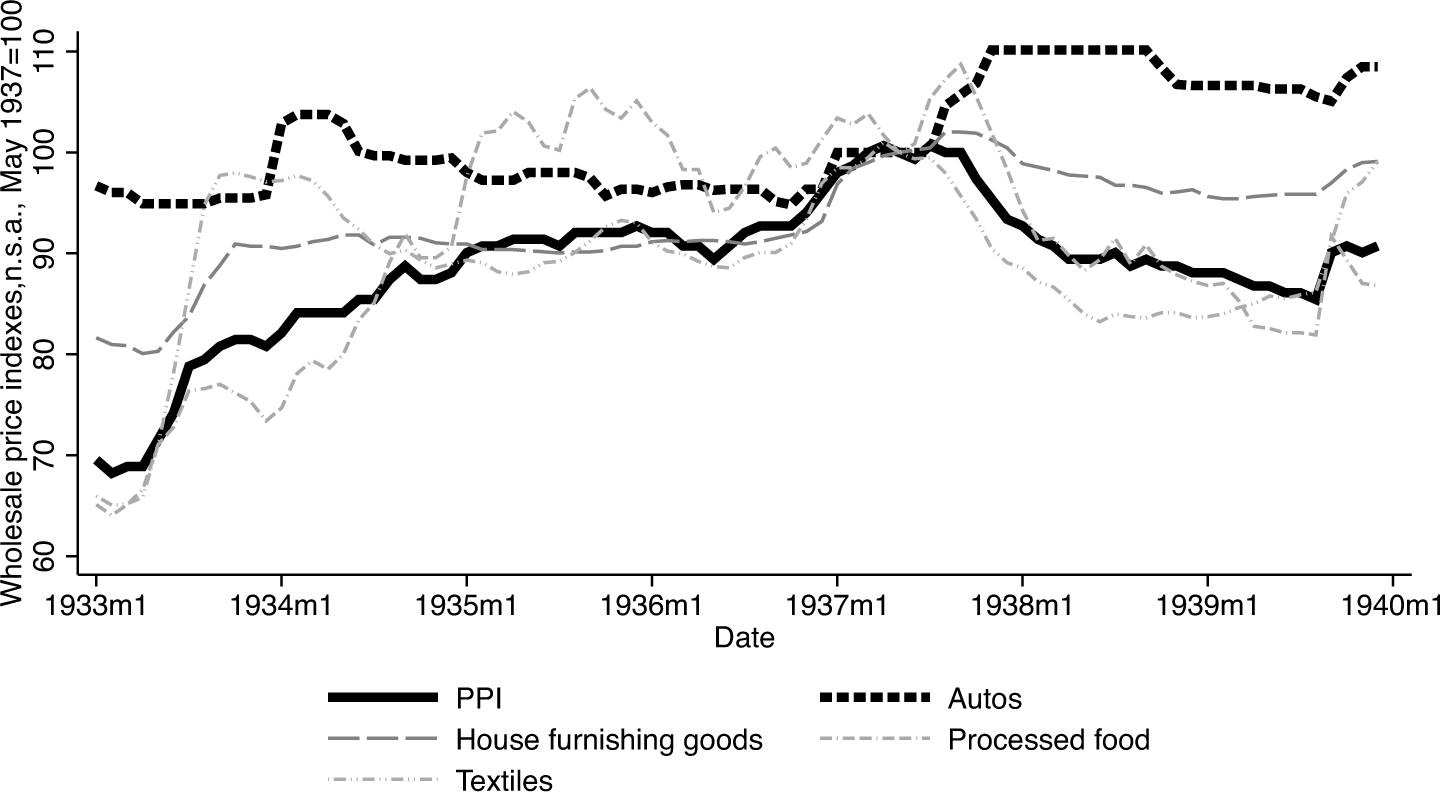
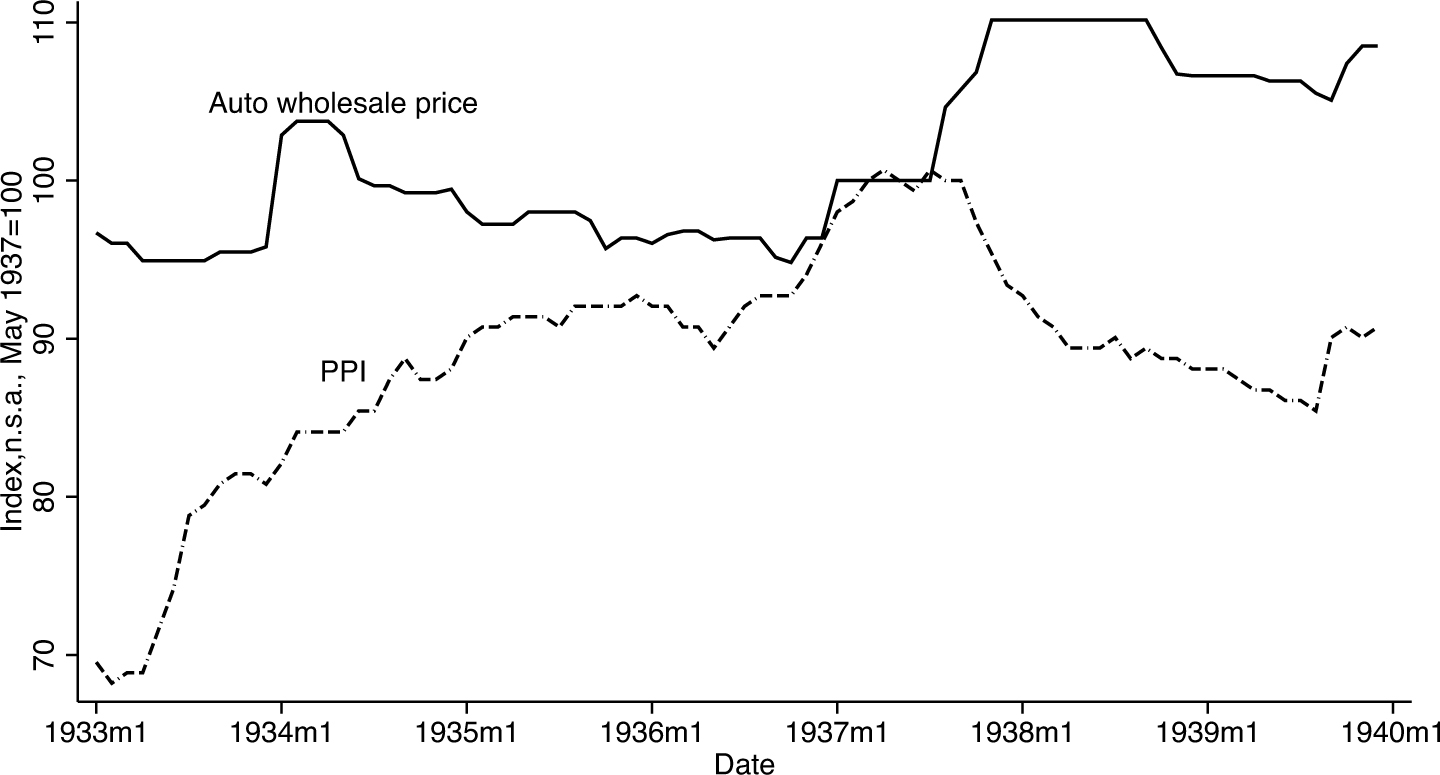
Other measures of auto prices confirm a large price spike with the introduction of 1938 model year cars in fall 1937. According to the BLS wholesale auto price index, nominal auto prices rose by more than 14 percent from December 1936 to December 1937.Footnote 32 Since most prices were falling, this meant that the real price of autos rose by even more. This price increase is more extraordinary when compared to the behavior of auto prices during the economy's recovery from 1933 to 1937. Figure 6 shows the path of auto wholesale prices and the PPI. Until fall 1937, nominal auto prices were essentially flat while economy-wide prices rose steadily. Thus the real price of autos trended down. In fall 1937, this trend was abruptly reversed. We shall see that the upward jump of car prices reflected the conjunction of cost shocks and particular pricing-setting conventions in the auto industry.
AUTO WHOLESALE PRICE
One might worry that this price increase reflects a change in the type of automobiles being sold, in other words, an increase in the quality of the product. But a wealth of data suggest that this was not the case. Adjusted for the weight of cars purchased, nominal prices rose by 9.0 percent from 1937 to 1938; prices per horsepower rose 8.1 percent (Ward's Reports 1938). Daniel Raff and Manuel Trajtenberg (1996) use hedonic regressions to compute a more sophisticated bi-annual quality-adjusted price index for new cars. They find that real quality adjusted prices fell continuously from 1922 to 1936, but then rose 16 percent from 1936 to 1938. In 1938, even prices for unchanged models rose. For example, Chevrolets were essentially identical in the 1937 and 1938 model years. The two model years had identical engine displacement, horsepower, and wheelbase.Footnote 33 Yet the price of a Chevrolet Master De Luxe Two Door Town Sedan, the most popular model, rose from $690 in the 1937 model year to $750 in the 1938 model year.Footnote 34
The prices I observe are “Delivered in Detroit” prices. These were the manufacturer recommended prices including basic accessories and federal taxes. Consumers could expect to pay different amounts depending on their state taxes and on transportation charges (General Motors 1937, pp. 19–20). A possible concern is that these prices do not accurately reflect the actual transaction prices that consumers paid. The main margin through which transaction prices could differ was through varying allowances for used car trade-ins (Federal Trade Commission 1939). This concern is mitigated by two facts. First, the Delivered in Detroit prices match those published in advertisements, suggesting that they were strongly correlated with the actual transaction prices a consumer could expect to pay. Second, industry observers were unanimous in stating that car prices paid by consumers rose for the 1938 model year (Automotive Industries, fall 1937 issues).
Why Did Auto Prices Rise?
Auto prices rose because manufacturer's costs rose. Those in control of the auto industry took as given that they ought to respond to higher costs by raising prices. For example, Alfred Sloan, the Chief Executive Officer of General Motors, said in July 1937 (Automotive Industries, 7/31/37, p. 142): “Naturally, this trend toward rapidly increasing costs must, of necessity reflect itself in the form of a substantial increase in selling prices, with due regard for the effect of volume.” In explaining a planned price increase, a vice-president at Hudson Motor Company said (Automotive Industries, 8/14/37, p. 206): “Practically every product entering into the manufacture of our cars, including wages, has risen substantially in price. Naturally, this affects the price of our own product.” The increase in costs referred to by these executives had two components: a strike/unionization induced wage increase and a raw material price increase.
Unionization
Unionization in the auto industry occurred in the context of rapid unionization in many sectors of the economy.Footnote 35 The percent of nonagricultural employees organized in unions rose from 13.1 percent in 1935 to 24.5 percent in 1940. Much of this increase was the result of successful efforts by the Congress of Industrial Organizations (the CIO) to organize heavy industry. Given the large number of unemployed workers, the CIO's success may be surprising. Auto manufacturers could not have found it difficult to hire unskilled workers. Despite this, two factors made the automobile industry ripe for unionization.
First, worker discontent was widespread (Fine Reference Fine1969). One important reason was the seasonal aspect of employment, in which workers lost their jobs during the model year changeover with no guarantee that they would be rehired. Second, the dependence of manufacturers on certain key parts-producing plants made it easy for a strike at one plant to cripple an entire firm. This second factor had long contributed to high wages in the auto industry. Fear of labor unrest at key plants was sufficient to cause management to share rents with workers (Raff Reference Raff1988, Reference Raff1991). For instance, Raff (Reference Raff1988) shows that Ford adopted the five-dollar day in 1914 in part to forestall the potential threat of a sit-down strike.
The United Automobile Workers (the UAW), a largely independent affiliate of the CIO, began its organizing drive in November 1936. A key aspect of their strategy was the sit-down strike, in which workers occupied factories, preventing any production from occurring. The most important sit-down strike began on 28 and 29 December 1936 at Fisher body plants in Cleveland and Flint.Footnote 36 Fisher body was a division of General Motors, and these plants were crucial links in the corporation's supply chain. Halting production at these two plants was sufficient to disrupt three-quarters of General Motor's total production. Strikes spread to other plants and by early February, weekly car production at General Motors had declined to 1,500 units from 53,000 units in mid-December.
With the active intervention of Frank Murphy, Michigan's democratic governor,Footnote 37 and pressure from President Roosevelt, these strikes led to an agreement between the UAW and General Motors on 11 February 1937. General Motors agreed to recognize the UAW as a bargaining agent for its members. The agreement itself secured no wage increases, but perhaps in an effort to forestall the UAW, General Motors unilaterally increased wages in November 1936. And it raised wages again in February 1937, just before negotiations with the UAW were concluded (Fine Reference Fine1969). After organizing General Motors, the UAW organized sit-down strikes at Chrysler and reached a collective bargaining agreement on 6 April. Despite UAW efforts, however, Ford was not successfully organized until 1941. This reflected extreme ideological opposition to unions by Henry Ford and Ford's willingness to use physical force to keep unions out.
The UAW's efforts to organize the industry led to industry-wide wage increases. Between October 1936 and July 1937, average hourly earnings rose 22 percent from 79 cents to 96 cents (Sayre 1940, Table 5A). The gap between auto industry wages and wages in manufacturing as a whole widened (Sayre Reference Sayre1940). Even at non-unionized Ford, wages rose. Average hourly earnings at Ford's River Rouge plant rose from 81 cents in 1936 to 88 cents in 1937.Footnote 38 Unionization increased labor costs both by raising wages and by forcing manufacturers to run plants overtime to make up for strike-related production shortfalls. This continued beyond early spring 1937, since even after the UAW negotiated collective bargaining agreements, sporadic wildcat strike activity persisted (Fine Reference Fine1969; Automotive Industries, 31 July 1937).
Raw Material Price Increases
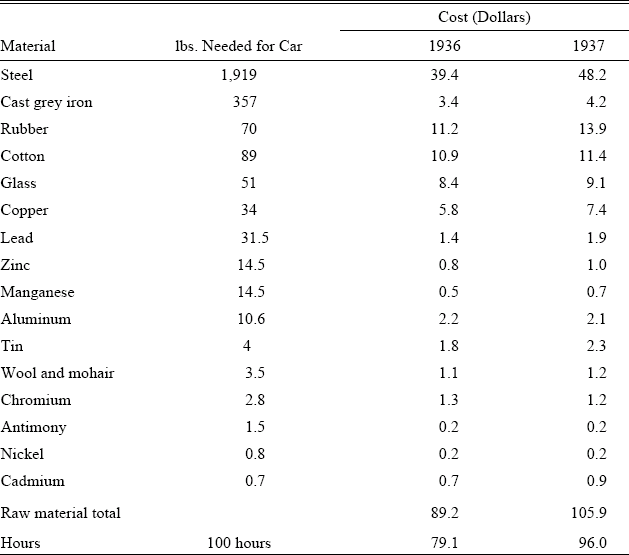
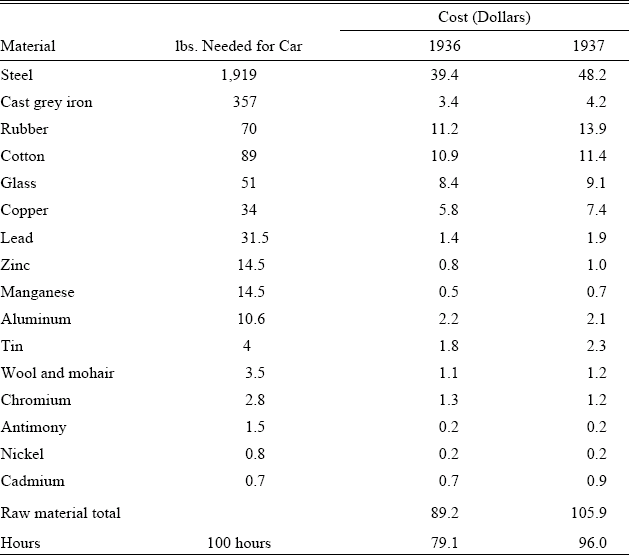
Automobile production consumes large quantities of raw materials. The first column of Table 7 shows the pounds of commodities necessary to produce a typical “small car” (Ward's Reports 1938). It took 1,919 pounds of steel, 357 pounds of cast iron, 89 pounds of cotton, 70 pounds of rubber, 51 pounds of glass and smaller quantities of copper, lead, zinc, manganese, aluminum, tin, wool and mohair, chromium, antimony, nickel, and cadmium.
RAW MATERIALS AND HOURS TO PRODUCE A SMALL CAR
Notes:
Prices used are the May to July average in each year, except as noted below. Wages are the October 1936 and July 1937 values.
Sources:
Raw materials required for small car: Ward's Reports (1938); Steel-NBER macrohistory series m04155; Iron-NBER macrohistory series m04010c; Rubber-NBER macrohistory series m04077b; Cotton-NBER macrohistory series m04006a; Glass-NBER macrohistory series m04131; Copper-NBER macrohistory series m04153; Lead-NBER macrohistory series m04017; Zinc-NBER macrohistory series m04092b; Manganese-Commodity Yearbook (1940), p. 395; Aluminum-Commodity Yearbook (1940), p. 46; Tin-Commodity Yearbook (1940), p. 615; Wool-NBER macrohistory series m04087b; Chromium-U.S. Geological Survey, Chromium Statistics (prices are annual averages); Antimony-Minerals Yearbook (1939), p. 724; Nickel-Minerals Yearbook (1939), p. 605 (annual average); Cadmium-Minerals Yearbook (1939), p. 730 (annual average); Wages: Sayre (Reference Sayre1940).
The prices of many of these commodities rose rapidly in late 1936 and spring 1937. The second two columns of Table 7 compare the cost of purchasing the amount of each commodity necessary for a car at early summer 1936 and early summer 1937 prices. Over this period, the price of the entire package of commodities needed to produce a small car rose almost 20 percent, from $89 to $106. (This can be compared to a typical small car price in the 1937 model year of roughly $575.Footnote 39 ) At least part of these price increases is explained by actual and expected rearmament demand in Europe. The League of Nations (Economic Intelligence Service 1938, p. 77) wrote:
From the autumn of 1936 until the spring of 1937, there was a period of rapidly rising prices for primary products. The recovery of industrial production and intensification of rearmament expenditure in many countries had increased the demand for raw materials, until the point was reached at which real shortages of such materials were anticipated in spite of the relaxation of many restriction schemes controlling their production and export. At this point, in view of the fear of future shortages, a speculative demand for commodities developed and was superimposed upon the high normal demand.
A natural question is how large the raw material price shock was relative to the unionization induced wage increase. This is difficult to answer precisely, given a lack of definite information about the labor needed to produce a small car. But one can make a rough guess. In 1937, wage earners in the motor vehicle industry worked 895 million hours to produce 4.8 million vehicles, or 186 hours per vehicle.Footnote 40 This is certainly an upper bound for the average number of hours worked to produce a small car, since these figures include truck production. In Table 7, I assume it took an average of 100 hours of wage earner labor to produce a small car.
In this hypothetical example, the effects of the increase in wages and the increase in raw material prices are almost identical. But this exercise may understate the importance of the wage relative to the raw material price increase. The nominal wage increase was persistent, even as auto production and employment plummeted in late 1937 and early 1938 (Sayre Reference Sayre1940), but the raw material price increases were at least partially reversed as the U.S. fell deeper into recession. By July 1938, for instance, the price of the 1919 pounds of steel needed to produce a small car had fallen to $46 from $48, and the price of the 70 pounds of rubber needed had fallen to $9 from $13. Insofar as these price movements were not entirely a surprise, they suggest that wages may have played a more important role than raw materials in manufacturers' pricing decisions.
The Timing of the Auto Price Increase
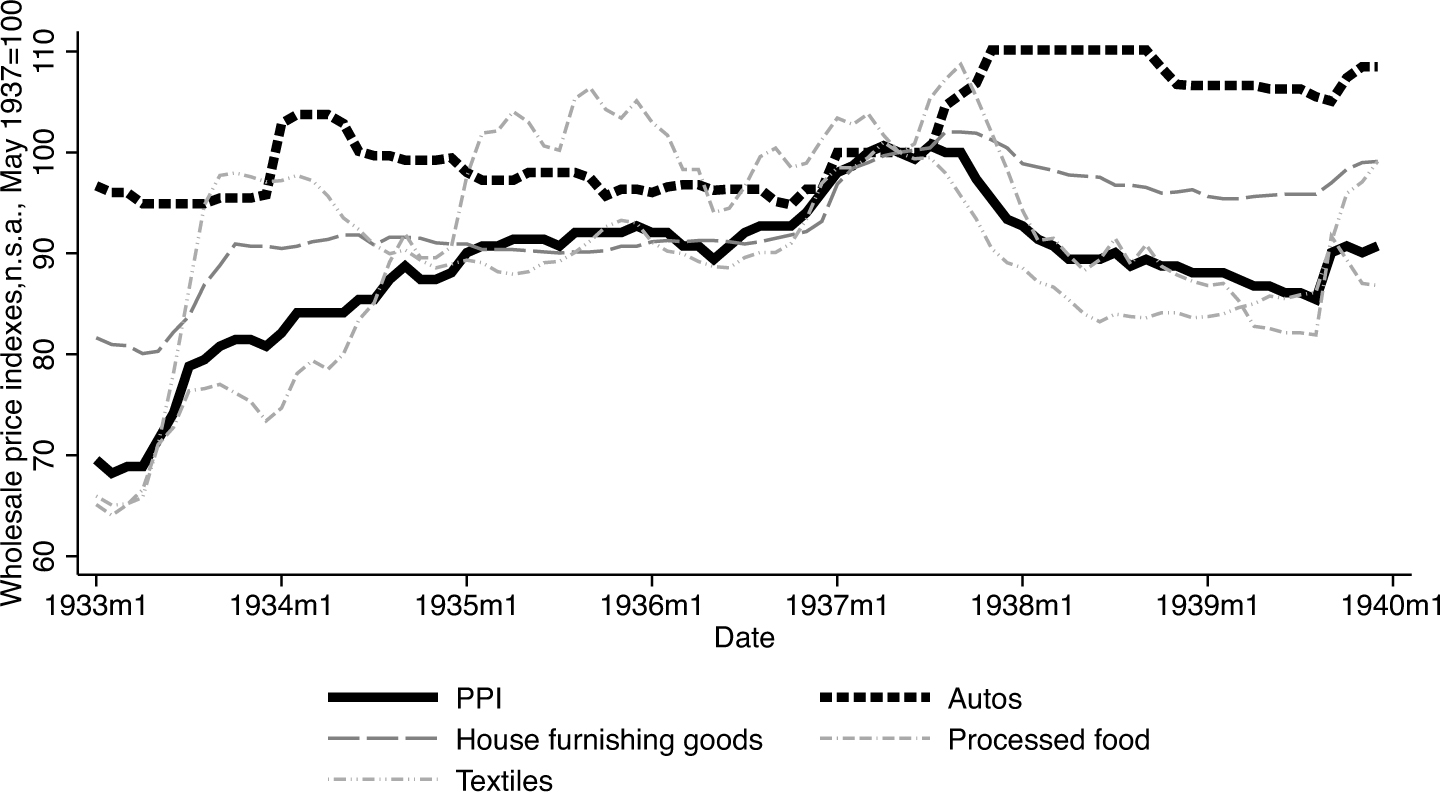
Manufacturers' labor and raw material costs rose in spring 1937. But auto prices were little changed until the introduction of new model year vehicles in fall. The BLS wholesale auto price index was literally unchanged from January to August 1937 (Figure 6). This nominal rigidity distinguished the auto industry: in many other industries, costs rose in late 1936 and early 1937. In these other industries, prices tended to rise at the same time as costs rather than with a several month lag. Figure 7 shows the behavior of auto wholesale prices along with those for processed food, home furnishing goods, and textiles. All prices rose in late 1936 and/or early 1937. Auto prices were unique in rising further in fall 1937 and remaining high during the recession.
WHOLESALE PRICES
The nominal rigidity of auto prices may in part be explained by the industry's concentration. In 1937, the big three (General Motors, Chrysler, and Ford) accounted for 85 percent of all passenger car and truck sales (Federal Trade Commission 1939, p. 27).Footnote 41 Unsurprisingly, the big three coordinated their price setting (Federal Trade Commission 1939),Footnote 42 a process that was likely eased by the setting of prices only once a year. Evidence that the auto manufacturers attempted to prevent frequent price changes comes from the minutes of a 1932 meeting of auto industry sales managers. The minutes state: “The committee agreed that the members of the National Automobile Chamber of Commerce would not change prices on any car models from the day preceding the New York show until the closing date of the Chicago show” (qtd. in Federal Trade Commission 1939, p. 34).
Importantly, in the summer and early fall of 1937 contemporaries recognized that auto manufacturers' costs had risen and that this would lead to higher car prices in future months. For example, in an article published on 31 July 1937, the industry trade publication, Automotive Industries, reported (p. 135):
General Motors Corp. divisions had only ten days uninterrupted work from Feb. 11, the date an agreement was signed with the United Automobile Workers, through the June quarter, stated Alfred P. Sloan, Jr., chairman of the board, bitterly assailing the union for its inability to prevent wildcat strikes. He blamed the union for a decline in earnings during the second quarter compared with the like quarter of 1936. He said the company was unable to meet the demand for its cars because of interference with production. Demand [sic] currently is equal to the company's ability to supply. Indirectly, labor troubles had another effect upon earnings, Mr. Sloan pointed out. Net income declined in relation to unit and dollar sales volume as a result of two general wage increases, numerous adjustments, and the need for using high-cost night shift operations in an effort to make up production deficiencies. Earnings were also affected by higher materials costs. High car prices for 1938 will result, he forecasts.
Ford and General Motors, but not Chrysler, did raise prices some in August 1937, before new model year vehicles were introduced (Automotive Industries, 7 August 1937, 14 August 1937, and 16 October 1937), but this price increase was seen as insufficient to cover the increase in costs that had occurred (Automotive Industries, 18 September 1937, p. 374). Hence further price increases were expected. The president of Buick told the press on 13 September 1937 (qtd. in Automotive Industries, 18 September, p. 374): “We are not yet ready to disclose our price structure but I can tell you that due to the increased cost of labor and materials the prices will have to be somewhat higher.”
HOW DID THE PRICE SHOCK AFFECT SALES?
Theory
Like an investment good, consumer durables purchases are likely to have a high intertemporal elasticity of substitution (Barsky, House, and Kimball 2007). In particular, expected future price increases will significantly increase current durables purchases as sales are pulled forward.Footnote 43 The bulge in sales will be followed by a large drop in sales after the price increase occurs. Thus the elasticity of demand with respect to a price change that is expected will be much larger than the (static) elasticity of demand with respect to price. I shall argue that this phenomenon is the key to understanding how the price increase for 1938 model cars had significant macroeconomic effects.
Narrative Evidence
As previously discussed, during the summer and early fall of 1937 price increases were widely expected within the auto industry. Contemporary industry observers reported that consumers also expected prices to increase, and that this drove up sales prior to the introduction of new model year vehicles in October and November. For example, an article on the front page of the 24 July 1937 issue of Automotive Industries stated (p. 103): “The public has the impression, probably well founded, that 1938 cars will be somewhat higher in price and not much different from the present models. This is leading to current buying in considerable volume.” A confirmation of this view comes from an ad for a Graham Supercharger appearing in the San Francisco Chronicle on 8 August 1937. This ad encourages customers to “buy now … before the price rise,” stating that “With costs rising … car prices almost bound to increase … buy now and save” (ellipsis in original). It suggests that higher prices were expected, and that they motivated purchases.
In 1938, General Motors sponsored a study on the effect of auto prices on demand, which was presented at a joint meeting of the American Statistical Society and the Econometric Society.Footnote 44 The published volume begins with an essay by a General Motors employee S. L. Horner (Reference Horner1939) summarizing the reasons General Motors sponsored the study and providing an overview of the determinants of auto demand. Horner emphasizes the importance of price expectations, particularly in 1937:
During periods of rising costs, such as that which took place in 1937 when labor costs were rising so rapidly, prospective automobile purchasers tend to anticipate an increase in the price of automobiles. This is particularly apt to be the case when the advance in costs continues over a considerable period of time without an increase in automobile prices. Automobile buyers are sufficiently well informed to realize that any such increase in costs must, in time, cause an increase in automobile prices. And, if they do not arrive at this conclusion themselves, they are almost certain to have it impressed upon them by dealers and salesmen within the industry. Thus, during the spring and summer of 1937, dealers and salesmen were urging people to buy their new cars, before prices increased. This tends to cause a bulge in sales which is followed, after prices are increased, by a decline in sales. (p. 14–15)
In other words, Horner implies that sales staff had an incentive to use the upcoming price increase to boost sales in summer 1937. Horner attributes low sales in 1938 to the fact that “many people, anticipating that an increase in automobile prices would be made when the 1938 models were announced, purchased cars in the 1937 model year which they otherwise would have purchased in 1938” (p. 14).
Quantitative Evidence
The hypothesis that price expectations boosted sales in summer and early fall 1937 and depressed sales in 1938 has a testable implication. If the hypothesis is true, then a statistical model of auto sales that incorporates determinants of auto demand other than auto prices and price expectations should underpredict sales in the summer of 1937 and overpredict sales in 1938. In this subsection, I construct such a model and use it to quantify the effect of the auto price shock.
In addition to autoregressive lags and seasonal dummies, there exist an almost limitless number of possible variables that might have predictive power for auto sales. I proceed by considering only variables that measure the stance of monetary and fiscal policy and/or were deemed important by contemporary and current forecasters of auto sales.
Horner (Reference Horner1939) provides a useful guide to how contemporaries thought about the determinants of auto sales. He argues that the following equation fits annual sales well:

As a guide to how modern economists forecast sales, I consider the reduced form forecasting equation for light vehicle sales in the Michigan model of the U.S. economy (Hymans et al. Reference Hymans, Crary and Howrey2002, equation C33). This equation includes two proxies for the state of the macroeconomy: a distributed lag of real personal disposable income and the change in the unemployment rate.
I now describe each variable I use and the reason for its inclusion. In Appendix 1, I discuss how I use information criteria to select the number of lags to use for each variable.
Seasonal Effects
In the interwar period, auto sales exhibited a strong seasonal pattern, with winter sales far below summer sales. Seasonal patterns were partly driven by the weather: muddy roads made driving unpleasant or infeasible in much of the country during the winter and spring. But a large driver of seasonal patterns was also the introduction of new model vehicles. Until 1935, new model vehicles were introduced in January of each year. Thereafter, in a change coordinated through the National Industrial Recovery Act, new models were introduced in October or November (Cooper and Haltiwanger Reference Cooper and Haltiwanger1993). To account for the resulting change in seasonal patterns, I include both a full set of monthly dummies and a set of monthly dummies interacted with a dummy variable equal to one in 1935 and after.
Real Personal Disposable Income
Both Horner (Reference Horner1939) and the Michigan model include a measure of national income. Horner (Reference Horner1939) uses Gross National Product (GNP), and the Michigan model uses real personal disposable income. For my purposes, disposable income has the attractive feature that it reflects both the evolution of wages and profits in the private sector and changes in taxes and transfers. Thus it proxies for the state of the economy and fiscal policy actions. Unfortunately, there is no monthly series for disposable income in the interwar period. But Harold Barger constructed a seasonally adjusted quarterly measure of nominal personal disposable income.Footnote 45 I deflate this by the consumer price index (CPI) and convert it to a monthly series with linear interpolation.
Note that since auto sales cause income as well as vice versa, including real disposable income in the forecasting model will bias the results against finding a large effect of the exogenous auto shock. For example, if sales were unusually low in 1938, this would have lowered real disposable income, leading my forecast to underestimate the level of sales that would have occurred absent the shock. Since I will measure the impact of the shock as the difference between forecast and actual sales, this will have the effect of reducing the size of the measured shock.
The Money Supply
Neither Horner (Reference Horner1939) nor the Michigan model includes a measure of the money supply or interest rates. However, since I wish to know what part of the decline in auto sales cannot be accounted for by macro policy, I need a measure of monetary policy in the forecasting equation. Theory suggests that interest rates rather than the quantity of money ought to be most directly linked to sales. The proportion of cars sold on credit exceeded 50 percent in every year from 1919–1939 (Olney Reference Olney1999, Table II), providing an obvious channel through which interest rates could affect sales. Since interest rates changed little in 1937/38 (Figure 1(b)), however, they will be unable to forecast the decline in auto sales between 1937 and 1938. To make sure I do not understate the possible impact of monetary policy on sales, I instead include the quantity of money, specifically the seasonally adjusted broad money stock (currency held by the public plus demand and time deposits of commercial banks).Footnote 46
Recession Dummy
The Michigan model includes the unemployment rate. Unfortunately, this is unavailable at a monthly or quarterly frequency before 1929. As an indicator of general business cycle conditions, I instead incorporate a dummy variable equal to one in a month between an NBER business cycle peak and trough (inclusive of the peak and trough month).
Results
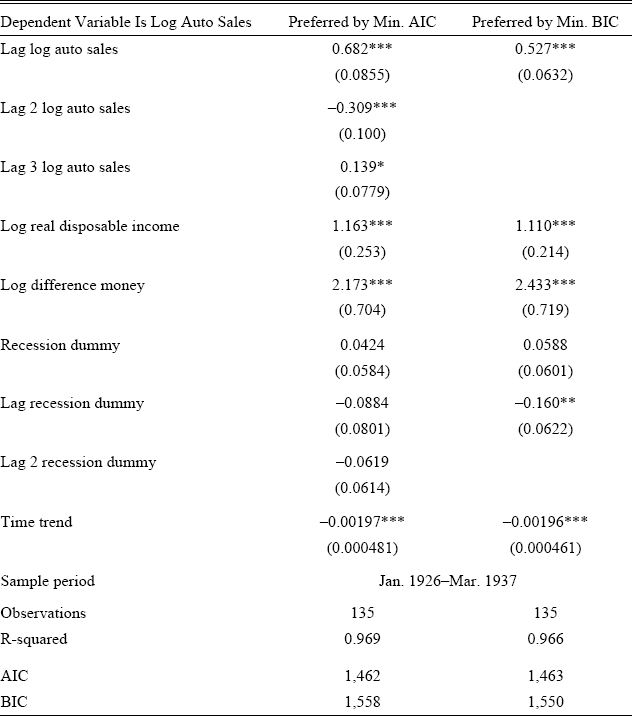
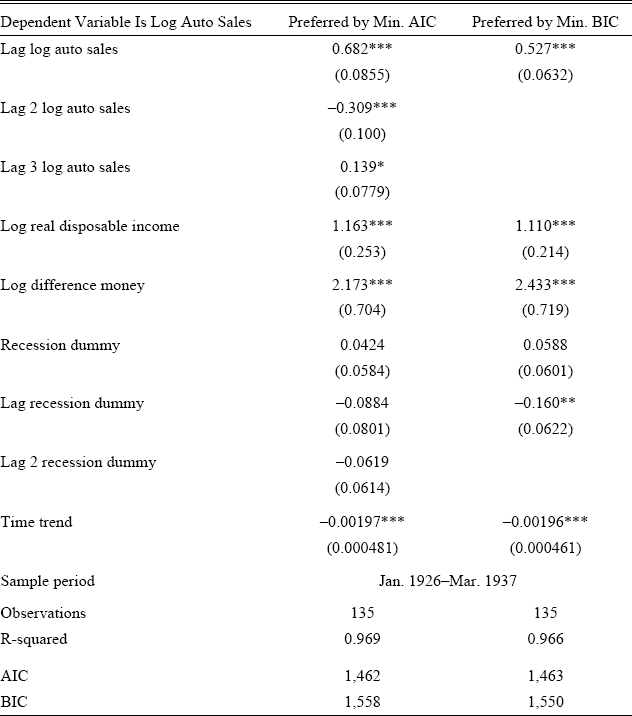
Monthly auto sales data begin in 1925.Footnote 47 To allow for up to 12 possible lags, I estimate each model over the period January 1926–March 1937. I choose March 1937 as the end date, since it is the month between the unionization of General Motors (in February) and Chrysler (in April) and is thus likely to have been the earliest consumers would have started to expect price increases for the next model year. Appendix Table 2 shows the estimation results for the optimal specifications chosen by the Akaike information criterion (AIC) and the Bayesian information criterion (BIC). Both specifications are parsimonious and have excellent in-sample fit. The coefficients themselves are of little interest, since the goal of this exercise is forecasting, not inference.
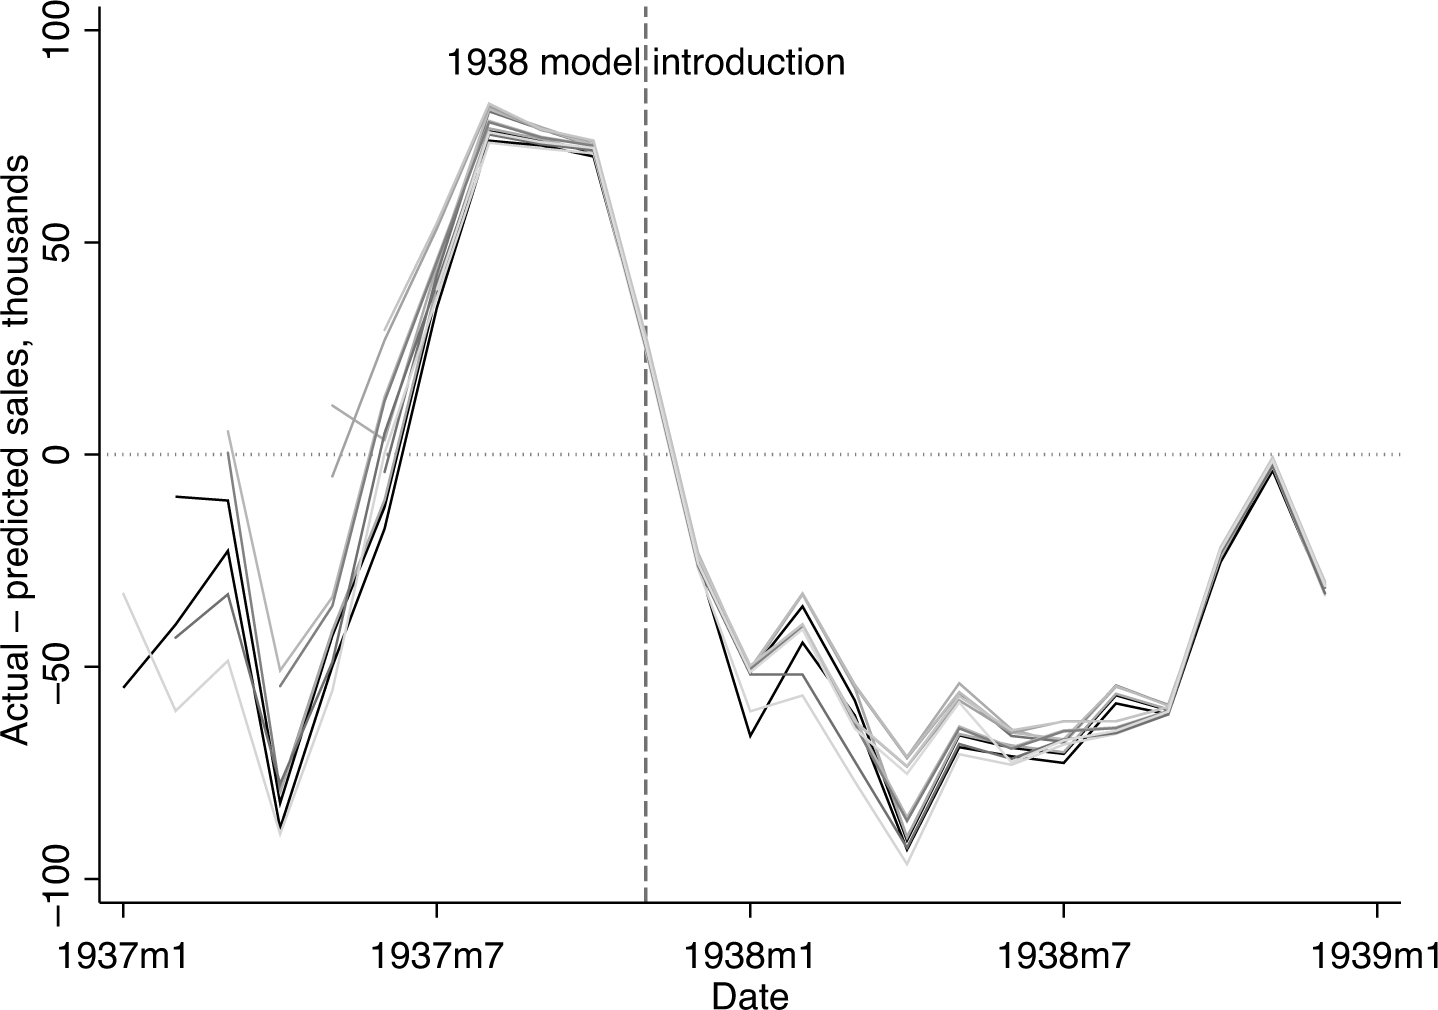
Figure 8 shows the difference between actual and predicted auto sales in 1937 and 1938. Since the forecast is somewhat sensitive to the start date, I graph the difference between the AIC and BIC forecasts and actual auto sales for all forecast start dates from January 1937 to July 1937.Footnote 48 The models perform poorly and disagree significantly in the spring of 1937. In this period actual sales are less than forecast sales, perhaps reflecting the effects of strikes in the auto and other industries.Footnote 49 But beginning in mid-summer 1937, there is remarkable agreement among the forecast models. All predict sales below actual from July to November 1937, and all predict sales above actual from December 1937 to December 1938. One might worry that the bulge in summer 1937 is not evidence of sales being shifted forward, but rather of sales making up for the shortfall earlier in the spring. But the bulge is larger than the earlier shortfall. Using the forecast median, the cumulative difference between actual and predicted sales from January to May 1937 is −223,000, whereas that from June through November is 294,000.
ACTUAL MINUS PREDICTED AUTO SALES
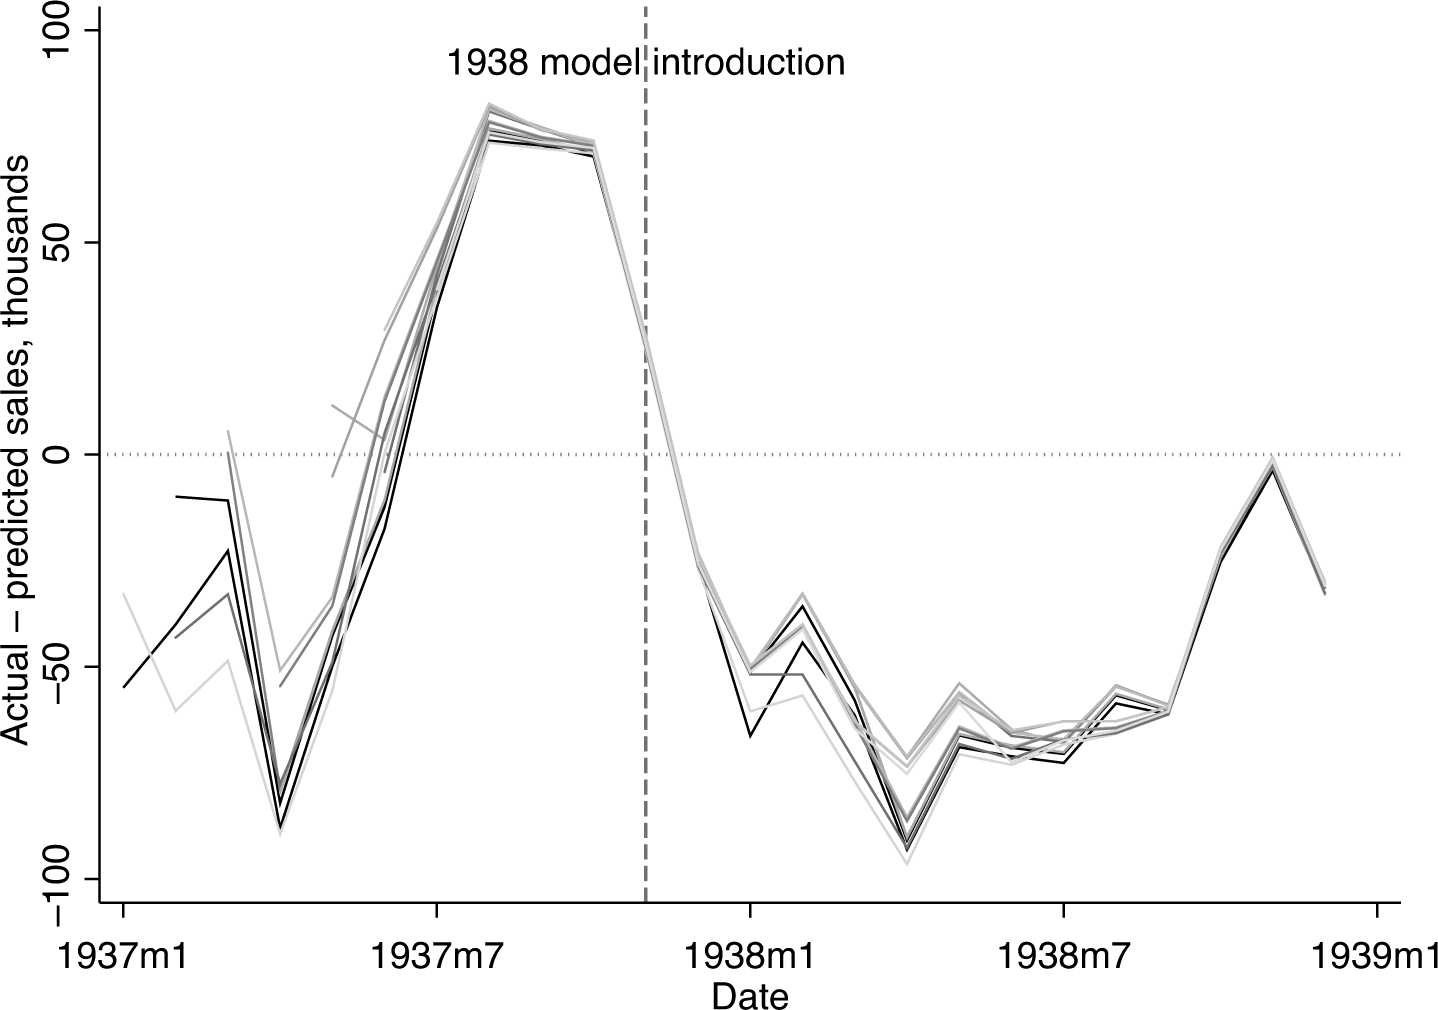
Qualitatively the forecast exercise fits remarkably well with the narrative evidence and theoretical consumption response. In summer and early fall 1937, before the price increase occurs, sales are higher than they otherwise would have been; after the price increase, sales are far lower than they would have been.Footnote 50
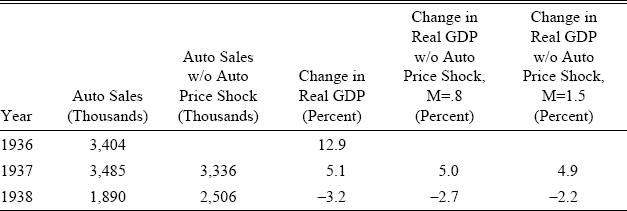
Table 8 shows the quantitative implications of the forecasting exercise for the aggregate economy. Columns 2 and 3 show annual auto sales and forecast auto sales in 1936, 1937, and 1938.Footnote 51 If not for the price shock, unit sales would have fallen by “only” 25 percent between 1937 and 1938; instead, they fell by 46 percent. Column 4 shows the actual percent change in real GDP. Columns 5 and 6 show counterfactual estimates of GDP growth without the auto price shock. I compute the counterfactual GDP level as

where Xcf is the counterfactual estimate of X, P is the average retail price of a passenger vehicle, and M is the multiplier for automobile spending. For P, I use the estimate in Daniel Suits (Reference Suits1958, p. 279) for the average retail value of cars sold in 1937, $808. For the value of the multiplier, I use 0.8 in column 5 and 1.5 in column 6. In her survey of the literature, this is the likely range for the government spending multiplier found by Valerie Ramey (Reference Ramey2011).Footnote 52 Columns 5 and 6 show that expectations of price increases boosted sales and thus GDP growth in 1937 but made the recession in 1938 much more severe. The auto price shock explains as much as a third of the 1938 GDP decline.
AGGREGATE IMPLICATIONS

Sources:
Real GDP is from NIPA Table 1.1.6A. Auto sales data are from NBER macrohistory series m01109 (see text). Other columns: author's calculations.
CAN THE AUTO PRICE SHOCK EXPLAIN THE RECESSION’S ANOMALIES?
Timing
In the interwar period, auto production and sales were highly correlated (Cooper and Haltiwanger Reference Cooper and Haltiwanger1993). Auto manufacturers appear to have emphasized a target inventory level rather than production smoothing (Kashyap and Wilcox Reference Kashyap and David W.1993). Thus as sales collapsed in fall 1937, so did production. From January 1937 to January 1938, auto sales fell 48 percent while auto production fell 50 percent.Footnote 53 To what extent does this decline explain the rapid decline in industrial production as a whole?
Automobile production had a 4.79 percent weight in the Federal Reserve industrial production index (Federal Reserve Board 1940). Hence even very large swings in auto production can account only for modest swings in industrial production as a whole. The key to the quantitative importance of auto production for movements in the industrial production index is the large input-output linkages between auto production and other manufacturing sectors. Fortunately, while working for the BLS, Wassily Leontief constructed a 38×38 input-output table for the 1939 U.S. economy (BLS, undated). Although a smaller version was published in Leontief (Reference Leontief1951), until now the unpublished larger table appears to have been unnoticed and unused by economists.Footnote 54 The larger table is a valuable source of information on the linkages connecting auto production with the rest of the economy.
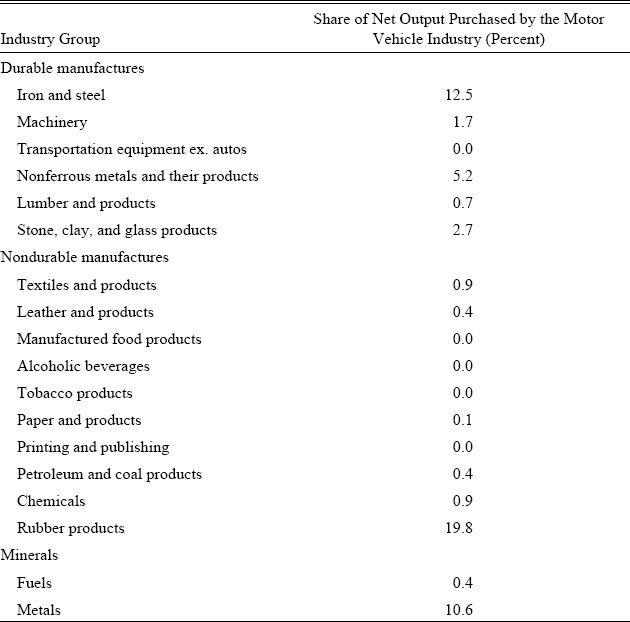
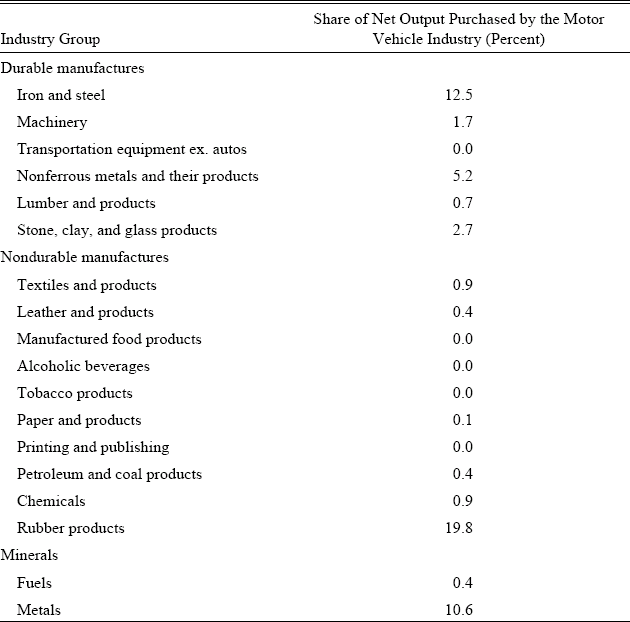
Appendix Table 3 shows the share of net output consumed by the motor vehicle industry for each Federal Reserve industry group. Demand from auto manufacturers was particularly important for steel production. Aside from the construction sector, the auto industry was the largest purchaser of steel products. To get a rough quantitative sense of the importance of the auto industry for the timing of industrial production movements, I construct an industrial production index that excludes autos and the share of other sectors consumed by the auto industry (“purged industrial production”).Footnote 55 Formally,

where wi is the share of industry group i net output purchased by the auto industry, vi is the share of industry group i in total industrial production, and IPi,t is the seasonally adjusted value of the industrial production index for industry group i (indexed to 1935–1939=100). Industrial output weights and indexes are from the Federal Reserve (1940).
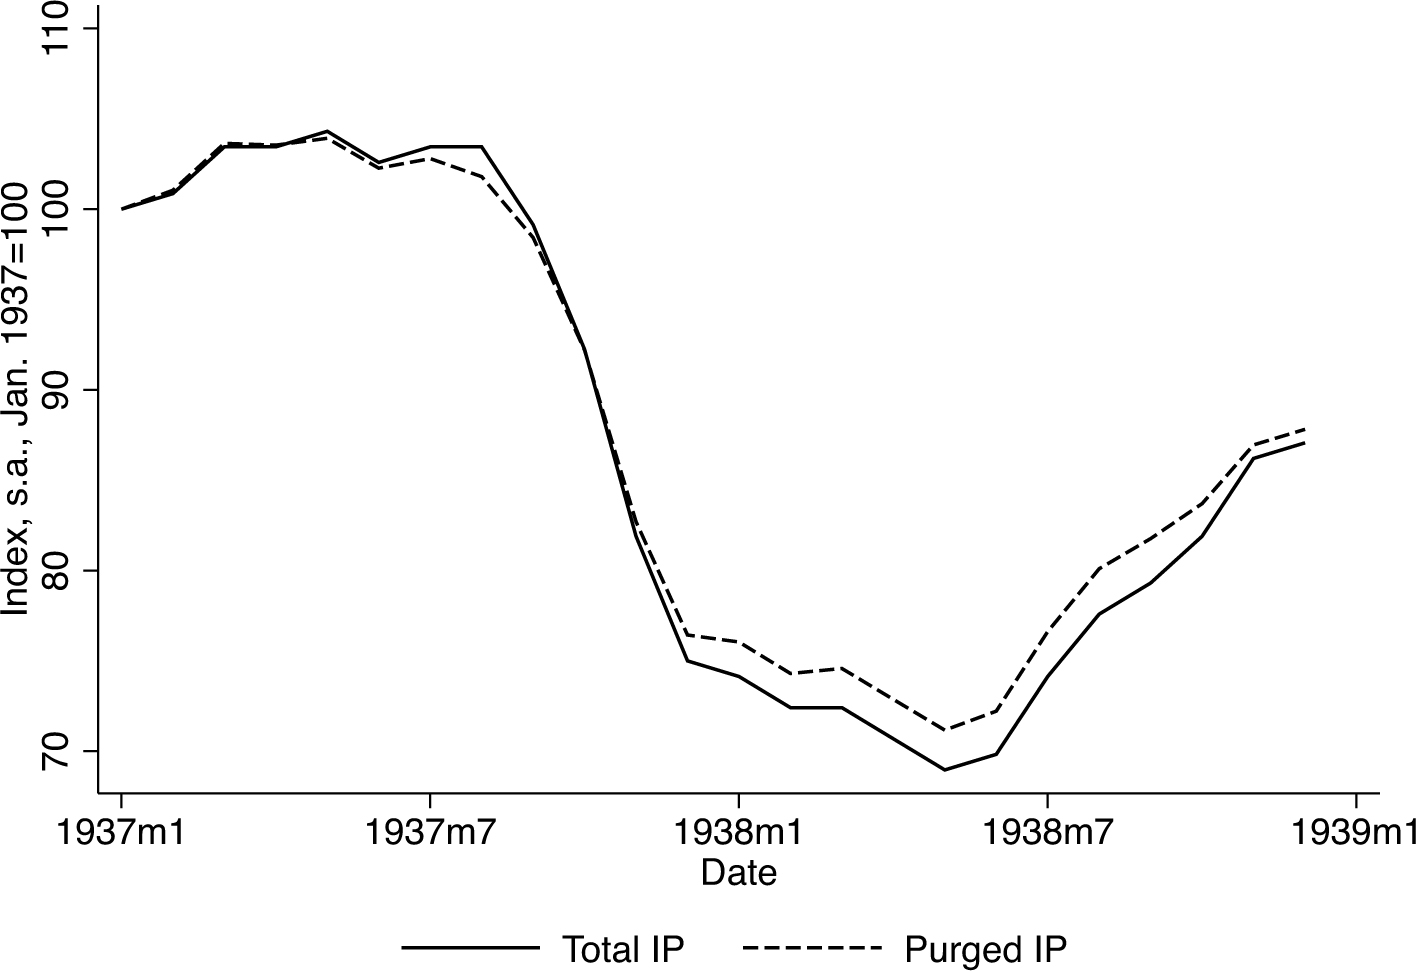
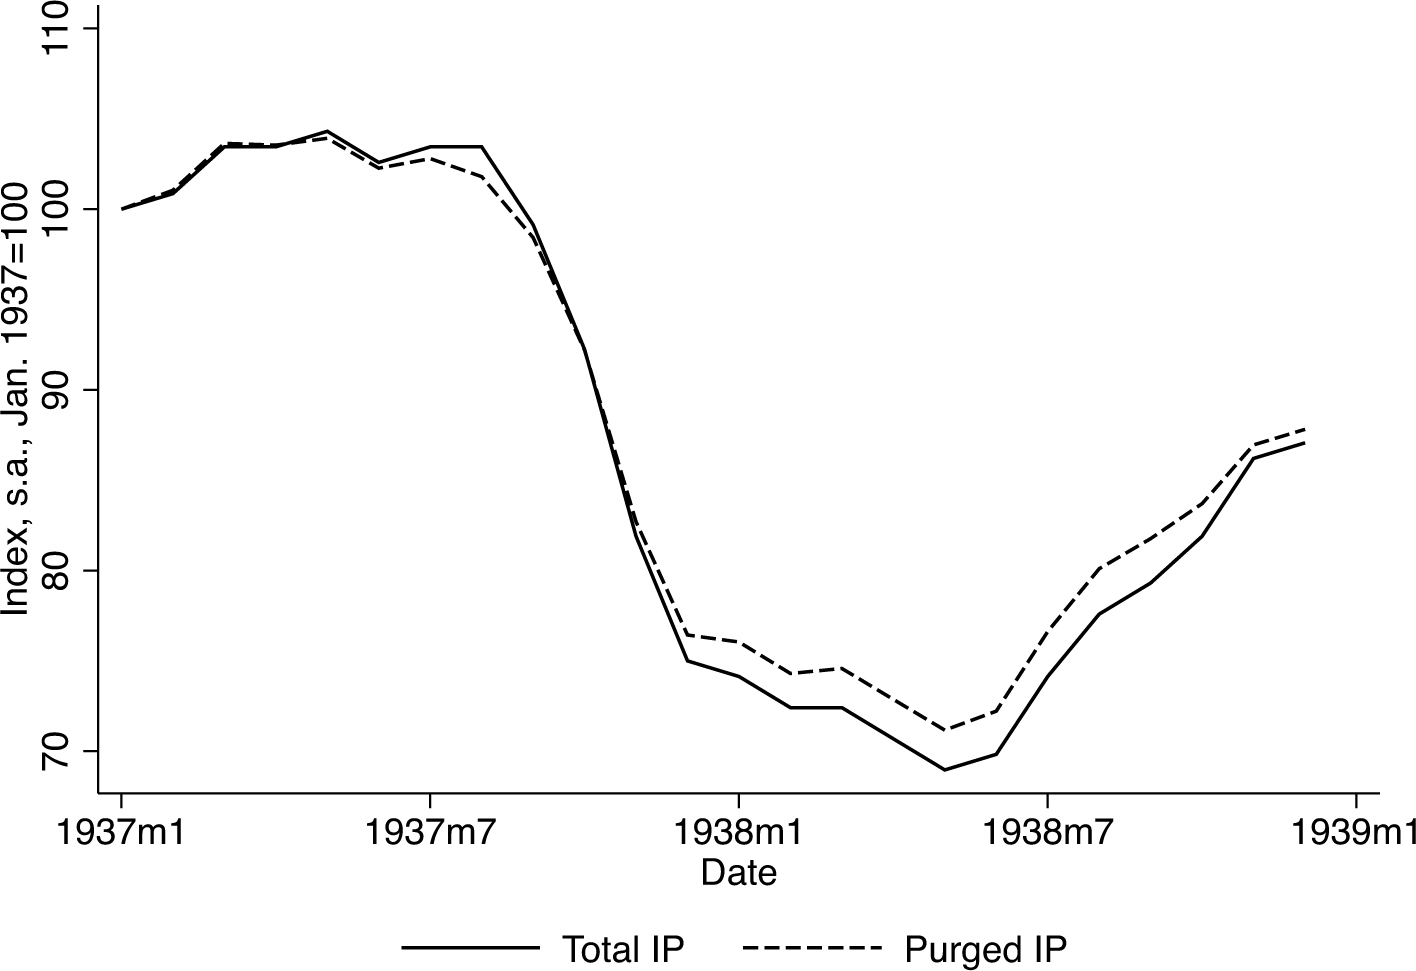
Figure 9 shows the path of total and purged industrial production in 1937 and 1938. In the summer of 1937, when auto sales were brought forward due to expected higher prices, total industrial production (which includes autos) exceeded the purged index. This result confirms the view expressed in the Review of Economics and Statistics summary of the 1937 economy that “During the spring and summer months [of 1937], the maintenance of manufacturing output at the high level attained in 1936 was due almost entirely to sustained activity in the iron and steel and automobile industries” (Crum, Gordon, and Wescot Reference Crum, Gordon and Wescot1938, p. 45). In the late fall, once auto prices rose, total industrial production fell below purged industrial production. This exercise suggests that the auto shock likely contributed to the rapid decline of industrial production in fall 1937 by boosting production in late summer and lowering production in early winter. Quantitatively, however, the impact of autos on industrial production is modest. The overall industrial production index fell 24 percent from September to December while the purged index fell 22 percent.
TOTAL AND PURGED INDUSTRIAL PRODUCTION
Geography
To see how the auto shock may explain variation in state outcomes during the recession, I construct a measure of the share of manufacturing employment in each state in a “synthetic” auto sector (Share).

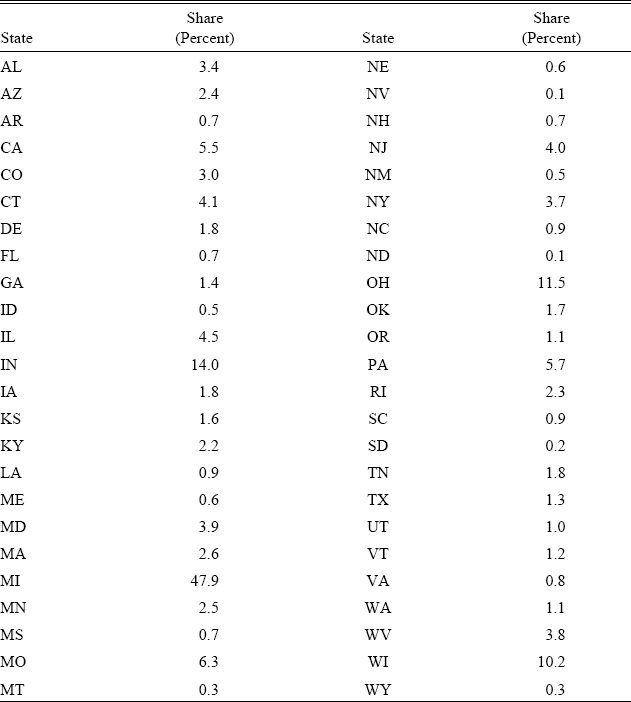
where eauto,j is the share of state j wage earner employment in the motor vehicle industry, wi are the sectoral linkages from Appendix Table 3 (the share of industry i output used in the production of motor vehicles), and ei,j is the share of wage earner employment in state j in industry i. Employment shares are from the 1937 Census of Manufactures. Appendix Table 4 shows the values of Share for each state. Unsurprisingly, the highest values are in the traditional centers of the auto industry, Michigan, Indiana, and Ohio.
Michigan, Indiana, and Ohio—in that order—were also the three states with the worst manufacturing employment outcomes in the recession (Figure 4). This link is almost certainly causal: since demand and employment in the auto industry were determined nationwide, it cannot have been poor conditions in these states that caused the decline in auto industry employment. And it is unclear what, if any, third factor would have caused both an outsized decline in auto industry employment and poor employment outcomes in these three states.
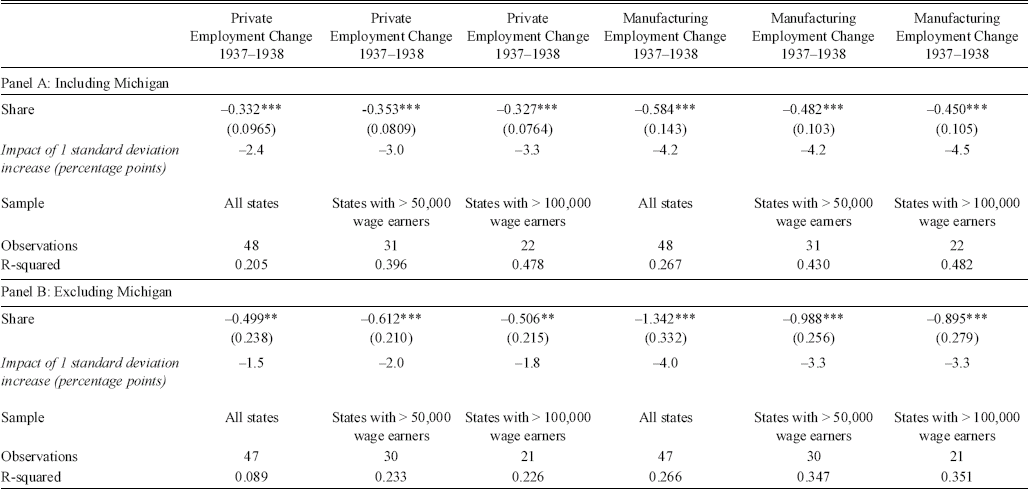
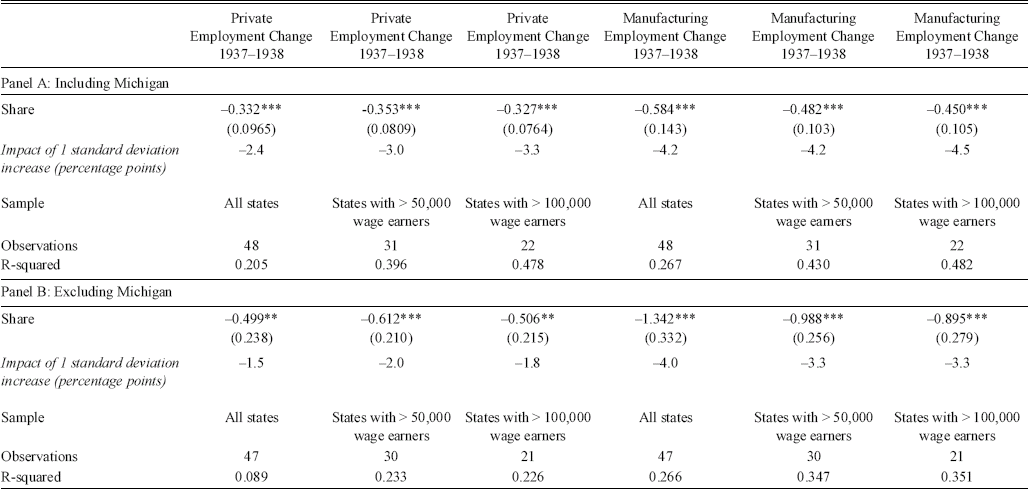
To more formally assess the link between the auto sector and state employment outcomes, I estimate the simple regression of state employment change on Share. Results are in Table 9. Panel A includes Michigan while panel B excludes Michigan. The high share of employment linked to the auto industry explains why Michigan does so poorly in the recession, and hence excluding Michigan from the regression reduces the statistical significance of Share and the R Footnote 2 . The table also shows results for subsets of states with significant employment in manufacturing, since many small states have trivially low values of Share. Even in the regressions excluding Michigan, there is strong evidence that the share of employment linked to the auto industry was negatively correlated with state outcomes during the recession. Results are generally statistically and economically significant. In the specification including all states, a one standard deviation higher value of Share lowers total state employment growth in the recession by 2.4 percentage points and lowers manufacturing employment growth by 4.2 percentage points. Among the 22 states with more than 100,000 manufacturing wage earners, employment in the synthetic auto sector explains 48 percent of the variation in manufacturing employment outcomes. This is evidence that the auto shock played a role in generating large geographic variation in 1937/38.
STATE EMPLOYMENT OUTCOMES AND SYNTHETIC AUTO SHARE
* + Significant at the 10 percent level.
** + Significant at the 5 percent level.
*** + Significant at the 1 percent level.
Note:
Constant not shown. Standard errors are in parentheses.
Sources:
Employment data are from Wallis (Reference Wallis1989). Construction of Share is described in the text.
Sectors
The auto shock can explain the anomalous decline in motor vehicle consumption during the recession. As noted above, the forecasting exercise suggests that absent the price shock, unit auto sales would have fallen by 25 percent between 1937 and 1938 rather than the actual 46 percent. Measured in chained 1937 dollars, total durables consumption fell 17.6 percent from 1937 to 1938.Footnote 56 With the conservative assumption of no multiplier effect on other durables purchases, and that 70 percent of passenger car sales were to consumers, the decline in durables consumption would have been 11.9 percent absent the auto shock.Footnote 57
The principle other anomaly in the recession is that nondurables consumption rises. It is possible that this reflects a relative price effect of the auto shock. Households may have spent some of the income that they would have spent on autos on nondurable items like clothing and food.Footnote 58 In February 1937, a pound of lard cost 18.2 cents and a standard two-door Ford sedan cost $585.Footnote 59 Buying the Ford meant giving up 585/.182 + 3,214 pounds of lard. In February 1938, the price of a pound of lard had fallen to 14.2 cents while the price of the Ford had risen to $665. Buying the Ford in 1938 meant giving up 665/.142 + 4,683 pounds of lard. Thus consumers may have chosen to buy more lard and fewer Fords.Footnote 60 This effect could also rationalize why employment rose in so many states. In all states in which manufacturing employment rose, the value of Share is below 3 percent. Manufacturing employment in these states had little direct connection to auto demand. The increase in nondurables consumption—perhaps due to the relative price shock—may explain the unusually good performance of these states in the recession.
CONCLUSION
The 1937/38 recession exhibits timing, sectoral, and geographic anomalies not easily explained by monetary policy, fiscal policy, or economy-wide unionization. The decline in industrial production from September to December 1937 is the largest three-month decline in the history of the Federal Reserve and Miron-Romer series going back to 1884. Manufacturing employment rises in 8 states despite a 12 percent decline nationwide, and durables consumption falls more than 17 percent while nondurables consumption rises.
This article argues that a supply shock in the auto industry explains a significant part of these anomalies. Labor strife and raw material price increases raised costs for auto manufacturers in early 1937. However, nominal price rigidity meant that prices for new autos did not rise until late summer and fall. For several months consumers expected the price increase, leading to a bulge in purchases in the summer and early fall of 1937 followed by a collapse of auto sales and production in 1938. This hypothesis is confirmed both by narrative evidence and by a quantitative forecasting exercise. I construct a forecast of how sales would have behaved absent exogenous developments in the auto industry. This illustrative exercise implies that in 1938, 600,000 more cars would have been sold, and GDP growth would have been as much as one percentage point higher. Equally important, there is strong evidence that the auto shock contributed to the anomalous timing, geographic, and sectoral patterns of output in the recession. Absent this shock, the 1937/38 recession would have been a milder and more typical downturn.
Appendix 1: Forecasting Model Details
Lag Selection
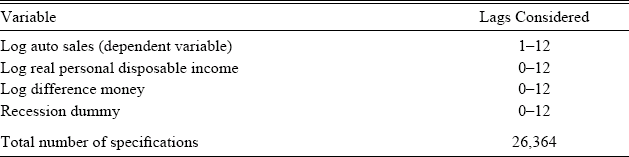
Ideally, one would like to consider all possible lag combinations of variables used in the forecast model as well as run the model with all variables in levels, logs, differences, and log differences. To make computational time reasonable, I limit these possibilities in several ways. First, I consider only models with the dependent variable (auto sales) in logs. Preliminary regressions suggested this yielded as good a forecast (measured by information criteria) as any other transformation of the dependent variable, and it is the form preferred by Horner (Reference Horner1939). Since there may be a trend to log auto sales, I include a time trend. Second, based on results from preliminary regressions, I include only the log of real personal disposable income, the log difference of the money supply, and the level of the recession dummy. Third, I do not consider specifications in which lags are skipped. Thus I consider, for example, all possible specifications with 4 lags or 12 lags of log disposable income, but I do not consider a model with just the 4th and the 12th lag. Appendix Table 1 summarizes the specifications I consider.
LAG POSSIBILITIES FOR FORECASTING MODEL

To choose what lags to include, one does not simply want to choose the model with the best fit. Such a procedure would select an overparameterized model with poor out-of-sample performance. An approach to dealing with this problem is to select models by minimizing an information criterion. An information criterion rewards in-sample fit but penalizes additional right hand side variables, including lags. For each model, I compute the Akaike information criterion (AIC) and Bayesian information criterion (BIC), where

and

The number of observations is N, SSR is the sum of squared residuals (computed relative to the level of auto sales), and P is the number of parameters estimated (Enders Reference Enders2004, p. 69).
Both the AIC and BIC reward better fit and punish additional variables, but the BIC punishes additional variables more. The BIC will never select a model with more right hand side variables than the model selected by the AIC. Both information criterion are standard and have theoretical appeal. Asymptotically, the BIC will select the correct model. But in a small sample, Monte Carlo studies suggest the AIC may perform better (Enders Reference Enders2004, pp. 69–70). I evaluate both the AIC and BIC for each possible specification.
FORECASTING MODEL ESTIMATION RESULTS
Appendix 2: Share of Industry Output Purchased by the Auto Industry and State Auto Employment Shares
SHARE OF INDUSTRY GROUP OUTPUT PURCHASED BY THE MOTOR VEHICLE INDUSTRY
SHARE OF STATE MANUFACTURING EMPLOYMENT IN THE SYNTHETIC AUTO SECTOR