INTRODUCTION
Giardia are seemingly ubiquitous intestinal parasites of vertebrates, found in all classes examined to date (Thompson et al. Reference Thompson, Lymbery and Meloni1990; Adam, Reference Adam2001). Species classification of Giardia has been dynamic. Originally many species were described based on host information and then these were re-classified into 3 species based on gross morphological differences – Giardia agilis (amphibians), Giardia muris (rodents and birds) and Giardia duodenalis (mammals, birds and rodents) (Filice, Reference Filice1952). With the advent of more sophisticated ultrastructural methods of morphological characterization, additional species have been described – Giardia psittaci in parakeets (Erlandsen and Bemrick, Reference Erlandsen and Bemrick1987), Giardia ardeae in herons (Erlandsen et al. Reference Erlandsen, Bemrick, Wells, Feely, Knudson, Campbell, Van Keulen and Jarroll1990) and Giardia microti in muskrats and voles (van Keulen et al. Reference Van Keulen, Feely, Macechko, Jarroll and Erlandsen1998); and it is expected that this trend will continue as the number of host species examined increases, particularly with respect to the recognition of previously described species (Thompson and Monis, Reference Thompson and Monis2004).
G. duodenalis (also referred to as G. lamblia and G. intestinalis) is the only species recovered from humans to date and hence has received the most attention. Early research on human isolates using a variety of molecular tools demonstrated consistent heterogeneity and divergence within G. duodenalis. Subgroups precursory to the current system were originally described by Nash – groups 1, 2 and 3 (Nash and Keister, Reference Nash and Keister1985); Andrews – groups I, II, III and IV (Andrews et al. Reference Andrews, Adams, Boreham, Mayrhofer and Meloni1989) and Homan – Polish and Belgian (Homan et al. Reference Homan, Van Enckevort, Limper, Van Eys, Schoone, Kasprzak, Majewska and Van Knapen1992). These subgroups were found to be equivalent and the nomenclature was standardized to ‘Assemblages’ AI and AII and BIII/BIV (Monis et al. Reference Monis, Mayrhofer, Andrews, Homan, Limper and Ey1996; Adam, Reference Adam2001).
More recent research, both on isolates from a wider host range and using molecular techniques directly on host samples, has lead to the recovery and identification of more genotypes of G. duodenalis from a range of domestic and wild animals. Genotypes isolated include the original A and B assemblages previously detected in humans (and hence potentially zoonotic), as well as new and apparently host specific genotypes currently designated assemblage C and D, found in dogs (Hopkins et al. Reference Hopkins, Meloni, Groth, Wetherall, Reynoldson and Thompson1997; Monis et al. Reference Monis, Andrews, Mayrhofer, Mackrill, Kulda, Isaac-Renton and Ey1998); E, found in hoofed livestock (Ey et al. Reference Ey, Mansouri, Kulda, Nohynkova, Monis, Andrews and Mayrhofer1997); F, found in cats (Mayrhofer et al. Reference Mayrhofer, Andrews, Ey and Chilton1995) and G, found in rats and mice (Monis et al. Reference Monis, Andrews, Mayrhofer and Ey1999). The assemblages of G. duodenalis, although apparently identical in morphology, demonstrate large genetic divergence and this has led to the proposition that G. duodenalis may be a species complex (Andrews et al. Reference Andrews, Adams, Boreham, Mayrhofer and Meloni1989; Mayrhofer et al. Reference Mayrhofer, Andrews, Ey and Chilton1995; Monis et al. Reference Monis, Mayrhofer, Andrews, Homan, Limper and Ey1996). However, this remains unresolved, as to date convention has relied on morphological variation to describe different Giardia species and not genotypic or phenotypic variation alone.
An ongoing issue in Giardia research has been the question of zoonotic transmission (Thompson and Monis, Reference Thompson and Monis2004; Caccio et al. Reference Caccio, Thompson, McLauchlin and Smith2005; Hunter and Thompson, Reference Hunter and Thompson2005). In order to address this, molecular epidemiological studies have involved genotyping many new isolates and so numerous methods have been described in the literature (Weiss et al. Reference Weiss, Van Keulen and Nash1992; Ey et al. Reference Ey, Andrews and Mayrhofer1993; van Keulen et al. Reference Van Keulen, Homan, Erlandsen and Jarroll1995; Baruch et al. Reference Baruch, Isaac-Renton and Adam1996; Monis et al. Reference Monis, Mayrhofer, Andrews, Homan, Limper and Ey1996, Reference Monis, Andrews, Mayrhofer and Ey1999; Hopkins et al. Reference Hopkins, Meloni, Groth, Wetherall, Reynoldson and Thompson1997; Caccio et al. Reference Caccio, De Giacomo and Pozio2002). Variations between the methods lie in the gene(s) utilized (small subunit rDNA – SSU rDNA, variable surface protein – vsp, glutamate dehydrogenase – gdh, triose phosphate isomerase -tpi, elongation factor 1 alpha – ef1α, beta giardin – β giardin), the region of the gene examined (Giardia specific, G. duodenalis specific, assemblage specific) and method of analysis (mainly direct PCR for product size polymorphism, restriction fragment length polymorphisms (RFLP) or sequencing). Depending on the aim of each study, different groups have been promoting their techniques for different genotyping applications. As the amount of sequence information increases, more can be learnt about the different genes and their uses in genotyping and phylogenetic analyses.
Our aims in this review were to evaluate the value of loci currently used for the genotypic characterization of Giardia in terms of diagnosis, taxonomy, molecular epidemiology and phylogeny. In order to achieve this, we have collated all of the available sequence data from the GenBank database (National Center for Biotechnology Information, NCBI, www.ncbi.nlm.nih.gov) for G. duodenalis at the SSU rDNA, gdh, tpi, ef1α and β giardin loci. As researchers use this important resource to design primers, develop RFLPs and identify isolates, an overview of the currently available sequence data seemed appropriate.
Initially, the ability of different loci to reliably and consistently assign isolates to an assemblage/subassemblage of G. duodenalis was assessed. Our original focus in this area was the suitability of SSU rDNA for this task as this locus has some desirable traits that favour its use in genotyping, notably, a high copy number. Giardia has been estimated to have 60 copies of the rDNA repeat (Boothroyd et al. Reference Boothroyd, Wang, Campbell and Wang1987; Edlind and Chakraborty, Reference Edlind and Chakraborty1987), whereas the other structural, metabolic and housekeeping genes are estimated to be single or low copy number (Yee and Dennis, Reference Yee and Dennis1992). High copy number of a gene confers 2 immediate advantages. (i) There is a greater success rate of amplification due to increased availability of starting material. This becomes significant as researchers increasingly attempt to amplify directly from environmental samples, which are typically lower in target DNA and contain more PCR inhibitors (relative to cultured isolates). (ii) The detection of mixed templates in a sample is more likely. Since the advent of genotyping, procedures applied directly to clinical and environmental samples, mixed templates have become more apparent (Weiss et al. Reference Weiss, Van Keulen and Nash1992; Upcroft and Upcroft, Reference Upcroft and Upcroft1994; Amar et al. Reference Amar, Dear, Pedraza-Diaz, Looker, Linnane and McLauchlin2002; Guy et al. Reference Guy, Xiao and Horgen2004) and their detection is significant. Analyses employing the high copy number SSU rDNA are frequently able to detect mixed templates in a single PCR (Hopkins et al. Reference Hopkins, Meloni, Groth, Wetherall, Reynoldson and Thompson1997; Berrilli et al. Reference Berrilli, Di Cave, De Liberato, Franco, Scaramozzino and Orecchia2004) whereas this is seldom reported for the low copy genes (Lalle et al. Reference Lalle, Pozio, Capelli, Bruschi, Crotti and Caccio2005b), normally requiring multiple PCRs that produce alternate results (unpublished observations). A final reason for concentrating on the SSU rDNA locus, is it is the traditional gene sequence used for identification and phylogenetic analyses (Sogin et al. Reference Sogin, Gunderson, Elwood, Alonso and Peattie1989; van Keulen et al. Reference Van Keulen, Gutell, Gates, Campbell, Erlandsen, Jarroll, Kulda and Meyer1993) and valuable contributions could be made to the rDNA databases for future analyses on the systematics of Giardia species.
We also examine the phylogenetic trends demonstrated by the different loci used for genotyping G. duodenalis. The last comprehensive study investigating these relationships within G. duodenalis (Monis et al. Reference Monis, Andrews, Mayrhofer and Ey1999) demonstrated variable results between the loci and it was hypothesized that further sequence information may resolve this. The relationships were of interest because an understanding of the history of evolution and adaptability of the assemblages in terms of the relationships of their present hosts may provide insights into their current potential scope.
MATERIALS AND METHODS
GenBank survey
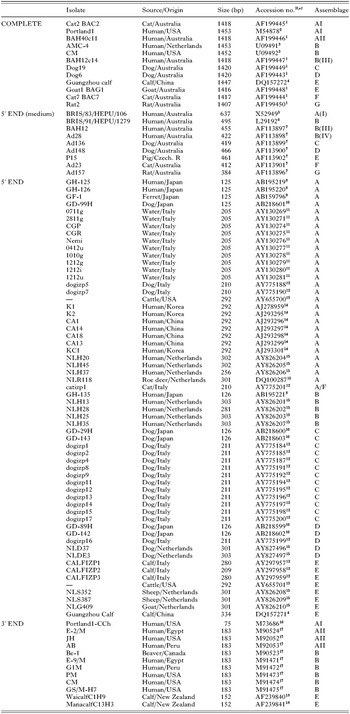
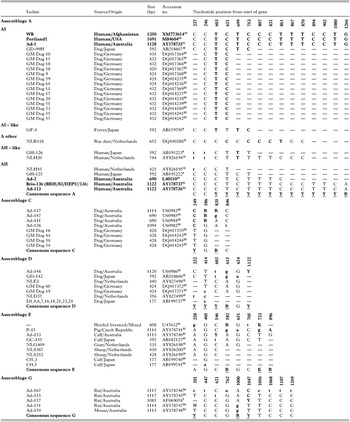
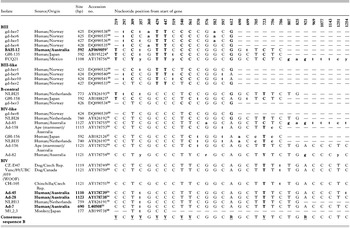
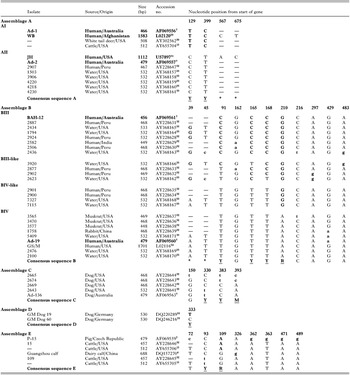
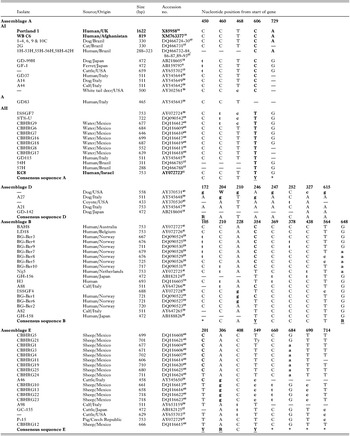
Searches were conducted of the GenBank database to gather as many sequences as possible of Giardia duodenalis to be organized and compared in further analyses. Of the more than 10 000 Giardia sequences on GenBank, approximately 90% were related to genome sequencing projects and contained predominantly uncharacterized products. Of the remainder, 405 were G. duodenalis sequences of interest, with 104 SSU rDNA, 96 gdh, 53 tpi, 141 β giardin and 11 ef1α. The details of the isolates retrieved are given in Tables 1–4, and below. In Tables 1–4, reference isolates are given in bold, asterisks mark positions outside of the alignment range, dashes either represent missing data in the isolate details or in the sequences (sequences do not extend to that base position), lower case letters were used to show small subgroups, universal code degenerate bases were used in the consensus sequences (R=A/G, Y=C/T, K=G/T, M=A/C), samples categorized as ‘A’, ‘B’ or ‘B-central’ were unable to be aligned to a reference subgroup and the sample ‘A other’ refers to an isolate divergent from both AI and AII.
Isolate details for SSU rDNA are given in Table 1. Sequences that were deemed unsuitable for the analyses because they contained mixed, degenerate or unusual substitutions (that had not been reproduced) were omitted from the table and from the analyses. These sequences were as follows: ambiguous/degenerate sequences DQ118557, DQ118558 and DQ112665, mixed sequences AY775186, AY775189, AY775193 and AJ293300, hypervariable sequences AY130270, AY130272 and AY130273 and superseded ‘Portland-1’ sequence X05396.
Small subunit rDNA, isolate information

Isolate details for gdh, tpi and β giardin are given in Tables 2–4. These tables include the intra-genotypic (intra-assemblage) substitution details for each assemblage. Some isolate sequences (listed below) were omitted from these tables (but not from the analyses) because there were no intra-genotypic variations to tabulate. For example, some assemblages were represented on the database by only one sequence, or the available sequences were identical (matching where they overlapped) or were too small to cover regions of variation within that assemblage. In addition, some isolates were deposited on the database numerous times (reference isolates) and their sequences were found to be identical and hence only the longest available sequences were tabulated. For the gdh locus, samples not included in Table 2 were – ‘Ad-1’/L40509 (‘Ad-1’/AY17873521 was longer), 5 matching assemblage F sequences [cats ‘Ad-23’, ‘Ad-131’, ‘Ad-142’ and ‘Ad-154’ (1114–1123 bp, AF0690577 and AY178742–4424, Australia) and cat ‘Ct1,2,3’ (177 bp, AB19973926, Japan)], 3 smaller assemblage A sequences [dog ‘D3,5,8–15,17–23’ (177 bp, AB19973526, Japan), calf ‘cf2’ (177 bp, AB19974226, Japan) and human ‘NLH 37’ (399 bp, AY82619615, Netherlands)] and a smaller assemblage C sequence [dog ‘D2’ (177 bp, AB19973626, Japan)]. For the tpi locus, samples not included in Table 3 were – the single assemblage F sequence [cat ‘Ad-23’ (479 bp, AF0695587, Australia)] and the 2 matching assemblage G sequences [rat isolates ‘Ad-157’ (468 bp, AF0695627, Australia) and ‘2135’ (428 bp, AY22864032, USA)]. For the β giardin locus, samples not included in Table 4 were – the replicates of ‘Portland 1’ (X14185, M36728 and X07919 in favour of longer X8595836), ‘WB’ (AY258617 in favour of longer XM76337719) and ‘H3’ (AY258616 in favour of longer DQ11660538) as well as the single sequences for assemblages C and F [dog ‘A29’ (511 bp, AY54564628, Italy) and cat ‘A101’ (753 bp, AY64726438, Italy) respectively]. There was no sequence available for assemblage G.
Glutamate dehydrogenase isolates, position and breakdown of intra-genotypic substitutions

Glutamate dehydrogenase isolates, position and breakdown of intra-genotypic substitutions – Assemblage B

Triose phosphate isomerase isolates, position and breakdown of intra-genotypic substitutions

Beta giardin isolates, position and breakdown of intra-genotypic substitutions

The references for the Accession numbers above and in Tables 1–4 (represented in superscript) were as follows. (1) Thompson et al. (Reference Thompson, Hopkins and Homan2000), (2) Sogin et al. (Reference Sogin, Gunderson, Elwood, Alonso and Peattie1989), (3) van Keulen et al. (Reference Van Keulen, Homan, Erlandsen and Jarroll1995), (4) Not yet published, Xiao, S., South China Agricultural University, 2005, (5) Healey et al. (Reference Healey, Mitchell, Upcroft, Boreham and Upcroft1990), (6) Upcroft et al. (Reference Upcroft, Healey and Upcroft1994), (7) Monis et al. (Reference Monis, Andrews, Mayrhofer and Ey1999), (8) Abe et al. (Reference Abe, Kimata and Tokoro2005a), (9) Abe et al. (Reference Abe, Read, Thompson and Iseki2005b), (10) Not yet published, Abe, N., Osaka City Institute of Public Health and Environmental Sciences, 2005, (11) Not yet published, Berrilli, F., University of Rome, 2002, (12) Berrilli et al. (Reference Berrilli, Di Cave, De Liberato, Franco, Scaramozzino and Orecchia2004), (13) Trout et al. (Reference Trout, Santin, Greiner and Fayer2004), (14) Yong et al. (Reference Yong, Park, Hwang, Yang, Lee, Min, Rim, Wang and Zheng2000), (15) van der Giessen et al. (Reference Van Der Giessen, De Vries, Roos, Wielinga, Kortbeek and Mank2006), (16) van Keulen et al. (Reference Van Keulen, Campbell, Erlandsen and Jarroll1991), (17) Weiss et al. (Reference Weiss, Van Keulen and Nash1992), (18) Hunt et al. (Reference Hunt, Ionas and Brown2000), (19) McArthur et al. (Reference McArthur, Morrison, Nixon, Passamaneck, Kim, Hinkle, Crocker, Holder, Farr, Reich, Olsen, Aley, Adam, Gillin and Sogin2000), (20) Yee and Dennis (Reference Yee and Dennis1992), (21) Ey et al. (Reference Ey, Mansouri, Kulda, Nohynkova, Monis, Andrews and Mayrhofer1997), (22) Leonhard et al. (Reference Leonhard, Pfister, Beelitz, Wielinga, Traub and Thompson2006), (23) Monis et al. (Reference Monis, Mayrhofer, Andrews, Homan, Limper and Ey1996), (24) Ey, P., University of Adelaide, 2002, submitted as a set with those from Ey et al. (Reference Ey, Mansouri, Kulda, Nohynkova, Monis, Andrews and Mayrhofer1997), (25) Monis et al. (Reference Monis, Andrews, Mayrhofer, Mackrill, Kulda, Isaac-Renton and Ey1998), (26) Itagaki et al. (Reference Itagaki, Kinoshita, Aoki, Itoh, Saeki, Sato, Uetsuki, Izumiyama, Yagita and Endo2005), (27) Matsubayashi et al. (Reference Matsubayashi, Kimata and Abe2005), (28) Robertson et al. (Reference Robertson, Hermansen, Gjerde, Strand, Alvsvag and Langeland2006), (29) Mowatt et al. (Reference Mowatt, Weinbach, Howard and Nash1994), (30) Trout et al. (Reference Trout, Santin and Fayer2003), (31) Baruch et al. (Reference Baruch, Isaac-Renton and Adam1996), (32) Sulaiman et al. (Reference Sulaiman, Fayer, Bern, Gilman, Trout, Schantz, Das, Lal and Xiao2003), (33) Sulaiman et al. (Reference Sulaiman, Jiang, Singh and Xiao2004), (34) Not yet published, Mowatt, M., National Institute of Allergy and Infectious Diseases, 1992, (35) Not yet published, Wielinga, C., Murdoch University, 2005, (36) Holberton and Marshall (Reference Holberton and Marshall1995), (37) Not yet published, Volotao, A., Institute Ozwaldo Cruz, 2006, (38) Lalle et al. (Reference Lalle, Jimenez-Cardosa, Caccio and Pozio2005a), (39) Caccio, S., Institute Superiore di Sanita, 2002 submitted as a set with those from Caccio et al. (Reference Caccio, De Giacomo and Pozio2002), (40) Not yet published, Di Giovanni, G., Texas A & M University, 2005, (41) Caccio et al. (Reference Caccio, De Giacomo and Pozio2002), (42) In the Press, Abe, N., Seikatsu Eisei, 2005, (43) Santin et al. (Reference Santin, Ludwig, Fayer and Trout2003).
The ef1α isolates retrieved from the database included 2 ‘G. lamblia’ sequences (L23957 and D14342), ‘WB’ (XM762925) and 9 previously presented and analysed samples [‘Ad-2’, ‘Ad-12’, ‘Ad–23’, ‘Ad–28’, ‘Ad-136’, ‘Ad-148’, ‘Ad-157’, ‘P15’ and ‘BAH-12’; AF069568-75, (Monis et al. Reference Monis, Andrews, Mayrhofer and Ey1999)]. As there were so few sequences, and they had been presented elsewhere, they were not included in the current study.
All of the G. duodenalis genotyping sequences were derived from genomic DNA. Most of the sequences were obtained from direct sequencing (occasionally cloned) of PCR products amplified from environmental samples. The reference isolate sequences were usually derived from isolates grown in culture or passaged through suckling mice.
Alignments
Sequences gathered in the initial GenBank survey required sorting into their different genes, assemblages and subassemblages as well as alignment along the gene. The purpose of this was to establish the coverage of each gene (the amount of the gene being represented in length and in sample numbers) to determine the maximum continuous alignment length possible (to aid the resolution of relationship analyses) and to ascertain the variation in sample representation over that length (to gauge strength and accuracy of regions of the alignment). The alignments were also used to examine the inter- and intra- genotypic substitutions that determine the existing and potential groupings/subgroupings. Once these groups had been established, their continuity across the loci could also be investigated. Initially sequences were grouped into their respective loci and then each was analysed by multiple sequence alignment using either CLUSTAL W 1.83 (Thompson et al. Reference Thompson, Higgins and Gibson1994) or CLUSTAL X 1.81 (Thompson et al. Reference Thompson, Gibson, Plewniak, Jeanmougin and Higgins1997). Sequences were then sorted and grouped into their assemblages and subassemblages (where possible) according to the positions of their single nucleotide polymorphisms (SNPs) relative to previously characterized reference isolates. The isolates used as subassemblage reference isolates included AI – WB, Portland 1 and/or Ad-1, AII – JH, AB, KC8, Ad-2, Bris-136 and/or Ad-113, BIII – BAH-12 and BIV – Ad-7, Ad-19, Ad-28 and/or Ad-45 (Andrews et al. Reference Andrews, Adams, Boreham, Mayrhofer and Meloni1989; Nash, Reference Nash1992; Weiss et al. Reference Weiss, Van Keulen and Nash1992; Ey et al. Reference Ey, Khanna, Andrews, Manning and Mayrhofer1992; Mayrhofer et al. Reference Mayrhofer, Andrews, Ey and Chilton1995; Monis et al. Reference Monis, Mayrhofer, Andrews, Homan, Limper and Ey1996, Reference Monis, Andrews, Mayrhofer and Ey1999).
Once the alignments for each gene were sorted and grouped into their assemblages, they were trimmed to standardize their length for further analyses. Alignments were cut at each end at the point where the representation of any one assemblage ended. In this way the length of all of the alignments were limited by the length of the shortest (assemblage) alignment. The aim was to obtain the maximum possible length of continuous coverage of the gene by all assemblages (with at least 1 sample at any given point – but not necessarily single samples covering the whole length).
Consensus sequences
Once all of the original sequences had been aligned, the current consensus sequences could be determined for each assemblage/subassemblage per gene. Consensus sequences are defined as the common or shared sequence features for a sequence. Genetic analyses using individual sequences are often limited by the sequence's length and position along a gene. Sequences are therefore frequently omitted or cut to standardize data sets for further analyses. The advantage of using consensus sequences is increasing sequence length (to maximize the resolution of relationship analyses with increased characters) and confidence of the data set (with increasing sample contributions). The disadvantage of this method lies in the potential over-simplification of the sequences.
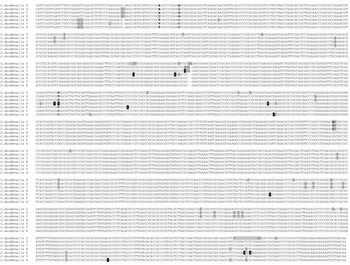
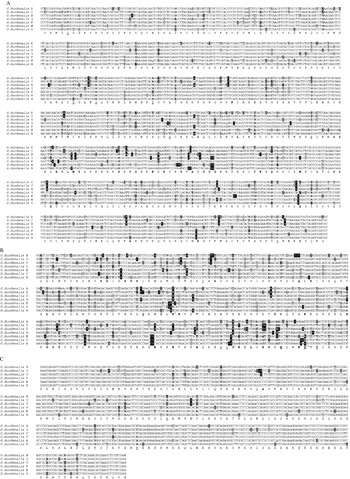
To determine each consensus sequence, all of the variable sites were analysed to establish either the major nucleotide represented or the appropriate degenerate base (in universal code) to represent the composition of the original sequences. The details of the criteria used to determine these consensus sequences are given below and the breakdown of each of these intra-genotypic (intra-assemblage) substitution sites for gdh, tpi and β giardin are given in Tables 2 to 4. Since there were so few intra-genotypic substitutions at the SSU rDNA locus they were not tabulated and instead were included in the consensus sequence figure. All intra-genotypic substitutions for the SSU rDNA were noted for the small data sets (those with few available sequences), whereas those from the larger sets were only noted if there was more than 1 sample with the same substitution. The completed consensus sequences are given in Figs 1 and 2.
Full-length SSU rDNA consensus sequence alignment (1407 to 1420 base pairs). Substitutions (from the majority) are shaded grey. Large variations within an assemblage (greater than 25% or subgrouping of AI/AII) are shown with a degenerate base shaded black with white text. Small variations within an assemblage are shown with the predominant base in lower case shaded black with white text. Two bases shaded black with grey text represent positions where half (assemblage B) or a quarter (assemblage A) of the isolates had a deletion at that site. Bold nucleotides indicate positions with increased variation.

Nucleotide consensus sequences. (A) Glutamate dehydrogenase. (B) Triose phosphate isomerase (C) Beta giardin. (A) Glutamate dehydrogenase: 80% coverage of gene, 1106 base pairs (bp) in length of the 1350 bp total (including stop codon) from the first base of the 63rd amino acid codon (187th bp) to the second base of the 431st codon (1292nd bp). (B) Triose phosphate isomerase: 60% coverage of gene, 468 bp long of a total of 774 bp (including stop) from the first base of the 16th amino acid codon (46th bp) to the third base of the 171st codon (513th bp). (C) Beta giardin: 60% coverage of gene, 511 bp long of a total of 819 bp (including stop) from the third base of the 46th amino acid codon (138th bp) to the third base of the 216th codon (648th bp). Expressed nucleotide substitutions (from the majority) are shaded black with white text (unique expressed, black with grey text). Silent nucleotide substitutions (from the majority) are shaded grey (unique silent, dark grey). Large variations within an assemblage (greater than 25% or subgrouping of AI/AII or BIII/BIV) are shown with a degenerate base. Lower case text is used to show the predominant nucleotide in positions with small variations. Bold nucleotides indicate positions with increased variation. Bold amino acids indicate sites of expressed variation. Positions of even majority of nucleotides are noted with underlined amino acids. Amino acid sequence given beneath the nucleotide sequence is from assemblage A. ∧Codons with near even majorities of expressed substitutions (tpi). ∧∧Codon with too much variation to decipher substitutions (tpi).

Once the variable sites were identified, the more significant substitutions were tabulated. For assemblages with numerous sequences available (A and B in gdh and tpi and A, B and E in β giardin) only intra-genotypic substitutions with a representation greater than one were tabulated; for all other assemblages, all of the intra-genotypic substitutions were tabulated. This distinction was made because in the larger data sets isolated substitutions were deemed less significant, whereas in the smaller sample sets their potential significance was unknown. Variable sites at the extreme ends of a sequence (within 20 bp) were not included owing to known potential problems in the sequencing and interpretation of these regions and hence the reduced certainty that they were valid substitutions. The consensus nucleotides – per variable site – were subsequently determined by the majority. Degenerate bases were used at either known variable sites for the subassemblages (AI/AII and BIII/BIV) or sites with greater than 25% deviation amongst the samples (within an assemblage). Degenerate bases in the original sequences were not included unless there were no other sequences available for that assemblage in that region.
Substitution analyses
The aligned consensus sequences were then examined at the inter-genotypic level for substitutions between the assemblages. Similarities and differences between the sequences determine their grouping into assemblages and subassemblages and the relatedness inferred in phylogenetic analyses. Analyses of the substitution patterns of a gene and comparison between the genes, provides information about the suitability of the gene or gene regions for use in different genotyping applications.
As all of the loci being analysed had at least 1 complete sequence available on the database from the Giardia genome project (McArthur et al. Reference McArthur, Morrison, Nixon, Passamaneck, Kim, Hinkle, Crocker, Holder, Farr, Reich, Olsen, Aley, Adam, Gillin and Sogin2000) and most Giardia genes do not contain introns, it was possible to determine the amino acid codon frame of each of the consensus sequence alignments from the start codon of that gene. Sequences were therefore aligned into their (amino acid) codon frame and substitutions at a particular nucleotide position were noted as those departing from the majority of other assemblages. Total rates of substitution were noted (substitutions per nucleotide) as well as the types of substitutions – expressed (non-synonymous), silent (synonymous) and unique (those not shared by another assemblage – unique to that assemblage).
Phylogenetic trees
In an effort to learn more about the relationships amongst the assemblages of G. duodenalis, phylogenetic trees were constructed using the current consensus sequences. Although trends in relationships can be seen in aligned sequences, evaluating the sum of these patterns maybe difficult, whereas phylogenetic trees can clearly demonstrate the likely associations and interactions. Sequences were aligned with CLUSTAL X 1.81 and viewed with Treeview 68K (Page, 1996). Sequences were then analysed further in MEGA 3.1 (Kumar et al. Reference Kumar, Tamura and Nei2004). Pairwise distances and Neighbour-Joining phylogenies (1000 estimations) for the nucleotide sequences were calculated using each of the available models (p-distance, Jukes-Cantor, Kimura 2-parameter, Tajima-Nei, Tamura 3-parameter and Tamura-Nei). Nucleotide frequencies were calculated and transition/transversion ratios examined. Among-site variation was also investigated using the different default options for gamma distribution parameters in MEGA (0·25, 0·5, 1·0 and 2·0) as well as comparison of pairwise distances and phylogenies (using multiple distance estimation models) of the different codon positions (1st, 2nd and 3rd). Amino acid sequence phylogenies were also examined with multiple models [p-distance, Poisson-correction, equal input model, Dayhoff (PAM matrix) and Jones-Taylor-Thornton (JTT matrix)]. Trees were constructed from the nucleotide and amino acid aligned consensus sequences for individual and concatenated genes.
The amino acid alignments were included to investigate the effects of the non-synonymous substitutions alone. Since the non-synonymous substitutions have greater selection pressure (occurring less often within a gene than the synonymous ones) the shared non-synonymous substitutions are less likely to occur randomly (2 assemblages developing the same non-synonymous substitution independently) and are most likely to be a result of their shared evolution (developed before their divergence). Non-synonymous substitutions are also more likely to be more linear (changing one-way) over time, whereas the synonymous substitutions are more likely to revert, also potentially confusing the evaluation of the shared substitutions.
Due to the giardin proteins being Giardia specific, an out group had to be sourced from within the Giardia family, and at the time of collating the data, G. muris was the only available sequence for β giardin; however, this sequence was not available for the gdh locus. As there was not a common out-group available for all of the loci, the trees were left un-rooted to facilitate comparison with the concatenated sequences. Two combinations of concatenated nucleotide sequences were constructed, one without assemblage G to facilitate the β giardin sequences and one without β giardin to include the assemblage G sequences. For the concatenated amino acid sequences, only gdh and tpi were used as β giardin had limited expressed variation and this allowed the inclusion of assemblage G.
RESULTS AND DISCUSSION
GenBank survey
In the initial process of collecting sequences from GenBank the most striking fact was how little sequence data was available for the SSU rDNA locus of Giardia. As this is typically the original gene of choice for identification and phylogenetic analysis, it was surprising that there were only 12 full-length G. duodenalis sequences for the SSU rDNA on GenBank and most of these were several years old (Table 1). There were an additional 9 sequences greater than 350 base pairs (out of 1400 bp) totalling only a third of the gene. It was therefore interesting to note that the original sequence results for most of the genotypes have not been repeated and reproduced. The remaining sequences were genotyping sequences covering the first fifth or the last tenth of the gene, using primers from Weiss et al. (Reference Weiss, Van Keulen and Nash1992), van Keulen et al. (Reference Van Keulen, Homan, Erlandsen and Jarroll1995) or Hopkins et al. (Reference Hopkins, Meloni, Groth, Wetherall, Reynoldson and Thompson1997). However, the products produced by these primer sets are too small to genotype all of the current assemblages. Notably assemblage F (of cats) is identical to assemblage A (zoonotic) until base 499 (Fig. 1). This has led to some inconclusive genotyping and potentially inaccurate results being reported. In the study by Berrilli et al. (Reference Berrilli, Di Cave, De Liberato, Franco, Scaramozzino and Orecchia2004), the cat isolate was genotyped as assemblage A using the 292 bp-product RH primers of Hopkins et al. (Reference Hopkins, Meloni, Groth, Wetherall, Reynoldson and Thompson1997) and in a study by Fayer et al. (Reference Fayer, Santin, Trout and Dubey2006), the cat isolates were genotyped as assemblage F using the same RH primers. This discrepancy may be due to an unsubstantiated substitution at the 5′ end of the AF199444 (a C at position 38). As there were only 2 assemblage F sequences available on GenBank (that had been verified as such at another locus) and one of them started near this position, it was difficult to determine if this was an artefact (error due to signal noise) or an actual substitution. At the time these data were being compiled, the sequences from Fayer et al. (Reference Fayer, Santin, Trout and Dubey2006) had not yet been deposited on GenBank for comparison. Ironically the primers described by van Keulen et al. (Reference Van Keulen, Macechko, Wade, Schaaf, Wallis and Erlandsen2002) to produce an SSU rDNA product for restriction enzyme digestion would have been able to discriminate all of the assemblages by sequencing, but not by digestion.
The other loci were comparatively well represented over the alignment length examined. The majority of sequences available were from the zoonotic assemblages A and B (predominantly from humans/human waste water), followed by the domestically significant assemblages C and D (dogs) and E (hoofed livestock) and the main weakness in representation was found for assemblages F and G (notably assemblage G in β giardin). Increasing some of these data sets in the future would improve the accuracy and sensitivity of further analyses. The coverage of the alignments over the genes also varied. As mentioned, the SSU rDNA locus had several full-length sequences available and the gdh gene was also well represented with 80% coverage of the gene by the alignment. One quarter of the samples covered the whole alignment (with all assemblages represented) and the remaining samples covered the first 40% to 60% of the alignment. However, the tpi and β giardin alignments were shortened to 60% of the length of the genes to maximize the number of assemblages included in the analyses. Therefore, the resulting alignments were well represented over their entire length by the sample sets. Both of these alignment lengths (468 and 511 bp respectively) were sufficient for genotyping samples to the assemblage and possibly subassemblage level; however, the phylogenetic analyses may have been affected by truncating these sequence alignments. The tpi and β giardin gene segments that were omitted had similar rates of substitutions overall as those that were included, however the tpi segment had a reduced rate of non-synonymous substitutions (between the sequences available – WB, JH and GS/M) and the β giardin segment had an extra shared substitution (between assemblages B and D). These differences were of note because changes in the substitution properties of an alignment can alter the amount of information gathered from it and, similarly, additional shared substitutions would provide further information to increase the support for relationships.
Alignments and subgroups
Aligning the sequences to establish the consensus sequences (Tables 2–4) was fairly straightforward until the subgroups of the zoonotic assemblages A and B were examined. Subgrouping within these zoonotic assemblages is of interest as there may be a link between specific subgroups and their hosts, with particular attention on those that may affect humans. It is therefore important to establish the specific subgroups, based on their intra-genotypic substitution patterns, and the continuity of these subgroups across the loci. The AI and AII subgroups originally described as groups 1 and 2 (Nash and Keister, Reference Nash and Keister1985) were quite robust. In the SSU rDNA they were differentiated at the 3′ end by a single substitution (Weiss et al. Reference Weiss, Van Keulen and Nash1992). At the gdh gene there were numerous AI/AII specific polymorphisms and the majority of isolates were easily characterized (Table 2A). There were only a few exceptions with single substitutions not matching the pattern. Since the gdh gene had so many intra-assemblage substitutions, it could be assumed that not all of these would specifically represent ‘AI/AII-substitutions’ and that some may represent other groups not yet identified. As the amount of sequence data increases it may be possible to determine which substitutions are more (or less) significant for differentiating the core subgroups and lesser subgroups. One sample was quite different however; the ‘roe deer’ has been previously noted for its divergence from either AI or AII (van der Giessen et al. Reference Van Der Giessen, De Vries, Roos, Wielinga, Kortbeek and Mank2006) and is potentially a new subgroup. The tpi gene had only 2 AI/AII specific polymorphisms in the region examined and there were no outliers (Table 3). It was interesting to note that this variable locus produced such a clean and neat distinction between these close subgroups. The conserved β giardin alignment in contrast had only 1 substitution clearly differentiating the AI/AII subgroups and then several others producing further groups, the significance of which were not yet apparent (Table 4). In fact the β giardin gene consistently demonstrated numerous subgroups within all assemblages represented by sufficient samples. Their significance, however, was difficult to determine because those samples that had been assessed at other loci did not always segregate into the same subgroups as they had with the β giardin locus (see below).
The BIII and BIV subgroups originally described by allozyme electrophoretic studies (Andrews et al. Reference Andrews, Adams, Boreham, Mayrhofer and Meloni1989) were not so reproducible. At the SSU rDNA there were insufficient full-length samples characterized previously as BIII or BIV to assess if there were in fact any BIII/BIV specific polymorphisms present. There were, however, several polymorphic sites within assemblage B that might warrant further investigation (Fig. 1). Establishing subgroups at the SSU rDNA locus would add weight to their distinction as the conserved loci typically only discern the older more significant groups. In the β giardin alignment there were also insufficient reference isolates previously characterized as BIII/BIV, to determine which substitutions may be BIII/BIV specific (Table 4). Attempts to use isolates characterized at other loci (and β giardin) as references lead to conflicting results, where samples grouped differently at the different loci, as found in a previous study (Robertson et al. Reference Robertson, Hermansen, Gjerde, Strand, Alvsvag and Langeland2006). This may be because the impromptu ‘reference’ isolates were not ‘true’ BIII or BIV representatives and therefore grouped differently again with another gene or perhaps the subgroups within this assemblage have not been comprehensively established. It was also tempting to suspect that the β giardin gene was incapable of subgrouping consistently (relative to the other loci) because of the diversity also shown within assemblage A. However, as the β giardin gene is conserved, it should demonstrate all of the basal relationships well (the assemblages and the main subassemblages) and so perhaps there are still insufficient data. In the gdh and tpi alignments the BIII and BIV isolates appeared to form the most distant subgroups within assemblage B (Tables 2B and 3). The subgrouping of assemblage B was clouded with extra substitutions forming additional groupings to those demonstrated by the BIII/BIV reference isolates alone – as well as less (and less complete) reference isolates available when compared to assemblage A. The tpi alignment had only a slightly higher ratio of BIII/BIV specific substitutions to other substitutions than did the gdh alignment. As there were many isolates that were difficult to characterize it implied there might be more subgroups involved than just BIII and BIV. It has been noted previously that the BIII/BIV classification originated from only single isolates and that they may only represent a preliminary view of the diversity within assemblage B (Mayrhofer et al. Reference Mayrhofer, Andrews, Ey and Chilton1995). If this is the case, attempting to characterize all assemblage B isolates as either BIII or BIV may be problematic. In order to delineate the basal relationships within this diverse assemblage more work is required using conserved loci. As mentioned earlier, it would be interesting to learn how many subgroups could be found at the SSU rDNA locus, as those would be expected to be as robust as the AI/AII divergence. Isolates representing the new subgroups could then be established as reference isolates for subsequent analyses of the more complex substitution patterns of the variable loci. For comparative purposes, the ef1α sequences for the BIII and BIV subgroups show no divergence over the 50% of the gene covered and so there are the possibilities that either polymorphisms may be found in the other half of the ef1α gene or that the older assemblage B sequences at the SSU rDNA locus had errors and not polymorphisms. Overall it is expected that continuing increases in sample numbers and reference isolates for this assemblage (to allow for its apparently greater variability) should eventually establish subgroups with as much continuity and reproducibility across the loci as the AI/AII subgroups and the assemblages demonstrate.
It was also interesting to note, that with the increasing number of samples available, subgroups have been identified in assemblage E. Assemblage E, like assemblages A and B, has a broad host range (hoofed livestock) and so it was plausible that it may comprise host-specific subgroups. The subgrouping was most obvious at the β giardin locus again, but also between the 2 full-length SSU rDNA sequences. The nucleotide sequences do not yet appear to segregate in the host-specific manner that the allozyme data have demonstrated (Monis et al. Reference Monis, Andrews, Mayrhofer and Ey2003), but the number of representative sequences from the different livestock hosts were still low and disproportionate.
It was not possible to speculate on the subgroups forming in the other assemblages (C, D, F and G) as there was too little data available; small sample numbers, insufficient reference isolates and limited host variability. For assemblage D, there was 1 apparently host-specific polymorphism in the β giardin alignment where samples have included dogs and a coyote described by Santin et al. (Reference Santin, Ludwig, Fayer and Trout2003), but for assemblage G, including rats and a mouse in the gdh alignment, there was no host-specific polymorphism.
Consensus sequence substitutions
The consensus sequence alignments at the different loci show the differences in total, synonymous, non-synonymous and unique substitution rates between the genes and gene regions (Figs 1 and 2). Different substitution rates and types allow for the detection and comparison of different groups formed at different times. The slower evolving (conserved) genes are usually targeted to detect and compare older (more distant) groups whereas the quicker evolving (variable) loci can detect and compare new and emerging groups that may not yet have polymorphisms at the conserved loci. The substitution rates found for the SSU rDNA, gdh and tpi alignments (0·01, 0·06 and 0·12 substitutions per nucleotide respectively) were similar to those previously described (Monis et al. Reference Monis, Andrews, Mayrhofer and Ey1999). The typical applications of these loci have therefore varied accordingly. For Giardia the conserved SSU rDNA is traditionally used for species and assemblage/subassemblage level genotyping (Sogin et al. Reference Sogin, Gunderson, Elwood, Alonso and Peattie1989; van Keulen et al. Reference Van Keulen, Campbell, Erlandsen and Jarroll1991, Reference Van Keulen, Gutell, Gates, Campbell, Erlandsen, Jarroll, Kulda and Meyer1993, Reference Van Keulen, Homan, Erlandsen and Jarroll1995; Hopkins et al. Reference Hopkins, Meloni, Groth, Wetherall, Reynoldson and Thompson1997), where as the most variable locus, tpi, is frequently used for subtyping clinical samples (Lu et al. Reference Lu, Baruch and Adam1998; Amar et al. Reference Amar, Dear, Pedraza-Diaz, Looker, Linnane and McLauchlin2002) and the gdh locus, with a substitution rate midway between them, has a broad application spectrum (Monis et al. Reference Monis, Mayrhofer, Andrews, Homan, Limper and Ey1996, Reference Monis, Andrews, Mayrhofer and Ey1999).
The newer gene in use, β giardin (Mahbubani et al. Reference Mahbubani, Bej, Perlin, Schaefer, Jakubowski and Atlas1992; Caccio et al. Reference Caccio, De Giacomo and Pozio2002), has interesting properties but has yet to demonstrate consistent subgenotyping with respect to the other loci. It is both conserved in total number of substitutions (0·03 substitutions per nucleotide) as well as non-synonymous substitution rate (5% of total compared to 15% for gdh and 25% for tpi – representing only 2 amino acid changes in assemblages C and D) and yet demonstrates prominent subgrouping within the assemblages and clear polymorphisms between the assemblages. More than half of the total substitutions for an assemblage were unique to the particular assemblage (60% compared to 30% in the other loci). This was interesting because both the variable tpi and conserved SSU rDNA had the same ‘rate’ of unique substitutions. The two main differences in the giardin genes that may be responsible for this characteristic are their age and their function. The giardin genes are Giardia specific (more recently evolved) and they are structural (rather than metabolic). The increased rate of unique substitutions appears more likely to be the result of the gene's age than function, as the majority of the substitutions were synonymous. In any event, these few and deliberate polymorphisms may eventually prove useful in determining and differentiating the subgroups of the assemblages.
Within a gene, regions of different substitution rates may also be targeted for different applications. For example, the variable 5′ and 3′ ends of the SSU rDNA locus are targeted for genotyping the relatively closely related assemblages, whereas the more conserved regions would only provide sufficient information for the differentiation of Giardia species (and above) but not for within G. duodenalis. Using the current consensus sequence information, different genes and gene regions can be targeted for different genotyping applications. Older primers can be reassessed for their suitability for their original task – potentially changing the location of the primers to change their scope and/or specificity. For example, the use of the RH primers on cat isolates may not be appropriate (as previously mentioned) due to their limited scope. In another example, the use of the gdh primer ‘GDHeF’ described for the discrimination of all genotypes (Read et al. Reference Read, Monis and Thompson2004) may no longer be optimal, because a further 2 substitutions in assemblages D, E and F have been discovered, potentially altering the primer's specificity. Similarly, it has been demonstrated how inadequate sequence knowledge in the development of RFLP protocols can affect the accuracy of results significantly (Monis and Andrews, Reference Monis and Andrews1998), and therefore that updates on intra-assemblage variation are regularly required.
Consensus sequence phylograms
The relationships between the assemblages of G. duodenalis were investigated to understand the history of their divergence and their evolution and adaptability to the different hosts. So far, 7 assemblages have been described for G. duodenalis – assemblages A and B (zoonotic), C and D (dogs), E (hoofed livestock), F (cats) and G (rodents). In G. duodenalis the dog associated assemblages C and D cluster together in most phylogenetic analyses as do assemblages A, E and F (Monis et al. Reference Monis, Andrews, Mayrhofer and Ey1999).
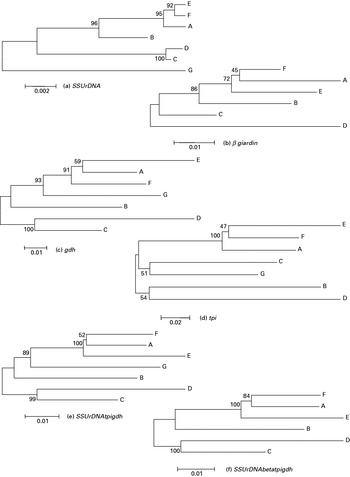
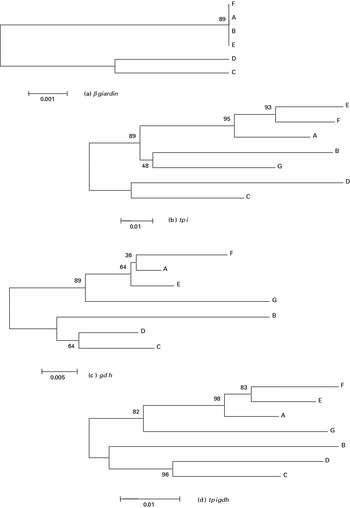
The grouping of dog-associated assemblages C and D was well supported in all nucleotide phylograms except for tpi (Fig. 3). As seen previously, assemblage C groups with assemblage G at the tpi locus (Monis et al. Reference Monis, Andrews, Mayrhofer and Ey1999) and assemblage D with B (Fig. 3d). Since the tpi locus was such a variable locus it was hypothesized that the relationships inferred from the nucleotide sequences may be obscured by the increased substitution rate and that an additional alignment, incorporating only the effects of non-synonymous substitutions, would moderate the results. Conversion of tpi alignment to amino acid sequences resulted in assemblage C clustering with assemblage D with strong bootstrap support (89%, Fig. 4b).
Nucleotide consensus sequence phylograms. (a) SSU rDNA (b) β giardin (c) gdh (d) tpi (e) concatenated sequences (SSU rDNA, tpi and gdh) and (f) concatenated sequences (SSU rDNA, β giardin, tpi and gdh). Scale represents substitutions per nucleotide, bootstrapping given as a percentage of 1000 replicates. Tamura-Nei model with uniform rates among sites.

Amino acid consensus sequence phylograms. (a) β giardin, (b) tpi, (c) gdh, (d) concatenated (tpi and gdh). Scale represents substitutions per nucleotide, bootstrapping given as a percentage of 1000 replicates. Poisson-corrected model.

The relationships demonstrated between assemblages A (zoonotic), E (hoofed livestock) and F (cats) by the different loci were conflicting, amongst the loci and within them – all combinations of clustering between assemblages A, E and F were presented. The only supported relationship, however, was the clustering of assemblages E and F as sister taxa, this occurred both at the SSU rDNA locus (92%, Fig. 3a) and at the tpi locus (93%, Fig. 4b). As seen previously, only the tpi amino acid sequences were able to elucidate the phylogenetic relationships with strong bootstrap support. The remaining loci (gdh and β giardin) were unable to resolve the terminal relationship with any support. For the gdh locus, the nucleotide and amino acid phylograms clustered differently (A/E, 59%, Fig. 3c and A/F, 39%, Fig. 4c respectively) due to the conflicting signals arising from the different nucleotide positions within the codon. Separate analysis of these positions showed the third (most variable) nucleotide position clustered similar to the original nucleotide sequences (A/E, ∼55%, data not shown) and the first nucleotide position (effecting most non-synonymous change) clustered similar to the amino acid sequences (A/F, ∼30%, data not shown). The opposing signals were presumably due to the effects of random-shared substitutions (homoplastic) obscuring the true-shared substitutions (developed before the divergence, synapomorphic) leaving no single strong phylogenetic signal. Interestingly, the second (most conserved) nucleotide position clustered E with F (∼60%, data not shown), as in the SSU rDNA and tpi phylograms. The older relationships appeared to have enough synapomorphic substitutions to outweigh the homoplastic substitutions, as their bootstrap support was strong and their phylogenies constant. The β giardin locus was less able to infer strong phylogenetic relationships than the other loci because of the higher rate of unique substitutions over shared substitutions producing generally weaker bootstrap values (Fig. 3b). In addition to this, the β giardin gene had no non-synonymous substitutions amongst assemblages A, E and F and hence the amino acid sequences (and first and second nucleotide position analyses) provided no information (Fig. 4a). Phylograms from the nucleotide sequences and third nucleotide positions were conflicting and poorly supported (A/F, 45%, Fig. 3b and A/E, ∼50%, data not shown) with the difference in clustering due to the influence of among-site variation (variation within codons or along the gene) on the calculations. When the parameters for this were adjusted, the same clustering was produced for the nucleotide sequences as in the original third nucleotide position phylogram but still with poor support (A/E ∼50%, data not shown). The inability of the β giardin locus to resolve the A/E/F relationship was presumably due to the high rate of unique substitutions introducing enough homoplastic substitutions to the sequences to obscure the signal from the synapomorphic substitutions. Similar to the gdh locus, the older relationships were better defined, with consistent phylogenies and stronger bootstrap values.
Concatenating the sequences from the different loci proved difficult due to the difference in their substitution rates. For the amino acid sequences only the gdh and tpi genes could be equitably concatenated as the β giardin locus had no substitutions (and the SSU rDNA is not translated). This combination clustered assemblages E and F with strong bootstrap support (83%, Fig. 4d) due to the strong influence of the tpi sequences. For the nucleotide sequences, the variation in substitution rates between and within the genes was very large – as demonstrated by the difference in the sequences and nucleotide positions employed for the original analyses. As a consequence of this marked variation, equitable analysis of the concatenated sequences was not possible with the software package utilized. Basic analysis of the concatenated sequences (assuming uniform substitution rates) clustered assemblages A and F with strong support (84%, Fig. 3f), adjusting these analyses for among-site variation, however, resulted in weak support (∼65%, data not shown). Accurate analyses would require specialized software that could include sequence weighting and nucleotide/amino acid combinations. In this way the SSU rDNA locus would not be overshadowed by the influence of the more variable loci (β giardin, gdh and tpi) and the translated tpi sequence (producing strong phylogenetic signals) could be used. For comparative purposes, the ef1α nucleotide alignment also grouped assemblages E and F (Monis et al. Reference Monis, Andrews, Mayrhofer and Ey1999), initially with poor bootstrap support, however upon translation and combination with the tpi and gdh loci, with strong support (Monis et al. Reference Monis, Andrews, Mayrhofer and Ey1999). Conversely, a recent multiple loci analysis (53 isolates over 21 enzymes) employing allozyme electrophoresis, grouped assemblage A with assemblage E (Monis et al. Reference Monis, Andrews, Mayrhofer and Ey2003).
The significance of this apparently close relationship between the cat (F) and hoofed livestock (E) assemblages is unclear. As both assemblages are currently ascribed to domesticated hosts, further samples from wild animals of similar hosts may prove enlightening. Both of the wild artiodactyl sequences available to date were genotyped as assemblage A (Trout et al. Reference Trout, Santin and Fayer2003; van der Giessen et al. Reference Van Der Giessen, De Vries, Roos, Wielinga, Kortbeek and Mank2006). Although the white tailed deer had no greater substitutions away from the majority in the β giardin and tpi alignments, the roe deer sequence contained numerous isolated synonymous substitutions in the gdh alignment. These results may indicate that the white tailed deer was host to the zoonotic assemblage A, but the roe deer was host to a new subgroup of assemblage A. More samples are required to speculate further on the relationships between the cat and hoofed livestock assemblages and the wild and domesticated host samples.
The relationships of assemblage B (zoonotic) and G (rodent), relative to the assemblage A/E/F cluster or C/D cluster, were also conflicting. With both the SSU rDNA and the gdh phylograms (Fig. 3a and c) the bootstrap support was strong for opposite relationships (assemblage B closer to A/E/F in SSU rDNA and assemblage G closer to A/E/F in gdh) and in the tpi phylogram (amino acid, Fig. 4b) they were weakly clustered together. Concatenating the sequences only resulted in the relationship of the ‘stronger’ locus being represented – in both the nucleotide and amino acid alignments the gdh locus dominated the results with more informative sites than the SSU rDNA locus and a stronger phylogenetic signal than the tpi locus respectively (Figs 3e and 4d). The order of these relationships may become clearer in future analyses incorporating more of the tpi gene as well as a β giardin assemblage G sequence. A longer tpi sequence may provide more informative sites (potentially clarifying the order of these relationships) and input from the β giardin loci on distant relationships is predicted to be more instructive than that on the newer relationships. In addition, future analyses employing a suitable out-group would also provide some perspective on these apparently older lineages.
Mixed templates
One of the advantages of the SSU rDNA locus for genotyping is its ability to easily detect mixed templates. Preliminary data from our laboratory (unpublished observations), using combinations of cloned isolates from assemblages A and B, suggest a detection limit of the minority group at around 20–30% with our current SSU rDNA protocols (Read et al. Reference Read, Walters, Robertson and Thompson2002).
There is, however, some uncertainty about the origin of mixed templates. DNA sequence-based studies that have included both cultured and environmental samples, have only found evidence of mixed templates (multiple assemblages detected) in the environmental samples. For example, in the study by Weiss et al. (Reference Weiss, Van Keulen and Nash1992), multiple probes specific for different assemblages bound with single samples in nearly half of the samples analysed and in the study by Read et al. (Reference Read, Monis and Thompson2004), one quarter of the samples amplified at two loci produced a different assemblage result per locus – ‘assemblage swapping’ (results for repeated analyses were not provided). This has lead many researchers to assume that mixed templates arise from mixed/concurrent infections. However, allozyme studies have shown mixed banding patterns in cultured (Meloni et al. Reference Meloni, Lymbery and Thompson1988; Andrews et al. Reference Andrews, Adams, Boreham, Mayrhofer and Meloni1989; Stranden et al. Reference Stranden, Eckert and Kohler1990; Monis et al. Reference Monis, Andrews, Mayrhofer and Ey2003) and cloned (Meloni et al. Reference Meloni, Lymbery and Thompson1989) isolates, suggesting not only potentially mixed samples but also possible allelic polymorphisms and/or post-translational modifications. In addition to this, mechanisms of introgression and retention of ancestral genes have been proposed as possible explanations for examples of ‘assemblage swapping’ detected in some environmental samples (Traub et al. Reference Traub, Monis, Robertson, Irwin, Mencke and Thompson2004).
For the purposes of genotyping (using direct-sequencing methods), qualities like allelic polymorphism and the retention of ancestral genes (that have the ability to generate mixed genotypes at a single locus) and introgression (that has the ability to change genotypes at different loci) are of concern and require investigation. In environmental samples that produce conflicting results, the ability to selectively culture each suspected genotype individually from the original sample (for cloning and reanalysis) would be useful to examine these possibilities. Presently, however, the only genotype that is easily cultured is assemblage A (Nash and Keister, Reference Nash and Keister1985; Meloni and Thompson, Reference Meloni and Thompson1987; Andrews et al. Reference Andrews, Adams, Boreham, Mayrhofer and Meloni1989), due to its wide host range and nutrient adaptability, and few people have investigated in detail the more specific conditions required by the other assemblages (Binz et al. Reference Binz, Thompson, Lymbery and Hobbs1992). In the cultured and cloned isolates producing mixed (allozyme) banding patterns (notably the original BIII and BIV reference isolates), genetic sequence analyses of those mixed loci to establish the presence of allelic polymorphisms, and consequently their segregation (assemblage-specific or not), would be useful. Although most of these loci have not been genetically characterised in Giardia with a set of reference isolates for comparison, this would be straightforward with the aid of the Giardia genome project (McArthur et al. Reference McArthur, Morrison, Nixon, Passamaneck, Kim, Hinkle, Crocker, Holder, Farr, Reich, Olsen, Aley, Adam, Gillin and Sogin2000), the Giardia lamblia Genome Database – GiardiaDB (http://gmod.mbl.edu/perl/site/giardia?page=intro) and their contributions to GenBank. If assemblage-segregating alleles were found, it would be valuable to identify the genes that were stable enough for use in genotyping.
Further to these uncertain traits, the Giardia genome has been demonstrated to be quite plastic – with a high degree of recombination in the telemetric regions of the chromosomes containing the variable surface protein (vsp) and ribosomal repeat unit (rDNA unit) genes (Adam et al. Reference Adam, Aggarwal, Lal, De La Cruz, McCutchan and Nash1988, Reference Adam, Yang and Nash1992; Adam, Reference Adam1992; Le Blancq et al. Reference Le Blancq, Korman and Van Der Ploeg1991b, Reference Le Blancq, Korman and Van Der Ploeg1992) as well as an example of a truncated rDNA unit (Le Blancq et al. Reference Le Blancq, Kase and Van Der Ploeg1991a). The main concern here would be the effect of recombination on the rDNA repeat units used in genotyping. For direct sequencing methods, low levels of variation amongst the rDNA repeat units would go undetected and high levels would result in excessive noise. Since the excess noise is not found, it could be suggested that the recombination events are primarily directed at effecting change in the variable surface protein genes and not the rDNA repeat units. In fact, as this is a standard mechanism for boosting genetic diversity in host defence proteins (Roitt et al. Reference Roitt, Brostoff and Male1996; Buchanan et al. Reference Buchanan, Gruissem and Jones2000) it could be expected that analogous mechanisms would be utilized for pathogen surface proteins.
Conclusions
The current data set was limited in several key areas, namely, there were few lengthy SSU rDNA sequences available, there were few assemblage F and G sequences available (none at some loci), there were no full-length tpi sequences for assemblages C, D, E, F and G and there were too few assemblage B sequences to gauge the extent of the intra-assemblage variability.
All loci were found capable of genotyping to the assemblage and subassemblage (AI/AII) level, although each gene was evidently suited to different applications. The tpi gene, as the most variable, was ideal for its usual application in research focusing on strain identification and was also capable of establishing the closer (more recent) phylogenetic relationships. The gdh gene, with moderate variability, was also suited for analyses on strain identification as well as all genotyping applications (providing numerous informative sites) and some phylogenetic analyses (of the more distantly related assemblages). The β giardin gene, as a unique and conserved locus, has great potential for defining the core subgroups within the assemblages; however, the continuity of these subgroups across all loci must be established. The SSU rDNA was suitable for both subassemblage (AI/AII) level genotyping and phylogenetic analyses and also has potential for defining the core assemblage subgroups (notably within Assemblage B). It remains a well-suited locus for routine genotyping from environmental samples due to its high copy number.
The phylogenetic relationships within Giardia duodenalis, although apparently resolved for the closer (more recently diverged) assemblages, requires more sequence data to establish those remaining. More complete sequences for tpi and β giardin (representing all assemblages) and analyses incorporating an out-group may be sufficient, but more loci may be required.
The current issues surrounding mixed templates demonstrate a need for more research on culturing and cloning different assemblages of Giardia. Cloned isolates will be required to investigate the potential allelic polymorphisms and introgression and so representatives from each assemblage would provide a more comprehensive analysis.