


Recent macro-finance literature emphasizes that stock market investors mainly care about risks associated with low-frequency fluctuations such as long-run technological change [see e.g. Dew-Becker and Giglio (Reference Dew-Becker and Giglio2016)]. However, there is a shortage of models that can rationalize these long-run risks and which can jointly match macroeconomic and financial data. The earlier literature with a fixed number of goods suffers from what Li and Palomino (Reference Li and Palomino2014 LP for short) call the “translation problem”: macroeconomic volatility translates into asset return volatility to a very limited extent even when payoffs are calibrated to be as volatile as the data.
We depart from the earlier literature with a fixed number of goods. In our model, asset payoffs are, implicitly, based on an expanding variety of goods. A new variety is associated with a new firm which is subject to a sunk entry cost and a time-to-build lag in production as in Bilbiie et al. (Reference Bilbiie, Ghironi and Melitz2007, Reference Bilbiie, Ghironi and Melitz2012). We show that uncertainty about variety (firm) growth leads to endogenous fluctuations in productivity creating long-run risks which are reflected in higher and more volatile excess returns. Following the long-run risks literature we assume that agents in our model have preference for early resolution of uncertainty (i.e. Epstein-Zin preferences) meaning that they associate risks with variation in expected future consumption and leisure.
We contribute to the macro-finance literature on long-run risks by showing that technology-driven uncertainty about variety growth induces persistent variation in expected consumption growth and asset prices. According to Bansal and Yaron (Reference Bansal and Yaron2004), three features are necessary for a macro-finance model to be successful at generating long-run risks: (i) persistent expected consumption growth component, (ii) significant variation in expected consumption growth, and (iii) preference for an early resolution of uncertainty. We show that the firm entry model satisfies all the previous requirements for long-run risks to emerge. Our calibration of the model ensures that Epstein-Zin preferences lead to an early resolution of uncertainty so that requirement (iii) is easily satisfied. (i) and (ii) are discussed below.
Technology-induced uncertainty about variety growth and the fact that new products are available with delay due to barriers to firm entry drive persistent and significant variation in expected consumption growth in our model and, hence, (i) is satisfied. Specifically, bad supply shocks in the entry model imply low current and future consumption. Indeed, the entry model produces positive autocorrelation in consumption growth and, hence, a positive correlation between current and expected consumption growth, whereas the autocorrelation of consumption growth in the no-entry model is virtually zero, and variables exhibit fast mean reversion following shocks. For instance, negative supply shocks in the no-entry model depress current consumption but are good news for future consumption. In the entry model, however, negative shocks are bad news to current and future consumption as well.
To further highlight sources of long-run risks, we show that expected consumption growth resulting from the entry model endogenously is similar to the exogenous process used by Bansal and Yaron (Reference Bansal and Yaron2004). Specifically, we fit an AR(1) process to expected consumption growth from the entry model and show that its persistence and variation are similar to the exogenous growth process in Bansal and Yaron (Reference Bansal and Yaron2004).
To motivate the paper, we consider a four-variable recursive vector autoregression with the following ordering of the variables: total factor productivity (TFP), per capita real output, an indicator of the active number of firms (cumulated number of firm birth minus firm death), and the excess return on equity calculated as the difference between the one-year expected return on the portfolio of S&P500 firms and the 3-month risk-free rate. Total factor productivity is calculated as a residual from a simple Cobb-Douglas production function with capital and labor. We include a constant in the regression.
Following a positive shock to TFP, profits increase and firms enter. The positive wealth effect of the productivity shock raises output and asset prices and leads to lower risk perception making our measure of the expected risk premium decline. The number of active firms increases to small extent on impact but rises over time. Our result is robust to various orderings of the variables or including consumption (instead of output) in the regression.
Uncertainty about firm entry leads to a change in asset valuations: there is extra volatility in the pricing kernel due to the comovement of its short- and long-run components.Footnote 1 In particular, we follow Li and Palomino (Reference Li and Palomino2014 LP) and decompose the stochastic discount factor into short- and a long-term components. The short-term component is related to current consumption and labor income. The long-term component is linked to future consumption and labor income. In the entry model, bad shocks to current consumption (labor income) are also bad news for future consumption (labor income). Unlike the no-entry model where the short- and long-run components move in opposite directions, firm entry induces them to comove positively making the pricing kernel more volatile and leading to a higher price of risk on consumption and labor income claims.
We carefully explain how each feature of our model with firm entry contributes to the high and volatile equity premium. In particular, we assess the importance of (i) the intertemporal elasticity of substitution (IES), (ii) the choice of preferences (separable or non-separable in consumption and hours worked), (iii) price rigidity, and (iv) the form of the interest rate rule. We also explain why our model is more successful in addressing the translation puzzle relative to LP.
Our benchmark parametrization features an IES
 $\gt$
1 meaning that there is complementarity between current and future consumption as well as between current and the continuation value of utility. With an expanding product variety and preference for future consumption through IES
 $\gt$
1, the possibility of negative technology shocks in the future signifies larger losses and significant long-run risks which are reflected in asset prices today due to forward-looking risk-averse households.
However, IES
 $\lt$
1 suggest consumption smoothing and the continuation value of utility which is needed for a significant long-run risk component has limited role [see also Croce (Reference Croce2014)]. Indeed, the variation in the long-run component of the pricing kernel is much lower with IES
 $\lt$
1 leading to a reduction in long-run risks. However, firm entry produces higher risk premium even with IES
 $\lt$
1 as it implies more variation in the short-run component of the pricing kernel relative to the no-entry model.
Separable preferences between consumption and labor imply that technology shocks have a negative wealth effect making labor either countercyclical (IES
 $\lt$
1) or procyclical (IES
 $\gt$
1) but less than with GHH preferences. Hence, separable preferences reduce the procyclicality of labor and lead to lower price of risk.
With separable preferences, the entry model performs better than no-entry in terms of financial first and second moments due to the higher variation in the short- and long-run components of the pricing kernel. The correlation between the short and long components is negative, however, even in the entry model with separable preferences indicating the lack of long-run risks. Hence, the magnitude of the equity premia in the entry model (76 basis points) falls short of its empirical counterpart (630 basis points).
However, our benchmark model is equipped with GHH utility which implies complementary relationship between consumption and labor. Hence, labor is procyclical amplifying the propagation of technology shocks and increasing the comovement of returns with output and consumption. With GHH utility, the entry model can produce significant long-run risks as there is positive correlation not just between current and expected consumption but also between current and expected labor.
Sticky prices generate more variation in expected consumption than flexible prices due to time-varying markups. Flexible prices mean that firms set their markups optimally at a constant level. With flexible prices, firms react less by changes in inputs and production relative to sticky prices. Less procyclicality in labor demand then translates into lower volatility in asset payoffs, returns, and lower risk premia. With sticky prices markup is time-varying, and consumption is less tightly linked to technology implying a lower variation in realized consumption growth relative to flexible prices where they are more tightly connected.Footnote 2 With flexible prices expected, consumption growth is less volatile, and the correlation between the short- and long-run parts of the pricing kernel is also lower. The upshot is a ninety basis points reduction in long-run risks as well as the risk premia relative to the benchmark case with sticky prices.
We study the sensitivity of our results to the introduction of a more realistic interest rate rule (so-called Taylor rule). The introduction of a reaction to the output growth by itself implies higher interest rate, lower output, and higher risk premia. Interest rate smoothing reduces the coefficients on inflation and output growth leading to lower macroeconomic volatility and the associated risks. Interest rate smoothing dominates the effect of the introduction of a positive coefficient on the output growth regarding the excess return. Hence, overall, the unconditional mean of the equity risk premia reduces by 100 basis points to 488 basis points with a Taylor rule relative to the benchmark calibration.
Further, we show that a Taylor rule can help the model generate countercyclical expected excess returns to positive technology shocks as in the data. Following a positive technology, shock interest rate smoothing implies less procyclicality in output and asset payoffs and a corresponding reduction in the expected risk premia.
The LP model generates long-run risks due to permanent technology shocks. They claim that permanent shocks generate positive comovement between the short- and long-run components of the pricing kernel making the whole pricing kernel as well as asset returns more volatile, whereas firm entry with transitory technology shocks features extra amplification and persistence in response to shocks and have permanent shock-like features. The higher amplification raises the standard deviation of the two components of the pricing kernel. The additional persistence makes the correlation between the short and long components positive generating long-run risks. The LP model generates positive risk premia in the case of nominal wage rigidity similar to Favilukis and Lin (Reference Favilukis and Lin2016). Whereas the entry model in our paper implies high equity premia even without wage rigidity.
The firm entry model matches the autocorrelation of consumption growth in US data and generates higher long-run risks than the LP model where the autocorrelation in consumption growth is close to zero or negative even when IES
 $\gt$
1. In LP, varieties are fixed. However, households in our model demand additional risk premium for holding assets with payoffs fluctuating more due to the technology-induced uncertainty about variety growth. The endogenous change in technology following entry-exit generates the additional amplification and persistence which is missing from the LP model and which helps address the translation problem.
Statistical agencies rarely adjust the consumption basket to include new products. At the beginning of the product cycle, a new product is introduced at a high price but cheaper and better versions appear through time putting downward pressure on the model-based price index that contains the variety effect (see also Scanlon (Reference Scanlon2019) for similar argument). To compare model moments to data moments, we remove the variety effect from each model-based variable in line with Bilbiie et al. (Reference Bilbiie, Ghironi and Melitz2007). Importantly, our model does not generate excess variation in the consumption growth without variety. Further, the uncertainty about variety growth induces higher precautionary savings keeping the risk-free rate low and stable.
The return on the wealth portfolio (composed of the consumption and labor income claims) is unobservable, and hence, we match the excess return on the market portfolio based on S&P 500 firms. Aggregate dividends are linked to aggregate output and, therefore, exhibit a procyclical pattern.Footnote 3 The return on dividends can be decomposed into dividend growth and changes in the price-dividend ratio. We find that the entry model better matches the standard deviation of dividend growth and the price-dividend ratio. Overall, the entry model matches 60% of the excess return on the aggregate dividend claim, whereas the mean of the excess return is close to zero in the no-entry model. The firm entry model, thus, successfully addresses the translation problem and captures all of the standard deviation in the excess return while the no-entry model fits only a small fraction of it.
Related literature. Our model can be further motivated empirically from four directions of the literature. First, the paper by Broda and Weinstein (Reference Broda and Weinstein2010) uses product bar codes and confirms the findings of Bernard et al. (Reference Bernard, Redding and Schott2010) on the importance of the high share of new products in total production. Further, they document that product creation is strongly procyclical at a business cycle frequency. Second, studies in industrial organization point to the importance of entry costs and other barriers for firms to enter an industry [see e.g. Corhay et al. (Reference Corhay, Kung and Schmid2020)]. Third, Scanlon (Reference Scanlon2019) shows evidence on the procyclical nature of brand growth and calibrates an endowment economy featuring brand growth to US data. He also uses the endowment model in the long-run risk setting of Bansal and Yaron (Reference Bansal and Yaron2004) and points to its merits in explaining asset prices. Fourth, Croce (Reference Croce2014) provides empirical evidence on the positive connection between long-run productivity risk and excess returns.
Different from the earlier literature where long-run risks emerge endogenously in a production model with capital accumulation [see e.g. Kaltenbrunner and Lochstoer (Reference Kaltenbrunner and Lochstoer2010) and Croce (Reference Croce2014)], our model features the “accumulation” of firms. Our model is similar to the free entry model (no-entry costs and timing frictions) of Kaszab et al. (Reference Kaszab, Marsal and Rabitsch2022) in the sense that firm entry implies more volatility in the pricing kernel and leads to an endogenous component of productivity which magnifies consumption risk. The free entry model, however, amplifies short-run risks and cannot engineer long-run risk in a setup with Epstein-Zin curvature.
Our paper aligns with Corhay et al. (Reference Corhay, Kung and Schmid2020) who focus on the joint explanation of time-varying markups and excess returns. Their model features both product and process innovation. In particular, their product innovation part is based on the firm entry model of Bilbiie et al. (Reference Bilbiie, Ghironi and Melitz2007) while their process innovation is driven by the endogenous growth model of Kung and Schmid (Reference Kung and Schmid2015). Different from our model where markups are time-varying due to price-setting frictions, the Corhay et al. (Reference Corhay, Kung and Schmid2020) model contains oligopolistic competition whereby the markup (and the elasticity of substitution among varieties) depends on the number of firms. We are also related to Scanlon (Reference Scanlon2019) where he considers the asset pricing implications of new products (product groups and brands). The payoff streams in his models are exogenously specified whereas they are endogenous in our models.
The paper proceeds as follows. Section one contains the empirical VAR model. Section two contains description of the firm entry model and asset pricing. Section three explains how the model is parameterized. Section four presents impulse responses to a technology shock, discusses model features necessary to produce long-run risks, and compares moments from the model simulations to equivalent statistics from US data. Finally, we conclude.
1. Empirical motivation
We motivate our model with a simple empirical exercise. In the spirit of Etro and Colciago (Reference Etro and Colciago2010), we calculate the Solow residual as the measure of the technology shock from US data 1992Q3-2018Q4.Footnote 4 We use a VAR with four lags and identify the technology shock in the standard recursive way, and variables are ordered as total factor productivity (TFP), real per capita output, an indicator of net business formation (the cumulated difference between firm birth and death), and one-year expected excess returns on stocks.Footnote 5 All variables are logged and detrended with a second-order polynomial. This ordering is motivated by our theoretical model and is also similar to the ordering in Savagar (Reference Savagar2021) and Savagar and Dixon (Reference Savagar and Dixon2020). Unlike previous papers, we have a macro-financial focus and also include the expected excess stock return in the VAR.
Figure 1 shows the responses of variables to one-standard deviation shock in TFP. The vertical axis measures variables in percentage deviation from the trend. The one-year excess return is annualized. Time is measured in quarters on the horizontal axis. The responses of TFP, output, and firm entry are similar to the ones in Savagar and Dixon (Reference Savagar and Dixon2020). In line with our theoretical model featuring interest rate smoothing, the expected excess return reduces on impact, although with some uncertainty—see the 95% confidence intervals bootstrapped with 10,000 replications. The rise in TFP induces a statistically significant rise in output. It further leads to future profit opportunities which induce firm entry. Our results are robust to alternative orderings of the variables and when output is replaced with consumption in the regression.Footnote 6 A constant is included in the regression.
Impulse responses of variables to a one-standard deviation rise in technology from a recursive VAR(4). Notes: variables are measured as percentage deviation from the trend. The expected excess return on stocks is annualized. 95% confidence intervals are bootstrapped with 10,000 replications.

2. Entry-exit model with frictions
We start with the description of the households. We follow Bilbiie et al. (Reference Bilbiie, Ghironi and Melitz2007) in that firms pay a sunk entry cost which is expressed in consumption units. To make the mechanisms transparent, we abstract from physical capital in the model and use labor as the only input of production as in Li and Palomino (Reference Li and Palomino2014).
2.1. The household’s problem
The representative household consumes a continuum of goods defined over the measure
 $N_{t}$
:
 $C_{t}=\left ( \int _{0}^{N_{t}}c_{t}(\omega )^{\frac{\theta -1}{\theta }}d\omega \right ) ^{\frac{\theta }{\theta -1}}$
where the elasticity of substitution among goods is constant and given by
 $\theta \gt1$
. The nominal price of a particular good
 $\omega$
is denoted as
 $p_{t}(\omega )$
. The aggregation of individual goods results in the welfare-based (CPI) price index:
 $P_{t}=\left ( \int _{0}^{N_{t}}p_{t}(\omega )^{1-\theta }d\omega \right ) ^{\frac{1}{1-\theta }}$
. The representative household maximizes the continuation value of its utility (
 $V$
) which has Epstein-Zin form:
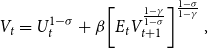 \begin{equation} V_{t}=U_{t}^{1-\sigma }+\beta \!\left [ E_{t}V_{t+1}^{\frac{1-\gamma }{1-\sigma }}\right ] ^{\frac{1-\sigma }{1-\gamma }}, \end{equation}
with respect to its flow budget constraint (derived below).
 $\beta \in (0,1)$
is the subjective discount factor. Utility (
 $U$
) at period
 $t$
is derived from consumption (
 $C_{t}$
) and leisure (
 $1-L_{t}$
) and is of the non-separable form proposed by Greenwood et al. (Reference Greenwood, Hercowitz and Huffmann1988):
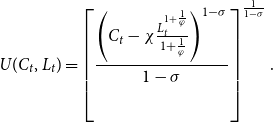 \begin{equation} U(C_{t},L_{t})=\left [ \frac{\left ( C_{t}-\chi \frac{L_{t}^{1+\frac{1}{\varphi }}}{1+\frac{1}{\varphi }}\right ) ^{1-\sigma }}{1-\sigma }\right ] ^{\frac{1}{1-\sigma }}. \end{equation}
In the expression (2),
 $\sigma$
is related to the inverse of the intertemporal elasticity of substitution (IES) as
 $\sigma ^{-1}/(1+\varphi )$
, where
 $\varphi$
is the Frisch elasticity of labor supply to wages.
 $\chi \gt0$
pins down hours worked in steady state. The connection between the coefficient of relative risk aversion (
 $CRRA$
) and parameter
 $\gamma$
of the recursive utility in equation (1) is given by [for steps of the derivations see Swanson (Reference Swanson2012)]:
 \begin{equation*} \textit{CRRA}\simeq \left [ \sigma +\frac {\gamma -\sigma }{1-\sigma }\left ( 1-\sigma \right ) \right ] (1+\varphi ). \end{equation*}
The previous expression tells us that CRRA increases with Frisch elasticity. With GHH utility, the wealth effect of the technology shock on labor supply is eliminated, and labor input becomes persistently procyclical. Unlike separable preferences, labor does not have insurance property in the case of bad shocks.Footnote
7
Hence, more flexible labor supply (
 $\varphi$
higher) implies more risks (asset returns more procyclical) and households show higher aversion to risks (CRRA is higher). As a result, the propagation of the technology shock is stronger: consumption and dividends exhibit higher comovement and carry higher a price of risk.
Households possess two types of assets: shares in a mutual fund of firms and government bonds. Let
 $x_{t}$
denote the share in the mutual fund of firms entering period
 $t$
. In each period, the mutual fund pays the representative household the total profit (in units of currency) of all firms that produce in that period,
 $P_{t}N_{t}d_{t}$
. In period
 $t$
, the representative household purchases
 $x_{t+1}$
shares in a mutual fund of
 $N_{H,t}\equiv N_{t}+N_{E,t}$
firms where the first term refer to firms already operating at time
 $t$
while the second term stands for the new entrants. Only
 $N_{t+1}=(1-\delta )N_{H,t}$
firms will produce and pay dividends at time
 $t+1$
. As the household has no information about which
 $\delta$
share of firms are induced to leave the market at the end of period
 $t$
, it finances the continuing operation of all preexisting firms and all new entrants during period
 $t$
.
The nominal price of a claim to the future profit stream of the mutual fund of
 $N_{H,t}$
firms at time
 $t$
equals to
 $S_{t}^{\text{ex,nom}}\equiv P_{t}S_{t}^{ex}$
where the superscript
 $\text{ex,nom}$
marks the ex-dividend price in nominal terms. At time
 $t$
, the representative household holds nominal bonds and a share
 $x_{t}$
in the mutual fund. It receives labor income,
 $W_{t}L_{t}$
, interest income
 $i_{t-1}$
on nominal bonds. The share in the mutual fund brings dividend income (in nominal terms),
 $D_{t}^{\text{nom}}\equiv P_{t}d_{t}$
, plus the current nominal value of selling the shares,
 $S_{t}^{\text{ex,nom}}$
. Therefore, the period budget constraint of the representative household (in units of currency) can be written as:
 \begin{equation*} B_{N,t+1}+S_{t}^{\text{ex,nom}}N_{H,t}x_{t+1}+P_{t}C_{t}=(1+i_{t-1})B_{N,t}+(D_{t}^{\text{nom}}+S_{t}^{\text{ex,nom}})N_{t}x_{t}+W_{t}L_{t}+T_{t}^{L}\end{equation*}
where
 $D_{t}^{\text{nom}}$
stands for the nominal value of dividends,
 $D_{t}^{\text{nom}}\equiv P_{t}d_{t}$
,
 $1+i_{t}$
is the gross nominal interest rate, and
 $T_{t}^{L}$
are lump-sum taxes in nominal terms.
Based on the Dixit-Stiglitz functional form for the consumption bundle and price aggregators, the connection between relative prices and the number of firms (varieties) in the symmetric equilibrium is given by:
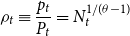 \begin{equation} \rho _{t}\equiv \frac{p_{t}}{P_{t}}=N_{t}^{1/(\theta -1)} \end{equation}
where
 $1/(\theta -1)$
is net markup. The consumer price index (
 $P_{t}$
) differs from the producer price index (
 $p_{t}$
) as the former does not include the effect of rising varieties captured
 $N_{t}^{1/(\theta -1)}$
.
Let PPI and CPI inflation rates be denoted, respectively, by
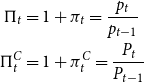 \begin{align*} \Pi _{t} & =1+\pi _{t}=\frac{p_{t}}{p_{t-1}}\\ \Pi _{t}^{C} & =1+\pi _{t}^{C}=\frac{P_{t}}{P_{t-1}} \end{align*}
where
 $\pi _{t}$
and
 $\pi _{t}^{C}$
are the net while
 $\Pi _{t}$
and
 $\Pi _{t}^{C}$
are the gross PPI and CPI inflation rates, respectively. Hence, the connection between PPI and CPI inflation comes from the variety effect:
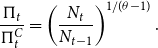 \begin{equation} \frac{\Pi _{t}}{\Pi _{t}^{C}}=\left ( \frac{N_{t}}{N_{t-1}}\right ) ^{1/(\theta -1)}. \end{equation}
Next, we list the optimality conditions of the households.
The intratemporal condition is given by:
 \begin{equation} w_{t}=\chi L_{t}^{1/\varphi }. \end{equation}
The bond Euler equation:
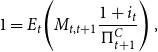 \begin{equation*} 1=E_{t}\!\left ( M_{t,t+1}\frac {1+i_{t}}{\Pi _{t+1}^{C}}\right ), \end{equation*}
where the stochastic discount factor is given by:
 \begin{equation} M_{t,t+1}=\beta \frac{\text{MUC}_{t+1}}{\text{MUC}_{t}}\left ( \frac{V_{t+1}^{1/(1-\sigma )}}{\tilde{V}_{t}^{1/(1-\gamma )}}\right ) ^{\sigma -\gamma }\text{where }\tilde{V}_{t}\equiv E_{t}V_{t+1}^{\frac{1-\gamma }{1-\sigma }}\text{.} \end{equation}
Based on the function form in expression (2), the marginal utility of consumption is given by
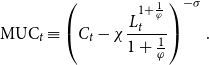 \begin{equation} \text{MUC}_{t}\equiv \left ( C_{t}-\chi \frac{L_{t}^{1+\frac{1}{\varphi }}}{1+\frac{1}{\varphi }}\right ) ^{-\sigma }. \end{equation}
The share Euler equation can be written as:
 \begin{equation*} 1=(1-\delta )E_{t}\!\left ( M_{t,t+1}\frac {S_{t+1}^{\text{ex}}+d_{t+1}}{S_{t}^{\text{ex}}}\right ), \end{equation*}
where
 $S_{t}^{\text{ex}}\equiv S_{t}^{\text{ex,nom}}/P_{t}$
is the real ex-dividend share price and firm-level dividends,
 $d_{t}$
, follow:
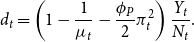 \begin{equation*} d_{t}=\left ( 1-\frac {1}{\mu _{t}}-\frac {\phi _{P}}{2}\pi _{t}^{2}\right ) \frac {Y_{t}}{N_{t}}. \end{equation*}
2.2. The firms’ problem
There are two types of firms. Final good firms bundle goods produced by intermediaries. The cost-minimization problem of the final good firms leads to the total demand schedule for product
 $\omega$
:
 \begin{equation} y_{t}(\omega )=\left ( \frac{p_{t}(\omega )}{P_{t}}\right ) ^{-\theta }(C_{t}+\text{PAC}_{t}), \end{equation}
where
 $\text{PAC}_{t}=N_{t}\text{pac}_{t}$
denotes the nominal value of aggregate price adjustment costs [firm-level price adjustment costs are defined in equation (10)]. Intermediaries take the demand schedule in equation (8) as given when maximizing their profits.
There is a mass of intermediary firms. Firm
 $\omega$
employs labor,
 $l_{t}(\omega )$
, in order to produce output,
 $y_{t}(\omega )$
, using a constant-return-to-scale technology:
 $y_{t}(\omega )=Z_{t}l_{t}(\omega )$
where
 $Z_{t}$
is a stationary productivity shock:
 \begin{equation*} \log Z_{t}=\rho _{Z}\log Z_{t-1}+\varepsilon _{t}^{Z}\text {,}\end{equation*}
where
 $\varepsilon _{t}^{Z}$
is an independently and identically distributed (iid) stochastic technology disturbance with mean zero and variance
 $\sigma _{Z}^{2}$
. The unit cost of production is the real marginal cost which is given by
 $w_{t}/Z_{t}$
where
 $w_{t}\equiv W_{t}/P_{t}$
is the real wage.
There is also a mass of prospective entrants. Firms pay an entry cost of
 $f_{E}$
in consumption units. Each period
 $\delta$
fraction of firms exit. New entrants (
 $N_{E}$
) and incumbents survive with probability
 $1-\delta$
. The model features a time-to-build lag in the sense that firms entering at time
 $t$
start to produce one period later. Therefore, the number of active firms at period
 $t$
,
 $N_{t}$
, is described by:
 \begin{equation} N_{t}=(1-\delta )(N_{t-1}+N_{E,t-1}). \end{equation}
Adjusting prices is costly for intermediary goods-producing firms. Hence, nominal rigidity is introduced in the form of price adjustment costs that can be described with a quadratic function as in Rotemberg (Reference Rotemberg1982):
 \begin{equation} \text{pac}_{t}(\omega )=\frac{\phi _{P}}{2}\left [ \frac{p_{t}(\omega )}{p_{t-1}(\omega )}-1\right ] ^{2}p_{t}(\omega )y_{t}(\omega ) \end{equation}
where
 $\phi _{P}$
governs the strength of price adjustment costs. The real profits of firm
 $\omega$
at time
 $t$
(transferred back to households in the form of dividends) are given by:
 \begin{equation} d_{t}(\omega )=\frac{p_{t}(\omega )}{P_{t}}y_{t}(\omega )-w_{t}l_{t}(\omega )-\frac{\text{pac}_{t}(\omega )}{P_{t}}. \end{equation}
Firms face a death shock occurring with probability
 $\delta \in (0,1)$
in each period. In each period, firm
 $\omega$
continues with probability
 $1-\delta$
and maximizes profits by choosing
 $p_{t}(\omega )$
optimally:
 \begin{equation} \underset{p_{t}(\omega )}{\max }E_{0}\left \{{\displaystyle \sum \limits _{t=0}^{\infty }} [\beta (1-\delta )]^{t}M_{t,t+1}d_{t}(\omega )\right \}, \end{equation}
with respect to equations (3), (11), and (8). Optimal choice of the firm leads to the pricing condition:
 \begin{equation*} \frac {p_{t}(\omega )}{P_{t}}=\mu _{t}\frac {w_{t}}{Z_{t}}\end{equation*}
where
 $\mu _{t}$
denotes the gross markup function which is time-varying due to sticky prices:
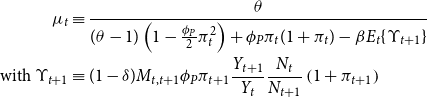 \begin{align*} \mu _{t} & \equiv \frac{\theta }{(\theta -1)\left ( 1-\frac{\phi _{P}}{2}\pi _{t}^{2}\right ) +\phi _{P}\pi _{t}(1+\pi _{t})-\beta E_{t}\!\left \{ \Upsilon _{t+1}\right \} }\\ \text{with }\Upsilon _{t+1} & \equiv (1-\delta )M_{t,t+1}\phi _{P}\pi _{t+1}\frac{Y_{t+1}}{Y_{t}}\frac{N_{t}}{N_{t+1}}\left ( 1+\pi _{t+1}\right ) \end{align*}
where
 $\pi _{t}\equiv \log\! (p_{t}/p_{t-1})=\log\! (\Pi _{t})$
. In the zero inflation steady state (
 $\pi =0$
), the gross markup is given by
 $\mu \equiv \theta/(\theta -1)$
.
 $M_{t,t+1}$
is the stochastic discount factor defined in equation (6).
The value of the firm is linked to the entry cost (free entry condition) as:
 \begin{equation*} S_{t}^{\text{ex}}=f_{E}. \end{equation*}
The free entry condition helps to pin down the number of firms in equilibrium.
2.3. Monetary policy
Monetary policy is described by a simple Taylor rule of the form:
 \begin{equation} R_{t}=\frac{1}{\beta }R_{t-1}^{\rho }\left [ (\Pi _{t})^{\phi _{\pi }}\left ( Y_{t}^{R}/Y_{t-1}^{R}\right ) ^{\phi _{Y}}\right ] ^{1-\rho }, \end{equation}
where
 $R_{t}\equiv 1+i_{t}$
is the gross nominal interest rate and inflation is zero in the steady state. Coibion and Gorodnichenko (Reference Coibion and Gorodnichenko2011) as well as Sims (Reference Sims2013) mention two reasons why it is better to include output growth in the Taylor rule instead of measures of the output gap: (i) output growth is observable in real time to policymakers while output gap estimates display great variety and (ii) output growth targeting induces welfare gains relative to output gap targeting. Hence, our robustness check with a Taylor rule includes output growth as a measure of the output gap.
2.4. Equilibrium
In the symmetric equilibrium, all firms make identical choices so that
 $p_{t}(\omega )=p_{t}$
,
 $d_{t}(\omega )=d_{t}$
,
 $y_{t}(\omega )=y_{t}$
,
 $S_{t}^{\text{ex}}(\omega )=S_{t}^{\text{ex}}$
,
 $l_{t}(\omega )=l_{t}$
,
 $\mu _{t}(\omega )=\mu$
, and
 $\text{pac}_{t}(\omega )=\text{pac}_{t}$
. Net bond holdings are zero
 $B_{t}=B_{t+1}=0$
and
 $x_{t}=x_{t+1}=1$
.
The labor market clearing is given by:
 \begin{equation} L_{t}=N_{t}l_{t}. \end{equation}
The aggregate production function can be derived as:
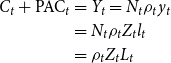 \begin{align*} C_{t}+\text{PAC}_{t} & =Y_{t}=N_{t}\rho _{t}y_{t}\\ & =N_{t}\rho _{t}Z_{t}l_{t}\\ & =\rho _{t}Z_{t}L_{t} \end{align*}
The last row contains the aggregate production function, and the term
 $\rho _{t}$
can be interpreted as an endogenous component of productivity. The full list of equilibrium conditions can be found in the online appendix.
2.5. Asset prices
In this subsection, we show how we price claims on various cash flows such as consumption, output, dividends, and labor income.
The real cum-dividend price,
 $S_{t}^{\mathcal{Q}}$
, of a cash flow
 $\{\mathcal{Q}_{t+s}\}_{s=0}^{\infty }$
is given by
 \begin{equation*} S_{t}^{\mathcal {Q}}\equiv E_{t}\!\left [{ \sum \limits _{s=1}^{\infty }} M_{t,t+s}\mathcal {Q}_{t+s}\right ] \end{equation*}
Note that we price a claim on consumption (
 $\mathcal{Q}_{t}=C_{t}$
), labor income (
 $\mathcal{Q}_{t}=\text{LI}_{t}=\frac{W_{t}}{P_{t}}L_{t}$
), etc. The stochastic discount factor is model-specific and is used to price the cash flow of various claims.
The previous expression can alternatively be written recursively as:
 \begin{equation*} S_{t}^{\text{AD}}=\text{AD}_{t}+E_{t}\{M_{t,t+1}S_{t+1}^{\text{AD}}\}, \end{equation*}
where
 $\mathcal{Q}_{t}=\text{AD}_{t}=N_{t}d_{t}$
, and
 $S_{t}^{\text{AD}}$
is the cum-dividend price of the aggregate dividend claim.
The previous expression can be written in Euler equation form as:
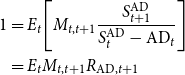 \begin{align*} 1 & =E_{t}\!\left [ M_{t,t+1}\frac{S_{t+1}^{\text{AD}}}{S_{t}^{\text{AD}}-\text{AD}_{t}}\right ] \\ & =E_{t}M_{t,t+1}R_{\text{AD},t+1} \end{align*}
where the return on the AD claim is given by:
 \begin{equation} R_{\text{AD},t+1}\equiv \frac{S_{t+1}^{\text{AD}}}{S_{t}^{\text{AD}}-\text{AD}_{t}}=\frac{P_{t+1}^{\text{AD}}}{P_{t}^{\text{AD}}-1}\frac{\text{AD}_{t+1}}{\text{AD}_{t}} \end{equation}
where
 $P_{t}^{\text{AD}}\equiv S_{t}^{\text{AD}}/\text{AD}_{t}$
is the price-dividend ratio. Our measure of equity risk premium is the levered excess return based on aggregate dividends:
 \begin{equation*} \text{EQPR}_{t}=\phi _{{lev}}(\ln R_{\text{AD},t}-\ln R_{f,t-1}), \end{equation*}
where the excess return is leveraged (see the leverage factor
 $\phi _{{lev}}$
) as in Croce (Reference Croce2014). Aggregate dividends are linked to aggregate output and, hence, follow its procyclical pattern.
2.6. The adjusted wealth portfolio
We follow Li and Palomino (Reference Li and Palomino2014) and use the so-called return representation of the pricing kernel to identify its short- and long-run components. The return representation includes the return on the adjusted wealth portfolio in the pricing kernel instead of the continuation value of utility which is difficult to interpret. In particular, the cash flow of the adjusted wealth portfolio (containing the consumption and labor income claims) is linked to current and future consumption and labor income streams.
Let
 $Q_{t}$
denote cash flow for the claim on the adjusted wealth portfolio:
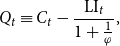 \begin{equation} Q_{t}\equiv C_{t}-\frac{\text{LI}_{t}}{1+\frac{1}{\varphi }}, \end{equation}
where
 $\text{LI}_{t}=\frac{W_{t}}{P_{t}}L_{t}$
. The SDF in equation (6) can be written in its return form as (for steps of the derivations see the online appendix of LP):
 \begin{equation} M_{t,t+1}=E_{t}\!\left ( \beta \frac{\text{MUC}_{t+1}}{\text{MUC}_{t}}\right ) ^{\vartheta }(R_{Q,t})^{\vartheta -1}. \end{equation}
where
 $\vartheta \equiv \frac{1-\gamma }{1-\sigma }$
. We take the natural log of equation (17) and identify the short- and long-run components as in Li and Palomino (Reference Li and Palomino2014):
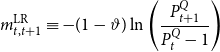
 \begin{equation} m_{t,t+1}=\vartheta \ln \beta +E_{t}m_{t,t+1}^{\text{SR}}+E_{t}m_{t,t+1}^{\text{LR}} \end{equation}
where
 \begin{align} m_{t,t+1}^{\text{SR}} &\equiv -\vartheta \Delta \text{muc}_{t+1}-(1-\vartheta )\Delta q_{t+1} \end{align}
 \begin{align} m_{t,t+1}^{\text{LR}} &\equiv -(1-\vartheta )\ln \left ( \frac{P_{t+1}^{Q}}{P_{t}^{Q}-1}\right )\end{align}
where
 $\Delta \text{muc}_{t+1}=\ln\! (\Delta \text{MUC}_{t+1})$
,
 $\Delta q_{t+1}=\ln\! (\Delta Q_{t+1})$
, and
 $\ R_{Q,t}$
is decomposed into the log of price-cash flow ratio and the log of the growth rate of
 $Q$
[similar to equation (15)]. Hence, the short-run component,
 $m_{t,t+1}^{\text{SR}}$
contains the log of consumption and labor income growth while the long-run component is related to the log of price-cash flow ratio on the adjusted wealth portfolio.
The price-cash-flow ratio and the return on the
 $Q$
claim is, however, related to the discounted future utility from future consumption and labor income streams. In the entry model, bad shocks to current consumption and labor income are also bad news for future consumption and labor income implying long-run risks. Hence, the short- and long-term components comove positively with firm entry resulting in more volatile pricing kernel and a higher price of risk on the consumption and labor income claims.
2.7. Closed-form illustration
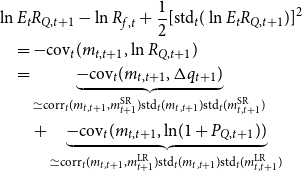
To understand determinants of the excess return on the adjusted wealth portfolio, we assume that
 $M_{t,t+1}$
and
 $R_{Q,t+1}$
are jointly conditionally lognormally distributed and derive an analytical expression for the excess return on claim
 $Q$
as follows (for similar derivations see LPFootnote
8
):
 \begin{align} & \ln E_{t}R_{Q,t+1}-\ln R_{f,t}+\frac{1}{2}[\text{std}_{t}(\ln E_{t}R_{Q,t+1})]^{2}\nonumber \\ &\quad =-\text{cov}_{t}(m_{t,t+1},\ln R_{Q,t+1})\nonumber \\ & \quad=\underset{\simeq \text{corr}_{t}(m_{t,t+1},m_{t+1}^{\text{SR}})\text{std}_{t}(m_{t,t+1})\text{std}_{t}(m_{t,t+1}^{\text{SR}})}{\underbrace{-\text{cov}_{t}(m_{t,t+1},\Delta q_{t+1})}}\\ &\qquad+ \underset{\simeq \text{corr}_{t}(m_{t,t+1},m_{t+1}^{\text{LR}})\text{std}_{t}(m_{t,t+1})\text{std}_{t}(m_{t,t+1}^{\text{LR}})}{\underbrace{-\text{cov}_{t}(m_{t,t+1},\ln\! (1+P_{Q,t+1}))}}\nonumber \end{align}
where
 $R_{f,t}$
is the one-period gross real risk-free rate satisfying
 $1/R_{f,t}=E_{t}M_{t,t+1}$
,
 $m_{t,t+1}=\ln M_{t,t+1}$
and
 $q_{t}=\ln\! (Q_{t})$
. In the first row of equation (21),
 $\frac{1}{2}[\text{std}_{t}(\ln E_{t}R_{Q,t+1})]^{2}$
is the usual Jensen’s inequality term that pops up in lognormal approximations. The last row of equation (21) decomposes the covariances into correlations and standard deviations as well as makes use of expressions (19) and (20). As long as the correlation between
 $m$
and
 $m^{\text{LR}}$
(or, equivalently, the correlation between
 $m^{\text{SR}}$
and
 $m^{\text{LR}}$
as
 $m=m^{\text{SR}}+m^{\text{LR}}$
) is positive, the excess return has a component that compensates for long-run risks. Below we show that the long-run component positively comoves with the short-run component and the whole pricing kernel in two ways: (i) by presenting impulse responses and (ii) unconditional correlations of
 $m^{\text{LR}}$
with
 $m^{\text{SR}}$
and
 $m$
as well as standard deviations.
3. Parametrization
Columns 1 and 2 of Table 1 contain the benchmark parametrization of the entry and no-entry models. In addition, we consider three alternative parametrization of the entry model which helps us illustrate the mechanisms of the model as well as check the robustness of our findings. In column three, the alternative parametrization of
 $\sigma =1.5$
achieving IES
 $\lt$
1 is employed. In column four, we consider flexible prices by setting Rotemberg price adjustment cost to low value (
 $\phi _{P}=2$
). In column five, we include an empirically more realistic Taylor rule with positive response to the output gap (
 $\phi _{Y}=0.125$
) and interest rate smoothing (
 $\rho =0.7$
).
Parametrization

Notes: The abbreviation benchm. refers to the benchmark parametrization. Flex. pr. refers to the case of flexible prices. Taylor refers to a Taylor-type interest rate rule with the inclusion of a response to the output gap and having interest rate smoothing. Numbers in bold reflect changes relative to the benchmark parametrization. The model with separable preferences uses the benchmark parametrization.
For a given value of
 $\varphi$
,
 $\sigma$
is chosen such that it implies an IES
 $\gt$
1 as in the long-run risk literature and is in line with Vissing-Jorgensen and Attanasio (Reference Vissing-Jorgensen and Attanasio2003) who estimate the IES to be higher than one for stockholders. The size and persistence of the productivity shock for each model is chosen to fit the standard deviation of consumption growth in the data and is reasonably close to that in Bilbiie et al. (Reference Bilbiie, Ghironi and Melitz2007).
 $\delta$
,
 $\theta$
, and
 $f_{E}$
follow Bilbiie et al. (Reference Bilbiie, Ghironi and Melitz2007). The elasticity of substitution between products is estimated to be low on US firm-level micro-data, see for example Bernard et al. (Reference Bernard, Redding and Schott2010). The choice of
 $\delta$
implies an attrition rate of 1% for firms on average, per annum. Our results are not sensitive to the choice of the constant entry cost,
 $f_{E}$
denominated in consumption units. Returns are levered in the data which we capture through a short-cut. Hence, we multiply excess returns with a conservative value of the leverage factor,
 $\phi _{\text{lev}}$
following Croce (Reference Croce2014).
CRRA is calibrated to match the Sharpe ratio as in Li and Palomino (Reference Li and Palomino2014). This yields a value of 33 that is somewhat higher than the value of 16used by Li and Palomino (Reference Li and Palomino2014) but close to values in the macro-finance literature [see e.g. Horvath et al. (Reference Horvath, Kaszab and Marsal2022a)]. Our value of the risk aversion can be considered as an improvement relative to Swanson (Reference Swanson2014) who matches the equity premium with a risk aversion of 90.
Nevertheless, we have number of reasons to motivate a high risk aversion coefficient. First, one can mention Barillas et al. (Reference Barillas, Hansen and Sargent2009) who finds small risk aversion when agents have moderate amount of uncertainty about economic environment. In our standard DSGE model, agents have perfect knowledge about model equations, parameters, etc. They argue that the quantity of risk in the model is much lower than in the US economy, and a higher risk aversion coefficient is needed to mimic the data. Second, Malloy et al. (Reference Malloy, Moskowitz and Vissing-Jorgensen2009) show that the consumption of stockholders displays higher standard deviation than the consumption of non-stockholders. Our model does not distinguish between different types of investor and non-investor households but features a representative household. The latter needs to exhibit higher risk aversion to match the quantity of risk in asset returns.
Our parametrization implies early resolution of uncertainty (
 $\gamma \gt1/\sigma$
) as in Bansal and Yaron (Reference Bansal and Yaron2004).
 $\varphi$
lies in between the value estimated by micro- [lower than one, see e.g. Pistaferri (Reference Pistaferri2003)] and macro-studies [typically higher than one as in Bilbiie et al. (Reference Bilbiie, Ghironi and Melitz2007)]. Our choice of
 $\phi _{P}$
implies a Calvo parameter of 0.85 as in Christiano et al. (Reference Christiano, Eichenbaum and Rebelo2011).Footnote
9
Our calibration for the price rigidity implies that prices are sticky for about 6.66 quarters which is on the higher end of the empirical estimates [see e.g. Del Negro et al. (Reference Negro, Marco and Schorfheide2015)].
4. Results and discussion
4.1. Impulse responses from the benchmark model
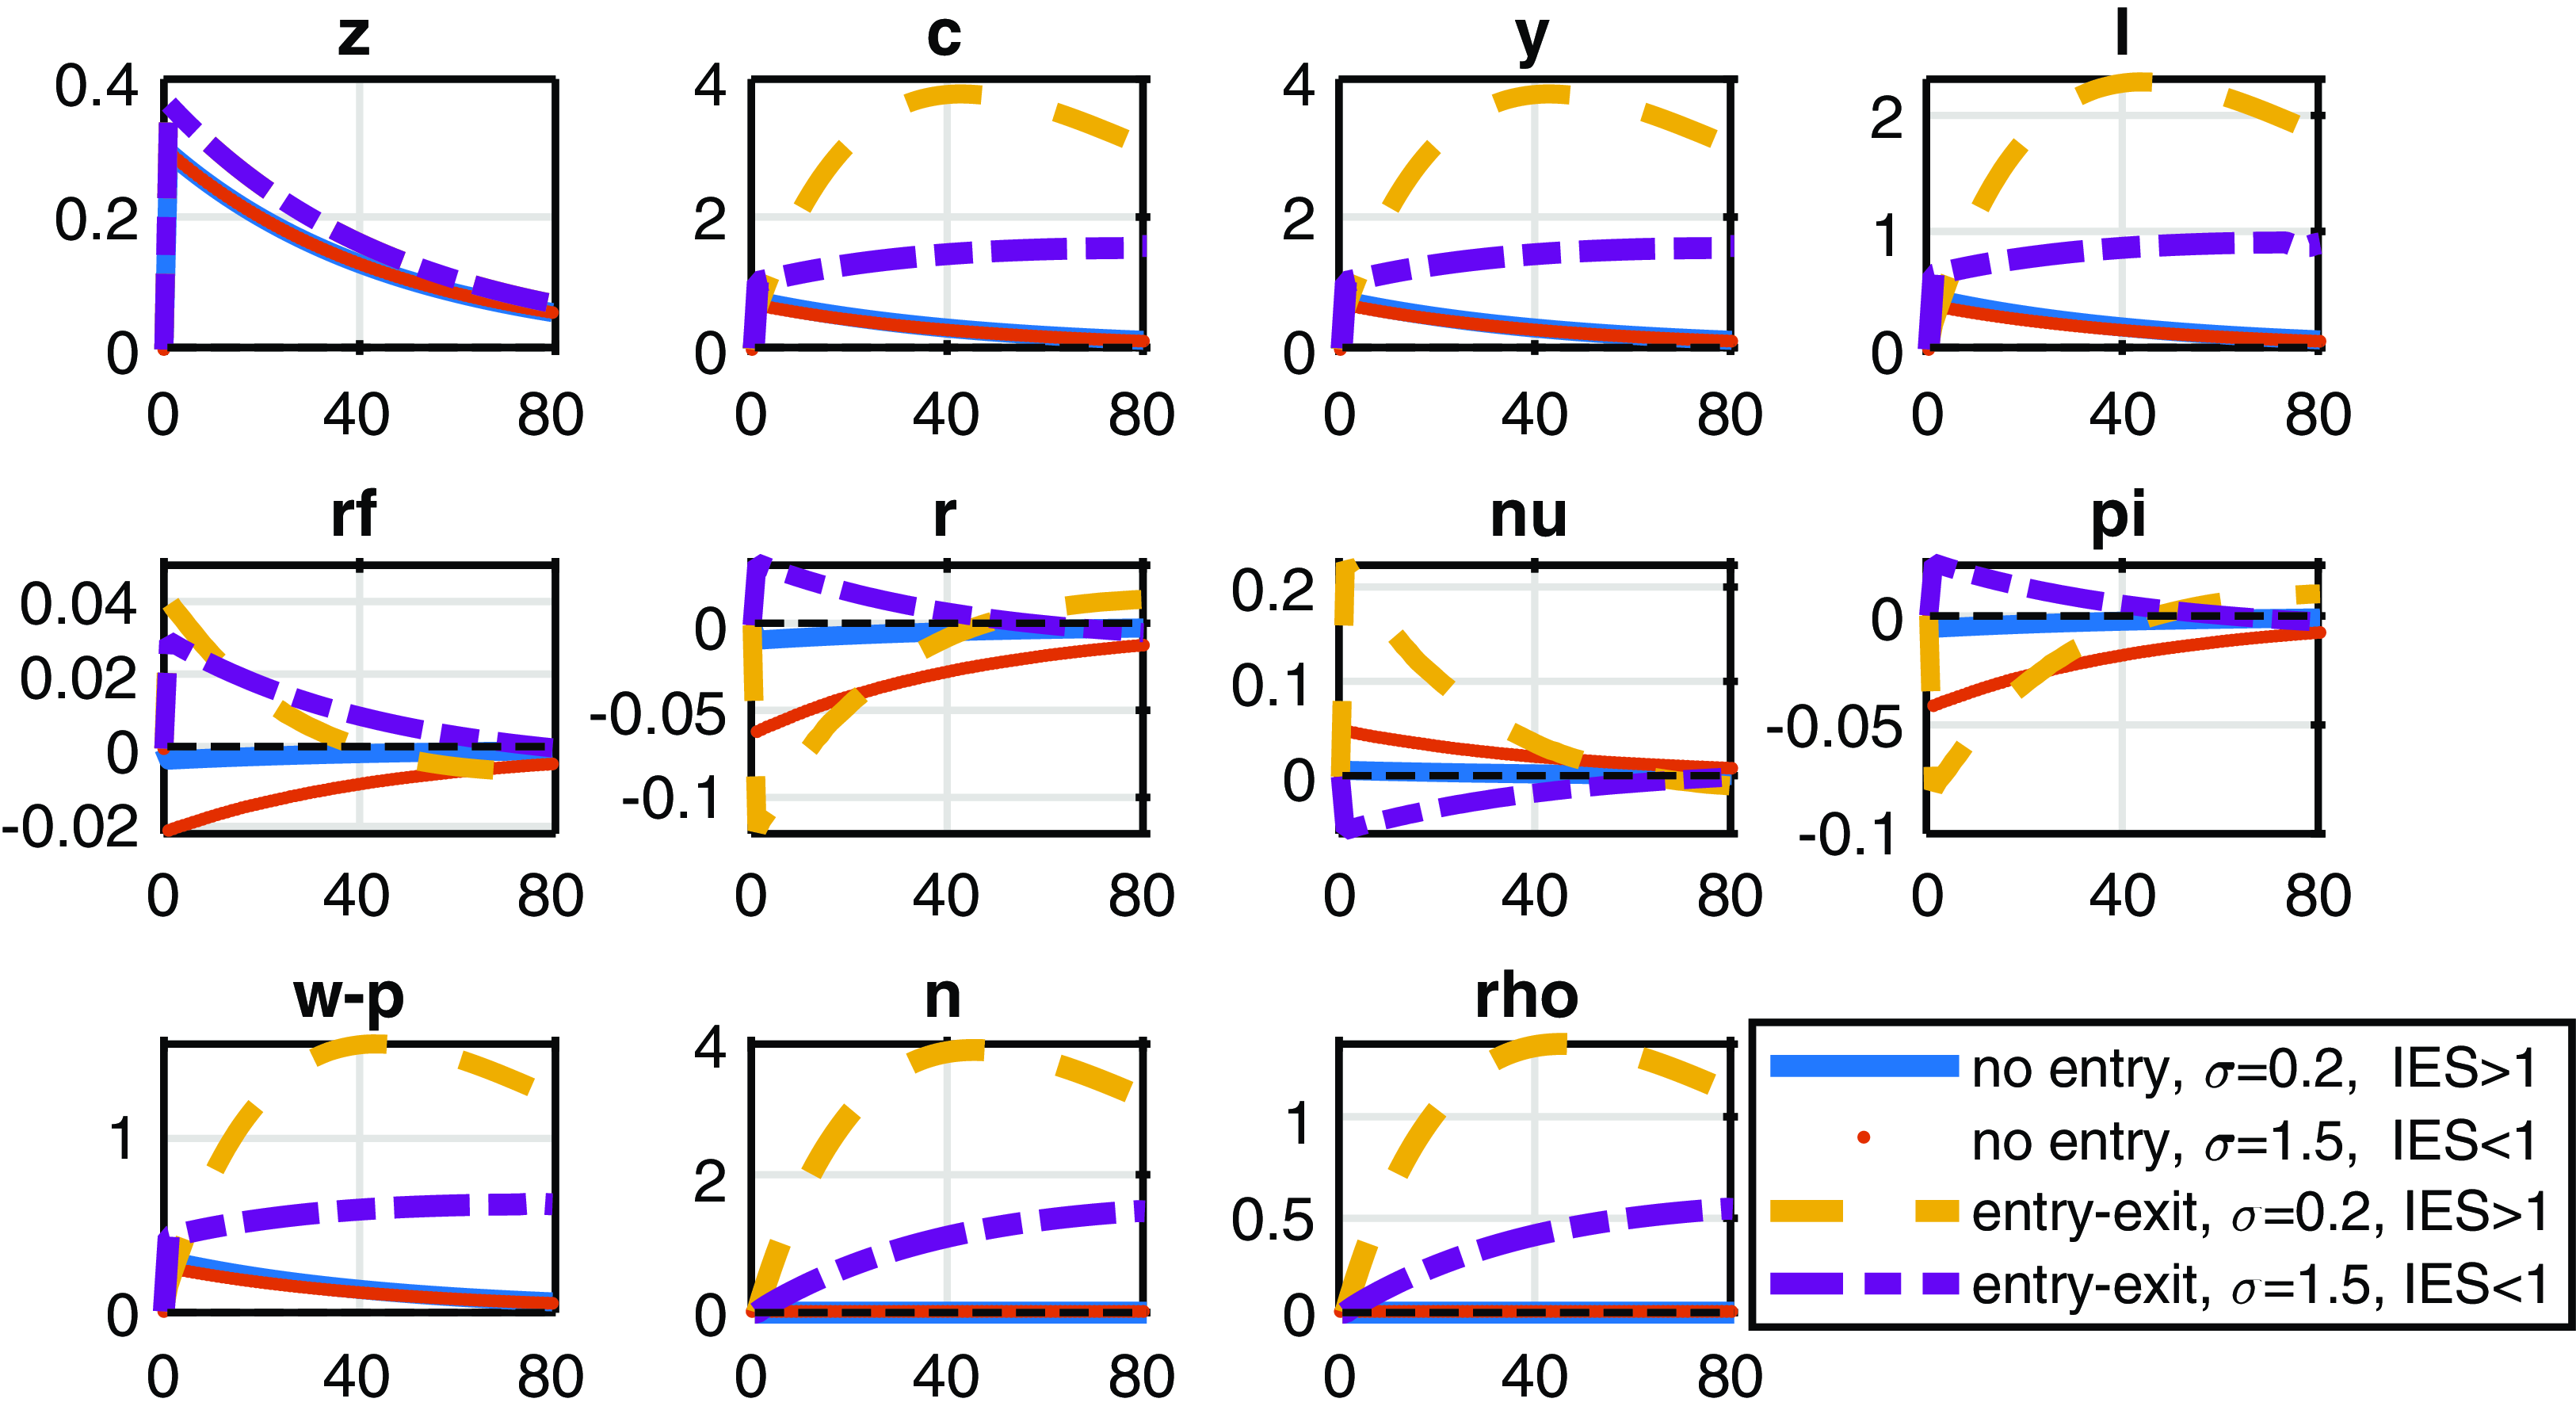
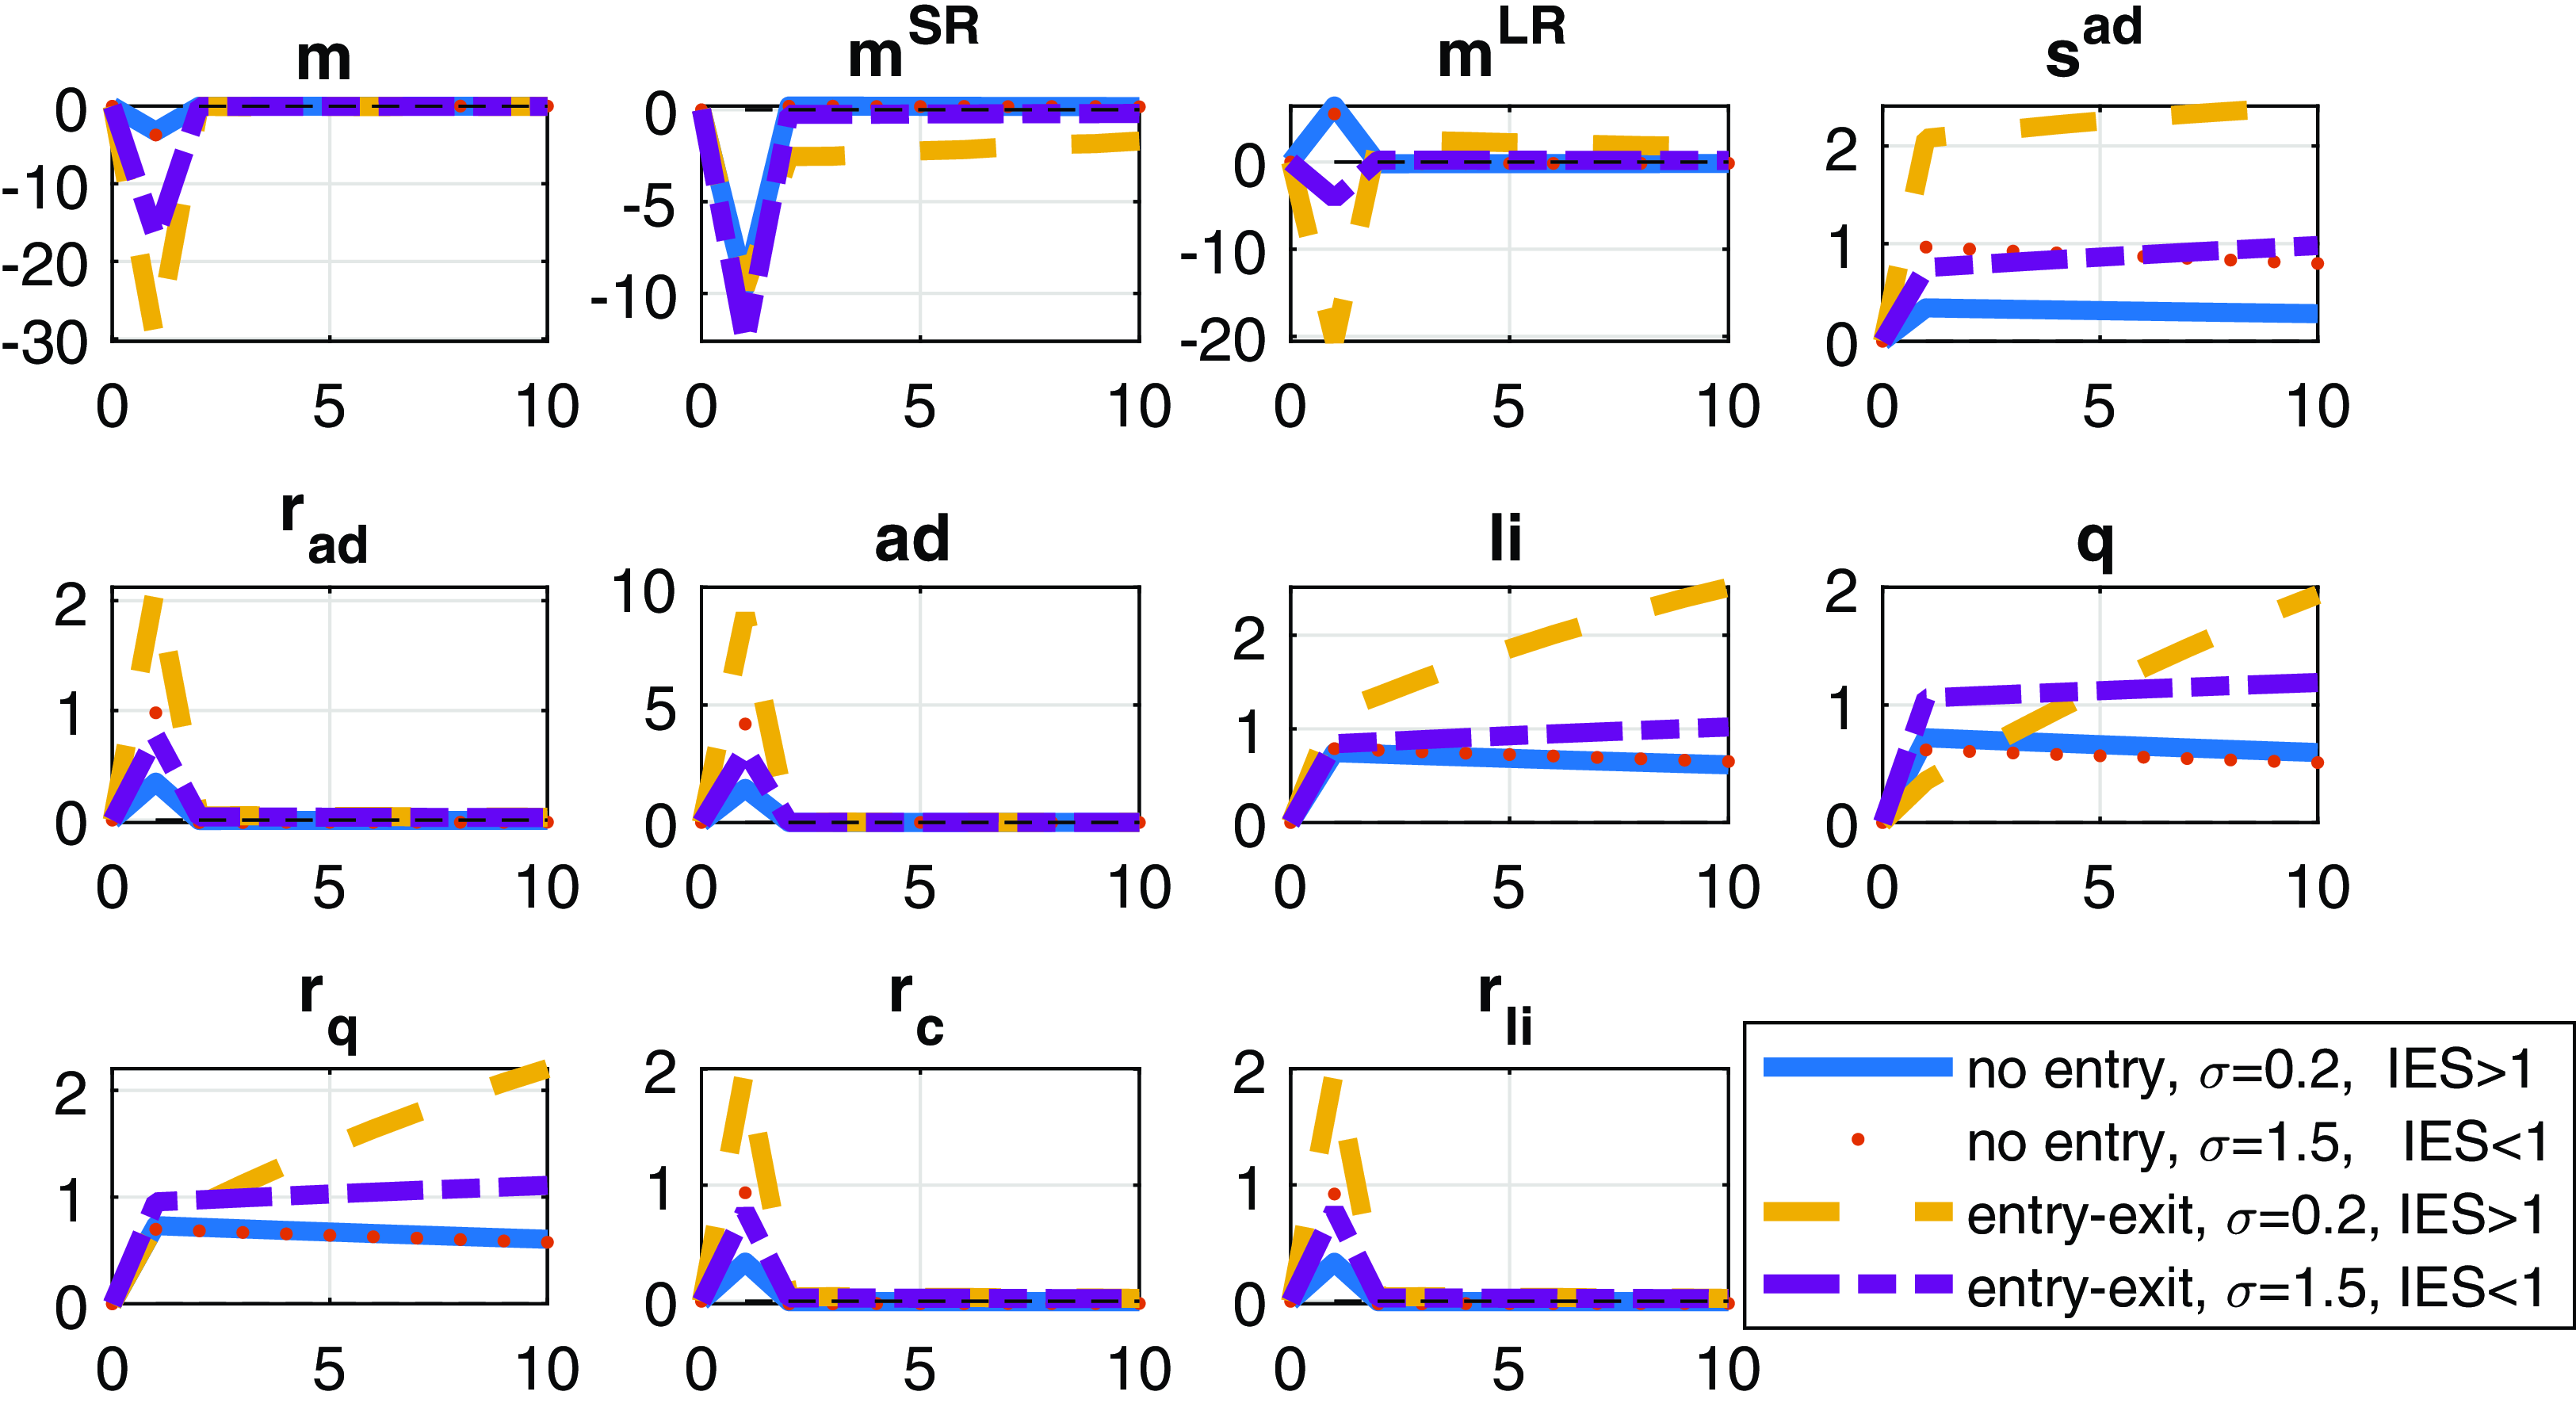
To explain the mechanisms in the entry model, we consider impulse responses and simulated model moments compared to the data. Model moments are based on simulations for 10,000 quarters using second-order perturbation. We start with the impulse responses. In particular, we consider a positive one-standard deviation productivity shock which induces the entry of new firms due to positive profit opportunities. The impact of positive technology shock to macro- and finance variables is shown on Figures 2 and 3, respectively.
Figure 2 shows that a positive technology shock triggers firm entry leading to the growth in the log of the number of firms (
 $n$
) and a rise in the log of relative prices (
 $\rho$
).Footnote
10
The positive wealth effect of the productivity boosts consumption (
 $c$
), output (
 $y$
), and labor (
 $l$
) as well with similar rising pattern over time. Figure 3 presents that the log of labor income (
 $li$
) and aggregate dividends (
 $ad$
) both expand after a positive technology shock. Investors require higher return on consumption and labor income claims as well as the adjusted wealth portfolio (see variables
 $r_{C}$
,
 $r_{\text{LI}}$
, and
 $r_{Q}$
, respectively, on Figure 3) also react more in the entry model. Further, the persistent rise in expected consumption, labor income, and aggregate dividends implies long-run risks. The graphs are displayed for the cases of IES
 $\gt$
1 (our benchmark) and IES
 $\lt$
1. IES
 $\gt$
1 implies that the substitutability between current and future consumption is high, and there is complementarity between current utility and the continuation value of utility. An IES
 $\lt$
1 leads to consumption smoothing.
Consistent with the results in Tables 2 and 3 (see the subsection “long-run risks” below), Figure 1 shows that the entry model enhances the propagation of technology shocks. In particular, the variables in the entry model display greater and more persistent response to TFP shocks relative to the no-entry model. The persistent variation in the entry model survives in the case of separable preferences too, see Figures 4 and 5.
The response of macroeconomic variables to a positive technology shock. Notes: the responses from the no-entry (solid) and entry (dashed) models are displayed. Vertical axes measure percentage deviation of the variables from the steady state. The log deviation of nominal and risk-free real interest rates (
 $r$
and
 $r_{f}$
) and the inflation (
 $\pi$
) are annualized. For instance,
 $z$
is the log of temporary exogenous technology in percentage deviation from the steady state:
 $z_{t}=100\ln(Z_{t}/Z)$
. The rest of the variables are consumption,
 $c$
, output,
 $y$
, labor,
 $l$
, the markup,
 $\mu$
, real wage,
 $w-p$
, number of firms,
 $n$
, variety effect, and
 $rho$
.
The response of financial variables to a positive technology shock. Notes: the responses from the no-entry (solid) and entry (dashed) models are displayed. Vertical axes measure percentage deviation of the variables from the steady state. Log-returns (
 $r_{q}$
,
 $r_{c}$
,
 $r_{\text{li}}$
, and
 $r_{\text{ad}}$
) are annualized. The following list of variables is displayed.
 $m$
is real the pricing kernel with short-run,
 $m^{\text{SR}}$
and long-run components,
 $m^{\text{LR}}$
. The price of the aggregate dividend claim,
 $s^{\text{ad}}$
, the payoff on the composite claim,
 $q$
, aggregate dividends, ad, return on aggregate dividend claim,
 $r_{\text{ad}}$
, return on the consumption claim,
 $r_{c}$
, labor income,
 $\text{li}$
, and return on the labor income claim,
 $r_{\text{li}}$
.
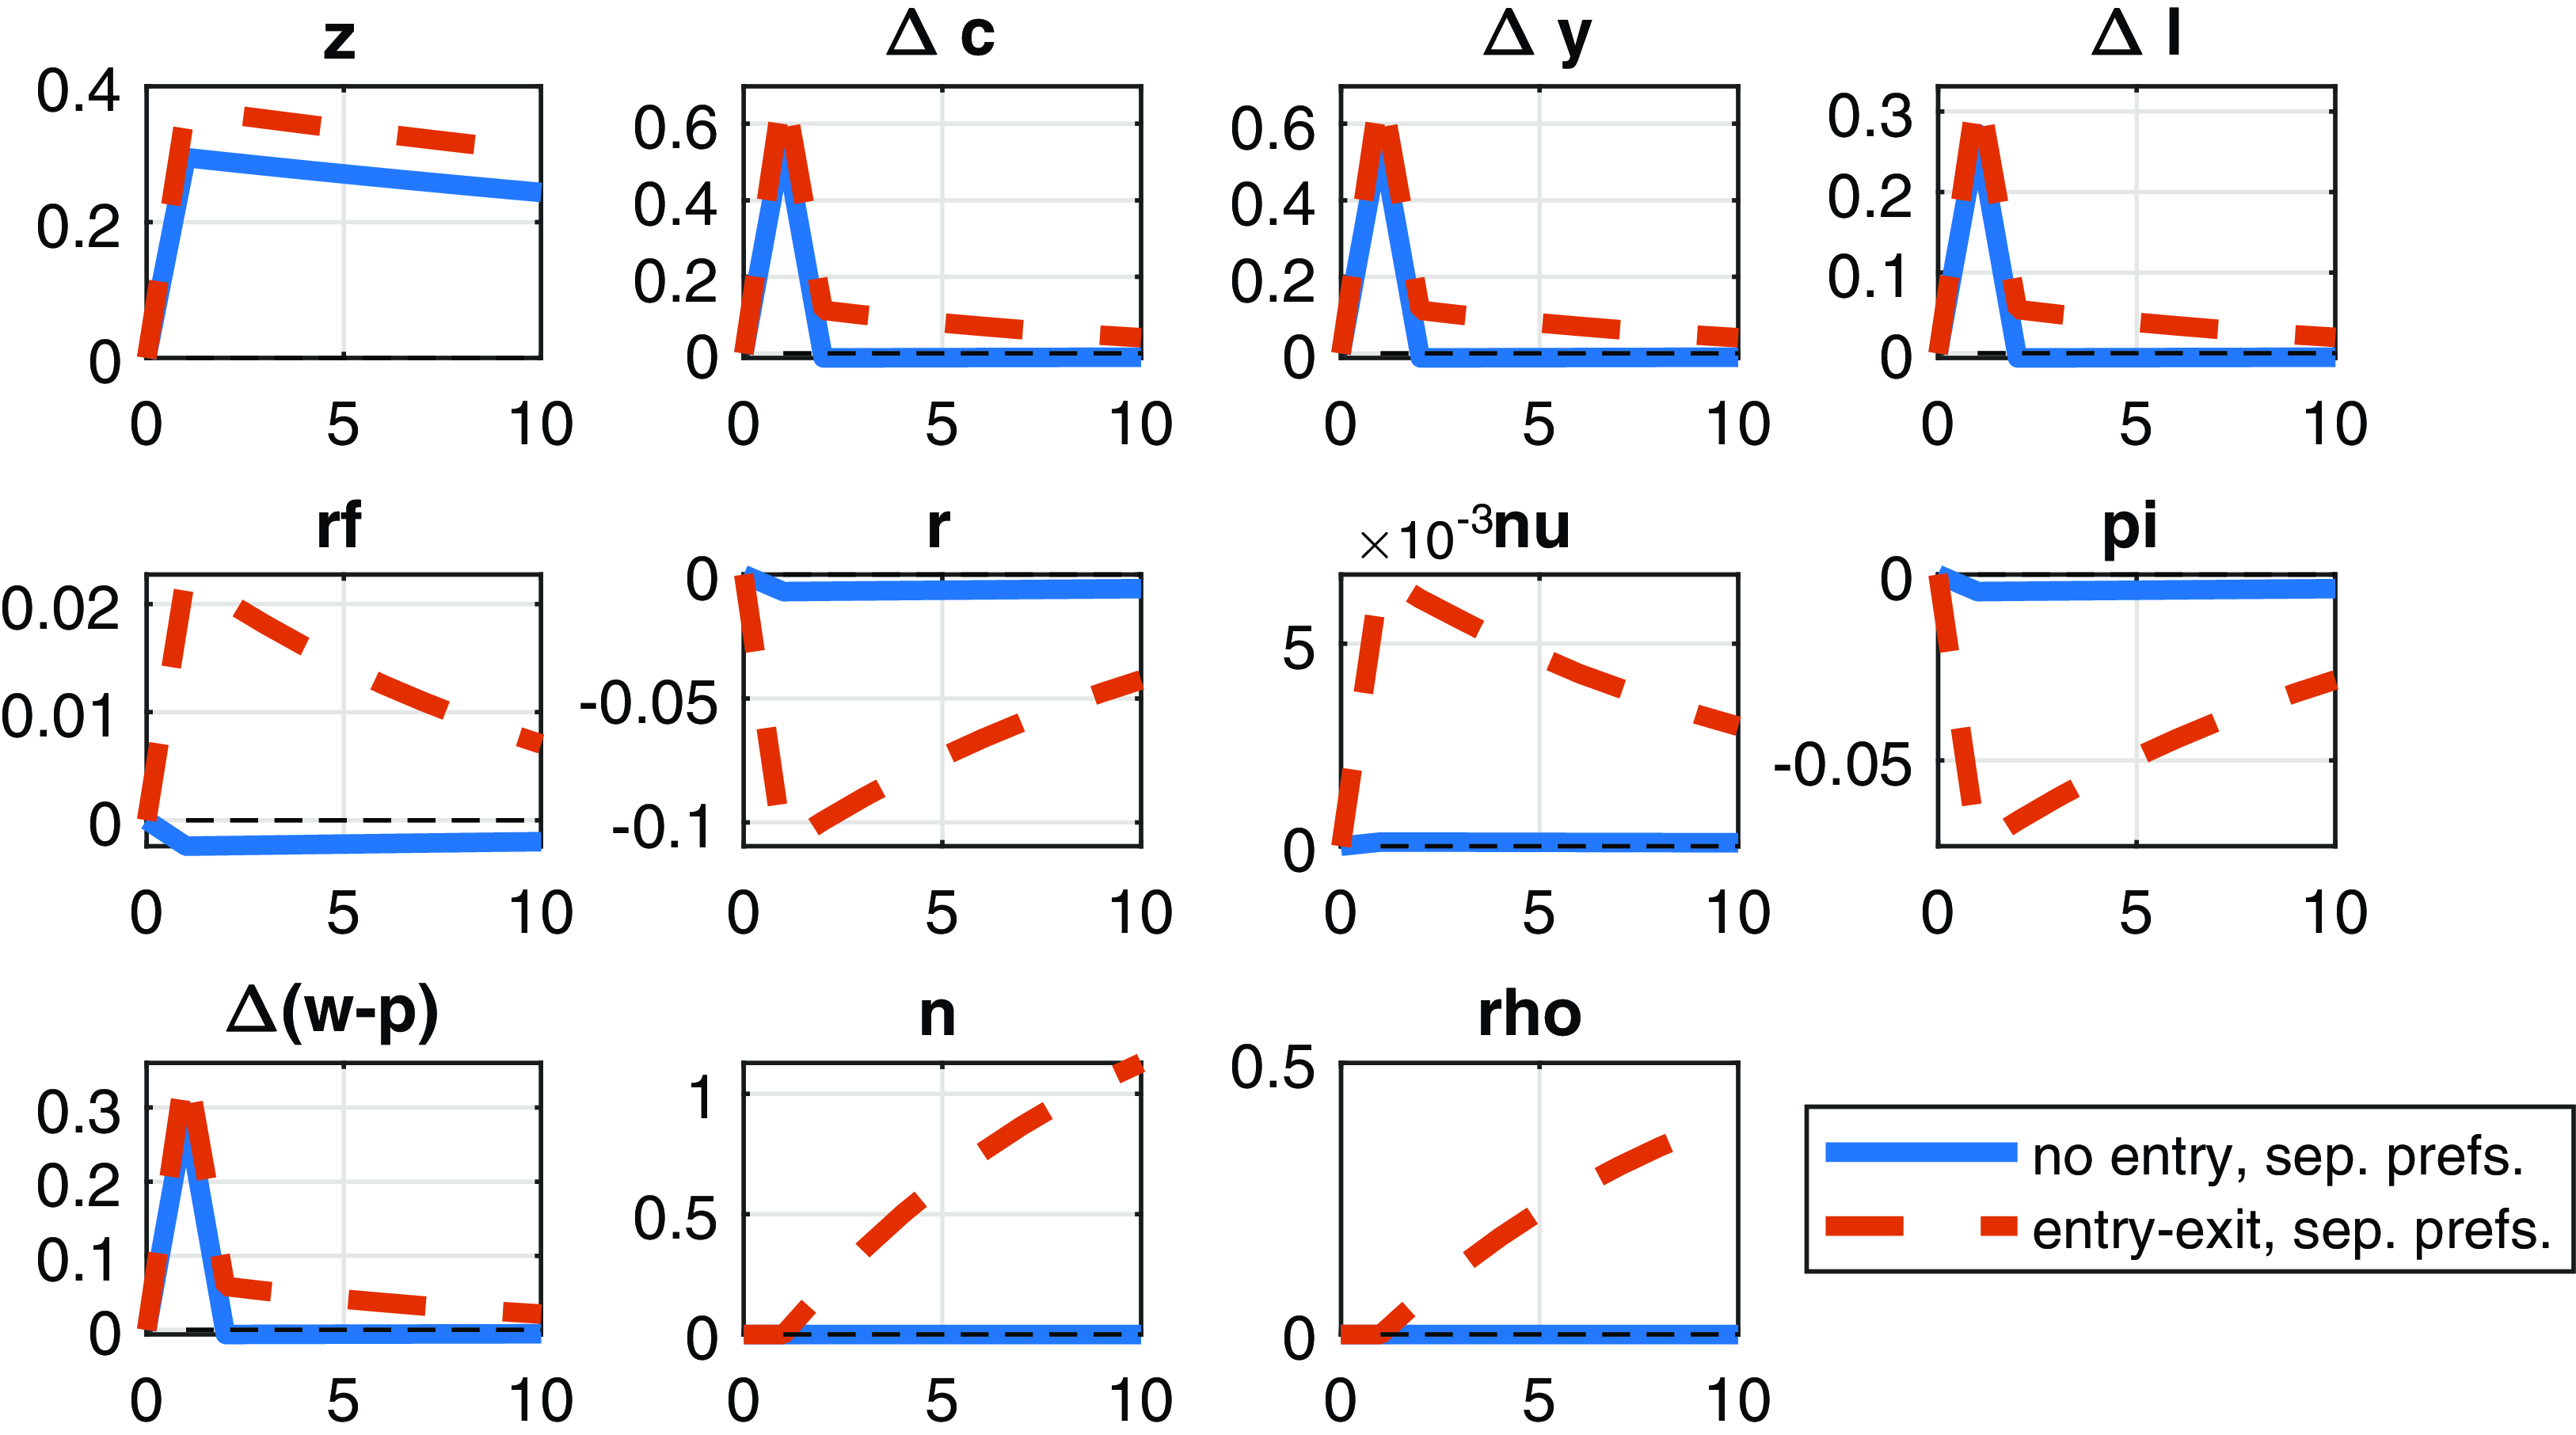
It is of interest to compare our results to Li and Palomino (Reference Li and Palomino2014) who used separable preferences, several types of shocks (transitory technology, permanent technology, and monetary policy shocks) as well as price and wage rigidity. They plot growth rates in response to each of their shocks. To make the comparison in a transparent way, we display variables of our model with separable preferences as growth rates on Figure 6. Our impulse responses are made for the case of flexible prices (no price rigidity) so that they reflect the effect of firm entry only. Inspecting the plots of LP (see, e.g. Figure 2 in their online appendix), there is virtually no persistence in their growth rates even with permanent shocks: the main variables of interest such as consumption growth return to the steady state even after one period (in their baseline scenario as well as in the case of either price or wage rigidity). However, consumption growth in the entry model exhibits persistence even in response to transitory technology shocks in the absence of price rigidity.
Next, we explain how long-run risk emerges in the entry model.
The decomposition of the pricing kernel
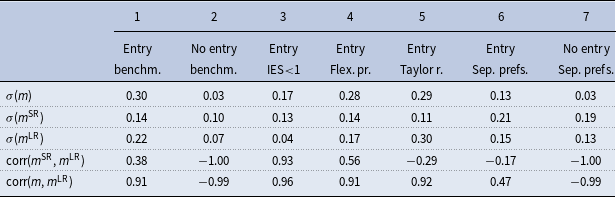
Notes: This table contains unconditional correlations and standard deviations from the log of the pricing kernel (
 $m$
) which is decomposed into short- and long-run parts (see
 $m^{\text{SR}}$
and
 $m^{\text{LR}}$
, respectively ) in the spirit of Li and Palomino (Reference Li and Palomino2014). The abbreviation benchm. refers to the benchmark parametrization. Flex. pr. refers to the case of flexible prices. Taylor refers to a Taylor-type interest rate rule with the inclusion of a response to the output gap and having interest rate smoothing. Columns 1–5 are generated by GHH preferences while columns 6 and 7 use separable preferences.
Finance moments and properties of consumption growth
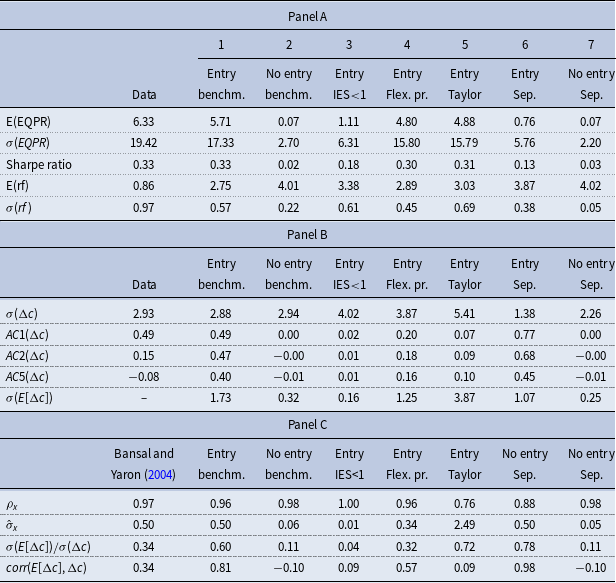
Notes: notations are identical to Table 2. In the rows, E(.),
 $\sigma (.)$
, and corr(.,.) refer to unconditional mean, standard deviation, and correlations, respectively. AC1, 2, and 5 refer to first-, second-, and .fifth-order autocorrelations, respectively. Panel A contains financial moments. Panel B contains statistics related to consumption growth. In Panel C, we fit the expected consumption growth,
 $E[\Delta (c)]$
from the entry and no-entry models to an AR(1) process
 $x_t=\rho _{x} x_{t-1}+\sigma _{x} \epsilon _{x,t}$
, where
 $\epsilon _{x,t} \sim N(0,1)$
, and compare to the exogenous consumption growth process in Bansal and Yaron (Reference Bansal and Yaron2004). We report the persistence parameter and the annualized volatility parameter,
 $\tilde{\sigma }_{x}$
, from the fitted AR(1) process.
Impulse responses of selected variables to a positive technology shock. Separable preferences of the form
 $\frac{C^{1-\sigma }}{1-\sigma }-\chi \frac{L^{1+\frac{1}{\varphi }}}{1+\frac{1}{\varphi }}$
are considered.
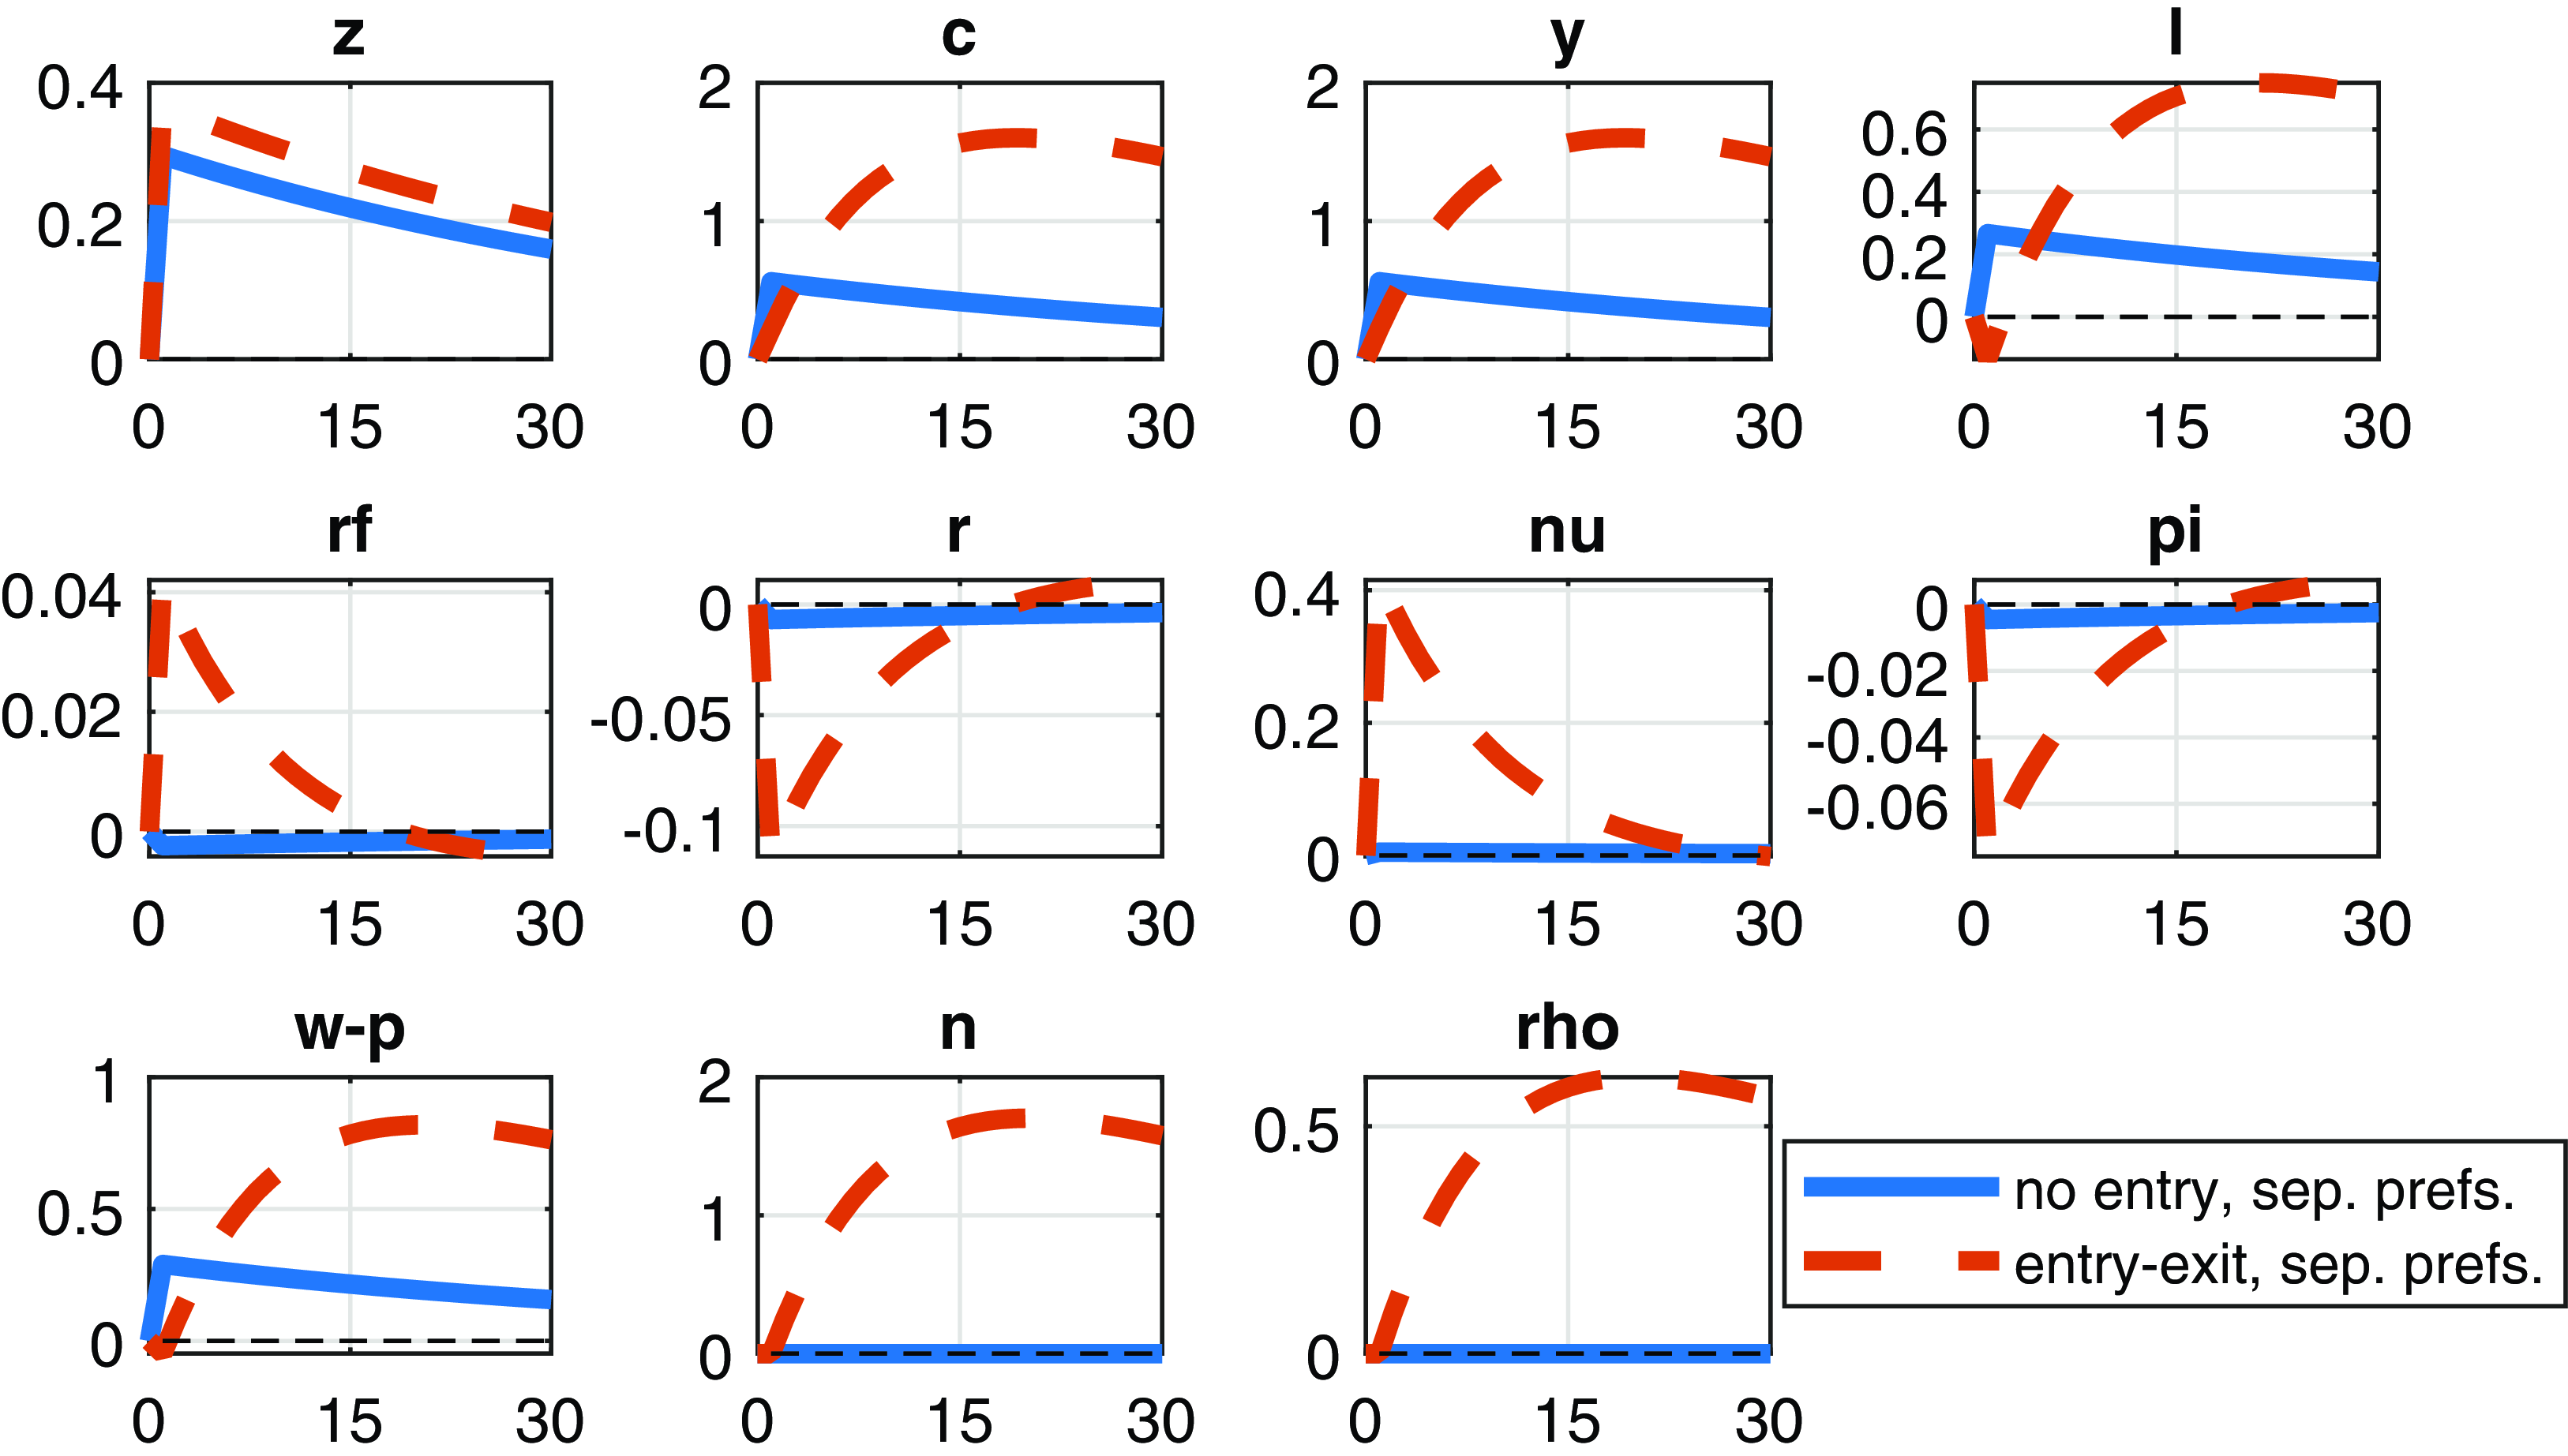
Impulse responses of selected variables to a positive technology shock. Separable preferences of the form
 $\frac{C^{1-\sigma }}{1-\sigma }-\chi \frac{L^{1+\frac{1}{\varphi }}}{1+\frac{1}{\varphi }}$
are considered.

Impulse responses of selected variables to a positive technology shock. Separable preferences of the form
 $\frac{C^{1-\sigma }}{1-\sigma }-\chi \frac{L^{1+\frac{1}{\varphi }}}{1+\frac{1}{\varphi }}$
are considered. Prices are flexible in this case (see the negligible change in the markup
 $\mu$
, which is constant with flexible prices).
4.2. Long-run risks
We show the response of the log of the pricing kernel (
 $m$
) as well as its short-run and long-run components (see
 $m^{\text{SR}}$
and
 $m^{\text{LR}}$
, respectively) to a positive TFP shock on Figure 3. The sign of the
 $m^{\text{LR}}$
component differs across the entry and no-entry models. The
 $m^{\text{SR}}$
and
 $m^{\text{LR}}$
components move in the same direction in the entry model generating excess movement in
 $m$
as well as the returns. Hence, the long-term component of the excess return in equation (21) is positive only in the entry model. This can be explained as follows.
In endowment, economy models such as Bansal and Yaron (Reference Bansal and Yaron2004) with long-run risks the short- and long-run components are driven by separate shocks. In our production models, technology shocks contribute to both the short- and long-run components. Hence, the stochastic discount factor is not only driven by the volatility of each of the components but their correlation [see equation (21)] is also important to determine the volatility of the pricing kernel (
 $m$
) and the excess return. In the entry model, shocks move the current and expected consumption as well as the short and long components of the
 $m$
in the same direction leading to long-run risks.
In Table 2, we report the unconditional standard deviations and correlations between short- and long-run components of the pricing kernel as an approximation to the conditional ones in the decomposition above. Simulated moments in column 2 and 3 are produced with the benchmark model using the benchmark parameterization in Table 1. Column 3–5 include robustness checks with respect to the (i) IES (inversely related to
 $\sigma$
), (ii) flexible prices, and (iii) a Taylor rule (with response to output gap as well as interest rate smoothing—see the Taylor rule calibration at the bottom of Table 1). Columns 2–5 are based on non-separable preferences of GHH type. Results in columns 6 and 7 are based on separable preferences using the benchmark calibration.
The results in Table 2 confirm findings from the impulse responses: the short- and long-run components comove positively only in the case of the entry model marking the presence of long-run risks. Further, the standard deviations of
 $m^{\text{SR}}$
,
 $m^{\text{LR}}$
, and
 $m$
are all higher with increasing variety relative to the case of fixed variety. Importantly, the no-entry model in column 2 (based on the benchmark non-separable utility) or in column 7 (employing separable preferences) is unable to produce long-run risks (the correlation between the short- and long-term components is negative).
4.3. The fit to financial data and moments of the consumption growth
Table 3 contains selected macro- and finance moments. The first column contains macroeconomic and finance data moments based on US data 1929–1998 from Bansal and Yaron (Reference Bansal and Yaron2004). In this subsection, we mainly focus on comparing simulated data from the benchmark entry and no-entry models in columns 1 and 2. A separate section below focuses on the robustness checks in columns 3–7.
Interest rates, returns, inflation, and consumption growth are all annualized percentages. Consistent with the method in Bilbiie et al. (Reference Bilbiie, Ghironi and Melitz2007), model-based macroeconomic and financial variables are taken logs and transformed such that they do not include the variety effect and, hence, are comparable with data moments, for example
 $y_{t}\equiv \ln\! (P_{t}Y_{t}/p_{t})=\ln\! (Y_{t}/\rho _{t})$
. The table contains three panels. Panel A and B contain financial and macroeconomic moments, respectively.Footnote
11
Panel C compares statistics from the Bansal and Yaron (Reference Bansal and Yaron2004) model to our models. We start with the discussion of Panel A.
Panel A shows that the entry model generates 90% of the empirical excess return with a volatility closely matching the data, whereas the no-entry model produces zero mean and little variation in the excess return. The unconditional mean of the risk-free rate is somewhat in excess of the data while its standard deviations are lower than data. Importantly, our results are not coupled with excessively high mean and/or standard deviation of the risk-free rates so that our model is not subject to the risk-free rate puzzle.Footnote 12
Panel B shows that both the entry and the no-entry models are calibrated such that they reproduce the standard deviation of realized consumption growth (
 $\sigma (\Delta c)$
). Yet, only the entry model produces positive first-order autocorrelation of consumption growth. Hence, consumption growth in the entry model contains a persistent predictable component unlike the no-entry model where consumption growth is i.i.d. and, hence, unpredictable. Delayed firm entry induces low-frequency movements in productivity engineering predictable movements in expected consumption growth. Indeed, there is significant variation in expected consumption growth,
 $\sigma (E[\Delta c])$
, in the entry model. Whereas the standard deviation of expected consumption growth has little variability in the no-entry model (less than 20 percent of the corresponding value in the entry model). On the downside, we note, however, that the entry model overpredicts the autocorrelations at lags two and five.
Panel CFootnote
13
shows the coefficient and the standard error from an AR(1) process fitted to expected consumption growth which is an exogenous process in the endowment model of Bansal and Yaron (Reference Bansal and Yaron2004). While the estimated autoregressive parameters from our models,
 $\rho _{x}$
, are close to identical to Bansal and Yaron (Reference Bansal and Yaron2004), we find that the estimated standard deviation,
 $\tilde{\sigma }_{x}$
, is somewhat larger in the entry model than their endowment model. The estimated standard deviation from the no-entry model is close to zero implying that expected consumption growth exhibits zero variation in the no-entry model. We further find that the relative standard deviation and correlation of expected consumption growth are also higher than the ones in Bansal and Yaron.
4.4. Properties of dividend growth, the price-dividend ratio, and variety growth
Table 4 compares data and model moments on dividend growth, price-dividend ratio, and variety growth. Specifically, panel A compares statistics of dividend growth and the price-dividend ratio across the entry and no-entry models to make the following observations. First, the standard deviation of aggregate dividend growth,
 $\sigma (\Delta (\text{ad}))$
, is about half of what we see in the data. Second, the correlation between aggregate dividend and consumption growth,
 $\text{corr}(\Delta (\text{ad}),\Delta c)$
, is overestimated by the entry model. Third, the entry model produces a positive autocorrelation in aggregate dividend growth,
 $\text{AC1}(\Delta (\text{ad}))$
, that is slightly in excess of the data. The latter can still be interpreted as a success as the no-entry model predicts that the autocorrelation of aggregate dividends is zero. Fourth, the standard deviation of the price-dividend ratio,
 $\sigma (p-d)$
, is also better captured by the entry model but is still half of the data.
Properties of dividend growth, the price-dividend ratio, and variety growth
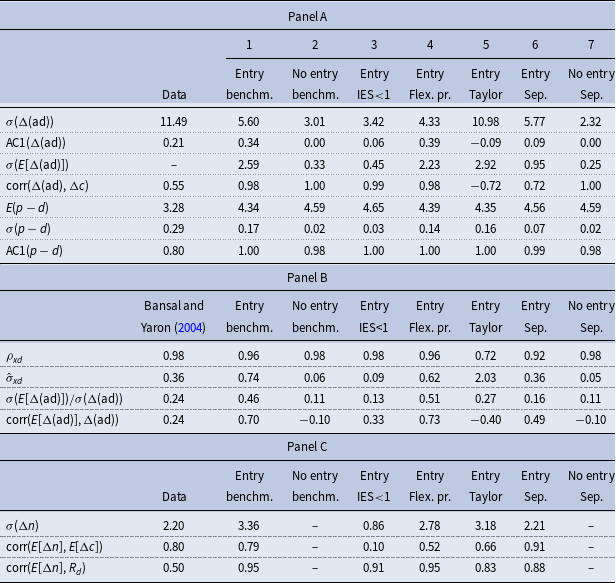
Notes: notations are identical to Table 2. Panel A contains statistics related to aggregate dividend growth and the log of the price-dividend ratio. In Panel B, we fit the expected aggregate dividend growth,
 $E[\Delta (\text{ad})]$
from the entry and no-entry models to an AR(1) process
 $xd_t=\rho _{xd} xd_{t-1}+\sigma _{xd} \epsilon _{xd,t}$
, where
 $\epsilon _{xd,t} \sim N(0,1)$
, and compare to the exogenous dividend growth process in Bansal and Yaron (Reference Bansal and Yaron2004). We report the persistence parameter and the annualized volatility parameter,
 $\tilde{\sigma }_{xd}$
, from the fitted AR(1) process. Panel C compares moments from the entry model to statistics estimated by Scanlon (Reference Scanlon2019) using US trademark data to proxy variety growth over 1927–2016.
Panel B shows that the entry model has a persistence similar to the exogenous process in Bansal and Yaron (
 $\rho _{\text{xd}}$
) and somewhat higher standard deviation (
 $\tilde{\sigma }_{\text{xd}}$
). Further, we find that the relative standard deviation and correlation between expected and realized dividend growth is overestimated by the entry model to some extent.
Finally, panel C assesses model fit to variety data from Scanlon (Reference Scanlon2019). He proxied the appearance of new products with US trademarks data 1927–2016. In particular, the standard deviation of product growth in the entry model is not distant from the data. Further, the confluence of future product growth and consumption as well as stock returns based on firm-level dividends is also well-captured by the entry model.
4.5. The role of model ingredients
It is of interest to explore whether it is the firm entry mechanism that brings the high equity premium and not other features of our model. In particular, we assess the role of (i) the choice of the elasticity of intertemporal substitution (EIS), (ii) the choice of preferences (separable or non-separable in consumption and hours worked), (iii) price rigidity, and (iv) the form of the Taylor rule. Finally, we highlight why firm entry is more successful in matching financial data relative to LP.
4.5.1. The role of the intertemporal elasticity of substitution (IES)
We show that the choice of IES impacts our results to a great extent. Column 3 of Table 3 shows the sensitivity of our results to choosing
 $\sigma =1.5$
that is consistent with an IES
 $\lt$
1. In this case, there is little autocorrelation in realized consumption growth which is close to zero at the lags displayed. Further, there is limited variation in expected consumption growth,
 $\sigma (E\!\left [ \Delta c\right ] )$
relative to the benchmark case of IES
 $\gt$
1 (in column 1), and low correlation between realized and expected consumption growth,
 $\text{corr}(\Delta c,E\!\left [ \Delta c\right ] )$
.
An IES
 $\lt$
1 reduces the significance of the continuation value of utility, eliminating the long-run risk component. Indeed, the mean of the risk premium in the case of IES
 $\lt$
1 drops by around 460 basis points to 111 basis points relative to the benchmark case. In this case, the firm entry model still generates higher risk premium than the no-entry model due to the extra variation in the short-run component of the pricing kernel. With IES
 $\lt$
1, the standard deviation of the long-run component of the pricing kernel is much smaller (see
 $\sigma (m^{\text{LR}})$
in Table 2 and the long-run component on Figure 3) leading to lower risk premia (in column 3 of Table 3).
The choice of IES
 $\gt$
1 is a common choice in the long-run risk literature [see e.g. Croce (Reference Croce2014) and Kaltenbrunner and Lochstoer (Reference Kaltenbrunner and Lochstoer2010)] to generate autocorrelation and predictability in consumption growth. With expanding varieties, future consumption drops more in case of negative shocks. Hence, assets with a payoff that is based on an expanding variety of goods are more risky.
4.5.2. Separable preferences
Separable preferences imply wealth effects on labor supply reducing the procyclicality of asset payoffs and precluding the model to match the high equity premium. Separable preferences of the form
 $\frac{C^{1-\sigma }}{1-\sigma }-\chi \frac{L^{1+\frac{1}{\varphi }}}{1+\frac{1}{\varphi }}$
are employed to assess the performance of entry and no-entry models in the last two columns of Tables 2 and 3.
With separable preferences, the statistics related to consumption growth are not sufficient to judge the ability of the model in explaining long-run risks as labor is less procyclical (or even countercyclical if
 $\sigma \gt1$
) due to the negative wealth effect of technology on labor supply. Instead, it is better to inspect Table 2 which contains the whole pricing kernel including the joint effect of consumption and labor. Specifically, column 6 of Table 2 indicates that the short- and long-run components of the pricing kernel are negatively correlated implying lower risks and equity premium.
The results in column 7 indicate that the no-entry model is less successful than the entry model in explaining macro- and finance data because it implies lower variations in the short- and long-run components of the pricing kernel as well as their correlation is perfectly negative, whereas the entry model implies larger standard deviation of the components which have lower negative correlation leading to a non-negligible equity premium of 76 basis points.
Impulse responses to a positive technology shock on Figures 2 and 4 confirm that GHH preferences lead to more amplification and persistence relative to separable preferences using our benchmark calibration.
Overall, the firm entry model better addresses the translation problem by three main features. First, firm entry induces persistent and significant movement in macroeconomic variables affecting asset payoffs and its riskiness. Second, our choice of IES
 $\gt$
1 implies that the household consumes more in the future when more varieties available and a sudden negative innovation to technology is more painful (low consumption with low asset returns). Third, GHH preferences remove the wealth effect of technology on labor supply and imply complementarity between consumption and labor which cannot act as a hedge in the case of negative shocks.Footnote
14
4.5.3. The role of price rigidity and the inclusion of a Taylor rule
With flexible prices, firms operate at their optimal (constant) markups and labor demand is less procyclical. Hence, asset payoffs and returns which are linked to macroeconomic variables through dividends exhibit lower degree of procyclicality, and investors demand lower risk premia. With flexible prices, equity premium drops by about 100 basis points to 480 basis points (see column 4 of Table 3).
Realized consumption growth, however, exhibits higher variation with flexible prices as there is a tighter link between consumption and the technology shock in the absence of markup fluctuations. The volatility of expected consumption growth which is needed for significant long-run risks is lower with flexible prices. The correlation between the short and long parts of the pricing kernel is also lower with flexible prices implying a reduction in long-run risks and risk premia relative to the case of sticky prices.
The specification of interest rate rules has non-negligible impact on equity premia.Footnote 15 We display impulse responses of model variables to a one-standard deviation technology shock with three different interest rate rules on Figures 7 and 8.
The comparison of three types of interest rate rules in our benchmark model: (i) benchmark rule with response to contemporaneous inflation only (solid); (ii) interest rate rule with smoothing parameter of 0.5 (dotted); (iii) Taylor-type interest rate rule (in line with the calibration in Table 1) with interest rate smoothing as well as response to the output growth (dashed).
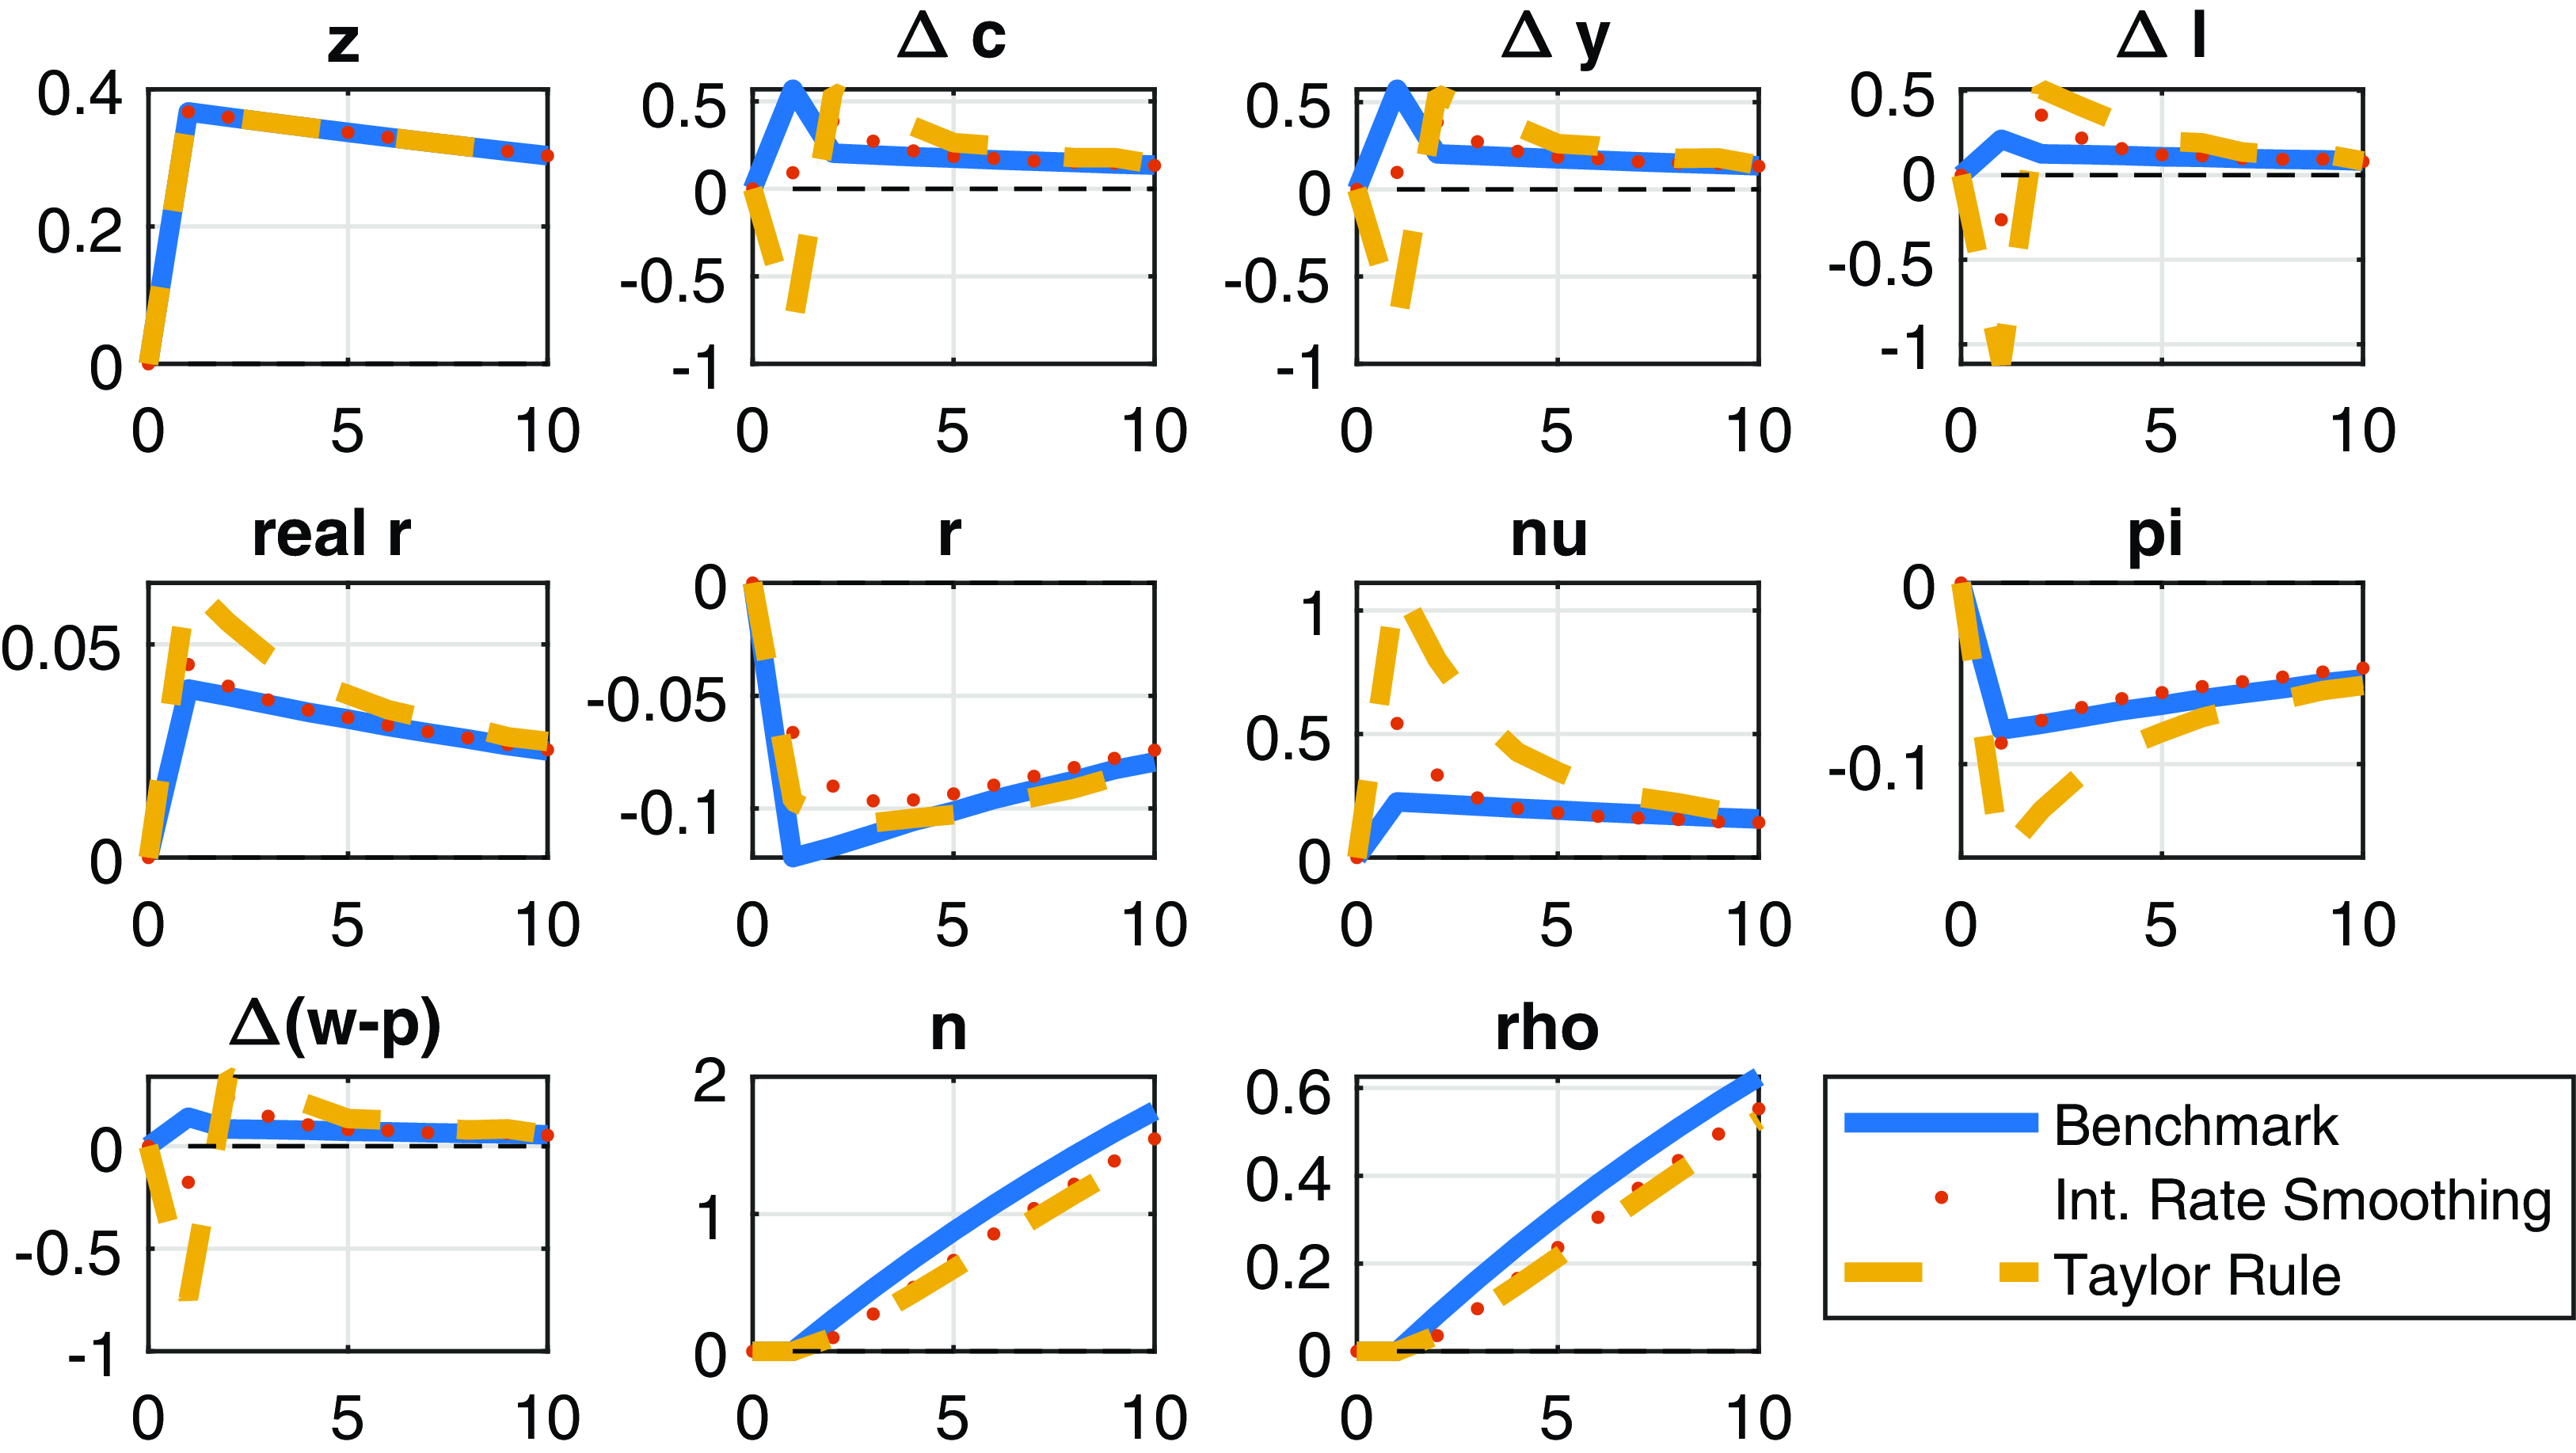
The comparison of three types of interest rate rules in our benchmark model: (i) benchmark rule with response to contemporaneous inflation only (solid); (ii) interest rate rule with smoothing parameter of 0.5 (dotted); (iii) Taylor-type interest rate rule (in line with the calibration in Table 1) with interest rate smoothing as well as response to the output growth (dashed). Ex means the expected excess return on the aggregate dividend claim.
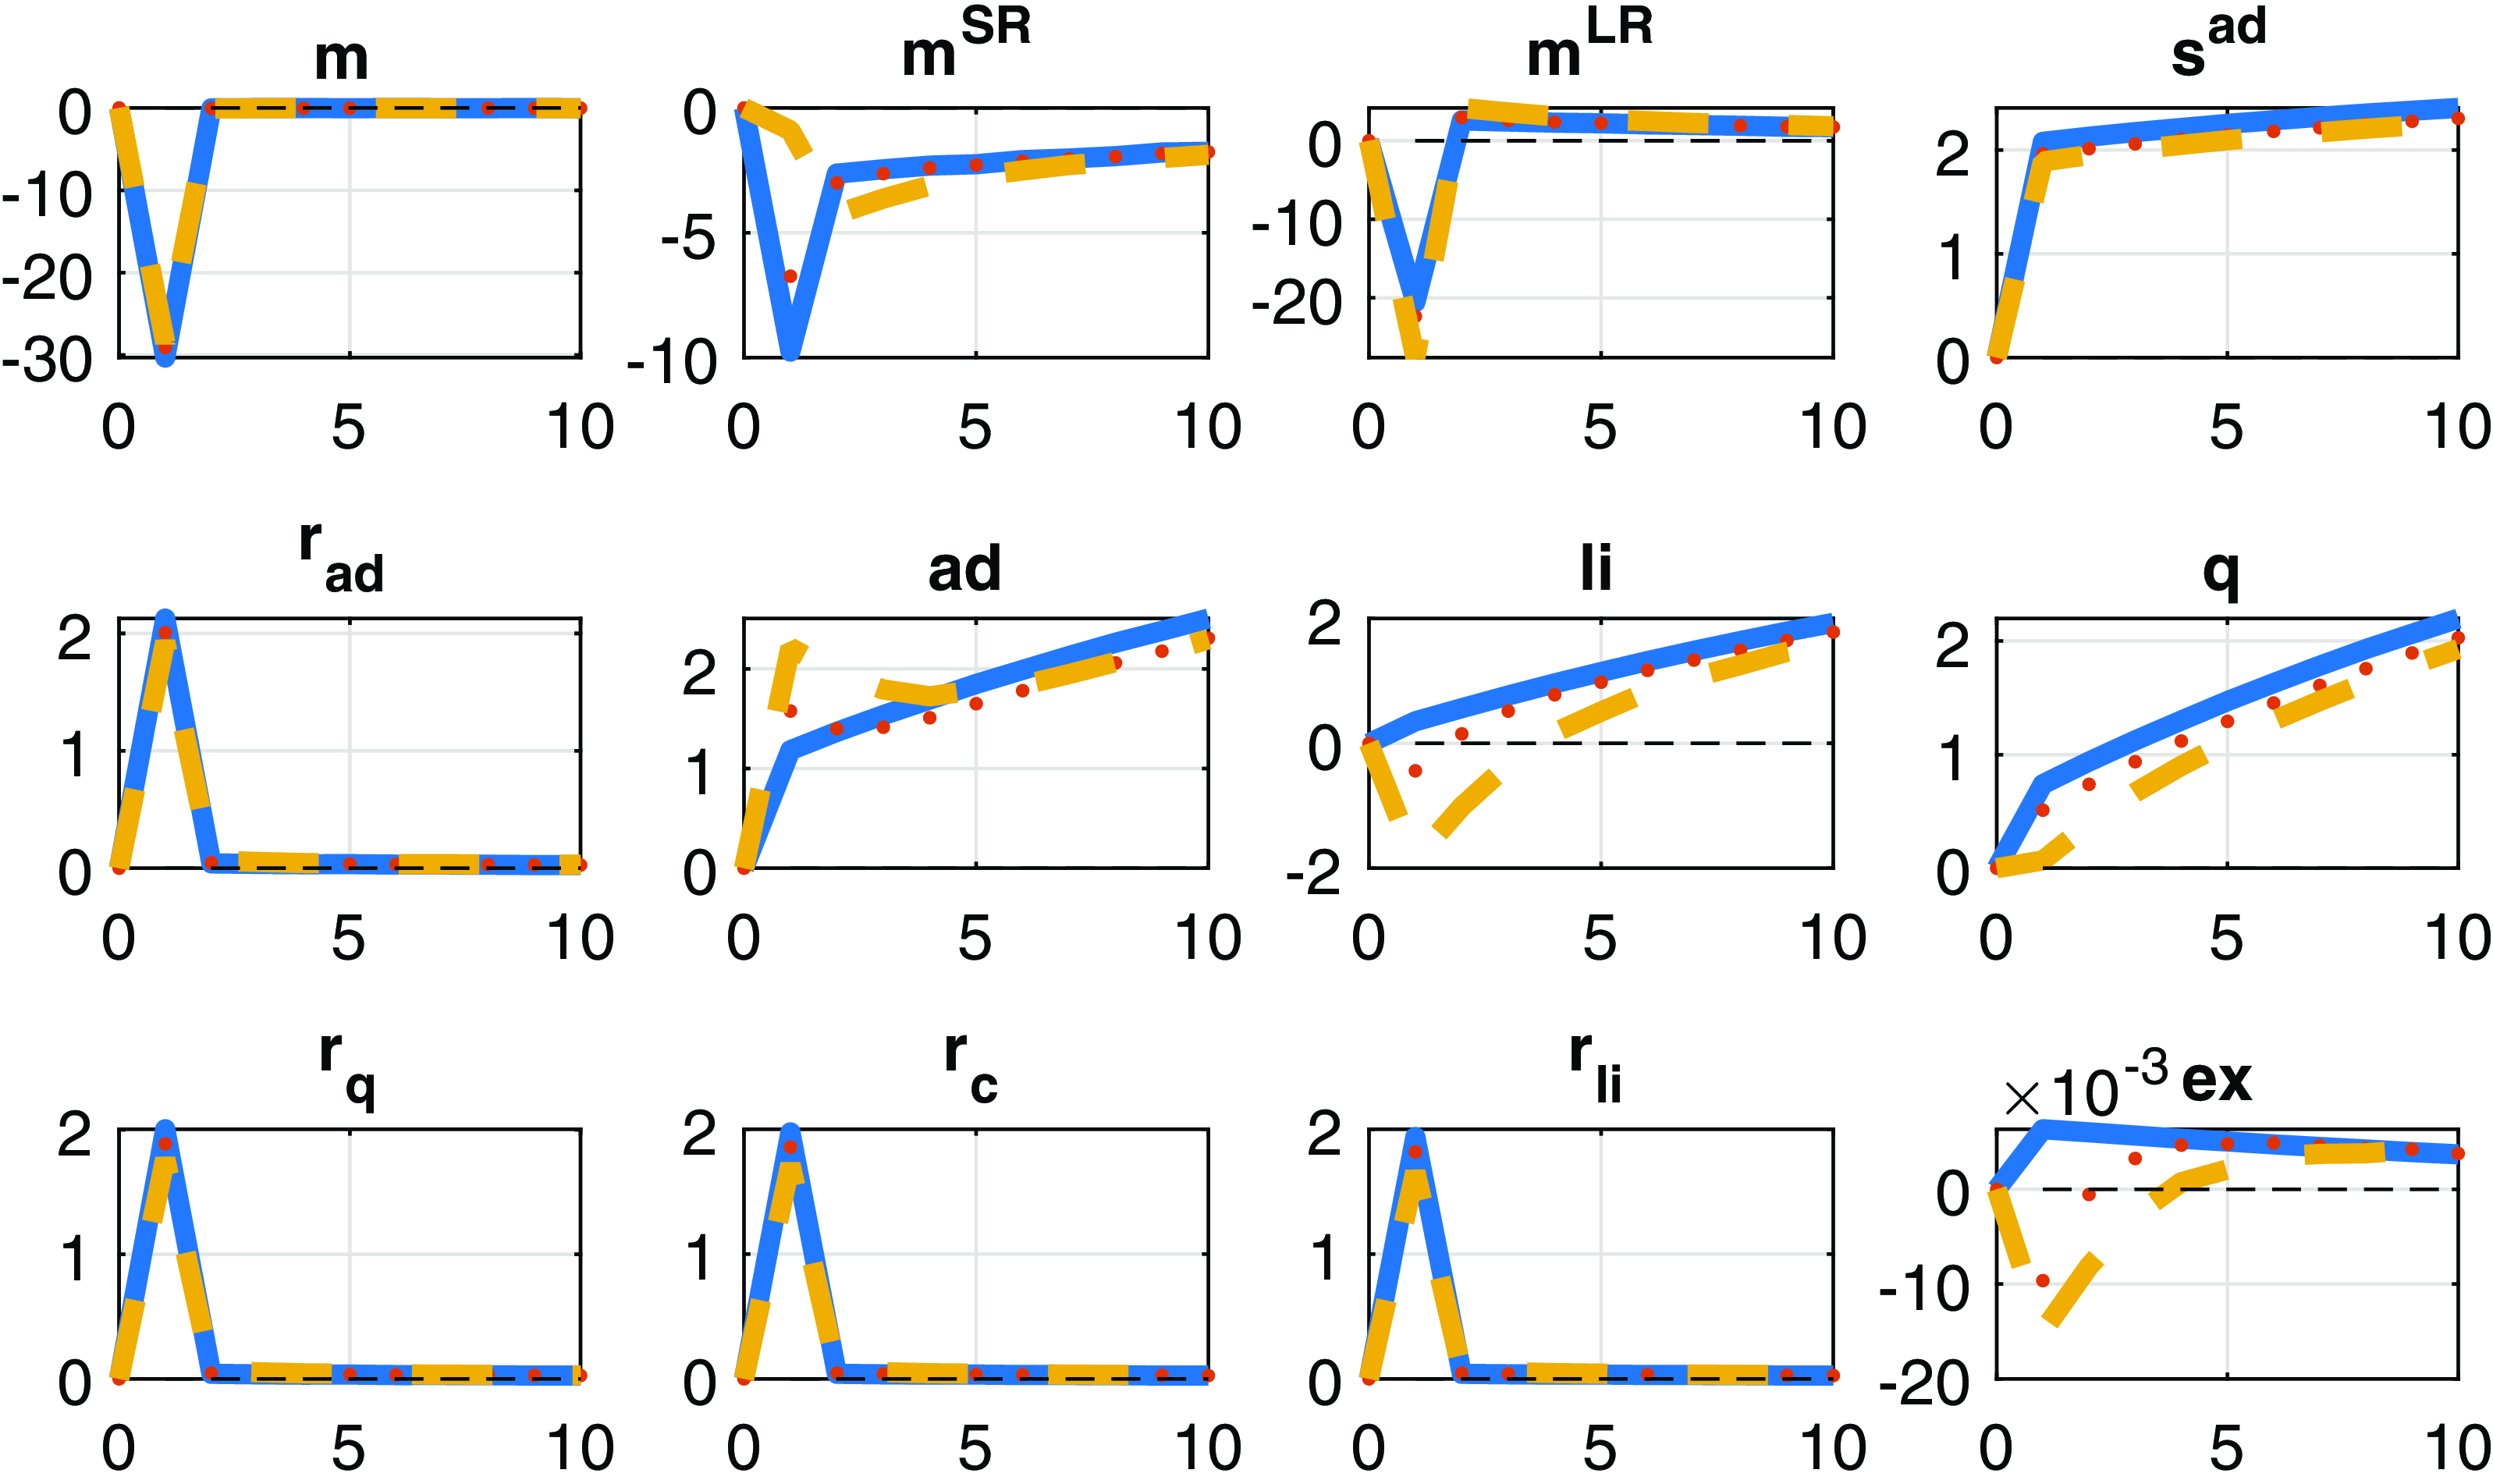
The introduction of interest rate smoothing implies smaller changes in the interest rates and, in equilibrium, less procyclicality and variation in macroeconomic variables reducing the risk premia. The standard deviation of realized consumption growth reduces to 2.44 from 2.88 (benchmark) after the introduction of a small degree of interest smoothing of 0.5 (not reported in the tables). The unconditional mean of the equity premium also reduces to 5.15 from 5.71 (not reported in the tables).
The short-run component of the pricing kernel also displays smaller variation with interest rate smoothing. After a positive shock to technology consumption growth barely moves on impact with interest rate smoothing and leading to lower expected risk premia,
 $E_{t}[r_{\text{ad},t+1}-r_{f,t}]$
(called “ex” in the bottom right corner of Figure 8) which reduces by −0.014 percentage points on impact.
However, introducing reaction to the output growth by itself raises the standard deviation of variables as well as the risk premia. Taylor-type rules with interest rate smoothing and a reaction to the growth rate of output induce the highest increase in the real interest (called "real r" on the figure) triggering even negative growth rates on impact.
Finally, we consider a Taylor rule with an interest rate smoothing coefficient of 0.7 and a reaction of 0.125 to output growth. Figure 8 shows that the autocorrelation in the short-run component of the pricing kernel changes with a Taylor rule. The latter has the consequence of a negative correlation between the short- and long-run components of the pricing kernel which, by itself, reduces long-run risks and the risk premium. This reduction is, however, mitigated by the rise in the volatility of the expected consumption growth engineering higher standard deviation in the long-run component of the pricing kernel.
Interest rate smoothing dominates the effects of the reaction to the output growth in terms of risk premia: the risk premium decreases by 100 basis points to 488 basis points (see column 5 of Table 3). However, the standard deviation of realized consumption growth is dominated by the reaction to output growth and is more volatile in the Taylor rule scenario.
4.5.4. Comparison of our results to Li and Palomino (Reference Li and Palomino2014)
In this section, we highlight the differences between the setup and findings of Li and Palomino (Reference Li and Palomino2014) and ours. First, LP finds that temporary technology shocks yield zero risk premia. Second, they find that permanent technology shocks lead to positive but small risk premia if there is wage rigidity in the model. LP’s story for the positive price of risk in response to permanent technology shocks is the following.
To understand it, they first consider the case of flexible wages. With permanent shocks, output is permanently low, and hence, the price ratio (the price of output divided by output) will be high at times of low output making output claims a hedge (with their calibration of IES
 $\lt$
1)!Footnote
16
With wage rigidity (keeping IES
 $\lt$
1), however, labor becomes procyclical and mean-reverting in response to permanent technology shocks implying that output will increase in the future (mean reversion) and is not permanently low. Hence, the price ratio will be low with negative permanent shocks making the output claims risky in the case of wage rigidity as long as IES
 $\lt$
1.
In LP, the choice of IES
 $\lt$
1 implies that the wealth effect always dominates the substitution effect. A low IES means that the degree of substitutability between current and future consumption is low. IES
 $\lt$
1 implies consumption smoothing. With IES
 $\lt$
1, the volatility in expected consumption growth is low relative to realized consumption growth making it difficult for the model to generate sizeable long-run risks.
Why does the LP model generate long-run risks? It is because of permanent technology shocks making the correlation between current and the continuation value of utility positive. Or, equivalently, long-run risks arise when the correlation between the short- and long-run components of the pricing kernel is positive. Why long-run risks are higher with firm entry? It is because of the positive autocorrelation of consumption growth in the firm entry model. In LP, consumption growth exhibits a small but positive number close to zero at various lags for both permanent and temporary technology shocks consistent with the impulse responses reported in their paper.
In LP, even the choice of IES
 $\gt$
1 does not introduce autocorrelation in consumption growth in line with the predictions of our no-entry model. However, the firm entry model can match the autocorrelation of 0.49 in US data with IES
 $\gt$
1 due to the persistence induced by the entry process making asset payoffs more procyclical and carrying a higher price of risk.
5. Conclusion
Stock market investors are mainly concerned about long-run risks. Instead of a fixed number of goods, our framework assumes a growing number of products which appear in the form of new firms that face barriers to entry in the form of a sunk entry cost and timing frictions. Firm entry drives persistent movements in macroeconomic and financial variables such as output, consumption, and dividends. With preferences for an early resolution of uncertainty long risks about the future evolution in varieties are priced in the return of assets in the form of a risk premia.
For future work, it would be interesting to see how robust our results to a number of additional features such as physical capital or introducing strategic interactions among firms as in Etro and Colciago (Reference Etro and Colciago2010). Some of the assumptions of the original Bilbiie et al. (Reference Bilbiie, Ghironi and Melitz2007, Reference Bilbiie, Ghironi and Melitz2012) firm entry model could be also relaxed. For instance, Cavallari (Reference Cavallari2015) endogenize firm exit rate based on the fact that exit rate is more volatile through the business cycle, and points to the importance of entry costs. We speculate that endogenous exit could mitigate the endogenous TFP movements caused by firm entry and would therefore reduce uncertainty as well as the risk premia.
Supplementary material
The supplementary material for this article can be found at http://doi.org/10.1017/S1365100523000287.



