Introduction
One of the most fundamental, functional, and anatomical dissociations within the visual system involves the distinction between the parvocellular (P-) and magnocellular (M-) visual pathways subserving the ventral and dorsal cortical processing streams, respectively. These pathways are associated with different cortical latencies, different cortical structures, and subserve different visual functions—which can be related to perception (P-) and action (M-). The magnocellular system primarily originates with the relatively less dense population of rod receptors that are found in extrafoveal retina and thus encodes information with less spatial resolution than the parvocellular system. M-pathway responses have relatively short latencies and are more transient than P-pathway responses. These “transient channels” primarily signal the location and presence of stimuli or the motion of stimuli over time and have been implicated in fast orienting movements (Mishkin & Ungerleider, Reference Mishkin and Ungerleider1982). In contrast, visual functions associated with pattern vision including brightness, contrast, and form processing require fine spatial detail and primarily involve the parvocellular system (see Breitmeyer & Ogmen, Reference Breitmeyer and Ogmen2006), which largely originates with the cone receptors within the fovea. Responses within the P-pathway typically have longer latencies and are more sustained than magnocellular responses. The onset of a visual stimulus activates both short-latency, transient magnocellular responses and longer-latency, sustained parvocellular responses. Multisensory integration studies demonstrating psychophysical effects of other modalities on the perception of visual stimuli have largely ignored this fundamental, anatomical, and functional division within the visual system and its implications for perception.
Actual visual stimuli (Stein et al., Reference Stein, London, Wilkinson and Price1996; Bolognini et al., Reference Bolognini, Frassinetti, Serino and Ladavas2005; Manjarrez et al., Reference Manjarrez, Mendez, Martinez, Flores and Mirasso2007) and visual illusory phenomena (Watkins et al., Reference Watson and Pelli2006, Reference Watkins, Shams, Josephs and Rees2007) have been shown to be perceptually enhanced by the simultaneous presence of sound. But these studies have primarily used the detection of low spatial frequency, flashed, peripheral targets. It is thus likely that these studies primarily investigated the enhancement of information that was being processed predominantly by the M-pathway, subserving the dorsal cortical stream of visual processing. Perry et al. (Reference Perry, Oehler and Cowey1984) have shown that in primates, about 80% of ganglion cells project to parvocellular lateral geniculate nucleus and that about 10% project to magnocellular layers (see Callaway, Reference Callaway2005, for a review) and thus the parvocellular system is relatively massive compared to the magnocellular system (see Livingstone & Hubel, Reference Livingstone and Hubel1988). Moreover, its relatively sustained response pattern plays a functional role in analyzing stimulus patterns or attributes for object identification and association and thus perception. Here, we test the hypothesis that tasks dominated by P-pathway activation also show auditory–visual integration effects.
Does this extensive and prodigious system process multisensory integrated information such as to have perceptual consequences? Multisensory interactions between auditory and visual signals occur at multiple levels of processing including low-level subcortical and cortical areas (see Calvert et al., Reference Calvert and Thesen2004; Driver & Noesselt, Reference Driver and Noesselt2008; Stein & Stanford, Reference Stein and Stanford2008, for reviews), including primary visual cortex (Foxe & Schroeder, Reference Foxe and Schroeder2005). Sensory interaction in V1 regions may be demonstrated both perceptually and physiologically when, for example, a single visual flash is presented with two brief noise bursts—the “fission illusion” (single flash is perceived as two separate independent flashes). Conversely, when a single auditory noise burst is presented with two brief visual flashes, the two flashes appear as a single flash—the “fusion illusion” (Watkins et al., Reference Watkins, Shams, Josephs and Rees2007). Using functional magnetic resonance imaging (MRI), Watkins et al. (Reference Watkins, Shams, Josephs and Rees2007) found that the fission illusion was linked with a significant increase in V1 activity compared to the activity observed when no sound was present. Complementary to this finding, a decrease in V1 activity was observed during the fusion illusion. These results support a direct relationship between activity level changes in primary visual cortex that correspond with sensory integration and conscious perception. Moreover, psychophysical evidence suggesting auditory–parvocellular interaction has been observed from reaction time advantages occurring for both long-wavelength (red) and short-wavelength (purple) audiovisual stimuli presented foveally (Leo et al., Reference Leo, Bertini, Di Pelligrino and Ladavas2008). Short-wavelength stimuli are processed selectively through the parvocellular system (see Leo et al., Reference Leo, Bertini, Di Pelligrino and Ladavas2008), and thus the reaction time advantages must have resulted from integration mediated by cortical areas receiving predominantly parvocellular inputs (see Mullen et al., Reference Mullen, Dumoulin, Mcmahon, de Zbicaray and Hess2007). Here, we create stimuli that are selective for parvocellular processing by using two separate paradigms measuring perceptual properties—metacontrast masking (experiment 1) and orientation discrimination (experiment 2)— which are known to be mediated predominantly by P-pathway processing.
Experiment 1: Metacontrast masking
To study the effect of auditory–visual interactions specifically in the P-pathway, experiment 1 employed a metacontrast masking paradigm where performance is known to depend primarily on parvocellular activity. Enhancement of a visual target as a result of sensory interaction during a metacontrast detection task would tend to cancel or attenuate the masking effect. In a metacontrast masking paradigm, the target appears before the mask (i.e., it is a type of backward masking) and does not overlap the mask spatially (Alpern, Reference Alpern1953). The first experiment exploits our current understanding of M- and P-pathway interaction during metacontrast masking based on the “dual-channel theory” of visual masking (Breitmeyer & Ganz, Reference Breitmeyer and Ganz1976; Breitmeyer, Reference Breitmeyer1984; Breitmeyer & Ogmen, Reference Breitmeyer and Ogmen2006). The theory is that transient short-latency M-pathway activity associated with the mask inhibits the sustained longer latency P-pathway activity associated with the target and thus reduces its visibility (Breitmeyer & Ganz, Reference Breitmeyer and Ganz1976; Breitmeyer, Reference Breitmeyer1984; Breitmeyer & Ogmen, Reference Breitmeyer and Ogmen2006).
During metacontrast masking, inhibition is typically regarded as interchannel (Breitmeyer & Ganz, Reference Breitmeyer and Ganz1976; Breitmeyer, Reference Breitmeyer1984; Breitmeyer & Ogmen, Reference Breitmeyer and Ogmen2006). In a target–mask sequence, interchannel inhibition would reduce the visibility of a target by suppressing particularly the parvocellular response, which signals the brightness, contrast, and contour properties of a stationary stimulus (see Breitmeyer & Ogmen, Reference Breitmeyer and Ogmen2006). At the optimal mask stimulus-onset asynchrony (SOA), a mask can completely suppress these properties from reaching awareness while maintaining responses associated with location, presence, and action (Neumann & Klotz, Reference Neumann, Klotz, Umiltà and Moskovitch1994; Klotz & Wolff, Reference Klotz and Wolff1995; Ansorge et al., Reference Ansorge, Klotz and Neumann1998; see also Breitmeyer et al., Reference Breitmeyer, Ro and Singhal2004; Ro et al., Reference Ro, Singhal, Breitmeyer and Garcia2009), which are mediated by dorsal processing.
Neurophysiological evidence for suppression of cortical responses arising from metacontrast masking of visual targets has been obtained from a number of studies. Bridgeman (Reference Bridgeman1980) used a brightness discrimination task for which both psychophysical measurements and responses from single neurons in monkey V1 were obtained for metacontrast-masked targets. The results showed firing rates that correlated with perceived brightness regardless of whether or not the perceived brightness was manipulated directly by luminance modulation or by the mask. Kondo and Komatsu (Reference Kondo and Komatsu2000) recorded firing rates from V4 in awake monkeys during metacontrast masking. Area V4 receives input from areas coding central space in V1 and is part of extrastriate cortex, a major source of visual input to the inferotemporal cortex (IT) (Desimone et al., Reference Desimone, Fleming and Gross1980; Shipp & Zeki, Reference Shipp and Zeki1985, Gattass et al., Reference Gattass, Ghobrial and Bunn-Moreno1988; Distler & Hoffmann, Reference Distler and Hoffmann1993), which plays a key role in visual form processing (Desimone et al., Reference Desimone, Albright, Gross and Bruce1984). These results showed significant reduction in target response firing rates in ventral area V4. Taken together with several other investigations showing that sound can enhance visual object processing in ventral cortices (Busse et al., Reference Busse, Roberts, Crist, Weissman and Woldorff2005; Suied et al., Reference Suied, Bonneel and Viaud-Delmon2009), these studies support the possibility of sensory integration mediated within the P-pathway.
If auditory stimulation enhances the P-activity associated with a masked target then changes in luminance thresholds should arise when the sound is more or less temporally aligned with the visual target. As the time of arrival of auditory information at the auditory cortex is about 40 ms before visual information arrives at the visual cortex (V1 latency, 41–55 ms: Clark & Hillyard, Reference Clark and Hillyard1996; Foxe & Simpson, Reference Foxe and Simpson2002; Foxe & Schroeder, Reference Foxe and Schroeder2005; A1 latency, 9–15 ms: Celesia, Reference Celesia1976; Clark & Hillyard, Reference Clark and Hillyard1996; see Molholm et al., Reference Molholm, Ritter, Murray, Javitt, Schroeder and Foxe2002), target enhancement could be expected to be strongest when the onset of the auditory stimulus occurs about 40 ms after visual target onset—when the neural representation of the auditory stimulus is more likely to be in synchrony with P-pathway activity. This is likely to be at a stage before simultaneity constancy (Kopinska & Harris, Reference Kopinska and Harris2004) is initiated.
Materials and methods
Participants
Eight participants (five male, mean age = 26 years, range 22–43 years) completed experiment 1 and each of them signed an informed consent form. All participants had normal hearing and normal or corrected-to-normal vision. This study was conducted according to the procedures outlined in the York University ethics code for human participants. Participants not affiliated with the Harris Lab were paid $10 CDN.
Apparatus
All experiments were carried out in a dark soundproof room. Visual stimuli were created with a PC running Matlab version 7 release 14 in conjunction with the Psychophysics Toolbox extensions version 2.54 (Brainard, Reference Brainard1997). A 21″ Sony Trinitron flat screen cathode ray tube monitor was used to display the stimuli at a refresh rate of 100 Hz and a resolution of 1280 × 1024 pixels. Participants were seated 57 cm from the screen. During the experiment, the head was stabilized by resting on a chinrest with the subject’s eyes level with the centre of the screen. Two speakers (V20; Logitech, Romanel-sur-Morges, Switzerland) were fixed to each side of the monitor. The speakers were at the same height as the visual stimuli and 25° on either side of the centre of the screen.
Stimuli
Visual targets were 1° circles of uniform luminance flashed for a duration of 10 ms. The mask was an annulus (inner diameter 1.1°, outer diameter 2.5°, and luminance of 3 cd/m2) surrounding the target. It was displayed for 200 ms. Both target and mask were centred in an outlined square which subtended 2.7°. Background luminance was 0.03 cd/m2. Auditory stimuli were 75 db, 10 ms bursts of white noise played identically through both speakers.
Procedure
An adaptive method involving a two-interval forced choice (2IFC) task was used to determine the threshold for detecting the target. Participants were required to choose which of two equal length intervals contained the visual target. Responses were made using the numerical keypad on a standard keyboard. After each response there was a 500-ms pause before the next trial. The luminance of the target was varied using QUEST (Watson & Pelli, Reference Watson and Pelli1983) to compute the most likely 75% threshold for target detection based on the mean of a posterior probability density function of target luminance values, derived using Bayes’ rule, given the set of responses obtained from previous trials. The thresholds were derived by fitting a Weibull function to the data obtained (see “Data analysis,” below). Target luminance values tested were constrained to range between 0.03 and 10 cd/m2. QUEST was set to 75 trials per participant. The delay between interval 1 and interval 2 was 500 ms. The visual stimulus sequence is illustrated in Fig. 1.
Experiment 1: 2IFC masking procedure. On each trial, participants were required to choose which of two stimulus intervals contained a target within an outlined square in the centre of a monitor. In the target-containing interval, the target was displayed for 10 ms. Following target onset, a delay of 20, 40, or 60 ms occurred before mask onset. Masks were displayed for 200 ms.

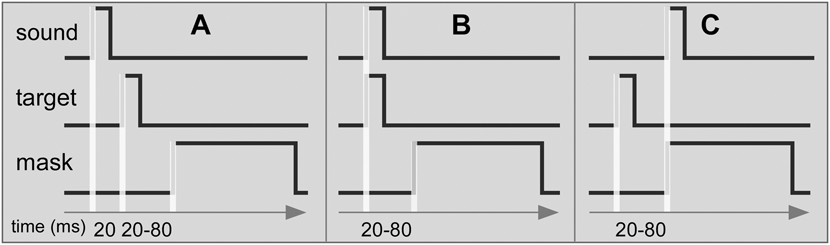
Four target–mask onset asynchronies were tested, ranging from 20 to 80 ms in 20-ms steps. This range was selected based on results obtained from previous metacontrast studies (see Breitmeyer & Ogmen, Reference Breitmeyer and Ogmen2006) and maximal effects obtained in a pilot study. Either both of the intervals included a sound or neither did. Target–sound asynchrony was varied such that sound onset occurred 20 ms before target onset (sound-first condition), synchronous with the target (sound–target condition), or synchronous with the mask (sound–mask condition) at each target–mask asynchrony. These three sound conditions are illustrated in Fig. 2. Intervals not containing a target stimulus were exactly the same as target-containing intervals in all aspects with the exception of the presence of a visual target. All participants also completed a no-sound control condition (no-sound condition). Thus, each participant completed 75 trials × 4 target–mask asynchronies × 4 sound–target conditions (including the silent baseline condition) for a total of 1200 trials.
Experiment 1: stimulus sequence. (A) Sound-first condition—sound onset occurred 20 ms before target onset. (B) Synchronous sound–target condition—target and sound onset were matched, followed by a variable delay before mask onset. (C) Synchronous sound–mask onset condition—sound onset occurred after the variable delay matched to mask onset. Target–mask delays ranged between 20 and 80 ms in 20-ms steps.

All conditions and asynchronies were randomly interleaved throughout the experiment. Each participant was permitted to determine the length and number of experimental sessions and to take as many breaks as desired. Seven participants completed the experiment over two sessions lasting approximately 35 min each. One participant completed the experiment in one, approximately 80 min, session.
Data analysis
Psychometric curves were fitted to the luminance versus correct interval detection rate obtained from each adaptive track by the Weibull equation  , where α is the 75% correct luminance intensity threshold and β is the slope of the function. f(x) was scaled to range between 0.5 and 1 as 0.5 represents the chance level. Curves were fitted to the data using a maximum likelihood estimate of α and β. Specifically, the optimal combination of α and β maximized the likelihood of the data based on the sum of the binomial probability density function values obtained at each of tested luminance values. The thresholds obtained were then compared using an analysis of variance (ANOVA).
Results
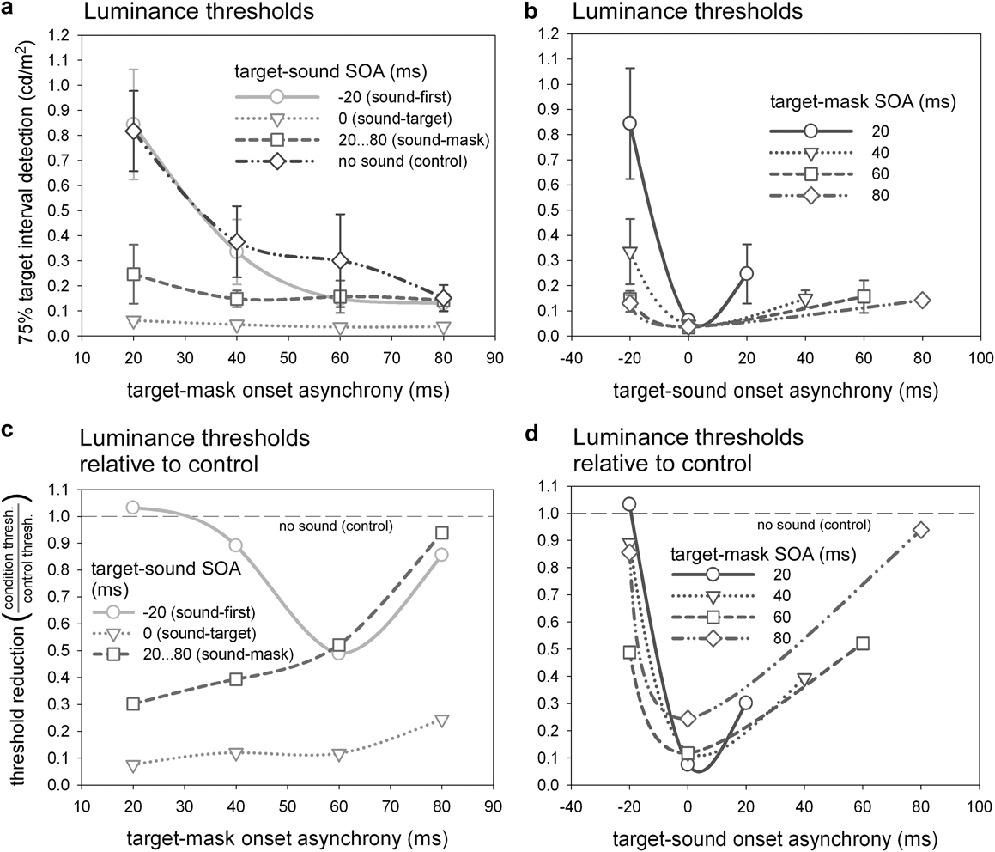
Fig. 3 depicts the mean 75% correct detection values for each condition with standard error bars plotted as a function of the target–mask asynchrony (Fig. 3a) or the target–sound asynchrony (Fig. 3b). The reduction in threshold caused by the presence of the sound is shown in Fig. 3c as a function of target–mask asynchrony and in Fig. 3d as a function of target–sound asynchrony. The largest enhancing effect consistently occurred when the sound and target had temporally matched onsets. This is clearly seen in Fig. 3c in which the reduction in luminance thresholds is greater when the target was synchronous with the sound than for any other target–mask timings and in Fig. 3d in which the lowest point (maximum threshold reduction) of each graph occurs when the target is synchronous with the sound.
Luminance thresholds. Thresholds plotted as a function of target–mask asynchrony for each of the sound conditions (a) and as a function of target–sound asynchrony for each of the mask conditions (b). Reduction in thresholds relative to no-sound controls are plotted as a function of target–mask asynchrony (c) and as a function of target–sound asynchrony (d). All four graphs show the same data plotted in different ways. Standard errors of each QUEST threshold across participants are shown in (a) and (b).

Within-subject ANOVAs, using Greenhouse–Geisser degree of freedom adjustment for violations of sphericity, were used to compare the thresholds obtained across the range of target–mask onset asynchronies for the sound–target condition with (i) the no-sound control thresholds, (ii) the sound-first thresholds, and (iii) the sound–mask-matched onset thresholds. Sound–target luminance thresholds were significantly lower than in the no-sound condition, F (1, 5) = 8.97, df = 1, p < 0.05, in the sound-first condition, F (1, 5) = 11.02, df = 1, p < 0.05, and marginally lower than in the sound–mask condition, F (1, 5) = 5.53, df = 1, p = 0.065. A main effect of target–mask onset asynchrony was also observed, F (1.24,15) = 15.73, df = 1.2, p < 0.05, revealing a significant reduction in luminance threshold as target–mask asynchrony increased.
Discussion (experiment 1)
Experiment 1 revealed an enhancement of luminance thresholds of metacontrast-masked visual stimuli by the addition of a simultaneous sound. Although the sound contained no information about which interval contained the target, the effect of masking was almost completely removed in the sound–target configuration. When sound onset followed the target (by a varying amount, time-locked to the mask), the enhancing effect was still observed up to 40 ms.
The data obtained in experiment 1 directly support the hypothesis that auditory–visual multisensory integration can improve the visibility of a metacontrast-masked visual stimulus. This is compatible with an enhancement of the parvocellular pathway (Breitmeyer & Ganz, Reference Breitmeyer and Ganz1976; Breitmeyer, Reference Breitmeyer1984; Breitmeyer & Ogmen, Reference Breitmeyer and Ogmen2006, also see Bridgeman, Reference Bridgeman1980; Burr et al., Reference Burr, Ross and Morrone1986). The idea that enhancement occured primarily within the P-pathway is also supported by the fact that our targets were presented in the foveal region, which is predominantly populated by cone photoreceptors connected to the P-pathway (see Livingstone & Hubel, Reference Livingstone and Hubel1988).
Bolognini et al. (Reference Bolognini, Frassinetti, Serino and Ladavas2005) also demonstrated enhancement of a masked visual stimulus by sound (also see Frassinetti et al., Reference Frassinetti, Bolognini and Ladavas2002). The present study differs from these studies in the choice of masking paradigm used. Their arrangement incorporated a single light emitting diode (LED) target and their mask consisting of four LEDs surrounding the target. This arrangement is an example of what Enns and Di Lollo (Reference Enns and Di Lollo2000) define as a “four-dot mask”—the effectiveness of which has been observed to be modulated by spatiotemporal factors associated with attention and reentrant cortical activity. It is therefore difficult to specify whether the enhancement found by Bolognini et al. (Reference Bolognini, Frassinetti, Serino and Ladavas2005) was due to activity in the parvocellular and/or magnocellular pathways. The neural basis of our metacontrast paradigm is well established as being parvocellular (Breitmeyer & Ganz, Reference Breitmeyer and Ganz1976; Breitmeyer, Reference Breitmeyer1984; Breitmeyer & Ogmen, Reference Breitmeyer and Ogmen2006) and thus we conclude that our enhancement was predominantly due to auditory–visual sensory integration within the parvocellular pathway.
We found the largest metacontrast masking effect with a 20-ms target–mask asynchrony and no sound (Fig. 3a). This asynchrony is somewhat less than in other metacontrast studies which typically show the masking effect to peak with a target–mask asynchrony of between 50 and 80 ms (Rogowitz, Reference Rogowitz1983; Enns & Di Lollo, Reference Enns and Di Lollo2000). Rogowitz (Reference Rogowitz1983), however, used a metacontrast paradigm for which target contrast was varied systematically and found that as target contrast decreased, target detectability was lowest at target–mask asynchronies between approximately 20 and 50 ms for targets. Targets in the present study were of similar low intensity and contrast. Stewart and Purcell (Reference Stewart and Purcell1974) directly varied background intensity and found that peak masking effects shifted toward lower SOAs as a function of decreasing background intensity. Taken together, these results are in line with a parvocellular-mediated auditory–visual integration effect which attenuates the effect of the mask used in metacontrast masking and thus enhances the visibility of the previously masked stimuli.
Target–sound asynchrony
Auditory stimulation with an onset time preceding the onset of the visual target by 20 ms had no effect on the luminance threshold required to identify the interval containing the target. This is best illustrated by the plots of Fig. 3d in which the 20-ms sound-leading thresholds are shown clearly not to be different from the no-sound controls. This finding is congruent with the results of Bolognini et al. (Reference Bolognini, Frassinetti, Serino and Ladavas2005) who showed that when a sound preceded the masked target by 100 ms there was no effect on its detection threshold. Auditory–visual processing latency differences will likely further separate the activity due to light and sound in this condition, thus minimizing the opportunity for audiovisual integration and thus minimizing the probability of enhancement.
When the sound and target onset were simultaneous, there was a considerable reduction in the target luminance required to identify the target-containing interval for all values of mask timing (see Fig. 3d), that is the sound tended to cancel the effect of the mask. In the context of the dual-channel theory of masking (Breitmeyer & Ganz, Reference Breitmeyer and Ganz1976; Breitmeyer, Reference Breitmeyer1984; Breitmeyer & Ogmen, Reference Breitmeyer and Ogmen2006), this finding supports the hypothesis that multisensory integration can occur within the parvocellular pathway and enhances the detection of visual targets even if the auditory–visual latency differences result in asynchronous neural activity.
In the sound–mask matched onset condition, there was also a significant reduction in luminance threshold. Temporal integration between auditory and visual stimuli occurring when the onset of the visual stimulus occurred before the onset of the auditory stimulus has resulted, psychophysically, in effects at least as large as when the stimuli were synchronous (Fendrich & Corballis, Reference Fendrich and Corballis2001; Slutsky & Recanzone, Reference Slutsky and Recanzone2001; Bertelson & Aschersleben, Reference Bertelson and Aschersleben2003; De Gelder & Bertelson, Reference De Gelder and Bertelson2003; Morein-Zamir et al., Reference Morein-Zamir, Soto-Faraco and Kingstone2003; Recanzone, Reference Recanzone2003; Vroomen & de Gelder, Reference Vroomen and de Gelder2004). Although there was a significant threshold reduction in the present study, the maximum effect occurred when the sound was actually synchronous with the target. It is possible that the short target duration and low target contrasts that we employed may have evoked a peak in the parvocellular response that was relatively early and relatively small compared that induced by longer, higher-contrast stimuli, leading to optimal enhancement at shorter asynchronies than the SOAs tested here. In the pilot phase of this experiment, longer target durations had the effect of increasing the correct detection rate of the target-containing interval such that a 75% rate was not achievable with the contrast levels that could be produced using our apparatus.
When the sound and mask were synchronous, it might be expected that auditory-induced activity magnocellular channel activity might strengthen the metacontrast effect by enhancing the effectiveness of the mask. The data are not consistent with this hypothesis and likely reflect the fact that the mask stimuli, at 3 cd/m2, were clearly suprathreshold. Sensory integration effects are strongest when either one or both stimuli are near threshold, a tendency known as inverse effectiveness (Stein et al., Reference Stein, London, Wilkinson and Price1996).
Experiment 1 demonstrated an enhanced visibility of a metacontrast-masked target that is likely to be directly related to signal strength within the parvocellular system of the visual ventral stream. This finding therefore predicts that other parvocellular-mediated tasks may also be affected by the addition of multisensory signals resulting from the integration of visual and auditory stimulation. Experiment 2 tests this prediction by determining if a sound affects visual orientation discrimination.
Experiment 2: Visual orientation discrimination
Ventral stream cortical activity is necessary for determining the visual shape and orientation of a stimulus (Mishkin & Ungerleider, Reference Mishkin and Ungerleider1982). Experiment 2 aimed to determine if orientation processing might also be affected by auditory–visual sensory integration. The P-pathway is required for orientation judgments, especially of high spatial frequency stimuli (Mishkin & Ungerleider, Reference Mishkin and Ungerleider1982). Altering the activity of cells in the P-pathway might therefore be expected to affect the ability to discriminate the orientation of high spatial frequency stimuli. Multisensory orientation discrimination has been explored by Berger et al. (Reference Berger, Martelli and Pelli2003). In their study, the perceived number of flashed full-contrast Gabor patch stimuli was manipulated by auditory beeps in a paradigm similar to that used by Watkins et al. (Reference Watkins, Shams, Josephs and Rees2007) to create “fission/fusion” illusions. Participants were required to discriminate vertical from tilted (Δ1°) stimuli, and results showed that discrimination was based on the perceived number of flashes rather than the actual number. That is, when there were fewer beeps than flashes, performance was attenuated and vice versa. Presuming that performance in the task was dependent on parvocellular responses required to process small orientation differences, their results provide support for potential threshold changes as a result of sensory integration.
In experiment 2, we determine if the threshold angle needed to perceive a difference in the orientation of two sequentially presented Gabor patches was altered by the addition of a sound. As in experiment 1, we expected the amount of auditory influence on the visual judgment to depend on the timing of the auditory stimulus relative to the parvocellular component of the response to the target. Effects on discrimination should be most pronounced when the onset of the auditory stimulus occurs at, or slightly after, the visual target onset and least when auditory onset precedes target onset.
Multisensory audiovisual responses have been found to be increased inversely proportional to the size of the most effective unimodal response, a phenomenon termed inverse effectiveness (Stein et al., Reference Stein, London, Wilkinson and Price1996; see Stein & Stanford, Reference Stein and Stanford2008). Thus, we employed two contrast levels and expected threshold changes that resulted from sensory integration to be larger when the contrast was relatively low (see Stein & Stanford, Reference Stein and Stanford2008).
Materials and methods
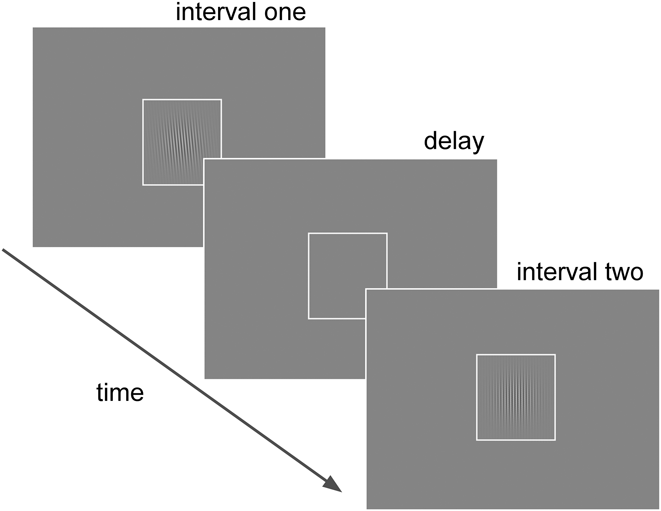
Nine participants (six male, mean age = 28 years, range 22–44 years) completed the second experiment. Experiment 2 included six of those who participated in experiment 1. A QUEST adaptive procedure similar to that used in experiment 1 was used in experiment 2, with the modification that the dependent variable was the orientation of the Gabor stimuli. A 2IFC task was again utilized. One interval contained a vertically oriented Gabor patch and the other contained a Gabor patch that was tilted randomly to either the left or the right. Participants were required to identify the interval containing the vertical Gabor using the numerical pad of a keyboard (1 = first interval, 2 = second interval). The angles that could be selected by the QUEST ranged between ±5° relative to vertical. QUEST was set to 80 trials. The delay between interval one and interval two was 500 ms, and stimuli were displayed for 30 ms each. The visual sequence is depicted in Fig. 4.
Experiment 2: Orientation discrimination sequence. The 2IFC orientation discrimination procedure used in experiment 2. On each trial, participants were required to choose which of two stimulus intervals contained a vertically oriented Gabor patch, presented within an outlined square in the centre of the computer monitor. Targets were displayed for 30 ms with a delay of 500 ms between target intervals. Illustrated is a sample trial in which the vertically oriented patch occurred in the second interval.

Auditory–visual interstimulus intervals (ISIs) ranged from −60 ms (negative delay corresponds to sound before Gabor onset) to 90 ms (sound after Gabor onset) in 30-ms steps. The sound–target delay was always the same in both presentation intervals. All participants also completed a no-sound control condition that was the same in all other respects as the conditions which included sounds. All conditions were randomly interleaved. As in experiment 1, participants were allowed to determine their experimental schedule and take breaks as desired. All participants except one completed the experiment in two, approximately 40 min, sessions and one participant completed the experiment in one, approximately 90 min, session.
Stimuli
Targets were 1° Gabor patches composed of 10 c/deg sinusoidal gratings in a Gaussian envelope with a s.d. of 0.2° presented centred in an outlined square which subtended 2.7°. Two contrast levels were used: 26 and 36% modulation above and below the background luminance. The mean luminances of these Gabor stimuli were equal to the background luminance (9.7 cd/m2).
White-noise auditory stimuli in the discrimination task had the same intensity as in the detection task (75 db) but had a duration matched to the visual target duration of 30 ms.
Data analysis
Threshold angles obtained through QUEST were processed through the same psychometric fitting procedure used in experiment 1—Weibull functions were fitted to the data obtained from QUEST based on maximum likelihood estimates of α and β (see experiment 1 for details).
Results
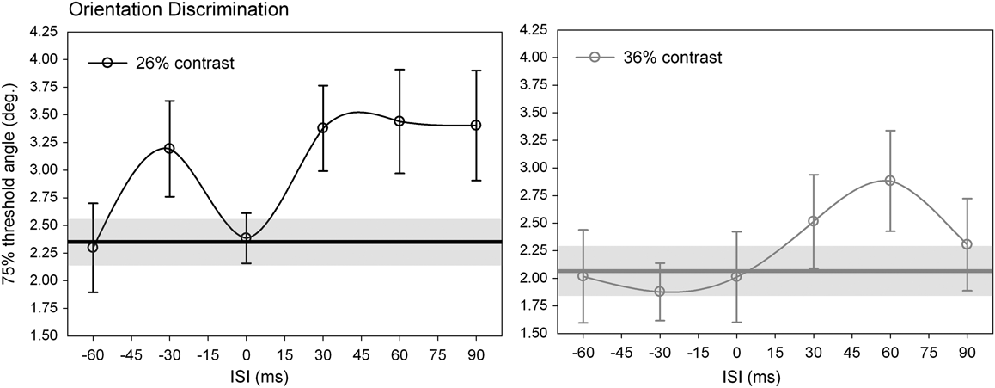
The threshold angle for resolving the orientation of a grating with our stimulus was 2.1° (±0.48°) for a 36% contrast grating and 2.3° (±0.41°) at 26% contrast. Fig. 5 illustrates, for each contrast level (left and right panels), the mean 75% threshold angles for discriminating a vertically oriented Gabor patch from a tilted one, plotted as a function of the time of occurrence of a sound relative to the time of presentation of the patch. The values obtained across the various sound–target ISIs were connected using spline interpolation and may be compared to the no-sound condition thresholds obtained for each contrast level, which are represented by the horizontal line in each graph in Fig. 5. A two-way within-participant factor ANOVA indicated a main effect of target–sound onset asynchrony, F (6,48) = 3.68, p = 0.004, and a main effect of contrast, F (2,9) = 3.67, p = 0.003. At both contrast levels, adding sound resulted in significantly higher thresholds than were obtained in the no-sound control conditions with peak effects occurring when the target–sound ISI was approximately 30–60 ms. Thresholds in both contrast conditions were consistently higher at positive ISIs, reaching peaks (elevated by ~0.9° for the 26% and ~0.8° for the 36%) compared to negative ISIs or when sound and target onset were simultaneous (with the exception of the −30-ms threshold obtained in the 26% contrast condition). Paired-samples t-tests indicated that the thresholds pooled across contrast conditions were significantly higher at the 30 and 60 ms ISIs compared with the pooled no-sound mean (30 ms: t = 2.31, df = 8, p = 0.049; 60 ms: t = 3.17, df = 8, p = 0.013). At the 0 and 90 ms ISIs, the increase in threshold was not significant (p > 0.05). When contrast conditions were analyzed separately, a marginal effect of sound on orientation judgments at the 26% contrast level was revealed in a paired-samples t-test comparing the no-sound condition with the sound conditions collapsed across onset asynchronies (t = 2.248, df = 5, p = 0.07). At the 36% contrast level, the data consistently showed the same pattern of variation, although no effect of sound was observed (p > 0.05).
Orientation discrimination thresholds. Mean threshold orientation discrimination with standard errors across participants over the range of ISIs at each contrast level (26% modulation of background luminance: left panel; 36%: right panel). Flat lines represent mean no-sound (control) thresholds at each contrast level with shaded areas representing standard errors.

Discussion (experiment 2)
Orientation thresholds of about 2.1 and 2.3° were obtained in the absence of a sound for the 26 and 36% contrast stimuli, respectively. In contrast to experiment 1, in which thresholds were reduced by the presence of a sound that carried no information, orientation discrimination thresholds were raised by a sound that was equally uninformative. The sound was most effective at raising thresholds when it followed the visual target by 30–60 ms. Additionally, threshold changes were greatest for the 26% contrast condition, in agreement with the phenomenon of inverse effectiveness.
Although experiment 1 showed there were some effects of sound on detection thresholds at these asynchronies, the main enhancing effect in experiment 1 was found when the sound and visual target were simultaneous. In experiment 2, minimal effects were found when the target and sound were simultaneous.
If the masking process occurs according to the dual-channel model (Breitmeyer & Ganz, Reference Breitmeyer and Ganz1976; Breitmeyer, Reference Breitmeyer1984; Breitmeyer & Ogmen, Reference Breitmeyer and Ogmen2006) and the effect of sound was to increase the potency of the visual target, then the data of experiment 2 may also be explained in terms of changes in parvocellular activity as a result of multisensory stimulation. To discriminate one orientation from another in the 2IFC task used here required a comparison between the P-pathway activities evoked by each successive stimulus. A potential monitor of the activity associated with such a comparison may be found in orientation tuned channels, which receive parvocellular afferents (see Livingstone & Hubel, Reference Livingstone and Hubel1988). An across-the-board increase in firing rate associated with multisensory stimulation would decrease the ratio between the two responses. Perceptually, a smaller ratio in the activity associated with the two stimuli would make the orientations more difficult to discriminate. Such an interpretation is in agreement with a Weber–Fechner rule and is consistent with physiological evidence for this rule provided by Dehaene (Reference Dehaene2003). The present data are in accordance with established studies showing attenuated discrimination performance associated with increased afferent activity. Examples can be found in loudness (Miller, Reference Miller1947) and brightness discriminations (Cornsweet & Pinsker, Reference Cornsweet and Pinsker1965; Griebel & Schmid, Reference Griebel and Schmid1997) (see Gescheider, Reference Gescheider1997, for a review). Although sensory integration may slightly compromise discrimination between audiovisual objects, the advantages conferred to other tasks, such as object identification (Schneider et al., Reference Schneider, Engel and Debener2008, Suied et al., Reference Suied, Bonneel and Viaud-Delmon2009), may outweigh such impairment.
General discussion
These experiments have demonstrated that sound can have an effect on visual pattern processing that is known to be associated with parvocellular visual pathways. Parvocellular connections to the ventral visual system predominantly determine the visibility of metacontrast-masked targets and the discrimination of high spatial frequency, foveal stimuli. The presence of an irrelevant sound enhances the detectability of a metacontrast-masked patch (experiment 1) and can hinder the ability to discriminate a grating’s orientation. How might sound exert these effects? Are these effects a metaphenomena of multisensory processing and the diverse advantages it provides? Or might these influences of sound offer some direct advantage to the organism?
Neurophysiological basis
Physiological support for auditory–visual interaction in the visual ventral stream has been determined by measuring activity in the IT, which responds selectively to specific objects and faces (Goodale & Milner, Reference Goodale and Milner1992). These studies include direct measurement of the response to a tone preceding a visual discrimination task (Iwai et al., Reference Iwai, Aihara and Hikosaka1987; Ringo & O’Neill, Reference Ringo and O’Neill1993), in naming studies (Bookheimer et al., Reference Bookheimer, Zeffiro, Blaxton, Gaillard, Malow and Theodore1998; Tranel et al., Reference Tranel, Damasio, Eichhorn, Grabowski, Ponto and Hichwa2003) and in memory studies (Colombo & Gross, Reference Colombo and Gross1994; Gibson & Maunsell, Reference Gibson and Maunsell1997). Inferotemporal activity was found linked to both visual and auditory representations of objects. For example, Bookheimer et al. (Reference Bookheimer, Zeffiro, Blaxton, Gaillard, Malow and Theodore1998), using positron emission tomography, found that auditory language input produced reciprocal activation in both primary and secondary visual cortices in a manner similar to that evoked by visual language input. Such physiological studies may point to a neural basis for the advantages and disadvantages that we have identified psychophysically, provided by auditory–visual integration for the nonlinguistic stimuli used in the present study. That is, the sensory integration implied by the present data may, at a later processing stage, aid in tasks such as object identification.
The psychophysical effects reported here, associated with the relatively late and sustained parvocellular response, may be the result of downward feedback connections from higher multisensory areas, which have received several unimodal inputs that have undergone subsequent integration (see Driver & Spence, Reference Driver and Spence2000; Calvert et al., Reference Calvert and Thesen2004). One such candidate includes the ventrolateral prefrontal cortex, which has been shown to combine visual and auditory information (Romanski, Reference Romanski2007) and receives input from IT (O’Scalaidhe et al., Reference O’Scalaidhe, Rodman, Albright and Gross1997). Alternatively, the effects may be due to feedforward connections carrying information following the convergence between auditory and visual pathways at an early stage, including primary sensory cortices (Rockland & Van Hoesen, Reference Rockland and Van Hoesen1994; Falchier et al., Reference Falchier, Clavagnier, Barone and Kennedy2002; Clavagnier et al., Reference Clavagnier, Falchier and Kennedy2004; Smiley & Falchier, Reference Smiley and Falchier2009). However, such feedforward modulations must occur in areas where sensory interaction is initiated with an already-present visual input, thus limiting the window of integration to small delays between an initial visual stimulus and auditory stimulus. It is also possible that the effects may represent a combination of both feedforward and feedback contributions. Thus, the effects observed here may rest on sensory convergence at different levels or within a number of levels. Regardless, it is clear that there are many neurophysiological systems that can provide the required basis.
The function of auditory–visual interactions
Information reflecting the momentary state of an observer’s immediate environment is contained within light and sound energy that changes across space and time with each environmental event. Different energies are transduced by different sensory systems and often carry redundant information about, for example, the timing and location of an event. Some multisensory systems have evolved specifically to exploit this redundancy (see Calvert & Thesen, Reference Calvert and Thesen2004, for a review). There are some advantages and some disadvantages in converging sensory signals into multisensory signals. A potential disadvantage is that the original source identity is lost and thus it is impossible to determine which modality caused the response of any given multisensory neuron. A potential advantage is that information from different senses can enhance each other such that the resulting signal is larger than either of the input signals alone.
There are numerous examples that show that auditory–visual interaction can provide clear and immediate benefits to the organism. Anything that hastens the detection of events is bound to make an organism fitter for survival. However, the effects of sound on visual perception that we have demonstrated here are paradoxical. The sound carries no additional information and yet the visual system’s performance is altered. Noninformative sounds have also been found to affect performance in object naming and identification studies, for which the parvocellular system may be presumed to play a key role (Tranel et al., Reference Tranel, Damasio, Eichhorn, Grabowski, Ponto and Hichwa2003, Reference Tranel, Grabowski, Lyon and Damasio2005; Suied et al., Reference Suied, Bonneel and Viaud-Delmon2009).
Conclusions
We conclude that detection enhancement of metacontrast-masked targets and orientation discrimination degradation are probably necessary consequences of multisensory convergence within the early parvocellular pathways. Such convergence likely provides important aid to the organism under the assumption that auditory and visual signals are often correlated and that each channel can therefore provide information helpful to the other in the face of weak or ambiguous stimuli that require detection, recognition, or identification. An example of this is in comprehending speech in the presence of several speakers. However, in the relatively rare situation when the signals are temporally close together but are not in fact both informative, multisensory convergence may still be active. Even though these effects may not always be biologically useful in this situation, they can reveal details of how multisensory convergence operates.