INTRODUCTION
The Mediterranean Sea has a complex history marked by several events, like glaciation episodes (Krijgsman et al., Reference Krijgsman, Hilgen, Raffi, Sierro and Wilson1999; Patarnello et al., Reference Patarnello, Volckaert and Castilho2007). During this period, the cyclical variations in sea level and surface temperature were involved and significantly influenced the physical connection between water masses and population connectivity patterns (Patarnello et al., Reference Patarnello, Volckaert and Castilho2007). A sufficient degree of isolation may result in notable genetic and phenotypic divergence among marine populations within a species (Turan, Reference Turan2004; Lin et al., Reference Lin, Quinn, Hilborn and Hauser2008).
Sparidae is one of the most diversified teleost families. It includes, considering all their geographical range, nearly 110 species of which 24 (belonging to 11 genera) are found in the Atlanto-Mediterranean region (Bauchot & Hureau, Reference Bauchot, Hureau, Whitehead, Bauchot, Hureau, Nielsen and Tortonese1986). In the Mediterranean Sea, Sparidae are of great interest for fisheries and aquaculture. Nowadays, diversification is one of the greatest challenges for further aquaculture development (Hernández-Cruz et al., Reference Hernández-Cruz, Salhi, Bessonart, Izquierdo, González and Fernández-Palacios1999). Some Sparidae species, like gilthead seabream, Sparus aurata, and sharpsnout seabream, Diplodus puntazzo, are already produced commercially (Saka et al., Reference Saka, Çoban and Firat2004; Kamaci et al., Reference Kamaci, Firat, Saka and Bulut2005; Dimitriou et al., Reference Dimitriou, Katselis, Moutopoulos, Akovitiotis and Koutsikopoulos2007). Other species such as striped seabream, Lithognathus mormyrus, are good candidates for diversification programmes (Kentouri & Divanach, Reference Kentouri and Divanach1983; Saka et al., Reference Saka, Çoban and Firat2004).
Lithognathus mormyrus (Linnaeus, 1758) is a common species along the Mediterranean coasts (Bauchot & Hureau, Reference Bauchot, Hureau, Whitehead, Bauchot, Hureau, Nielsen and Tortonese1986). It has a large geographical range covering the Atlantic Ocean from the Bay of Biscay to the Cape of Good Hope, the Western Indian Ocean and the Red and Black Seas (Bauchot & Hureau, Reference Bauchot, Hureau, Whitehead, Bauchot, Hureau, Nielsen and Tortonese1986; Smith & Smith, Reference Smith, Smith, Smith and Heemstra1986). The striped seabream is essentially a marine fish, but it is frequently encountered in lagoons and estuaries which are considered as nursery areas for juvenile fish (Monteiro et al., Reference Monteiro, Bentes, Coelho, Correia, Erzini, Lino, Ribeiro and Gonçalves2010). This wide and diversified geographical distribution indicates a good adaptability to different environmental conditions, hence its importance in farming. Studies of wild fish populations are of interest in terms of assessment and management of fish stocks (Kevin, Reference Kevin1997; Turan, Reference Turan2004).
Many studies were carried out on biology, embryonic development, genetic and morphological characterization of L. mormyrus on northern Mediterranean shores (Palma & Andrade, Reference Palma and Andrade2002; Arculeo et al., Reference Arculeo, Lo Brutto, Sirna-Terranova, Maggio, Cannizzaro and Parrinello2003; Bargelloni et al., Reference Bargelloni, Alarcon, Alvarez, Penzo, Magoulas, Reis and Patarnello2003; Türkmen & Akyurt, Reference Türkmen and Akyurt2003; Kallianiotis et al., Reference Kallianiotis, Torre and Argyri2005). The morphological characters, such as body shape and meristic counts, were frequently adopted to distinguish populations and showed good results (Langerhans et al., Reference Langerhans, Craig, Langerhans and Dewitt2003; Silva, Reference Silva2003; Ergüden & Turan, Reference Ergüden and Turan2005). The traditional morphometric methods have been enhanced by image processing techniques generating a better data collection with more effective descriptions of shape and using new analytical tools. These properly calibrated coordinates of morphometric locations or landmarks are generally more efficient and precise than manual distance measurements (Cadrin & Friedland, Reference Cadrin and Friedland1999). Truss networks distances between landmark coordinates were found to provide more comprehensive coverage of form with greater discriminating power (Cadrin & Friedland, Reference Cadrin and Friedland1999). This approach was previously used for L. mormyrus and revealed a significant morphological variability between northern Mediterranean populations (Palma & Andrade, Reference Palma and Andrade2002).
The case of the Tunisian coast is of great interest because it represents a boundary area between eastern and western Mediterranean basins where two water bodies with different hydrological, physical and chemical conditions are encountered (Ovchinnikov, Reference Ovchinnikov1966; Béranger et al., Reference Béranger, Mortier, Gasparini, Gervasio, Astraldi and Crépon2004). Within this particular area, morphological studies of fish species like Dicentrarchus labrax and Atherina boyeri revealed significant differences with clinal variations (Trabelsi et al., Reference Trabelsi, Quignard, Tomasini, Boussaid, Folcant and Maamouri2000, Reference Trabelsi, Quignard, Tomasini, Boussaid, Folcant and Maamouri2002; Bahri-Sfar & Ben Hassine, Reference Bahri-Sfar and Ben Hassine2009).
The aim of this study was to investigate the morphological variability and shape differences of marine and lagoon Tunisian coast populations of L. mormyrus using the truss network system (Strauss & Bookstein, Reference Strauss and Bookstein1982), traditional measurements and meristic character analyses.
MATERIALS AND METHODS
Sampling
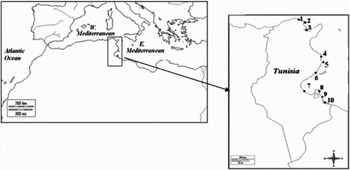
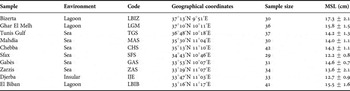
A total of 343 specimens were collected from 10 different locations along the Tunisian coastline. Three samples were collected from the north-eastern sector (Bizerta lagoon, Ghar El Melh lagoon and Tunis Gulf) and seven from the eastern and south-eastern sectors (Mahdia, Chebba, Sfax, Gabès, Zarzis, Djerba Island and El Biban lagoon) (Table 1; Figure 1). Sample sizes ranged between 29 and 42 individuals and all fish were captured using trammel nets. Despite the fact that a sample of 25 individuals is considered to be appropriate for the truss approach (Reist, Reference Reist1985), we opted to analyse all specimens sampled in order to have more concise results.
Sampling localities of Lithognathus mormyrus: (1) Bizerta lagoon; (2) Ghar El Melh lagoon; (3) Tunis Gulf; (4) Mahdia; (5) Chebba; (6) Sfax; (7) Gabès; (8) Djerba Island; (9) Zarzis; (10) El Biban lagoon.

Sample locations of Lithognathus mormyrus, environment, code, geographical coordinates, number of individuals and mean standard length (MSL; average ± SD).

Truss protocol
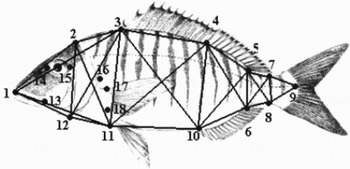
The truss protocol was used to describe the shape of the fish by defining a network of distances between anatomical landmarks (Strauss & Bookstein, Reference Strauss and Bookstein1982; Bookstein et al., Reference Bookstein, Chernoff, Elder, Humphries, Smith and Strauss1985). The landmark approach is based on placing several homologue points called ‘landmarks’ on the most important locations of the body shape image. The left side of each fish was photographed, with a high quality digital camera mounted on a tripod, with the fins in the extended position. All landmark coordinates were made on digital images using image software (Visilog, version 6.480). The x and y coordinates of landmarks were chosen and recorded in agreement with the current literature (Sarà et al., Reference Sarà, Favarolo and Mazzola1999; Loy et al., Reference Loy, Busilacchi, Costa, Ferlin and Cataudella2000; Palma & Andrade, Reference Palma and Andrade2002; Turan, Reference Turan2004). Twenty-seven truss measurements were taken between 12 landmarks (Figure 2). Fourteen additional measurements (such as eye diameter (14–15), head length (1–16), pre-orbit (1–14), snout length (1–13) and others were obtained using six traditional morphometric points (from 13 to 18) and were added to morphometric data (Figure 2). Calibration was achieved for each specimen by measuring a known distance on a millimetre scale in each photograph. All morphometric measurements were performed and analysed using the R 2.11.1 software. Precision was tested by digitizing one specimen from each sample twenty times and calculating the error variance for each variable.
Location of landmarks (1 to 12) and traditional morphometric points (13 to 17) used in this study. Lines indicate the morphometric measures used for constructing a truss network on Lithognathus mormyrus. Landmarks were illustrated as black dots: anterior tip of snout (1); end of the head (2); front insertion point of dorsal fin (3); insertion of first soft dorsal fin ray (4); end of dorsal fin (5); rear extremity of the anal fin (6); rear extremity of the lateral line (9); forward insertion of the anal fin (10); points of maximum curvature of the peduncle (7–8); forward insertion point of the pelvic fin (11); posterior insertion of the sub-operculum (12); rear extremity of the upper jaw (13); eye diameter (14–15); posterior extremity of the operculum (16); forward insertion point of the pectoral fin (17); rear extremity point of the pectoral fin (18).

Meristic counts
Eight meristic characters were selected for analyses: numbers of hard and soft rays in the dorsal fin (HD and SD), soft anal fin rays (AR), left pectoral fin rays (LP), right pectoral fin rays (RP), number of lateral line scales (SL), number of gillrakers on the first left and right branchial arch (GR) and vertebrate number (VN). These meristic characters were counted under a binocular microscope. The number of vertebrae was counted after boiling the fish and removing the muscles.
Statistical analyses
The morphometric and meristic characters were used separately in multivariate analyses. Truss and traditional data were logarithm transformed in order to increase linearity and multivariate normality (Pimentel, Reference Pimentel1979). For morphometric analyses, it was important to eliminate any size effect especially when comparing fish of different sizes since the present study focused on shape variation and not that of size (Turan, Reference Turan1999). Besides, an allometric approach (Reist, Reference Reist1985) was adopted to remove size-dependent variation:

where M trans is the transformed measurement, M the original measurement, β the within-group slope regressions of log M against log SL, SL the standard length of the fish and SL mean the overall mean of the standard length. The test of size effect for meristic counts was done using correlations between these characters and standard length of samples (Costa et al., Reference Costa, De Almeida and Costa2003; Turan, Reference Turan2004).
Univariate analysis of variance (ANOVA) was performed to test whether the averages of morphometric and meristic variables differed among the studied populations. In addition, the t-test was established to infer whether the averages of one variable are significantly different between two considered samples.
To illustrate the differences or similarities between the studied samples and the contribution of each character to group separation, discriminant function analysis (DFA) was assessed. DFA finds linear combinations of variables (discriminant functions) in order to provide the best separation of classes. Wilks’ values were estimated to test the significance of such discrimination for a combination of variables. Discriminant functions were used to classify individuals into samples. The classification success rate (PCS) was evaluated based on the percentage of individuals correctly assigned into the original sample. These statistical tests were performed using R 2.11.1 software.
RESULTS
Truss analysis
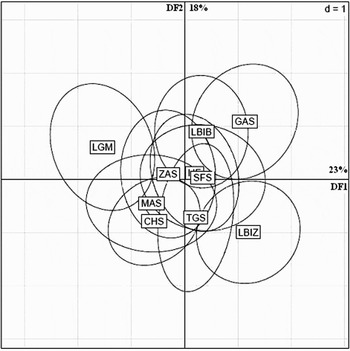
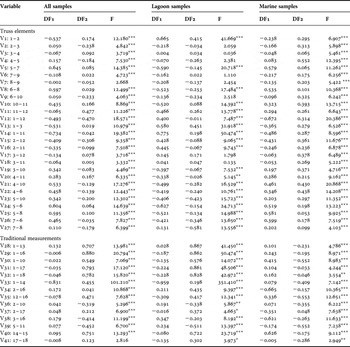
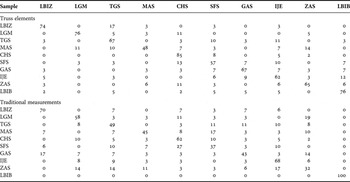
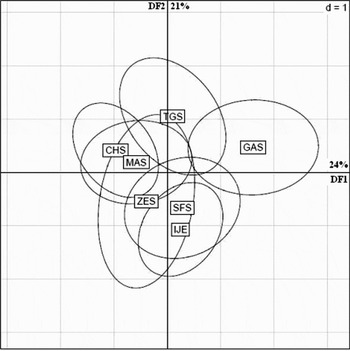
The ANOVA of 27 truss elements revealed significant differences (P < 0.001) among localities for all variables (Table 2). Among the nine discriminant functions performed by DFA, the two first axes, explaining 41% of inter-group variability were chosen to run the analysis. Three variables substantially contributed to define the first discriminant function (V14:1–11; V5:5–7 and V24:5–6). The second function was mainly defined by the following truss elements: V11:11–12 and V12:1–12 (Table 2). These variables characterize the anterior and posterior parts of the body. The plot obtained with DF1 and DF2 showed that samples are partially overlapped. However, a distinction of some samples was highlighted, mainly among lagoon ones (Figure 3). The significance of this variation was proved by Wilks' criterion (Wilks' λ = 0.035, F = 5.234, P < 0.001). The overall assignment of individuals into their original sample by DFA was estimated to be 68% (Table 3).
Discriminant function analysis scores of truss elements on the two first discriminant functions for all samples. LBIZ, Bizerta lagoon; LGM, Ghar El Melh lagoon; TGS, Tunis Gulf; MAS, Mahdia; CHS, Chebba; SFS, Sfax; GAS, Gabès; IJE, Djerba Island; ZAS, Zarzis; LBIB, El Biban lagoon.

Loadings from discriminant function of the truss and traditional measurements for Lithognathus mormyrus. Univariate statistics (ANOVA). Significance levels; *, P < 0.05; **, P <0.01; ***, P < 0.001.

Correct classification of individuals into their original group for truss elements and traditional measurements. LBIZ, Bizerta lagoon; LGM, Ghar El Melh lagoon; TGS, Tunis Gulf; MAS, Mahdia; CHS, Chebba; SFS, Sfax; GAS, Gabès; IJE, Djerba Island; ZAS, Zarzis; LBIB, El Biban lagoon.

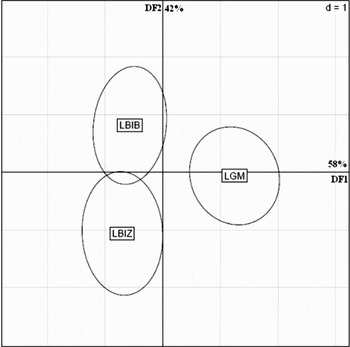
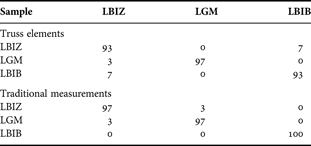
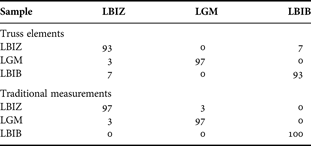
The projection of lagoon samples on DF1–DF2 plane explained 58% of global variation for the first function and 42%, for the second one. The plot showed discrimination between these three lagoon environments (Figure 4). Significant differences between lagoon samples on truss variables were highlighted by Wilks' criterion (Wilks' λ = 0.095, F = 6.564, P < 0.001). The overall assignment of individuals into their original sample (PCS) by DFA was 94%, confirming such discrimination (Table 4). The distinction of the Ghar El Melh sample from the two other lagoons was mostly defined by DF1. This distinction seemed to be related to the head region, especially to V14: 1–11. In fact, Ghar El Melh has the highest average compared to El Biban and Bizerta lagoons (t LGM-LBIB = 3.45, P < 0.001, ddl = 76; t LGM-LBIZ = 3.01, P < 0.01, ddl =65). The distinction of Bizerta from El Biban lagoon samples was explained by DF2 which was mainly defined by the posterior part of the body, especially by V27: 7–8. The application of the t-test showed that Bizerta specimens have the highest average of V27 (t LBIZ-LBIB = 5.45, P < 0.001, ddl = 70).
Discriminant function analysis scores of truss elements on the two first discriminant functions for the three lagoon samples. LBIZ, Bizerta lagoon; LGM, Ghar El Melh lagoon; LBIB, El Biban lagoon.

Correct classification of individuals into their original group for lagoon samples. LBIZ, Bizerta lagoon; LGM, Ghar El Melh lagoon; LBIB, El Biban lagoon.
Regarding the marine samples, their projection on the plan formed by DF1 and DF2, only explained 45% of the global variation and showed the distinction of the Gabès sample (Figure 5). Wilks' criterion revealed significant inter-sample variation (Wilks' λ = 0.041, F = 5.304, P < 0.001). This variation was substantially explained by the posterior part of the body (V5: 5–7; V8: 6–8 and V25: 5–8).
Discriminant function analysis scores of truss elements on the two first discriminant functions for marine samples. TGS, Tunis Gulf; MAS, Mahdia; CHS, Chebba; SFS, Sfax; GAS, Gabès; IJE, Djerba Island; ZAS, Zarzis.

Traditional morphometry
The ANOVA of 14 traditional measurements revealed highly significant average differences (P < 0.001) among locations for 13 variables (Table 2).
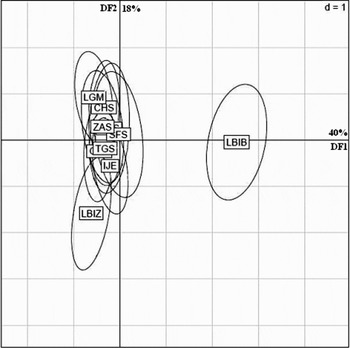
The two first discriminant functions explained 58% of the inter-group variability. Distance between snout and orbit (V33: 1–14) contributed the most to define the first function (Table 2). The second function was mainly defined by the following measurements: the pre-pectoral distance (V31:1–17 and V32:1–18), the operculum length (V29:1–16) and the eyes diameter (V40:14–15). Plotting DF1 and DF2 highlighted the discrimination of the El Biban lagoon sample (LBIB) from the others. The scatter-plot corresponding to this sample was projected on the positive side of DF1 (Figure 6). The remaining samples scatter-plots partially overlapped and spread along DF2. Wilks' criterion revealed significant variation (Wilks' λ = 0.017, F = 13.666, P < 0.001). The overall assignment of individuals into their original sample by DFA was estimated to be 56% for traditional morphometric variables (Table 3) and the highest proportion of properly classified individuals into their original group was observed for El Biban sample (100%). This discrimination seemed to be especially related to the distance between snout and orbit (V33:1–14).
Discriminant function analysis scores of traditional measurements on the two first discriminant functions for all samples. LBIZ, Bizerta lagoon; LGM, Ghar El Melh lagoon; TGS, Tunis Gulf; MAS, Mahdia; CHS, Chebba; SFS, Sfax; GAS, Gabès; IJE Djerba Island; ZAS, Zarzis; LBIB, El Biban lagoon.

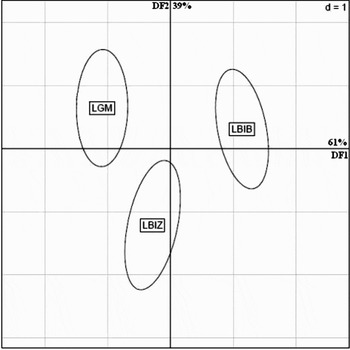
Similarly to the case of truss measurements, plotting lagoon samples on the plan formed by DF1 and DF2, which explained respectively 61% and 39% of the global variation, showed a high discrimination between these three lagoon environments (Figure 7). In addition, a significant difference was proved by Wilks' criterion (Wilks' λ = 0.033, F = 29.667, P < 0.001). The overall assignment of individuals into their original sample (PCS) by DFA was about 98% (Table 4) and the highest percentage of re-classification was obtained for the El Biban lagoon sample (100%). Ghar El Melh and El Biban lagoons were discriminated by DF1 and such distinction was again related to pre-orbit length (V33: 1–14). Indeed, the Ghar El Melh lagoon sample has the highest average of pre-orbit length compared to the El Biban lagoon sample (t = 11.99, P < 0.001, ddl = 76). The distinction of the Bizerta lagoon sample, by DF2, was also related to the anterior part of the body, since all characters discriminating this sample were head related (V29:1–16, V28: 1–13, V31: 1–17, V32: 1–18, and V40: 14–15). Among these variables, the snout length (V28: 1–13) seemed to be the character that mostly explained this variability. In fact, Bizerta specimens seemed to have the lowest average of snout length compared to the Ghar El Melh sample (t = 2.09, P < 0.05, ddl = 65).
Discriminant function analysis scores of traditional measurements on the two first discriminant functions for the three lagoon samples. LBIZ, Bizerta lagoon; LGM, Ghar El Melh lagoon; LBIB, El Biban lagoon.

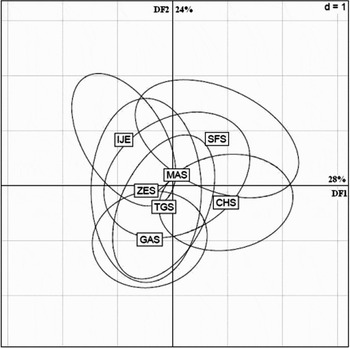
The projection of the marine samples on the plan formed by DF1 and DF2 explained 52% of the global variation (Figure 8) and showed the distinction of the Chebba and Gabès samples. Wilks' criterion revealed significant inter-sample variation (Wilks' λ = 0.161, F = 5.568, P < 0.001). Morphometric variation of the Chebba sample (CHS), by DF1, seemed to be related to the anterior part of the body, especially to eye diameter (V40: 14–15). However, the variation of the Gabès sample (GAS), which was projected on the negative side of DF2, cannot be explained by a specific part of the body.
Discriminant function analysis scores of traditional measurements on the two first discriminant functions for marine samples. TGS, Tunis Gulf; MAS, Mahdia; CHS, Chebba; SFS, Sfax; GAS, Gabès; IJE, Djerba Island; ZAS, Zarzis.

Meristics
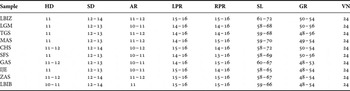
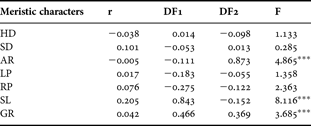
The meristic counts of L. mormyrus samples are given in Table 5. The observed counts did not show any correlation with the standard length of samples (Table 6). Univariate comparison of variances between samples was highly significant (P < 0.001) for three meristic characters (AR, GR and SL) (Table 6). The vertebrate number (VN) was not considered in the analysis because it was constant for all samples.
Range of meristic counts of Lithognathus mormyrus samples. LBIZ, Bizerta lagoon; LGM, Ghar El Melh lagoon; TGS, Tunis Gulf; MAS, Mahdia; CHS, Chebba; SFS, Sfax; GAS, Gabès; IJE, Djerba Island; ZAS, Zarzis; LBIB, El Biban lagoon.

Correlation coefficient with standard length, loadings from discriminant function and univariate statistics (ANOVA) of the meristic characters for Lithognathus mormyrus. Significance levels; *, P<0.05; **, P < 0.01; ***, P < 0.001. HD and SD, number of hard and soft rays in the dorsal fin; AR, soft anal fin rays; LP, left pectoral fin rays; RP, right pectoral fin rays; SL, number of lateral line scales; GR, number of gillrakers.
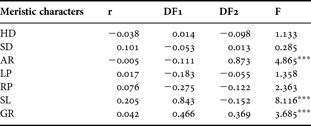
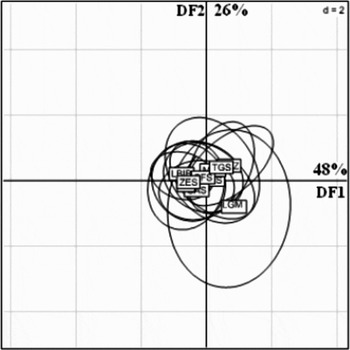
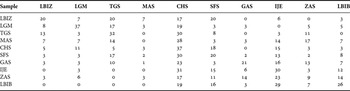
The first discriminant function explained 48% of total variation and was defined by two characters: the number of gillrakers (GR) and number of lateral line scales (SL). The second DF absorbed 26% of global variation and was defined by the number of soft anal rays (AR) (Table 6). The spatial projection of the whole sample on the factorial plane defined by the first two functions (DF1 and DF2) showed a large overlapping between samples (Figure 9). The overall assignment of individuals into their original sample by DFA is 23.2% (Table 7). It showed a low proportion of correctly classified individuals to their original group (0–37%). Plotting barycentres showed overlapping scatter-plots with a slight extension for the Ghar El Melh lagoon sample.
Discriminant function analysis scores of meristic analysis on the two first discriminant functions for all samples. LBIZ, Bizerta lagoon; LGM, Ghar El Melh lagoon; TGS, Tunis Gulf; MAS, Mahdia; CHS, Chebba; SFS, Sfax; GAS, Gabès; IJE, Djerba Island; ZAS, Zarzis; LBIB, El Biban lagoon.

Correct classification of individuals into their original group for meristic characters. LBIZ, Bizerta lagoon; LGM, Ghar El Melh lagoon; TGS, Tunis Gulf; MAS, Mahdia; CHS, Chebba; SFS, Sfax; GAS, Gabès; IJE, Djerba Island; ZAS, Zarzis; LBIB, El Biban lagoon.

DISCUSSION
Morphometric variability among Tunisian populations of L. mormyrus was highlighted using truss and traditional approaches. Using these two approaches, the analyses revealed the existence of significant morphological differences between studied samples and in particular between lagoons. Using traditional data, variation between lagoon environments seemed to be only associated to the anterior region especially to the pre-orbit distance. Indeed, the Ghar El Melh and El Biban lagoons were discriminated through the pre-orbit length, which was higher in Ghar El Melh. In contrast, the Bizerta lagoon specimens were characterized by small head and snout length. Truss analyses showed discrimination between the previous samples which was related not only to the anterior part of the body but also to the posterior one. These data revealed that the El Biban lagoon specimens had not only the lowest average value for distance between snout and pelvic fin but had also the lowest average value for the height of the peduncle.
Morphometric variations obtained for marine samples, with traditional data, do not seem to be related to a specific part of the body, however, using truss data, the distinction of the Gabès sample was mainly assigned to a particular region of the body: the posterior part. Although both approaches converged and gave complementary results, it seems that the truss approach provided more accurate results.
Among all characters, the head-related traits were the most contributive variables for sample discrimination, especially between lagoon samples. Variations in the head-related characteristics suggest the influence of habitat differences. The length of the snout usually depends on the availability, type and size of prey (Palma & Andrade, Reference Palma and Andrade2002; Turan, Reference Turan2004). Feeding is a well known factor that influences head morphology. Thus, if different populations of a same species show discordant patterns of head morphology, this is often due to the exploitation of different ecological niches with varying diets (Hyndes et al., Reference Hyndes, Platell and Potter1997; Delariva & Agostinho, Reference Delariva and Agostinho2001).
Similar results regarding the head morphology were obtained by Sarà et al. (Reference Sarà, Favarolo and Mazzola1999) on cultivated D. puntazzo reared under different conditions. Head characters have also caused differentiation between Turkish Trachurus mediterraneus samples (Turan, Reference Turan2004) and among European samples of D. sargus and D. puntazzo (Palma & Andrade, Reference Palma and Andrade2002). Moreover, using geometric morphometry, Costa & Cataudella (Reference Costa and Cataudella2007) found that juveniles of L. mormyrus in Caprolace Lagoon (Central Tyrrhenian Sea, Italy) possess a relatively larger head region, a larger mouth gap, a longer body and a longer and narrower caudal peduncle. The authors affirmed the existence of a relation between feeding, especially preys type, size and head shape. Variations in the posterior region are mostly related to the swimming behaviour of fish which may vary according to species and hydrodynamic constraints (e.g. water currents) (Costa & Cataudella, Reference Costa and Cataudella2007).
In each environment, individuals seemed to have adaptation characters particular to that kind of environment. Indeed, lagoon organisms, either permanent or temporary residents, show adaptive strategies in response to multiple environmental conditions (Kara & Frehi, Reference Kara and Frehi1997). Lagoons are richer nutritional areas than a marine environment, and are often used as nursery areas, allowing fish larvae to develop and grow (Çoban et al., Reference Çoban, Saka and Firat2008). During these early life stages, morphology is especially dependent upon environmental conditions (Ryman et al., Reference Ryman, Lagercrantz, Andersson, Chakraborty and Rosenberg1984; Cheverud, Reference Cheverud1988).
Morphological differences among Tunisian samples may also reflect differences in physico-chemical characteristics such as salinity and substrata (Savouré, Reference Savouré1977; Moussa et al., Reference Moussa, Baccar and Ben Khemis2005). In fact, the diversity of morphological, hydrological and climate situations lead to extreme diversity ranges of salinity and geochemical gradients.
Meristic counts variation was revealed to be quite heterogeneous among samples. Only the number of soft anal rays explained the distinction of the Ghar El Melh lagoon sample. Environmental factors, particularly salinity and temperature, could explain the variability in numbers of fin rays (Kirchhoff et al., Reference Kirchhoff, Sévigny and Couillard1999). The phenotypic variation among the fish population can be explained by environmental or genetic components or their interactions (Cabral et al., Reference Cabral, Marques, Rego, Catarino, Figueiredo and Garcia2003; Favaloro & Mazzola, Reference Favaloro and Mazzola2006; Bahri-Sfar & Ben Hassine, Reference Bahri-Sfar and Ben Hassine2009). Many species showed morphometric and genetic differences within small geographical ranges which is the consequence of various factors, including environmental ones (Lin et al., Reference Lin, Quinn, Hilborn and Hauser2008; Bergek & Björklund, Reference Bergek and Björklund2009). The genetic structure of the Tunisian samples was studied using allozymic markers and revealed homogeneity between marine samples and heterogeneity only between the El Biban and Bizerta lagoons (Hammami et al., Reference Hammami, Bahri-Sfar, Kaouèche and Ben Hassine2007). These results highlighted the importance of the environmental component in the establishment of morphological variation in the Tunisian populations. The phenotypic variability is particularly high in fish, and it is not necessarily associated with high genetic variability (Ihssen et al., Reference Ihssen, Booke, Casselman, McGlade, Payne and Utter1981). In fact, some studies describing the existence of a high level of morphological variation in populations of genetically homogeneous fish confirm a major role of the environment as a basis for phenotypic variability (Ryman et al., Reference Ryman, Lagercrantz, Andersson, Chakraborty and Rosenberg1984; Kinsey et al., Reference Kinsey, Orsoy, Bert and Mahmoudi1994; Tudela, Reference Tudela1999).
This work revealed the existence of morphological differences between Tunisian samples mainly between lagoons for truss and traditional measurements. These two approaches are complementary and provide more accurate explanations of such a morphological discrimination. Phenotypic variability between lagoon samples suggests a strong implication of ecological conditions. Therefore, further studies on the impact of the lagoon's ecological factors and the diet in different environments are needed to better understand the contribution of the environment component to the morphological variability.
ACKNOWLEDGEMENTS
We wish to acknowledge the help of Professor Sovan Lek and Dr Gael Grenouillet, in introducing us to the truss approach, and that of Mr Moktar Diawara during the statistical processing with R software. The authors are also grateful to two anonymous referees who helped to improve the quality of the manuscript, through their suggestions and constructive comments.