
We may not build every road in these countries, but we're going to build the roads that are going to increase the incomes of the poorest. –Dr. Jim Yong Kim, President of the World BankFootnote 1
Foreign aid is a process by which poor people in rich countries help rich people in poor countries. –Peter BauerFootnote 2
The World Bank's (WB) mission is literally carved in stone at its Washington headquarters: “Our dream is a world free of poverty.” Foreign aid, in various forms, has been a part of this mission since the founding of the Bank. The link between aid and poverty alleviation was reiterated in the late 1990s when a major Bank report plainly stated that “the main aim of aid is to reduce poverty.”Footnote 3 Since 2000, this focus has been sharpened by the first Millennium Development Goal of halving the global rate of extreme poverty and the proportion of people who suffer from hunger. In April 2013, with an eye toward a new set of development goals, the WB committed itself to ending extreme poverty and promoting shared prosperity, defined in terms of income growth in the poorest 40 percent of people in each country.Footnote 4 Poverty reduction is equally a founding and enduring goal of the African Development Bank (ADB), whose mission is to “promote sustainable economic growth and reduce poverty in Africa.”Footnote 5
Multilateral donors like the WB and ADB are known to be able to direct a great deal of their resources to the world's poorest countries, resisting the political pressures that skew bilateral aid away from the poorest countries and toward, for example, former colonies.Footnote 6 While multilateral donors are able to target aid to poorer countries, we have much less of an understanding about the distribution of their aid within countries. This research note directly answers this question by examining how aid targets people at various levels of wealth within a diverse sample of African countries. An analysis of subnational aid targeting across many countries helps us understand the extent to which multilateral donors are able to exercise control over aid allocations inside recipient countries to realize their stated preferences for a pro-poor allocation of aid. The question of whether aid targets poverty within countries is practically quite important as well because project aid will alleviate poverty more effectively when it is allocated to places where poor people live.
The question of how aid targets subnational wealth is answered using a two-year sample of geolocated project aid commitments from two multilateral donors to seventeen African countries containing a total of 195 regions. By analyzing project aid commitments from multilateral donors, I test for the presence of donor control over aid in a most likely case. This is because aid commitments are recorded before implementation, because project aid is a form of aid that is especially easy for donors to target, and because multilateral donors are known to have uniquely apolitical and poverty-sensitive preferences for aid allocation. The analysis includes a demonstration of how to produce reliable, cross-nationally comparable estimates of the subnational distribution of each country's population by their level of wealth using household surveys. This approach allows us to move from using regional averages of wealth to understanding the unique effect of having more poor or rich people living in a region.Footnote 7 The analysis reveals that aid flows disproportionately to regions with more of the richest people rather than to regions with more of the poorest. It also expands the subnational study of aid targeting away from single-country case studies, and in doing so it demonstrates that there are durable cross-national patterns in subnational aid allocation in Africa. Even in this most-likely case, donors do not seem to exercise a great deal of control over aid targeting within countries.
Theory
Multilateral donors are uniquely good at directing their aid to poor countries, and the WB and ADB are among the most poverty sensitive of the multilateral donors.Footnote 8 Multilateral donors likely target a larger share of their aid to poor countries than bilateral donors because they have a mission to use aid to reduce poverty and because they have voting arrangements that prevent any one stakeholder country's government from forcing its preferences on all issues. This voting structure encourages aid to flow to areas where stakeholder preferences overlap, implying that it should be relatively easy to send multilateral aid to poor countries but harder to send aid to a country that is a close ally of only one stakeholder country.Footnote 9 Such impediments to political targeting do not exist for bilateral donors, and bilateral aid allocations are more heavily skewed by political factors.Footnote 10
Once aid reaches a low-income country, it is generally used to either increase economic growth or directly improve the lives of poor people through the provision of goods or services.Footnote 11 Aid for economic growth is typically aimed at either increasing investments, such as infrastructure, or changing economic policies that are thought to stifle growth. Because of almost intractable causal identification issues, there is no consensus on the effect of foreign aid on growth.Footnote 12 Bracketing this admittedly large issue, the most common current result from this literature is that under some circumstances aid seems to have a small, positive effect on growth.Footnote 13 While economic growth is clearly important, it does not always reduce poverty. Consider, for example, that fifteen years of impressive economic growth in Africa has had only a small effect on poverty rates and a little under half of all Africans still live below a $1.25-a-day poverty line.Footnote 14
However, if the goal of aid is to reduce poverty, then rather than trying to increase growth and then hoping that growth helps the poor, aid could be used to simply provide the poor with goods and services directly. This could be done through private goods provision, like cash transfers or, more typically, through the provision of local public goods such as roads, schools, or health clinics.Footnote 15 Aid for local public goods can be especially valuable because even when communities get wealthier, they may still struggle to provide local public goods as a result of collective action problems.Footnote 16 However, the benefit of these kinds of goods declines as one moves away from them—a health clinic built near you is useful while a clinic built far away is less useful—so a necessary condition for this kind of aid to help the poor is that local public goods must be built where poor people live.
While the logic for using aid to provide local public goods is compelling, it is not obvious why donors would choose to provide these goods by funding discrete projects rather than by providing recipient governments with forms of aid that have lower overhead, such as budget support, and then allowing the recipient government to allocate and build these goods themselves.Footnote 17 One common explanation is that project aid is used because it gives donors increased control over their aid.Footnote 18 This may explain why recipients with worse governance tend to receive WB loans that are targeted more precisely within countries.Footnote 19
The fact that donors are ostensibly in control of (especially project) aid allocations, combined with the simple fact that the donors are the ones with the resources that recipients want, has led many scholars to assert that foreign aid should be an exceptionally apolitical and developmental resource. One version of this claim is that aid is a uniquely “scrutinzed” resource and so it is able to produce public goods in environments that otherwise produce private goods and pork.Footnote 20 Another version is that foreign donors’ control over aid means that aid should be largely immune to political influence by recipient politicians.Footnote 21 Even studies that find that aid has negative effects on governance typically assume that aid is controlled by donors and that any negative effect of aid must occur through fungibility. For example, Morrison writes that aid may harm recipient governance like oil because it “is a highly fungible resource” and Smith argues that aid is like oil “to the extent that it is fungible.”Footnote 22 Fungibility can be a problem for donors trying to control aid, but before worrying about fungibility it is worth considering whether recipients can directly influence aid targeting.Footnote 23
While standard accounts of aid bargaining emphasize donor control, recent work has shown that donors sometimes fail to prevent recipients from influencing subnational aid targeting. For example, Jablonski and Briggs have both shown that recipients skew subnational aid allocations according to local political incentives in Kenya.Footnote 24 Domestic politics in recipient countries has also been shown to influence the location of aid-funded electrification in Ghana.Footnote 25 In the most directly relevant case study for the present note, Abdulai and Hulme have demonstrated that aid for poverty relief in Ghana was not spent in the country's poorest regions but rather in its richest regions.Footnote 26 While these studies draw on detailed subnational data, their single-country focus means that it is difficult to ascertain the extent to which recipient control over aid is a general phenomenon. I address this issue by examining subnational aid targeting across many recipient countries. Based on the public preferences of the donors under study, I expect that if donors have strong control over aid targeting then project aid should flow to subnational regions with more of the poorest people. Not finding such targeting is thus evidence against accounts of aid bargaining that stress donor control.
Because I study commitments for projects, I am not examining a representative or random sample of aid drawn from the population of all disbursed aid from these donors. The use of commitment data rather than a retrospective analysis of where aid actually went will likely bias the results toward overstating how much aid actually reaches the poor. This is because analyses of aid commitments implicitly assume that there is no leakage between the committed plan and the final outcome of a project. From a donor's point of view, this is a best-case scenario. To give one example of how commitments can misrepresent actual aid allocations, in Malawi in the 1990s a large amount of aid for education was essentially turned into cash by members of the regime through contract fraud.Footnote 27 The commitment data say that the aid was used to fund school construction, but in practice it was used to fund the incumbent party's election campaign. If one assumes that corruption or mismanagement is more likely to direct aid away from rather than toward the poorest, then any analysis of aid commitments is likely to overstate the extent to which aid actually reaches the poor. The use of data on only project aid will also likely lead to bias if one is trying to draw conclusions about the degree to which aid in general is controlled or targeted by donors. This is because project aid, unlike other forms of aid, is given for discrete, specific purposes like building a road in a specific district. This makes project aid relatively easy for donors to control. By analyzing project aid only, I maximize the information available to donors about where aid is going as well as their ability to precisely target aid within recipient countries. These biases imply that my results likely overstate both the extent to which aid in general is targeted to the poor and the extent to which aid actually reaches poor people.
Subnational, cross-national work in Africa is complicated by a lack of reliable data,Footnote 28 and so one additional contribution is to highlight how one can use household surveys to produce estimates of the spatial distribution of wealth groupings across regions. This approach complements existing methods for measuring subnational wealth. One increasingly popular approach to measuring the wealth of regions is to measure the intensity of night-time light. Hodler and Raschky, for example, use this method to show that birthplaces of leaders tend to see better economic outcomes than other areas.Footnote 29 While this approach is useful because it measures the presence of economic activity and a working electric grid at a fine level of detail, it says little about the wealth mixture of individuals in a region. From space, a region with a large number of rich people and large number of poor people may look the same as a region with only a large rich population. My approach complements strategies like measuring light at night by estimating the spatial distribution of wealth quintiles across regions within countries. Rather than simply working with the brightness of light or even average levels of wealth per region, my approach allows one to parse out the unique effects of richer and poorer people on aid allocation at a subnational level.
In sum, I compare subnational measures of wealth against geotagged aid projects to measure the degree to which foreign aid is targeted to poor people inside countries. Aid targets the rich rather than the poor. This finding holds in minimal regressions and after controlling for a number of potentially confounding factors. These results suggest that donors do not exercise strong control over subnational aid targeting. They also suggest that most aid is not currently able to reduce extreme poverty, since it does not actually reach the very poor.
Data
I examine the relationship between wealth and aid using data on the subnational distribution of aid projects and subnational measures of wealth created from comparable household surveys. The dependent variable is a measure of aid projects per region.Footnote 30 The data on aid projects come from AidDataFootnote 31 and include all projects from the ADB and WB that were approved in 2009 and 2010.Footnote 32 I included all projects that could be geolocated with a level of precision at the regional (ADM1) level or better and merged both years of data into one cross-sectional data set. The final data set includes about 1,400 geolocated projects across Africa.Footnote 33 Both donors spend on broadly similar sectors. The largest shares of the WB's aid go to health and social services, followed by agriculture, transportation, and energy. The ADB's project aid goes to energy, then transportation, social, and agriculture.Footnote 34 The biggest sectoral differences between the donors are the WB's emphasis on health and social services and the ADB's focus on energy.
The empirical analyses measure aid per region in three ways. The first measure is the region's share of a country's total number of aid projects. This measure implicitly considers all projects to be equal in terms of value. The second measure weights projects by their cost. This cannot be done in a straightforward manner because each geolocated project is typically part of a much larger project and the data set reports the cost of the larger project only. For example, a national electrification project could involve many unique, small, geolocated projects across a country but the data set includes only the cost of the high-level, national project. To calculate costs per geolocated project, I assume that the cost of a project is split equally across all of its sub-projects. This second approach then measures each region's share of a country's total dollar value of projects. Both of these initial measures range from 0 to 1. The third measure is the natural log of the total dollar value of each region's projects.Footnote 35
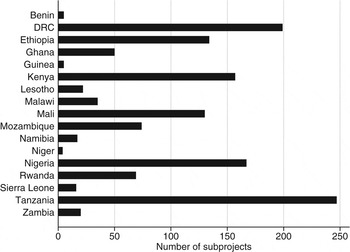
Because of a lack of good regional data on wealth, the analysis is limited to seventeen countries. While this limitation is unfortunate, it represents a large widening of scope over the single-country focus of the current subnational aid-targeting literature. The total number of aid projects ranges from a high of 247 in Tanzania to single digits in Benin, Guinea, and Niger. Figure 1 shows the number of aid projects per country for the seventeen countries in the sample.
Number of subprojects per country

Wealth Data
The key independent variables are drawn from measures of wealth quintiles created by the Demographic and Health Surveys (DHS).Footnote 36 The DHS has carried out nationally representative and cross-nationally comparable household surveys across Africa for decades. Regional information on wealth from the DHS can be matched to regional data on aid allocations, and this process allows us to examine whether areas with more poor (or relatively rich) people receive more aid.
The sample is limited to include all sub-Saharan African countries that had a DHS survey between 1999 and 2008 (inclusive). This ensures that the survey data are relatively close to, but always prior to, the 2009–10 period of the aid data. The sample was then restricted to countries that had DHS surveys that sampled within the country's standard regional boundaries. This procedure leaves seventeen countries.Footnote 37 The sample includes small countries like Lesotho and large ones like the Democratic Republic of the Congo. It includes countries that were colonized by the French, English, Belgians, and Portuguese. It includes populous countries like Nigeria and those with much smaller populations such as Sierra Leone. In all, it is a diverse sample of African countries.
The DHS has constructed a wealth index for each country in the sample. The index is calculated at the household level and is based on respondents’ answers to questions about their assets, such as if they own a bike or a radio, and the quality of their housing. Based on these answers, the DHS groups each respondent into a wealth quintile based on their household's wealth.Footnote 38 To make these figures useful for my analysis, they have been recalculated so that they show the estimate of the fraction of each wealth quintile that lives in each region in a country.Footnote 39 This reveals the relative wealth composition of each region. We can also compare across quintiles because they are equally sized by definition. Within the same country, 10 percent of the richest quintile will represent the same number of people as 10 percent of the poorest quintile. In its focus on the location of people grouped by wealth quintile, this study moves away from looking at simple regional averages of wealth and toward taking the underlying distribution of wealth seriously.
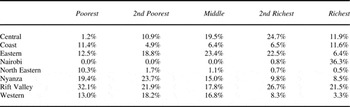
An example can serve to clarify the measure and demonstrate the value of tabulating the shares of wealth quintiles over regions. Table 1 shows how the share of wealth quintiles breaks down across regions in Kenya. Each column sums to 100 percent (after rounding) and represents one-fifth of Kenya's total population. While the table does not tell us how many people live in Kenya, it reveals the fraction of each wealth quintile that lives in each region. For example, about one-third of Kenya's richest people live in Nairobi. At the other end of the spectrum is Kenya's North Eastern province, which is quite poor and is the site of the Dadaab refugee camp and the Millennium Village of Dertu.Footnote 40 However, while North Eastern is poor, it is also lightly populated. This mixture of poverty and low population comes through in the table because the region holds 10 percent of Kenya's poorest quintile and very small shares of all richer quintiles. This can be contrasted with Rift Valley, which has many people spread across all of the wealth quintiles. Rift Valley is unique in this regard since most of Kenya's regions skew either toward the rich or the poor. While North Eastern and Nyanza skew toward the poor, Nairobi, and to a lesser extent Central, skew towards the rich.
Kenya's distribution of wealth quintiles

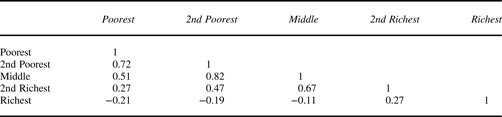
The segregation of the wealthy into regions that are geographically distinct from the poorer quintiles is a general phenomenon. Table 2 shows the mean of the correlations between wealth quintiles across the seventeen countries that make up the sample.Footnote 41 The poorest quintiles of the population correlate highly with each other, implying that places with lots of the poorest people also hold many people from the second-poorest segment of the population. This pattern holds all the way to the second-richest quintile. Thus, if we see favoritism to the poorest, it could partially reflect aid that is also being targeted to the people from the second-poorest or middle quintiles who live in the same region. The richest group, however, does not match this trend. Aid going to the richest quintile is benefiting the relatively rich far more than anyone else because the richest people are the most likely to live in relatively homogeneous, wealthier regions. While simply descriptive, the empirical demonstration of this level of geographical segregation contributes to our understanding of the subnational distribution of wealth in Africa.
Mean correlations between wealth quintiles over seventeen African countries

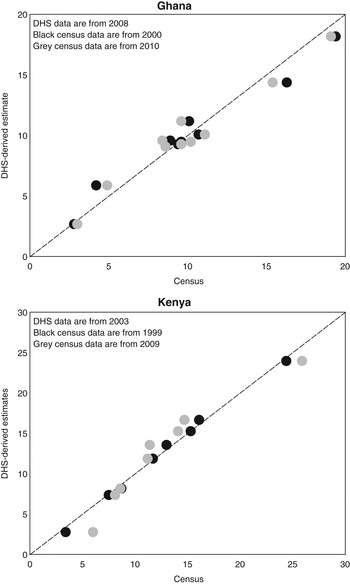
These results come from manipulations of household surveys, not census figures, so one may be concerned that this approach produces unreliable estimates of population shares. To address this concern, we can calculate the expected share of the total population per region from the DHS data and compare this against the population shares from census data. Calculating the expected total population share per region from the DHS data requires multiplying each wealth quintile share for a region by twenty and summing the resulting numbers. This approach to validation is useful because it tests one of my core assumptions, namely that each wealth quintile represents an equal fifth of a country's population. For example, to calculate Central Province's expected share of Kenya's total population one would multiply each percentage in the row representing Central in Table 1 by twenty and then sum the numbers to arrive at 13.6 percent. The expected shares are then compared against regional population share figures taken directly from Kenyan censuses from 1999 and 2009. These comparisons are done for two countries with reliable censuses, Ghana and Kenya, and the results are plotted in Figure 2. The results confirm that the DHS estimates are able to produce a good representation of subnational population distributions.
Validating the DHS measure against census data

To briefly recap, if donors control aid targeting then the location of aid projects should broadly reflect the stated preferences of the donors giving the aid and so skew to regions with more poor people. The data under study are especially likely to reveal such control because they are project aid commitments from multilateral donors. To examine subnational distributions of wealth, I introduced a method for measuring the distribution of people across regions by their relative level of wealth and validated this measure against census data. The analysis that follows leverages this new variable (and the fact that the poorest segments of the population positively correlate with each other while the richest live alone) to examine the extent to which subnational aid distributions reflect the stated, pro-poor preferences of the multilateral donors under study.
Analysis
The analysis explains how aid is allocated across 195 regions inside 17 countries, and all regressions use country fixed effects. Country fixed effects are important to the estimation because they allow us to examine only the factors that vary across regions within countries. The fixed effects also are necessary for the wealth quintile variables to make sense, since all wealth quintiles are equally sized within countries but not across countries.Footnote 42 The dependent variable is measured in three ways: as each region's share of a country's total dollar value of aid, as each region's share of a country's total number of aid projects, and finally as the natural log of the total dollar value of aid to each region. The key independent variables are the share of each wealth quintile that resides in each region.
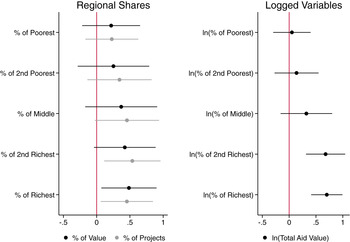
The initial results are presented in Figure 3 and show the bivariate relationships between the share of people in each wealth quintile and the region's level of aid.Footnote 43 The dependent variables in the left panel of the figure show each region's share of the total value of aid per country and each region's share of the total number of projects. The right panel uses the natural log of the total value of aid per region and the natural log of each wealth share variable.Footnote 44 The unconditional relationship between aid and wealth is descriptive, but it is important and reveals that aid is not targeting the poorest. In general, regions tend to receive more aid when they have more people in higher wealth quintiles. This effect holds across all three ways of measuring aid.
Bivariate (fixed effects) results

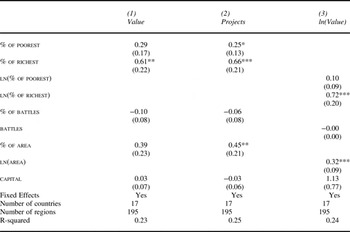
The remaining analyses work with the same dependent variables but include the share of the richest and poorest quintiles only as independent variables. Aside from the fixed effects, they also include each region's share of the country's total area, the region's share of conflict in the country, and a dummy variable marking whether the region holds the country's capital. All of the independent variables are either fixed (e.g., area) or were measured before aid commitments were made in 2009 and 2010. The area control accounts for the fact that the optimal number of many aid-funded goods may increase with the area of a region. For example, all else equal, longer roads are needed in larger regions. The region's share of conflict controls for the fact that donors might direct aid away from regions that have worse security. This is measured as each region's share of the total number of battles in the two years leading up to 2009.Footnote 45 Finally, capital cities hold many of the wealthiest people and aid recipients may want to skew aid or other resources toward capital cities because unrest in capital cities is uniquely dangerous to recipient governments.Footnote 46 The analyses control for the presence of a capital city in a region using a dummy variable. The results appear in Table 3.
Main Results

Notes: Robust standard errors clustered on countries in parentheses. *p < 0.10; **p < 0.05; ***p < 0.01.
The key result is that while the effect of the fraction of the poorest people on aid is not statistically significant, the effect of the richest is consistently large and significant. This is the case when regional aid is measured as a fraction of the total cost of all projects, when aid is measured as a fraction of the total number of all projects, or when aid is measured as the log of a region's total value of aid (and the wealth share variables are also logged). Even after controlling for area, violence, and capital city bias, we see that aid is still skewed toward the rich. There is no evidence that violence or the presence of a capital city has any direct influence on aid.Footnote 47 The effect of the richest segment is also much larger than 0.2, which would be its expected value if aid was allocated equally by population.Footnote 48
Robustness
These results hold across a large number of robustness checks, all of which are fully reported in the appendix and only briefly mentioned here. The robustness tests include: dropping all countries that received fewer than five aid projects or had fewer than five subnational regions, adding a control for within-region inequality, the use of models that are designed for dependent variables that are bound at 0 and 1, regressions with observations weighted so that each country (rather than each region) contributes equally to the results, tests where I sequentially exclude one country at a time from the models to examine if the results are being driven by individual countries, tests to see if aid is more likely to flow to regions where the recipient country's sitting president was born, selection models where I examine how the wealth variables influence the probability of a region receiving any aid, and disaggregated analyses where I see whether the two donors use different targeting strategies. In total, the main text and the appendix present ninety-three tests of the poorest and richest wealth quintiles’ influence on aid. The effect of the richest was significant (p < 0.05) in ninety-two (99%) of the tests and the effect of the poorest was significant in three (3%) of the tests. While these figures do not come from an exhaustive specification search, they demonstrate that the core results hold across a wide variety of variable transformations, data set modifications, and modeling choices.Footnote 49 Aid does not flow disproportionately to regions with more of the poorest people.
While most of the robustness tests simply confirm my core results, a few findings warrant mention. First, regions where the recipient's president was born are not more likely to receive aid. While this result is unexpected, it is in line with other work suggesting that co-ethnics are not always favored by African presidents or that co-ethnics are not evenly favored across types of goods.Footnote 50 The selection models reveal that regions with more of the richest are more likely to receive at least one aid project. There is no significant effect for the poorest. The results by donor show that neither donor targets aid to the poorest and both target aid to the richest. The main difference between the donors is that it seems that the ADB's skew to the rich is largely driven by a bias to regions with capital cities while the WB's is not.
In interpreting all of the results, one should keep in mind the correlational structure of the data (see Table 2). Across the seventeen countries under study, the poorer quintiles tend to cluster together while the richest tend to be more segregated. This implies that when aid provides local public goods to the regions with more of the richest people, as it is doing in these countries, it is missing the regions that hold not only the poorest, but also large portions of the bottom half of society.
All of my results are produced using model-based, as opposed to design-based, empirical strategies.Footnote 51 While this implies that the causal effect of poor or rich people on aid is not identified, this should not overshadow the importance of the earlier correlations. Aid is flowing to the rich instead of the poor, and this is not a result of factors such as the size of regions, the location of capital cities, internal security, or ethnic targeting. Further, the coefficient for the effect of the richest on aid in the preferred specification barely changes when moving from the bivariate model graphed in the right panel of Figure 3 to the results with full controls shown in Table 3, model 3. When conditioning on observables has such a minimal effect on a coefficient it suggests that the unobserved variables would have to be significantly more confounding than the all of the observed variables to overturn the result.Footnote 52
Discussion
Aid may act like oil because both are tax-free resources.Footnote 53 However, one important difference between aid and oil is that aid may be much more “encumbered,” meaning scrutinized and controlled by the donor, than oil.Footnote 54 If aid is highly encumbered, then it should harm recipient governance only if it is also highly fungible. If aid is not encumbered, however, then there is good reason to expect it to directly harm recipient governance and the question of fungibility is not particularly relevant. While the theory suggesting that aid will be highly encumbered is compelling, I found that subnational aid allocations directly contradict donors’ stated preferences. This suggests that donors are either not willing or not able to encumber their aid. If this is happening to project aid, which is relatively easy to monitor and target, then it should be more likely with other forms of aid. Similarly, bilateral donors, who have much stronger incentives to use aid as a bribe, should be less likely to encumber their aid than poverty-conscious multilateral donors. Thus, unencumbered aid is probably quite common.
While I did not probe the mechanisms preventing donors from targeting their aid to the poor, they are worth mentioning. First, it is possible that donors do not actually care where aid goes within countries. For example, a World Bank staff member in Tanzania said that “the World Bank provides financing. And the client, as we call it, or the government then basically decides where they want to spend the money.”Footnote 55 If this sentiment is common, then it is no surprise that aid does not follow donor preferences. Second, it is possible that donors care about subnational aid allocation but that recipients strategically approach donors and manipulate information to produce their desired distribution.Footnote 56 In this case, a recipient's strategic action can allow it to defeat attempts at donor control. Finally, donors may not have good information on where the poor live, and so they cannot convert their abstract preference for pro-poor aid allocations into concrete preferences of levels of aid over regions in specific countries. If this is the case, then better information should result in aid allocations more closely aligning with donor preferences. Which of these mechanisms best explains how donors lose control over aid targeting is a question for future research.
There are robust cross-national patterns in subnational aid targeting, with aid being directed to regions with more of the richest people. This finding is consistent with previous work showing that aid is insensitive to measures of regional need like average rates of infant mortality or malnutrition.Footnote 57 Given that project aid typically provides local public goods, these results suggest that aid is not being allocated effectively to alleviate extreme poverty.
The finding that aid targets the richest people within countries also has implications for choices about which countries should receive aid. Recent work has shown that a majority of the world's poorest people currently live in middle- rather than low-income countries.Footnote 58 This could lead one to conclude that poverty-sensitive donors should direct more aid to these middle-income countries with many poor people. While sensible, this assumes that it is trivially easy for donors to target aid to the poorest people within countries. This seems to not be the case. In general, we should probably be skeptical of strategies for cross-national aid allocation that hinge on donors successfully encumbering their aid.
While ethnicity often influences the distribution of resources in Africa, I found no evidence that aid from these donors favors the president's home region. Instead, these results support an explanation that hinges on the role of wealth in influencing distributive politics.Footnote 59 A strong focus on ethnicity may blind us to other politically relevant groupings. Future work can look more closely at the relative influence of ethnic and economic factors and the conditions under which governments are more sensitive to one factor over the other.
Finally, I presented a new way of measuring the relative spread of wealth across regions within countries. This approach complements other approaches, such as measuring subnational levels of light at night, by allowing one to parse out the unique influence of different wealth groupings. This measure is likely to be useful in countries where national statistical data are questionable or where subnational measures are not easily comparable across countries.
Conclusion
Combining subnational measures of wealth with geolocated project aid data across seventeen African countries reveals that aid does not favor the poorest. Rather, aid disproportionately flows to regions that hold more of a country's richest people. While I did not identify the causal effect of poor or rich people on aid allocations, I showed that the results are not being driven by factors such as a region's size, regional inequality, the presence of a capital city, internal security, or presidents favoring their home regions. In line with recent case-study research on the politics of foreign aid, and opposed to work emphasizing the power of donors, the results suggest that donors do not exercise strong control over aid targeting within recipient countries.
Supplementary Material
Supplementary material for this article is available at https://doi.org/10.1017/S0020818316000345