1. INTRODUCTION
Aerospace engineering design relies heavily on the use of past experience. It is known that engineering designers frequently need to revisit previous design solutions and understand the rationale for their generation (Karsenty, Reference Karsenty1996). Research into capturing and structuring the rationale for complex decisions dates back to the early 1970s and Rittel's proposal of an Issue-Based Information System (IBIS; Kunz & Rittel, Reference Kunz and Rittel1970). A new IBIS-based software tool called DRed (Design Rationale editor) was developed in 2002 by researchers at the Cambridge Engineering Design Center (EDC; Bracewell & Wallace, Reference Bracewell and Wallace2003; Bracewell et al., Reference Bracewell, Ahmed and Wallace2004). DRed facilitates recording design rationale at the time of its generation and deliberation. The software is currently in regular use in design projects in an international aerospace company.
Current understanding of how DRed and other IBIS-based tools help designers to read and interpret design rationale is largely based on informal evidence. According to the literature, structuring textual information supports comprehension. However, the influence of splitting text into small chunks using diagrammatic representations and hyperlinks, which are the prominent features of DRed, is less clear cut, especially in the context of particular tasks that engineers perform. To the best of our knowledge, a study to identify the most suitable way to structure and present design rationale to facilitate its reuse has not been conducted in the engineering domain. Therefore, an evaluation of DRed is required to ensure that a move from a traditional way to read and interpret design rationale to a form mediated by DRed does not bring any adverse effects on the task of reusing information. A project to conduct a rigorous empirical evaluation of how DRed supports designers has recently been launched at the Cambridge EDC. Initial research to determine whether DRed improves the richness of the recorded information suggested that the engineering processes captured and structured in DRed, compared to those presented in traditional design definition reports (DDRs), are richer in both the number of recorded design solutions and the number of pro and con arguments underpinning those solutions (Aurisicchio et al., Reference Aurisicchio, Bracewell and Wallace2006a). The present article explores whether the use of DRed-structured reports (structured text), compared to traditional reports with very few visual textual cues (semistructured text), makes the reading and interpretation of recorded information more effective and efficient for those who would like to reuse it. In particular, the aim is to determine what experimental design is more suitable to predict the influence of structure on reading and interpretation of design rationale.
Researchers who undertake industrial empirical evaluation of tools to support complex engineering tasks will find this article of interest because it sets out a methodology to guide in this endeavor. Practitioners on the lookout for efficient, effective, and user-friendly information management might find in this article ideas for future changes in their organizations.
2. READING AND INTERPRETING DESIGN RATIONALE
2.1. DRed
DRed is a simple software tool that was developed to help designers to capture, structure, and edit new design rationale as well as to read and interpret past design rationale. DRed is intended to be complementary to and to be used together with analysis software, computer-aided design, office, and other applications. It facilitates the creation of a design folder, where all electronic information, generated during a design project, is stored. Information in the folder is mapped according to the dependencies inherent in the design rationale.
As a design proceeds, the design folder for the project provides a place where a team of designers can store the emerging product definition, the ideas evaluated and accepted or rejected, clear rationale for these decisions, and all supporting documents. In its implementation, a DRed design folder is simply a directory, either personal or shared, containing at least one DRed chart. A typical design folder will contain a number of DRed charts, each one stored in a single file. DRed charts are used to replace traditional designers' notebooks and formal design reports. On completion of the project, for future reference within the company, the folder can be published on-line using a conventional Web server or, potentially, it can be managed through its life cycle by a product life-cycle management system.
A DRed chart is a diagrammatic representation of design rationale drawn on a canvas inside the main software window. DRed charts are zoomable, scrollable two-dimensional spaces of practically unlimited extent. DRed fundamental nodes are created from a predefined set of elements (see Fig. 1). These are the IBIS traditional element types that allow designers to record and present their rationale (MacLean et al., Reference MacLean, Young, Bellotti and Moran1991; Conklin et al., Reference Conklin, Selvin, Shum and Sierhuis2001). In response to practical needs of the engineering design domain, DRed introduces three new element types, termed text, task and file, also shown in Figure 1.
DRed nodes. [A color version of this figure can be viewed online at journals.cambridge.org/aie]

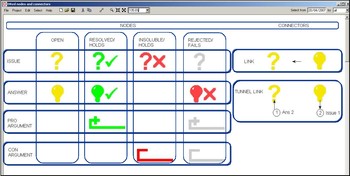
Each of the fundamental node types has a predefined set of statuses; a change of status is signified by changes in color and background graphic (see Fig. 2). A familiar to users traffic light color scheme (red–amber–green) is employed to help with comprehension and memorizing visual representations. This gives a clear view of the progress of a design and enables the knock-on effects of revoked decisions, or the discovery of new information, to be propagated through the rationale. For example, in the issue node, the amber question mark image is used to identify an open issue, whereas the red question mark and the red cross image is used to identify an insoluble issue.
DRed nodes' statuses and connectors. [A color version of this figure can be viewed online at journals.cambridge.org/aie]

The user generates a DRed chart by manually creating, positioning, and linking nodes to each other on a workplane. Any node on a chart can be linked to any other, although there are some advisory restrictions; and any node can easily be converted from one type to another. A line with an arrow on one end makes up a unidirectional link, which represents a dependency whose meaning is inferred from the type of nodes at each end of the link (see Fig. 2).
Tunnel links represent dependencies between two nodes that either belong to different charts or to the same chart but are positioned far from each other (see Fig. 2). The tunnel entrance and exit mouths are shown as small circular icons, which are always created as a pair and can be navigated in both directions. The rationale for large design projects is often represented legibly as a set of tree-structured DRed charts. Tunnel links help to maintain connections and causality between multiple charts.
When reading and interpreting DRed charts, the users' interaction with the software is mainly focused on the recognition of the node graphics, reading and interpretation of the text, and navigation of the linked spaces. Users have been observed to follow specific node paths either with a finger or by gazing along a locus of visual attention. The cognitive processes involved in reading and interpreting a DRed chart consist of inferring meaning from the contents of nodes (both textual and graphical) and the way the nodes are linked.
DRed is used in the social context of a large aerospace company producing major power systems products. DRed is a system with large degree of sharing, that is, the DRed charts often have multiple authors and are meant to be read and reused by individuals who are not necessary the original authors of the charts.
2.2. Current understanding on reading and comprehension of structured text
Research into how the structure of information influences interpretation is valuable for organizations and individuals that are engaged in education, news publishing, and delivering business information. This research received a powerful boost with the introduction of e-learning and e-publishing, which exploit the World Wide Web and on-line hyperlinked documents. Despite the fact that engineering design documents differ in many aspects from a news article or from school teaching material, in the absence of specific data on engineering documentation it is important to be aware of the lessons learned in the research of text comprehension in those domains.
Melville et al. (Reference Melville, Hands and Jones2002), comparing structured clinic letters to conventional letters containing a listing of problems, showed that structured letters take no longer to read, are strongly preferred by doctors, and improve comprehension. The authors of this study found no correlation between reading time and recall (completeness). Reading structured letters was also found to train doctors to read unstructured letters more effectively.
In a review of the relations between the organization of text and its reading comprehension in an educational context, Dickson et al. (Reference Dickson, Simmons and Kameenui1995) concluded that the effect of the structure and presentation of text on reading comprehension is more global that local, that is, well-structured text results in better comprehension of the main ideas, while having little or no effect on comprehension of details.
Duke and Pearson (Reference Duke, Pearson, Farstrup and Samuels2002) pointed out that students should experience writing the range of genres that educators wish them to be able to comprehend, and should develop abilities “to write like a reader and to read like a writer.” The authors expect that in the future text comprehension may be linked to text navigation because of the growing use of hypertext and the consequent need to read material in a nonlinear style.
Hypertexts allow for nonlinear access to information, usually dividing information into separate chunks and structuring it. McDonald and Stevenson (Reference McDonald and Stevenson1996) studied the phenomenon of disorientation in hypertext, that is, a situation when the user is unable to make informed decisions about which paths to follow to satisfy their information goals. Disorientation manifests itself in longer times to find the required information and a loss of accuracy (correctness). The authors stress that, despite these possible adverse effects during immediate use, hypertexts are likely to help in tasks that require the use of long-term memory. Brown (Reference Brown1998) reported that jumping between small sections of text has no detrimental effect on recall (completeness).
Vaughan and Dillon (Reference Vaughan and Dillon2006), studying the effect of time on navigation of certain types of Web pages, showed that over time users increased their navigational exploration in the reading tasks and improved their navigational efficiency in the information-seeking tasks. The authors suggest that these improvements reflect the development of mental representations of information structure.
2.2.1. Levels of structuring technical textual information
Although in many companies textual technical information is most commonly captured and structured in reports allowing only linear access to information, alternative options for structuring corporate information are possible.
Because hypertext allows for a nonlinear retrieval of information it is widely used in manuals, for example, in the IT industry. In hypertext each chunk of information is generally known as a node. Several topological structures of these nodes can be generated: the most popular are hierarchical and network structures (Shin et al., Reference Shin, Schallert and Savenye1994). The size of a node can vary significantly and is generally down to the author of the document.
Text can also be represented visually by linking smaller chunks of information in a meaningful way (Duke & Pearson, Reference Duke, Pearson, Farstrup and Samuels2002) into a diagram. These representations also allow for the nonlinear access to information, although of a different form compared to hypertext. Different visual representations are possible depending on the meaning of the nodes and their connectors. This type of presentation is used to visualize transport networks, data and control flows, organizational structures, and so on.
2.3. Approaches to assess the role of visual representations in reading and comprehension
Because DRed charts not only organize information in a certain way but also employ visual graphical notations, it is important to be aware of the influence that these notations might have on comprehension. A belief that images and diagrammatic representations help comprehension is common, and there is evidence that supports it. However, there is no clear consensus on the mechanisms through which visual representations influence comprehension. A study by Blackwell (Reference Blackwell1997) dispelled the common belief that an image is worth a thousand words by establishing that in a diagram an image is worth, on average, 84.1 words. This example gives a flavor of potential follies associated with assessing the value of graphical representations on the basis of unsubstantiated cognitive beliefs.
Rodrigues et al. (Reference Rodrigues, Traina, de Oliveira and Traina2007) proposed a framework for assessing comprehension of data visualization that is based on the theory of sign processing. According to this theory, the visual process is considered to include preattentive processing and detailed scanning. Preattentive processing aims at extracting low-level properties, and plays a crucial role in faster visual cognition, whereas detailed scanning is slower and addresses conventional reading practices. The authors proposed that effective visualizations must have features supporting preattentive processing.
A large body of research on the role of visual representations exists in the field of visual programming. The cognitive complexity of programming and the fact that software development is a form of engineering makes findings and approaches in this field very relevant for engineering design. According to Whitley (Reference Whitley1997), “An underlying premise of visual programming research is that visuals will improve the human–machine interface by catering to human cognitive abilities.” Whitley drew attention to the importance of the design of evaluation experiments and to the large individual variations that might influence or even mask the results of between-subject experiments. In addition, she emphasized that a complex task as programming involves at least two cognitive skills like search and comprehension, which can be helped through visual representations.
Studies of the so-called match–mismatch hypothesis occupy a prominent position in the field of visual programming (see, e.g., McDonald & Stevenson, Reference McDonald and Stevenson1996; Chattratichart & Kuljis, Reference Chattratichart and Kuljis2001). Gilmore and Green (Reference Gilmore and Green1984) first formulated this hypothesis for textual computer programs. The hypothesis states that if a notation highlights a certain type of information, then a task requiring that type of information should be easier to perform than a task that requires a type of information that is not supported by this notation.
According to North (Reference North2006), evaluations of visual interpretations are often based on testing simple tasks, which do not reflect the real tasks that users will have to perform in a work situation. Similarly, in an article on graph visualization, Purchase (Reference Purchase2000) made a distinction between two ways of assessing human performance in the reading of graph drawings: a relational reading of the graph that measures the efficiency and accuracy with which people can read a graph structure and answer questions about it, and an interpretive consideration of a graph, where the effectiveness of the graph drawing is measured within the context in which the application-specific graph is usually used. It can be expected that, in accordance with the match–mismatch hypothesis, the user performance on relatively simple tasks does not necessarily give a correct prediction about the actual performance in the context of real work and/or use.
Dürsteler (Reference Dürsteler2007) emphasized the importance of cultural aspects in understanding visual notations. Although the cultural context can be considered as a part of wider understood previous user experience, it is wise to consider it separately because quite often the previous user experience is reduced to the user's familiarity with a particular type of software or diagrams (Stone et al., Reference Stone, Jarret, Woodroffe and Minocha2005).
Finally, a study of a new software system should consider the methodological approaches that were proposed in the field of human–computer interaction (HCI). Rich information about different experiment designs is available; see reviews by Landauer (Reference Landauer, Helander, Landauer and Prabhu1997) and Karat (Reference Karat, Helander, Landauer and Prabhu1997). However, depending on the goals of a study, the resources available, and the nature of the systems, and tasks to be tested, the design of experiments can vary widely. In fact, in a detailed review of behavioral research methods in HCI, Landauer (Reference Landauer, Helander, Landauer and Prabhu1997) identified two main research issues in relative evaluation of systems: finding measures that will accurately predict differences in actual use, and finding data collection methods that are sufficiently informative, quick, and economical.
2.4. Summary of the literature
Despite the fact that the visual representations have been studied both on the empirical and theoretical level, current understanding of how these representations work is still very limited. A successful visual representation does not exist in isolation. It is strongly connected to the information tasks that the users perform and to the social and cultural context of use.
The analysis of the literature indicates that structuring text, supplying it with visual cues, and giving a possibility of nonlinear access to chunks of text is generally preferred by users, is likely to improve comprehension, takes no longer time to retrieve information, and can train in reading unstructured text. Hyperlinked representations can potentially lead to difficulties with orientation, longer time to retrieve information, and loss of accuracy (correctness). On the basis of these findings we put forward the following hypotheses:
Hypothesis 1: DRed-structured reports are not going to have a negative effect on reading and interpretation.
Hypothesis 2: The use of DRed helps to create mental models that users employ in the reading and interpretation of standard documents.
3. RESEARCH METHODOLOGY
This article presents a summative comparative evaluation of a software tool and a method embodied in it. More specifically, the research focuses on carrying out a summative outcome evaluation, which is defined by Trochim (Reference Trochim2006) as the investigation of whether a program or technology causes demonstrable effects on a specifically defined target outcome. The effects of design rationale structure and presentation on reading and interpretation are evaluated in the context of design information reuse. The method for structuring and presenting design rationale currently used in the collaborating company is used as a benchmark. The method to be evaluated is Dred and its way of structuring and presenting design rationale. A formative evaluation of the features of the tool to inform its further development and improve the expressiveness of its graphical user interface was not a goal of the investigation presented here.
3.1. Experimental setup
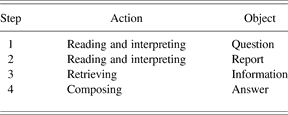
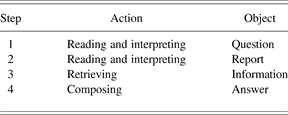
Comparative evaluation of the reading and interpretation of design rationale consisted in designing, setting up, and conducting an experiment involving participants as similar as possible to real users. The experiment design is inspired by past observational research on information seeking (Aurisicchio et al., Reference Aurisicchio, Bracewell and Wallace2006b) and reproduces a real working situation. In the experiment, to satisfy an information need and eventually inform the design of a new component or assembly, a designer has to read and interpret the design rationale captured in a report. Therefore, the experimental task had to include four key steps as described in Table 1.
Steps in the task
The participants were randomly split in two groups and were asked to read and interpret an electronic report in two different formats and to retrieve and compose an answer to a predefined question. The report formats used in the experiment were a semistructured DDR generated using a standard office text editor (see Section 3.2) and a DRed-structured report generated by the researcher reverse engineering the same DDR into DRed.
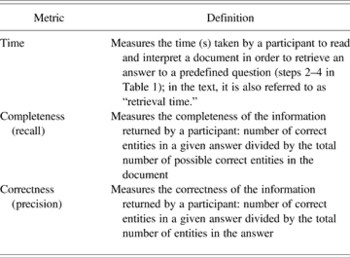
The performances of the participants were measured through the time required to produce the answers as well as their completeness and correctness. Table 2 presents definitions for the three metrics used in the analysis.
Evaluation metrics

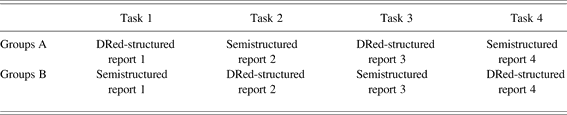
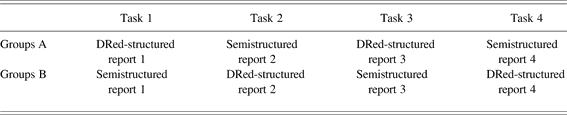
Performing experiments in an industrial setting imposes inevitable limitations. The collaborating company agreed that only the engineering graduate trainees would participate in the experiment, and not the experienced designers. The activity had to present some educational bonus to the trainees and provide all of them with similar experience, that is, each trainee had to have a chance to work both with the traditional and DRed-based representation of design rationale. The size of the groups was limited by the number of engineering graduates being trained by the company at the time of a particular experiment. To obtain as much information as possible from this constrained situation and to cover a range of information needs that prompt designers to reuse design rationale, the experiment consisted of repeating four times the basic experimental task, each time using a new question and a new report. The way the reports were presented to the participants is outlined in Table 3.
Alternation of reports' structure in the four tasks for groups A and B
Prior to the start of the experiments, the goals of the research were explained to the participants and instructions on how to carry out the four tasks were provided through a 20-min presentation. The time allocated to each task was 22.5 min, that is, a total of 90 min for the entire experiment.
All participants were degree educated and new to the task of designing. In addition, they were unfamiliar with the genre of a DDR and with the task of writing, reading, and interpreting design rationale. The structure of a DDR represented in the traditional text editor was explained to them. All the participants were fluent users of the text editor used in the experiment. A few days before the experiment, the participants were instructed in the use of DRed and provided with experience in reading and interpreting DRed-structured design rationale. Before the experiment they were given another short demonstration. However, none of them used the tool for practical work before the experiment. Therefore, their exposure to DRed was controlled and equal, which would not be the case for experienced designers. Unfortunately, the lack of experience meant that they had to master the tool on the spot during the experiment. The latter could be expected to have two important consequences: results with DRed are not as high as they could have been with a group of experienced software users, and the individual performances could be biased by the participants' individual abilities to quickly learn to work with a new method of representing information and a new software.
In total, two experiments were conducted with different participants under identical conditions, but on two different occasions. The number of participants in the first (groups 1A and 1B) and the second (groups 2A and 2B) experiment was expected to be 12 and 16, respectively, but only 11 and 13 trainees actually participated. Groups 1A and 2A started the experiment with a DRed chart, whereas groups 1B and 2B started with the same information presented in a Microsoft Word document (see Table 4). The experiments took place in one of the computer rooms at the Learning and Development Centre of the collaborating company. The time slots were selected by the company contact and were from 4 to 6 pm and from 3 to 5 pm for the first and the second experiment, respectively. The experiments were conducted using Windows PCs or laptops. The technical characteristics of the machines, the size of the screen, and that of the font used to read and interpret design rationale were standardized and controlled as much as possible.
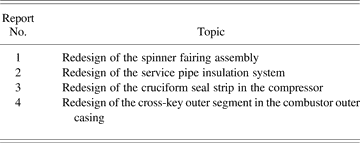
Topics of the design definition reports
3.2. The technical reports used in the experiment
The technical information captured in designers' notebooks during the development of design tasks generally consists of short textual paragraphs, sketches, and calculations (Aurisicchio et al., Reference Aurisicchio, Bracewell and Wallace2003). In the collaborating company, when tasks are completed, this information is generally expanded and structured in the sections of a DDR. These reports capture the rationale behind the development of specific design solutions. In the reports, the information is organized in terms of structure, for example, semantic and syntactic cues as well as logical connections, and physical presentation, for example, physical features, signal words, and visual textual cues (headings; Dickson et al., Reference Dickson, Simmons and Kameenui1995). These reports offer a degree of nonlinear access to information through their headings and subheadings. The template for DDRs is predefined, and designers write them using Microsoft Word. DDRs are generally prepended by a summary and structured into three main sections, namely, specification requirement, alternative solutions, and final solution description. The reports also include a number of further sections, for example, statement of compliance, risk and reliability, along with graphs and images. The average length of a DDR is eight US letter-sized pages. DDRs vary significantly depending on the nature of the design solution and the individual styles of their authors.
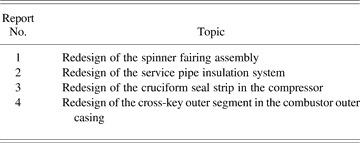
Four DDRs were used in the experiments, and the participants had to answer one question per report. The reports with thoroughly documented design rationales were chosen for the experiment. The design tasks described in the reports were variant designs, which means that the work involved incremental innovation to extend existing product solutions (see Table 4).
3.3. Reverse engineering technical reports into DRed
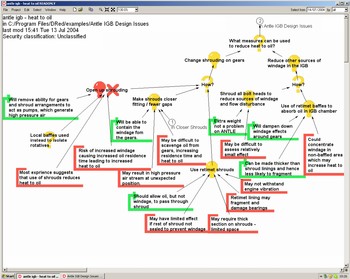
Reverse engineering a DDR into DRed is a time-consuming and difficult task. It generally requires developing an in-depth understanding of the design solution and identifying the issues considered during the design process and the solutions proposed, together with their dependencies. Figure 3 shows a DRed chart, which presents a fragment of a DDR reverse engineered into DRed. All reports were reverse engineered into DRed by the same researcher, who was neither an experienced DRed user nor an experienced engineering designer.
A fragment of a DDR reversed engineered into DRed. [A color version of this figure can be viewed online at journals.cambridge.org/aie]

A DRed-structured DDR consists of a number of tunnel-linked charts. The reports from one to four consisted of six, six, six, and four DRed charts, respectively. Each DRed-structured DDR was composed of a main chart, one specification requirement chart, and a variable number of design charts to describe the final and alternative solutions. The main chart included the summary, which was copied from the original DDR, the top level issues and its solutions, together with links to the specification requirement and design charts. The charts were linked by tunnels into a tree structure with the main chart acting as a root. There were only a few tunnel links between branches of the tree structure.
The key difference with standard reports is in the way the narration is structured and presented including the introduction of visual cues. As far as navigation is concerned, in standard DDRs users have to scroll up and down to move between sections of the text, whereas in DRed-structured reports users have to scroll up and down, left and right, and follow a number of tunnel links. Compared to a DDR, a DRed-structured report offers additional levels of reading: visual scanning for identification of accepted and/or rejected solutions, reading and examining of accepted and/or rejected solutions, and reading and examining of the reasons why solutions were accepted and/or rejected.
3.4. The questions
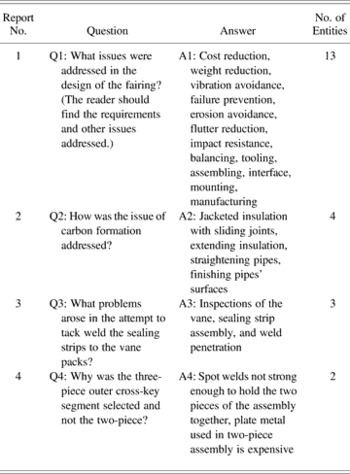
The four questions used in the experiment are presented in Table 5 in the order in which they were shown to the participants. The identification and selection of the questions was informed by previous research in engineering information seeking behavior (Aurisicchio et al., Reference Aurisicchio, Bracewell and Wallace2006b). The four questions represent typical information needs of a designer on different design stages. The first question is answered by retrieving a set of issues associated with the design of the spinner fairing assembly. It is noteworthy that these issues are mentioned in both the specification of the requirements and the development of the final solution. The second question required identifying the methods used to solve the problem of carbon formation. The third question required identifying the problems faced when attempting to tack weld the sealing strips. Finally, the fourth question required identifying the reasons for using a certain solution for the outer cross-key segment rather than an alternative one.
Four questions and associated answers

The questions differ in the type and amount of information required to be known to answer them. The answers are constructed by analyzing information from different parts of a document and identifying a set of entities. The larger the number of entities that compose the answer, the wider is the search required. The model answers were defined before undertaking the experiment.
Table 6 presents where in the report the entities composing the answers are located. For DRed charts the table also details the type of the node containing the entity. If a user were able to correctly identify which node type he or she had to look for, the search task could be simplified and the correct entities could be identified more easily.
Location of answers to the four questions

3.5. Capturing the actions of the trial participants
The requirements for the method to capture the actions of the participants were identified as follows:
• to record the answers to questions,
• to record time taken to answer each question,
• to ensure that the participants perform the tasks in a consistent and controlled manner,
• to reproduce as closely as possible an order of user actions during information retrieval for work-related purposes (raise a question, read and interpret a report, retrieve information, compose an answer),
• to use a method for data collection that permits a trial with many people participating at the same time,
• to install no new software and not use client-server applications, and
• to use a method that requires the minimum learning curve for the participants.
Microsoft Excel was selected to drive the experiment because of its convenient event-driven programming model, flexible and resizable grid that allows the entry and display of text of variable length, easy access to system libraries (for capturing time), possibility of further numerical data processing within the same application, and the fact that engineers often use Microsoft Excel in their work and are familiar with its features. The Microsoft Excel workbook was programmed in such a way that the user first sees and evaluates the question and only afterward the document; thus, the natural sequence of events in the information retrieval process is preserved. The graphical user interface is presented in Figure 4.
An application for evaluating reading interpretation (confidential information is blurred). [A color version of this figure can be viewed online at journals.cambridge.org/aie]

4. EVALUATION OF READING AND INTERPRETATION OF STRUCTURED AND SEMISTRUCTURED REPORTS
The answers returned by the participants were analyzed using the three evaluation metrics previously presented: time, completeness, and correctness (see Table 2). The time metric and two other metrics were analyzed and computed by two independent researchers to exclude possible bias in the data analysis.
4.1. Answer completeness and correctness over time
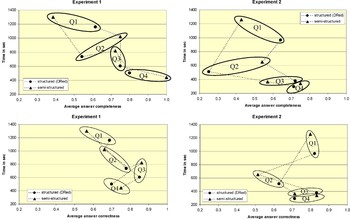
Irrespective of the structure and presentation of the design information contained in the reports, the results for both experiments indicate a pronounced downward trend in the average time taken to answer a question when moving from question 1 to 4 (see Fig. 5). This trend can be explained by the following two factors: the types of questions used in the experiment and the order in which they were presented to the participants, and the experience acquired by the trainees while carrying out the task (Section 4.3 provides more evidence in support of this explanation).
The average answer completeness and correctness over time. The dotted lines show the progression of each group through the four questions. [A color version of this figure can be viewed online at journals.cambridge.org/aie]

The data also show that in the second experiment, compared to the first, the time to answer the individual questions was shorter (see Fig. 5). The drop in time can be explained by considering that the trainees involved in the second experiment were at the final stage of a group design project and, therefore, were eager to resume this activity.
In the first experiment, the times of the participants, who interpreted structured information to answer questions 1, 2, and 3 were shorter than those of the participants who dealt with semistructured information (see Fig. 5). In the final question this trend was reversed, but, taking into account large values of standard deviation for all average data, the difference is insignificant. In the second experiment, the times of the participants, who interpreted structured information to answer questions 1, 2, and 4, were shorter than those of the participants in the other group, whereas the times for question 3 were approximately equal (see Fig. 5). Therefore, in both experiments those who worked with structured information achieved times shorter than or equal to those of their counterparts working with semistructured sources, that is, structuring design rationale IBIS style and breaking it down across interlinked charts slightly improves the speed of task execution.
A reduction in the time of task execution can be considered an important result only if it is accompanied by a better retrieval performance. For question 1, the results from both experiments indicate that the trainees working with structured information delivered better performances with respect to both the completeness and correctness of the answers provided. For question 2, the results from both experiments show that the trainees working with semistructured information delivered more complete answers, whereas those using structured information delivered more correct answers. For questions 3, the use of structured information almost always ensured better performance, whereas for question 4 the use of semistructured information always allowed obtaining more complete and correct results. Only in one case the two performance metrics showed contrasting results for the same question (see question 2).
The analysis and interpretation of these results is complex, and requires considering the factors previously listed, that is, types of questions, order of presentation of questions and experience. Question 1 was the first to be presented to the trainees and also the most demanding as it required the identification of the highest number of entities (see Table 5). Despite this, with regard to this question the group of trainees working with structured information delivered a good performance with respect to each of the three metrics. At the time when the trainees answered this question they did not have prior experience of reading and interpreting design rationale. After answering this question, it is expected that experience started to play a role in the performance of the trainees. Question 1 is, therefore, the only one where previous experience can be disregarded and the least number of independent variables have to be considered. The performances of the individual trainees in answering question 1 are now investigated in more detail.
4.1.1. Answering question 1
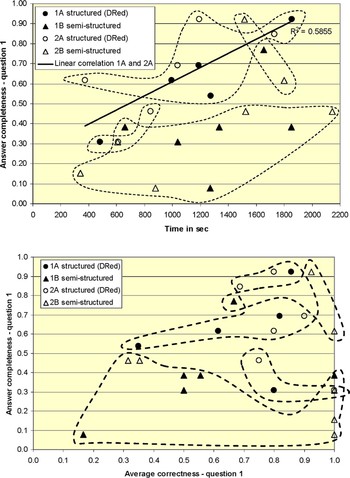
The results for completeness show that 10 of the participants who examined semistructured information gave answers with completeness below 0.5, and that 8 of the participants who used structured information gave answer above 0.5 (see Fig. 6). It is also important to emphasize that the more complete answers were obtained through a thorough text examination, which resulted in relatively longer times.
Completeness, correctness, and time to answer question 1. [A color version of this figure can be viewed online at journals.cambridge.org/aie]

When examining the performances of the 11 trainees that used DRed-structured design information and their times to answer question 1, a linear correlation was identified (R 2 = 0.58) suggesting performance improvement with time increase (see black line in Fig. 6). The performances of the 13 participants that used semistructured information did not indicate a correlation. Melville et al. (Reference Melville, Hands and Jones2002), in their investigation of structured medical letters, reported the absence of correlation between reading time and recall, however, it can be assumed that the degree of structure that she imposed on her textual information is considerably lower than that imposed in the transformation of a DDR from its standard format to DRed.
Before interpreting the results for correctness, it is important to remember that high correctness is a condition necessary to deliver a good performance, but not sufficient. Therefore, these results have to be interpreted in conjunction with those for completeness. It was surprising that the 10 participants who used semistructured information and delivered performances with low completeness (<0.5) achieved either low (<0.6) or high (>0.6) correctness. Low correctness is usually associated with difficulties in navigating hyperlinked sources, which is not present in the case of traditional DDRs. The loss of correctness indicates that participants may have had more difficulties in identifying issues in traditional DDRs than in navigating DRed charts. The eight participants who used structured design information and delivered high completeness performances (>0.5), always achieved high correctness. Overall, these results suggest that when the question requires identifying many entities and undertaking a wide search across the available information space, exploring structured design information brings more complete and correct answers.
4.2. Effects of experience on retrieval performance
Figure 5. indicates that experience plays a role in retrieval performance. In both experiments, on average, the completeness performance of the participants who started the experiment using structured information was always higher than that of participants who started with semistructured information. Although the correctness and time metrics do not support this trend, it is likely that the individuals who started the task reading and interpreting structured design rationale developed better comprehension strategies for the analysis of DDRs. This phenomenon is in agreement with Melville's finding that interpreting structured information may also train the reader to subsequent interpretation of less structured information (Melville et al., Reference Melville, Hands and Jones2002). Melville attributed the enhancement in strategic reading to improved semantic processing.
4.3. Discussion, limitations, and future work
This article presented a summative comparative evaluation of the influence of the structure of design rationale on its reading and interpretation. Following established practice (Landauer, Reference Landauer, Helander, Landauer and Prabhu1997) for comparative evaluation of new computer technology and user interfaces, the empirical study was performed in a situation as close as possible to real working conditions and in full systems. The research was carried out on two data sets collected from 11 and 13 engineering graduate trainees, respectively. Although the results in Sections 4.1 and 4.2 presented trends indicating that the structure of design rationale sometimes has a beneficial effect on reading and interpretation, analysis showed that the differences between the two groups are not statistically significant. Two reasons for these results are the challenge posed by the design of an experiment to evaluate complex cognitive tasks in industry, and the large individual variations. This means that the hypotheses proposed in this research can be confirmed at the level of trends rather than statistically proven dependencies, and that further work to consolidate these preliminary results is required. Understanding the reasons for these results is important in order to establish where to direct future efforts.
Our experimental design was informed by previous research into information-seeking behavior of designers. Evaluating reading and interpretation of a technical report by soliciting answers to predefined questions was found to be appropriate, and is in line with practice in the educational area. As can be concluded from a large number of high-quality answers, the lack of domain knowledge on the part of the trainees did not present a problem. Unexpectedly, it was difficult to motivate some of the participants. The request from some of them not to participate in the experiment can be interpreted as a sign of low motivation. It is also impossible to underestimate the impact of tiredness in a situation where experiments were conducted at the end of the working day. In the future, raising the level of motivation and concentration can help obtain results with lesser individual variations. The data from the two experiments were found to provide an interesting, but partial picture. Informal postexperiment debriefing with the participants indicated that coupling the experimental data with a questionnaire to capture the retrieval preferences of the participants would have enriched our comprehension.
Among the metrics employed in the experiments, the time to retrieve the answers helped to understand the differences in the types of question evaluated and in the performances of the two groups. Because none of the participants required the entire experimental time to perform all set tasks, it can be concluded that the time pressure was not a factor. Setting a shorter time limit for each question, that is, forcing the participants to work under pressure, might help capture further differences in the way information presentation influences comprehension.
The completeness of the answers returned by the participants was the most informative metric. The correctness of answers was found to be the least useful, but its use is recommended to double check quality of the answers. Identifying and employing methods to monitor and time the movements of participants through different report sections or DRed charts could deliver an understanding of the users' navigation of and interaction with the structure of design rationale. Developing a deeper understanding of participants' performance by analyzing their individual results remains a subject for further research.
The observations made during the experiments revealed influences that were initially not considered. For example, the fact that the participants were proficient users of the text editor, but had little experience of using DRed, had a number of repercussions that could have been addressed by providing more training. Some participants were observed using the find facility integrated in the text editor, but did not use a similar facility in DRed. The participants extensively employed the copy and paste functions of the text editor, whereas most of them did not know how to perform similar actions in DRed. In addition, the researchers also observed that the participants using DRed sometimes experienced difficulties in the navigation from one chart to the next. These issues created an asymmetry in the way they searched for information and composed their replies, possibly putting an unnecessarily high cognitive load on the participants who used DRed and slowing them down.
Another source of variability lays in the three strategies that participants, regardless of the format of the reports, employed in order to relieve load on their short-term memory: text was copied and pasted from a source of information directly to its final destination in a spreadsheet, a simple text editor (Microsoft Notepad) was used as a temporary storage area for the text, and article was used to write down some notes by hand. A number of participants were observed using some of these strategies, whereas some of the participants, probably, did not employ these strategies at all. Whether the use of these strategies is consistent with an experiment on comprehension is open to a debate.
The DRed charts used in the experiment were produced by reverse engineering a DDR into DRed. Although reverse-engineering is not a unique mapping and may have distorted the quality of the information, there hardly exist any other way to generate two alternative representations of the same complex engineering information. To ensure high quality of reverse engineering, the DRed-structured reports, generated by an inexperienced DRed user, were subsequently checked by one experienced DRed user and one experienced designer. One of the key issues in reverse-engineering design rationale into DRed is to establish correctly the level of information granularity, that is, the amount of text that each node should contain. Guidance in this process is generally provided by the structure of the original documents, its logical flow and semantics.
Overall, the methodology employed in this research presented trends showing that not all retrieval questions are supported to the same extent by presenting structured information. An open issue in this context is which questions designers most commonly require answering, and which ones are better supported by structuring information sources. Quite often in practice designers tend to first accumulate a number of questions and then consult reports. This information-seeking behavior should be considered in the design of future experiments.
5. CONCLUSIONS
The successful development of current aerospace projects is heavily dependent on effective reuse of past design rationale. In many manufacturing organizations, this information is often captured in reports, which are linearly structured, provided with very few visual cues, and produced at the end of design tasks. Accessing design rationale via these reports may not always be the best solution. The literature indicates that structuring text and supplying it with appropriate visual cues has a positive impact on its reading and interpretation.
A methodology for summative comparative evaluation of differently structured design rationale was proposed and applied. Two experiments with a total of 23 participants were carried out in the industrial setting of a major power systems company with the aim of exploring the influence of text structure on its reading and interpretation. The results from the experiments showed that, depending on the information needed, structuring text either promotes or inhibits reading and interpretation. In particular, the results suggest that structuring design rationale IBIS-style and supplying it with many visual cues positively influences its reading and interpretation to answer questions requiring wide information search. The lessons learned in the process of designing and applying the methodology proposed here were discussed to improve the quality of the results in future experiments.
ACKNOWLEDGMENTS
The authors acknowledge the support of EPSRC and Rolls-Royce through the University Technology Partnership for Design. We thank Jim Wickerson, Michael Moss, and the trainees who evaluated DRed for providing valuable ideas and feedback.
Marco Aurisicchio is a Research Associate in the Engineering Design Centre (EDC) at the University of Cambridge. He obtained his PhD from the University of Cambridge in 2006, conducting research on information seeking by engineering designers in the aerospace domain. Since 2000 he has carried out research within the University Technology Partnership for Design, which is a collaboration among Rolls-Royce, BAE Systems, and the Universities of Cambridge, Sheffield, and Southampton. Dr. Aurisicchio's current research interests include design education, visual representations, and diagram-based tools.
Marina Gourtovaia is a Research Associate at Cambridge EDC. She joined EDC in 2002 and is responsible for creating software tools that implement novel research methods that are being developed in the EDC. Initially she worked on eifForm, an interactive tool for generative design. Then she implemented an ontology-based Web system for storing, retrieving, and visualization of engineering design information. For the last 3 years she has been working on DRed. Her main areas of research are design and evaluation of information visualization and establishing an efficient and productive software development process in an academic environment.
Rob Bracewell is a Senior Research Associate and Assistant Director of the Cambridge EDC and a Mechanical Engineer. He has conducted research in the fields of exploitation of ocean wave energy, mechatronics, and advanced robotics. Dr. Bracewell's recent main interests are in creating software tools to help designers, generating and evaluating innovative design solutions, and unobtrusively capturing the rationale behind their decisions. His software tool, DRed, which was researched and developed in close collaboration with Rolls-Royce plc, has rapidly gained acceptance as the standard tool for capturing and communicating rationales for design and problem diagnosis activities across the company.
Ken Wallace joined the University of Cambridge in 1978. In 1991 he was responsible for setting up the Cambridge EDC, and he is currently Chairman of the Centre. He is Co-Director of the BAE Systems/Rolls-Royce University Technology Partnership for Design. He translated and edited the English editions of Engineering Design—A Systematic Approach by Pahl and Beitz. In 1999 Dr. Wallace was elected a Fellow of the Royal Academy of Engineering. He was awarded the ASME Ruth and Joel Spira Outstanding Design Educator Award in 2001 and the Sir Misha Black Award for Innovation in Design Education in 2002.