INTRODUCTION
Ecologists have become increasingly interested in the existence of a class of tropical forests in which a single late-successional tree species comprises the majority of the canopy trees (Connell & Lowman Reference CONNELL and LOWMAN1989, Hart Reference HART1990). These monodominant forests occur in all tropical regions and often cover large geographical areas. The native wet forests of the Hawaiian archipelago are generally dominated by a single endemic tree species, ohia (Metrosideros polymorpha Gaud.). In addition to monodominance by M. polymorpha, a major characteristic that unites Hawaiian wet forests across the five largest islands (Hawaii, Maui, Molokai, Oahu and Kauai) is the periodic, large-scale die-back of the M. polymorpha canopy trees. This die-back results in the death of most mature trees in a given area. Mueller-Dombois (Reference MUELLER-DOMBOIS1986) presented a Hawaiian rain forest succession model that incorporates five different forms of natural canopy die-back to explain the cyclic successions of M. polymorpha characteristic of Hawaiian rain forests. In this model, M. polymorpha stands develop in cycles, with generations of similar-aged canopy trees lasting from 300–500 y before they experience a canopy die-back event. Akashi & Mueller-Dombois (Reference AKASHI and MUELLER-DOMBOIS1995) concluded that there are episodic build-up and breakdown phases in the Hawaiian rain forest and the forest consists typically of a ‘spatial patch mosaic of differing sizes formed by cohort or generational stands’. In this sense, the landscape-scale die-back events may be viewed as large-scale ‘gaps’ – the well-documented turnover process associated with rain forests in more species-rich areas (Mueller-Dombois Reference MUELLER-DOMBOIS2006).
Is this model relevant in all M. polymorpha forests? While much research has been devoted to understanding the early phases of primary succession in forests on young (<3000 y) substrates (Aplet & Vitousek Reference APLET and VITOUSEK1994, Aplet et al. Reference APLET, HUGHES and VITOUSEK1997, Drake & Mueller-Dombois Reference DRAKE and MUELLER-DOMBOIS1993, Zimmerman et al. Reference ZIMMERMAN, HUGHES, CORDELL, HART, CHANG, PEREZ, LIKE and OSTERTAG2008) and to the long-term patterns of vegetation development in relation to nutrient availability along the substrate age gradient from Hawaii island to Kauai (Crews et al. Reference CREWS, KITAYAMA, FOWNES, RILEY, HERBERT, MUELLER-DOMBOIS and VITOUSEK1995, Kitayama et al. Reference KITAYAMA, SCHUUR, DRAKE and MUELLER-DOMBOIS1997), relatively little attention has been given to the high-elevation montane wet forests that dominate much of the habitat between 1400–2000 m in elevation on Maui and Hawaii. These forests are remarkably intact and cover large tracts of land but their dynamics and successional patterns have not been well documented. Generally dominated by M. polymorpha in terms of both stem density and canopy cover, these forests often contain emergent Acacia koa A. Gray as well. Tree stature and vertical canopy structure are exceptional for Hawaii, with both M. polymorpha and A. koa regularly reaching 1 m or more in diameter at breast height (dbh) and heights of 30–40 m. The abundance of large trees and high-standing biomass (P. Hart unpubl. data) potentially makes the successional processes in these forests fundamentally different from the better-studied forests at lower elevations. In addition, these forests are critically important habitat to a majority of Hawaii's remaining native forest birds, many of which are federally listed endangered species. In this paper I present results from a long-term study in permanent vegetation plots within a monodominant montane Hawaiian wet forest. I focus on two fundamental parameters – tree growth rates and age structure. In particular, I examine how growth varies as a function of species, size and position in the canopy, and then use this information, along with tree age, to evaluate predictions of the cyclic succession hypothesis for old-growth montane wet forest development in Hawaii.
METHODS
Study area
The field portion of this study was conducted from January 1996–August 2005 within Hakalau Forest National Wildlife Refuge on the eastern slope of Mauna Kea volcano, island of Hawaii (approx. 19°50′N, 155°20′W). Vegetation in this area is classified as Koa/Ohia (Acacia/Metrosideros) Montane Wet Forest (Gagne & Cuddihy Reference GAGNE, CUDDIHY, Wagner, Herbst and Sohmer1990), but can also be classified as a monodominant Metrosideros polymorpha forest because this species comprises greater than 90% of the individuals in the canopy. Mean annual rainfall was 2250 mm at Hakalau during the study period. The substrate is comprised of moderately fine-textured silty clay (Akaka soil association; Sato et al. Reference SATO, IKEDA, PAETH, SMYTHE and TAKEHIRO1973) that developed in 10000–30 000-y BP tephra deposits (Wolfe & Morris Reference WOLFE and MORRIS1996). Beginning in 1996, two 100-ha study sites, separated by approximately 4 km of continuous forest, were established at 1750–1900 m asl. Both these study sites have a degraded understorey layer that is a result of a history of low-density cattle ranching in the upper elevations, but have remained fairly intact at the lower elevations. Within each study site, 10 1-km-long transects were established with permanent plots placed at 100-m intervals (200 plots total).
Data collection
All tree species within a 15-m radius of each plot centre and greater than 5 cm dbh were marked with an aluminium tag secured to the tree with an aluminium nail at approximately 1.3 m above the ground. The diameter of each tree, none of which forms buttresses, was measured with a synthetic fabric diameter tape at a point approximately 3 cm above the tag. In addition, within each 706.5-m2 plot, all trees were classified as belonging to one of four distinct crown classes within the canopy stratum: dominant, co-dominant, intermediate and suppressed (Smith Reference SMITH1986). Dominant trees were those in which the entire crown generally had full exposure to sunlight throughout the day. Co-dominant trees were those in which the sides of the crown were fully to partially shaded by adjacent trees, but because no neighbouring trees were taller, the upper portions of the crown received full sunlight throughout the day. Trees were classified as intermediate if some but not all neighbouring trees grew taller and shaded a portion of the upper crown for at least part of the day. Suppressed trees were those that appeared to grow in the full shade of neighbouring trees for most of the day. This classification scheme was highly repeatable between observers based on informal field tests. Initial measurements of all trees were completed by December 1998. From February 2004–August 2005, all tagged trees within each of the 200 survey plots were re-measured 3 cm above the aluminium tag.
Growth
Annual growth rates (g) were calculated for all individuals as:

where g = annual growth (mm y−1), D 1 = tree diameter (mm) at first measurement, D 2 = tree diameter (mm) at second measurement, and t = total number of days between measurements.
A mixed-effects model using the nlme library on R software (version 2.9.0; The R Foundation for Statistical Computing) was used to model log-transformed growth rate for M. polymorpha. Explanatory variables for this model included ‘plot’ as a random term to account for autocorrelation between trees within a plot, and ‘dbh’, ‘crown class’, and the interaction between dbh and crown class as fixed terms.
Age
Crown-class model. Because M. polymorpha trees do not produce reliable annual growth rings (Gerrish & Mueller-Dombois Reference GERRISH and MUELLER-DOMBOIS1999), tree age was estimated in two ways. First, a modification of the crown-class model as described by Baker (Reference BAKER2003) was employed. This model uses dbh and crown class to estimate the age of individual trees. Individual annual growth rates (g) were used to determine mean diameter annual growth increment (AGI) for each 5-cm-increment dbh class and crown-class category. A model was then created for the combined growth of all intermediate, co-dominant and dominant trees. Suppressed trees were not included because most suppressed trees appear to die before they are able to move into the larger size classes (Hart unpubl. data).
A quadratic model provided the best fit for the mean AGI in mm y−1 for 15 dbh size classes for intermediate, co-dominant and dominant trees combined, where:

Starting with 1-mm-dbh trees, AGI was calculated and added to the previous year's dbh. This process was repeated until the hypothetical trees reached 75 cm dbh. Tree age was then estimated as the sum of the number of iterations of the equation to reach the dbh of the tree in question. To create a size-age plot, the sum of the number of years required for a tree to progress between successive 5-cm-dbh size classes was plotted vs. dbh size class. The upper and lower 95% confidence intervals for the mean AGI for each of the 15 dbh size classes were used to create quadratic models for the upper (UCB) and lower (LCB) 95% Confidence bounds for the AGI model, where

These equations were used to create confidence bands on the size–age curve by repeating the steps described above for the mean AGI model.
Of course, many trees would be expected to grow outside these 95% confidence bands. For example, based on AGI for each crown class, the oldest trees in the forest would be the few that grew as suppressed trees until they reached 30 cm dbh, then moved to intermediate status from 30–45cm dbh, then grew as co-dominant trees until death. To calculate a maximum age curve, the mean AGI for suppressed trees in each dbh size class was added to the previous year's dbh (starting with 1 mm dbh), and the process was repeated as the trees progressed through the intermediate and co-dominant classes up to 1 m dbh. For minimum age, only size-class-specific growth rates for trees of the fastest-growing classes (dominant and co-dominant) were used. Both minimum and maximum age were calculated as the sum of the number of iterations required to reach a particular dbh and plotted on the size–age curve.
Radiocarbon method. Radiocarbon dating was used as a second method to estimate the age of M. polymorpha trees, and to validate the crown-class model. It is well known that radiocarbon dating can be problematic when the sample age is between 50 and 350 y old because of fluctuations in atmospheric 14C density during this period (Stuiver et al. Reference STUIVER, REIMER, BARD, BECK, BURR, HUGHEN, KROMER, MCCORMAC, Van Der PLICHT and SPURK1998). However, the crown-class model predicted that most M. polymorpha trees larger than 60 cm dbh should be greater than 350 y old, suggesting that relatively accurate 14C dates could be attained if samples were taken from the oldest wood in the trunk. Because M. polymorpha trees often grow asymmetrically, the oldest portion of the trunk is rarely at the centre, so it is almost futile to use increment borers to obtain samples from live or dead standing trees. Instead, a total of 27 recently fallen trees (within approximately the past 10 y) were haphazardly located and sampled within and adjacent to the permanent plots in both Pua Akala and Pedro study areas. Most trees were untagged and at least 50 m away from the nearest neighbouring fallen tree. The date of fall was estimated by the presence or absence of leaves and fine twigs on branches, as well as the ‘freshness’ of bark on the trunk. As with many large tropical trees, the centre of large M. polymorpha often decomposes, leaving many live-standing trees with hollow centres at breast-height. A chainsaw was used to cut a 3–6-cm-thick radial disc from the lowest section of the trunk in which the core had not yet rotted away. This position ranged from 1.3 m from the base of the fallen trunk to over 4 m. The diameter at breast height and GPS location for each tree were also recorded. Discs were transported to the laboratory, where they were sanded with progressively finer grades of sandpaper to better identify the growth rings corresponding to the oldest section of the disc (Stokes & Smiley Reference STOKES and SMILEY1968). This location was often easily identified by a single ring approximately 1 mm in diameter. A sample of 5–10 mg of wood was taken from this section using a 25-mm drill bit and sent to the Keck Carbon Cycle Accelerator Mass Spectrometry facility at the University of California, Irvine. Holocellulose was then purified from each sample and combusted, and the resulting CO2 purified was then reduced to a graphite target for accelerator MS measurement of 14C (Southon & Santos Reference SOUTHON and SANTOS2004). Resulting radiocarbon values were calibrated with the program OXCAL 4.0 (Bronk-Ramsey Reference BRONK-RAMSEY1995, Reference BRONK-RAMSEY2001) to determine the age for wood grown before 1950 by using the calibration curve INTCAL04 for the northern hemisphere (Reimer et al. Reference REIMER, BAILLIE, BARD, BAYLISS, BECK, BERTRAND, BLACKWELL, BUCK, BURR, CUTLER, DAMON, EDWARDS, FAIRBANKS, FRIEDRICH, GUILDERSON, HOGG, HUGHEN, KROMER, MCCORMAC, MANNING, BRONK-RAMSEY, REIMER, REMMELE, SOUTHON, STUIVER, TALAMO, TAYLOR, VAN DER PLICHT and WEYHENMEYER2004). A calibration dataset is necessary to convert conventional radiocarbon ages into calibrated years because specific activity of 14C in the atmosphere is not constant (Reimer et al. Reference REIMER, BAILLIE, BARD, BAYLISS, BECK, BERTRAND, BLACKWELL, BUCK, BURR, CUTLER, DAMON, EDWARDS, FAIRBANKS, FRIEDRICH, GUILDERSON, HOGG, HUGHEN, KROMER, MCCORMAC, MANNING, BRONK-RAMSEY, REIMER, REMMELE, SOUTHON, STUIVER, TALAMO, TAYLOR, VAN DER PLICHT and WEYHENMEYER2004, Vieira et al. Reference VIEIRA, TRUMBORE, CAMARGO, SELHORST, CHAMBERS, HIGUCHI and MARTINELLI2005). OXCAL 4.0 determined all possible locations (ranges of dates) where the 14C ages intersected the calibration curve, and calculated the relative probabilities (summing to 95.4%) for each date range (Appendix 1). Only samples from trees with dbh greater than 40 cm were used for 14C analysis because trees smaller than this were not likely to be old enough to obtain accurate age estimates (i.e. greater than 350 y). For the 27 fallen trees sampled that met this criterion, 95.4% confidence intervals for calibrated age (where BP represents before 2009) were plotted on a size–age curve to illustrate the amount of overlap in age estimates between the two different measures.
RESULTS
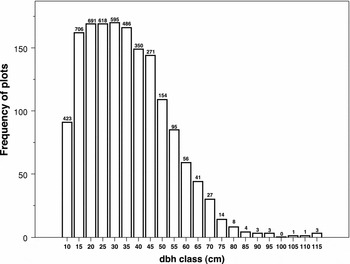
A total of 6173 live trees was initially tagged and re-measured in the 200 plots. The mean number of years between measurements was 6.75. Metrosideros polymorpha was by far the most abundant tree, comprising 89.7% (n = 5537) of the trees greater than 5 cm dbh at the two study areas combined. Metrosideros polymorpha was well represented in most plots by all size classes, from saplings between 5–10 cm dbh to giants greater than 1 m dbh (Figure 1). Of the seven remaining species, Myrsine lessertiana A. DC. was most abundant (3.19%, n = 197) and Vaccinium calycinum Sm. the least abundant (0.21%, n = 14).
Histogram of total number of plots (out of 200 sampled) that contained Metrosideros polymorpha trees in a given 5 cm dbh size class. Values on the x-axis represent the upper bound for each size class. Values above bars represent the total number of M. polymorpha trees sampled.

Growth
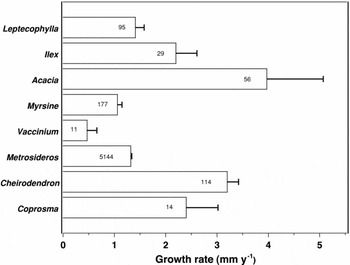
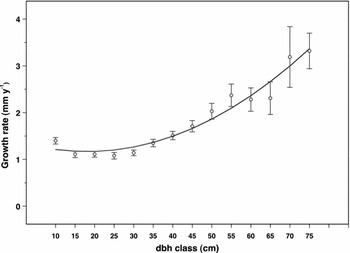
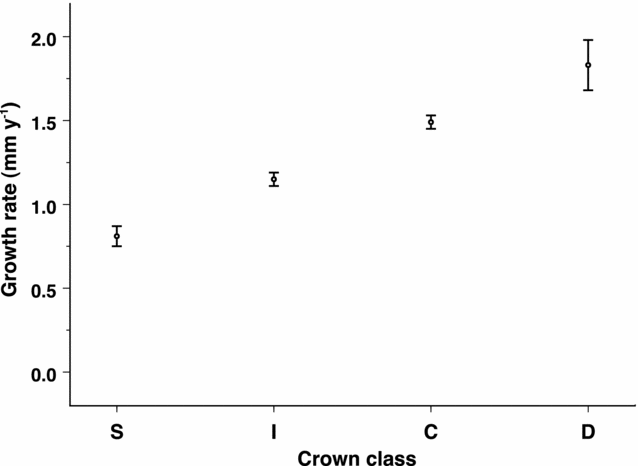
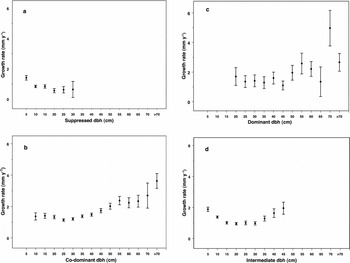
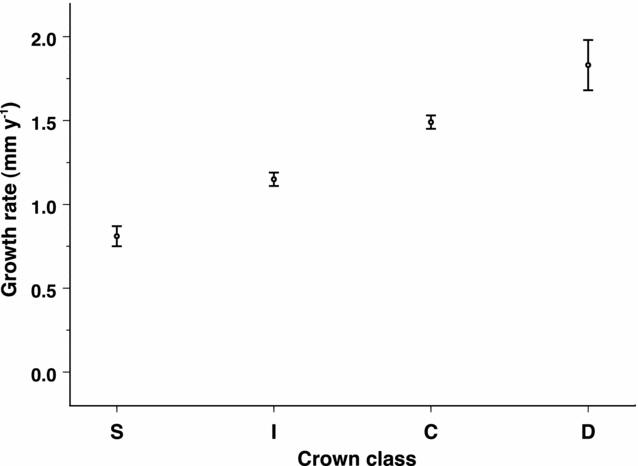
Despite its dominance, M. polymorpha is among the slowest-growing trees at Hakalau, with a mean growth rate of 1.3 mm y−1. Only Vaccinium (0.58 mm y−1) and Myrsine (1.1 mm y−1), grew more slowly than M. polymorpha during the period of this study (Figure 2). Growth rates for M. polymorpha varied as a function of dbh class and crown class. For all crown classes combined, mean growth within each size class decreased slightly with size up to approximately 20 cm dbh, then increased with size through the largest size classes (Figure 3). Due to small sample sizes for larger size classes of trees, growth rate estimates for trees greater than 70 cm dbh were pooled (n = 36). For all trees combined, the full linear mixed model (log growth = plot + crown class + dbh + crown class × dbh) which included plot as a random factor provided the best fit for predicting growth rate (crown class: df = 3, F = 3.38, P = 0.017; dbh: df = 1, F = 226, P < 0.001; interaction: df = 3, F = 6.60, P < 0.001). The interaction term was primarily due to the difference in model slopes between suppressed trees and all other crown classes. Overall, suppressed trees grew slowest (0.8 mm y−1) and dominant trees grew the quickest (1.8 mm y−1; Figure 4). Suppressed tree growth declined significantly with size (F1, 4 = 8.06, P = 0.046; Figure 5a) up to approximately 30 cm dbh, after which individuals either died or moved into a different crown-class category. Growth rates for both co-dominant and dominant trees increased significantly with size (F1, 12 = 43.6, P < 0.001 and F1,10 = 5.67, P = 0.038; Figure 5b, c respectively). Intermediate trees followed a roughly U-shaped growth curve up to approximately 45 cm dbh, after which they presumably either died or moved into the co-dominant or dominant crown classes (Figure 5d).
Growth rate (mean ± SE) for eight tree species at Hakalau Forest National Wildlife Refuge: Coprosma ochracea W. Oliver, Cheirodendron trigynum, Metrosideros polymorpha, Vaccinium calycinum, Myrsine lessertiana, Acacia koa, Ilex anomala and Leptecophylla tameiameiae (Cham. & Schltdl.) C.M. Weiller. Sample sizes are given in each bar.

Observed (mean ± SE) and predicted growth rate as a function of size (cm dbh) for Metrosideros polymorpha trees at Hakalau Forest National Wildlife Refuge. Values on the x-axis represent the upper bound for each size class.

Growth rate (mean ± SE) as a function of crown-class category (S = suppressed, I = intermediate, C = co-dominant, D = dominant) for Metrosideros polymorpha trees at Hakalau Forest National Wildlife Refuge. Sample sizes (n) = 423, 1776, 2262 and 190 respectively.
Growth rate (mean ± SE) as a function of size (cm dbh) for suppressed (a), co-dominant (b), dominant (c), and intermediate (d) Metrosideros polymorpha trees at Hakalau Forest National Wildlife Refuge.

Age
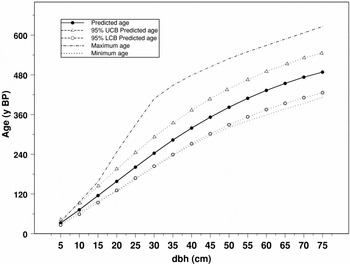
Crown-class method. Because larger trees generally grow more quickly than smaller trees, the age–growth curve is asymptotic, with age increasing more slowly with size above approximately 20 cm dbh (Figure 6). Based on the best-fitting model for intermediate, co-dominant and dominant trees combined, the prediction curve on Figure 6 illustrates that a 75-cm-dbh M. polymorpha tree is 488 y old, with a 95% CI of 426–546 y old. Based on crown class and size-specific growth rates measured over the course of the study, a 100-cm-dbh tree would range from a minimum of 502 to a maximum of 720 y old.
Predicted age (y BP), 95% Upper Confidence Bounds (UCB), 95% Lower Confidence Bounds (LCB), maximum age, and minimum age as a function of size (cm dbh) for intermediate, co-dominant, and dominant Metrosideros polymorpha trees combined at Hakalau Forest NWR. For suppressed and intermediate trees of a given size, age would likely be closest to the maximum age curve.

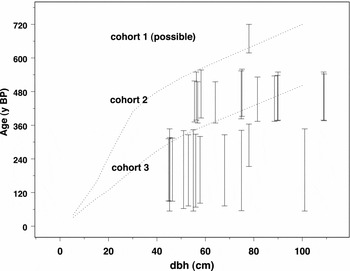
Radiocarbon method. The 95.4% CI overlapped the minimum–maximum bounds of the size–age curve constructed under the crown-class model for 20 out of 27 trees (Figure 7). The confidence intervals for 14C age revealed the presence of at least two, and possibly three, distinct age groups of M. polymorpha trees greater than 40 cm dbh (Figure 7). These groups have a median age separated by between 200–250 y. The maximum 14C age of the youngest age group was 364 y BP, while the middle age group ranged in age from 368–560 y BP. An older group may have been represented here by a single individual ranging in age from 618–720 y BP (Figure 7). All trees with a median calibrated age > 350 y BP were larger than 55.0 cm dbh, but not all trees larger than 55.0 cm dbh were greater than 350 y BP (Appendix 1). Most notably, a 101-cm-dbh tree (T-1) had a median age of only 233 y BP, with a 22.0% probability of being between 324–347 y BP. Conversely, T-38 had a dbh of only 58.2 cm, but a median calibrated 14C age of 510 y BP. The oldest tree dated by 14C had a dbh of 78.0 cm and a median calibrated age of 647 y (95.4% CI = 618–720 y; Appendix 1; Figure 7). Of the two possible calibrated age ranges given for this tree (Appendix 1), the younger (618–657 y BP) appeared most likely based on the crown-class model.
14C age (calibrated y BP) as a function of size (cm dbh) for Metrosideros polymorpha trees at Hakalau Forest NWR. Bars represent 95.4% confidence interval for age (Appendix 1). Dotted lines represent minimum and maximum age curves based on size class and crown-class specific growth rates.

DISCUSSION
As indicated by the regression model, the annual growth rate for M. polymorpha was highly dependent on both tree size and crown class, with a significant interaction term that is likely due to the different relationship between size and growth rate for suppressed vs. co-dominant and dominant trees. Perhaps most importantly, these data show that M. polymorpha larger than 5 cm dbh are able to grow beneath an intact canopy of conspecifics. These findings contrast with past observations, primarily on seedlings (Atkinson Reference ATKINSON1970, Cooray Reference COORAY1974, Gerrish & Mueller-Dombois Reference GERRISH and MUELLER-DOMBOIS1999) indicating that this species is shade intolerant. At the sapling stage, M. polymorpha shows intermediate shade tolerance – it is able to tolerate the light environment found beneath a canopy of M. polymorpha and A. koa, but shows little tolerance for additional decreases in light created by an intact mid-canopy layer dominated by dense shade-producing species such as tree ferns (Cibotium sp.).
Tree age
Metrosideros polymorpha trees appear to commonly reach ages that are rarely attained by any angiosperm tree. Based on the crown-class model, the predicted age for a 60-cm-dbh tree is 433 y. Similarly, the median calibrated 14C age was 422 y BP for trees greater than 60 cm dbh. Nevertheless, the crown-class model for estimating age of M. polymorpha may work best for trees smaller than 40–50 cm dbh. This is because trees in these smaller classes are less likely to have moved between crown-class categories. For larger trees, the crown-class model would have difficulty distinguishing between similar-sized individuals in non-overlapping age groups (Figure 7).
Investigations into temporal dynamics and tree age in tropical forests in other parts of the world have relied heavily on extrapolations from short-term growth trends within permanent forest plots (Baker Reference BAKER2003). Efforts to obtain tree ages from tropical trees have been slowed by their widely reported lack of annual growth rings (Lang & Knight Reference LANG and KNIGHT1983, Lieberman et al. Reference LIEBERMAN, LIEBERMAN, HARTSHORN and PERALTA1985, Whitmore Reference WHITMORE1990). However, numerous studies have demonstrated annual ring formation in tropical forests with strong annual dry season or seasonal flooding (Fichtler et al. Reference FICHTLER, CLARK and WORBES2003, Worbes Reference WORBES1999, Worbes et al. Reference WORBES, STASCHEL, ROLOFF and JUNK2003). Recent efforts to age tropical trees using radiocarbon dating (14C) have expanded our thinking regarding the longevity of some species. For example, at least two studies (Chambers et al. Reference CHAMBERS, HIGUCHI and SCHIMEL1998, Kurokawa et al. Reference KUROKAWA, YOSHIDA, NAKAMURA, LAI and NAKASHIZUKA2003) have documented individuals at greater than 1000 y (but see Worbes & Junk Reference WORBES and JUNK1999). Still, these extreme ages seem to be more the exception than the rule, and most existing data present a picture of old-growth tropical forests with a relatively low (200–300 y) average tree longevity mixed with low numbers of much older trees (Fichtler et al. Reference FICHTLER, CLARK and WORBES2003, Worbes & Junk Reference WORBES and JUNK1999). This picture contrasts with the relatively high density of large, old trees (c. 27 ha−1) for the montane wet Hawaiian forest studied here. In addition, the single tree with a median age of 643 y BP based on 14C estimates was found in a sample of only 27 trees. It is reasonable to expect that some M. polymorpha in this forest may be as old as 800 y.
Evidence for gap-phase regeneration
The primary prediction of the cyclic succession hypothesis is that the M. polymorpha population comprises similar-aged individuals. The tree size distributions and growth rate data presented here do not support this prediction. Trees of all size classes are abundant at Hakalau and most plots contain trees of a broad range of sizes (Figure 1). While it is likely that some smaller (<30 cm dbh) individuals, especially those in the suppressed category, are indeed similar in age to much larger trees in the canopy, there generally does not appear to be a large enough difference in growth rates to support the idea that smaller trees became established in the same cohort as the larger trees (Figures 3 and 5). For example, the mean growth rate for a 20-cm-dbh co-dominant tree was 1.33 mm y−1, with an estimated age of 128 y (Figure 6; minimum age curve). The mean growth rate for a 60-cm-dbh co-dominant tree was 2.24 mm y−1, with an estimated age of 359 y (Figure 6; minimum age curve). The strong heterogeneity in size structure, size class- and crown class-dependent growth rates, and shade tolerance of saplings supports a gap-phase regeneration model for succession (Brokaw Reference BROKAW1985, Denslow Reference DENSLOW1987) whereby canopy gaps are filled with the growth of previously suppressed or newly colonizing saplings. With an annual mortality rate for large M. polymorpha (> 50 cm dbh) of 1.1% (Hart unpubl. data) and a density of 27 large M. polymorpha trees ha−1, one large M. polymorpha per hectare will fall every 4–5 y, opening up a gap in the canopy that may range between 100–600 m2. In addition, Hart (Reference HART2000) documented that a minimum of 22 large Acacia koa (>70 cm dbh) trees fall over a 5-y period within the 200-ha Hakalau study area. These trees open gaps that are often larger than those produced by M. polymorpha. This process has similarities to the well-described gap dynamics of continental tropical forests in that the current forest shows widespread evidence of gap formation and subsequent recruitment by M. polymorpha. Unlike continental tropical forests however, those individuals that colonize the newly formed gaps are generally not a separate guild of pioneer species. Instead, these new gaps are colonized with the same set of species that are present in the surrounding ‘climax’ forest. Often, the very trees that created the gaps serve as new primary habitat or ‘nurse logs’ for seedling growth. The large old trees that are required to perpetuate gap-phase regeneration in Hawaii are almost exclusively found on relatively young (1000–10,000 y BP), well-drained, nutrient-rich soils found primarily on Hawaii and Maui islands.
Evidence for the cyclic succession model
The gap dynamics described above may occur over relatively small spatial and temporal scales. At larger scales, radiocarbon dating for the 27 trees sampled greater than 40 cm dbh reveals clear evidence for at least two, and possibly three non-overlapping age groups of canopy trees (Figure 7). This supports the primary prediction of the cyclic succession hypothesis for this forest. How can this pattern be explained in light of the evidence presented above for gap-phase regeneration? One conceptual model is that M. polymorpha stands become established as age groups, followed by periods of up to two centuries during which there is little to no recruitment of M. polymorpha (presumably due to the establishment of a dense understorey and mid-canopy layer), and followed again by the death of a portion of the individuals that comprise the upper M. polymorpha canopy through stand-level die-back, opening up simultaneous gaps over large areas and leading to the establishment of the next M. polymorpha age group. This cycle of partial canopy mortality, followed by pulses of high recruitment then long periods of low recruitment may be repeated, leading to a canopy that is comprised of individuals from multiple age groups. In addition, it is quite possible that many of the trees from smaller size classes documented in this study represent a fourth age group that has become established following anthropogenic disturbance which began approximately 150 y BP.
It is well established that M. polymorpha recruitment is near zero in intact native canopies with heavy shade (Burton Reference BURTON1982, Burton & Mueller-Dombois Reference BURTON and MUELLER-DOMBOIS1984). The heaviest shade in Hawaiian forests occurs where there is a mid-canopy layer of tree-ferns (Cibotium sp.) and other small-statured tree species such as Ilex anomala Hook. & Arnott and Cheirodendron trigynum (Gaud.) A. Heller (intact canopies of both M. polymorpha and A.koa are relatively open compared with most tropical forest trees). The mid-canopy tree species appear to establish well beneath M. polymorpha and A. koa canopies, and would be expected to quickly outcompete any establishing M. polymorpha seedlings. Thus, during the periods in which these species formed an intact mid-canopy layer, recruitment of M. polymorpha would be reduced and occur primarily through gap phase regeneration.
The proximate causes of stand-level die-back in Hawaii remain poorly understood, and it is unclear if this process is relevant to explaining the dynamics of old-growth montane wet forests such as the one described here. A number of other factors may contribute to the mortality of a portion of the canopy trees at large time intervals. For example, Baker et al. (Reference BAKER, BUNYAVEJCHEWIN, OLIVER and ASHTON2005) described how periodic, low-intensity disturbance (most likely by fire) in the seasonal dry forests of western Thailand may generate multiple gaps per ha across large landscapes, leading to pulses of recruitment that appear as discrete age-cohorts. In addition to fire, periodic episodes of disease, drought, severe storms and volcanic eruptions (primarily ash fall) may also affect individuals in the canopy unequally. With the exception of the latter (Drake & Mueller-Dombois Reference DRAKE and MUELLER-DOMBOIS1993, Smathers & Mueller-Dombois Reference SMATHERS and MUELLER-DOMBOIS1974), the effects of these disturbances on tree mortality and stand dynamics have not been well documented in Hawaiian wet forests, and represent potentially worthwhile areas for future research.
ACKNOWLEDGEMENTS
I thank L. Freed for valuable advice, ideas and support during the early stages of this study. In addition, many people provided assistance in the field, including J. Bennett, A. Wolcott, S. Judge, K. Turner, K. McClure, S. Brooks, B. Emmett and O. Steele. Both R. Wass and J. Jeffrey at Hakalau Forest National Wildlife Refuge provided permits and, most importantly, access to the study sites. Partial funding was provided by the U.S. Forest Service (Institute for Pacific Island Forestry), a University of Hawaii at Manoa EECB Fellowship, and a UH Hilo REAP Award. This study benefited greatly from informal discussions with J. Jeffrey, P. Baker, C. Giardina, S. Cordell, D. Sandquist, D. Mueller-Dombois, T. Dye, G. Gerrish, K. Brinck and J. Hatfield. In particular, D. Mueller-Dombois, R. Ostertag and S. Cordell provided valuable comments on earlier versions of the manuscript.
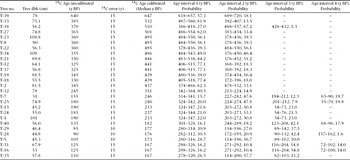
Estimated age of individual Metrosideros polymorpha trees from Hakalau Forest National Wildlife Refuge, Hawaii island. 14C age uncalibrated represents Conventional Radiocarbon Age, where 1950 AD is 0 y BP (Stuiver & Polach Reference STUIVER and POLACH1977). 14C error represents laboratory standard error as reported by the UC Irvine Keck Carbon Cycle AMS Facility. 14C age calibrated is the median sample age reported by the calibration program OXCAL 4.0, where Present = 2009. Age intervals 1–4 represent the range of calibrated ages (where Present = 2009) and associated 95.4% confidence interval probabilities for the match between 14C ages from the samples against the calibration curve. 14C ages intersected the calibration curve between two and four times, depending on the sample. Age interval 1 includes the range of ages that are most likely for the sample based on the dbh-age curve (Figure 6).