I. INTRODUCTION
Organic solar cells are the solar cells based on organic semiconductors as photo-active materials, such as polymers, small molecules, and fullerenes. Since 2000, together with the Nobel Prize in Chemistry awarded jointly to Alan J. Heeger, Alan G. MacDiarmid, and Hideki Shirakawa for the discovery and development of conductive polymers, the field of organic photovoltaics (OPV) has seen an unprecedented growth of interest. Especially the advantages of up-scaling, low cost, light weight, flexibility and solution processability have escalated the research on OPV within the last decade. Reference Wöhrle and Meissner1–Reference Luo, Ren, Zhang, Wu, Choy, He and Cao5
Organic electronic materials are conjugated solids at which the absorption and charge transport are determined by the partially delocalized π and π* orbitals. The photo-active layer of an organic solar cell consists of a donor and an acceptor material. Reference Brabec, Sariciftci and Hummelen3 Photons absorbed by the donor material lead to electron–hole pairs (i.e., Frenkel excitons), which do not spontaneously dissociate into free charge carriers because of the low dielectric constants of these materials. Hence, a strong driving force (i.e., a local electrical field) is needed to dissociate excitons into free charge carriers, which is generally achieved by interfacial electric field originating from the differences in electron affinity and ionization potential between donor and acceptor materials. Reference Nelson6,Reference Koster, Shaheen and Hummelen7 Due to the short excitons diffusion lengths (1–10 nm), exciton diffusion has become one of the biggest limiting steps for photocarrier generation. This encouraged scientists to develop an alternative structure for the photo-active layer, so called, bulk-heterojunction (BHJ). Reference Yu and Heeger8,Reference Halls, Walsh, Greenham, Marseglia, Friend, Moratti and Holmes9
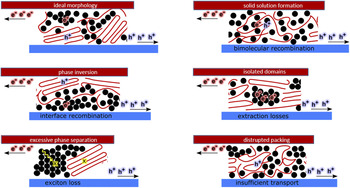
An optimized BHJ is a finely mixed, yet phase separated network (Fig. 1), which ensures the length scales for efficient exciton dissociation and percolated pathways of donor and acceptor for the most efficient charge carrier transport to the respective electrodes. Reference Brabec, Heeney, McCulloch and Nelson10 Two commonly used deposition methods for fabrication of BHJ solar cells are thermal evaporation and solution processing. The power conversion efficiency (PCE) of BHJ solar cells has been rapidly reached up to 13.2% by design of novel materials, device architectures, and precise device optimization. By 2016, Heliatek reported a record efficiency of 13.2% for thermally-evaporated multi-junction solar cells, while Zhao et al. achieved 11.7% PCE for single-junction organic solar cells fabricated from solution. Reference Zhao, Li, Yang, Jiang, Lin, Ade, Ma and Yan11,12 These performances are especially close to the theoretical efficiency of 15% predicted for single-junction organic solar cells with an assumed external quantum efficiency (EQE) of 75% and a fill factor (FF) of 75%. Reference Scharber and Sariciftci13
Possible morphology formations presented for a BHJ active layer. Red lines represent the donor, while black circles represent the acceptor. The ideal morphology is presented at top left corner of the picture, while other sketches represent the non-ideal microstructure formation causing performance losses in organic solar cells, as indicated accordingly.

Although the BHJ concept had a revolutionary effect on the development of OPV, such morphologies are generally nonideal, which is considered as one of the biggest constraints on utilizing the full potential of any BHJ system. Therefore, together the synthesis of better performing materials, the optimization of the photo-active layer microstructure has received the most attention from organic photovoltaic community, especially for the solution-based processing methods. It has become especially important to find the relationship between morphologies in blend structure and photovoltaic performance to be able to establish a general roadmap for solution-process-structure-property-performance relationship.
To characterize the morphology of BHJs, real space, and reciprocal space characterization methods are routinely used. Reference DeLongchamp, Kline and Herzing14,Reference Salleo, Kline, DeLongchamp and Chabinyc15 Most of the microstructure characterization studies were applied ex situ, i.e., after processing. Such studies provided invaluable information on the part of the roadmap mentioned above, mainly the ‘process-structure-property-performance’ part. Current understanding suggests that the microstructure of an optimized BHJ does not consist of sharply defined donor and acceptor phases. Instead, there are three phases within a BHJ layer: donor-rich phase, acceptor-rich phase, and mixed phase. Hence, the performance of a BHJ solar cell depends on the multiscale order, arrangement, and volume fractions of these phases. Reference Yan, Collins, Gann, Wang, Ade and Mcneill16–Reference Ro, Downing, Engmann, Herzing, DeLongchamp, Richter, Mukherjee, Ade, Abdelsamie, Amassian, Jagadamma, Yan and Liu23 These studies additionally show that the morphology of these photo-active layers is very delicate, and it is affected by the solvent choice, drying conditions, and post-treatment methods, such as thermal annealing and solvent vapor annealing. Reference Kouijzer, Michels, Van Den Berg, Gevaerts, Turbiez, Wienk and Janssen24–Reference Giri, Delongchamp, Reinspach, Fischer, Richter, Xu, Benight, Ayzner, He, Fang, Xue, Toney and Bao31 However, these studies confirm that the ‘solution’ side of the roadmap is generally omitted when morphology characterization is conducted with ex situ methods. The need for dynamic, i.e., in situ, measurements has then emerged to gain greater insight into the effect of thermodynamic mechanisms in ink formulations on the drying kinetics, thus microstructure formation, during processing. While such in situ studies permit better understanding on the role of structure in determining device performance, they additionally allow better judgment on the quality of the ink used and its drying behavior under selected conditions. This is especially important for up-scaling of such technologies since ink engineering is one of the key parameters for establishing the most efficient and effective process for up-scaling. Reference Krebs28
The main purpose of this work is to guide the reader through the fundamentals and implementation of X-ray-based and optical characterization methods used in in situ mode and to introduce the reader with a better overview on the information acquired from a given technique in the context of microstructure formation in OPV. Especially the interplay between thermodynamics of solutions (i.e., solubility, miscibility…) and drying kinetics (i.e., solvent evaporation, ordering, phase separation…) of different types of BHJs (polymer:fullerene, small molecule:fullerene, polymer:polymer) is discussed with the help of selected published literature. We hope that this work serves as a motivation for organic photovoltaic community to implement such in situ techniques to develop deeper understanding of solution-process-structure-property-performance relationships for better performing OPV technology.
II. MEASUREMENT METHODS FOR IN SITU STUDIES
A. Reflectometry
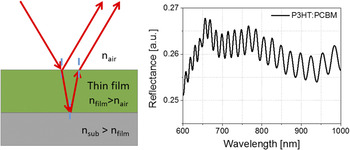
One of the most utilized thin film metrology techniques during BHJ film formation is thin film reflectometry. The thickness of a drying film can be calculated by recording the interference fringe patterns (Fig. 2) in reflection mode with Eqs. (1) and (2) Reference Harrick32 :
 $$2nd\cos \theta = m\lambda \quad ,$$
 $$2nd\cos \theta = \left( {m + {1 \over 2}} \right)\lambda \quad ,$$
where θ is angle of incidence, n is refractive index, d is film thickness, λ is the wave length of light, and m is the order of the fringe. For reflection from a film on a substrate with higher refractive index, Eqs. (1) and (2) represent the locations of maxima and minima, respectively. If the refractive index is known, the film thickness can be calculated easily with this principle. The accuracy of determining the thickness depends on the accuracy of measuring fringe spacing ∆λ. Hence, it is important that the fringes are not distorted by any absorption bands, especially when absorbing films are measured. Additionally, using many fringes (large m) increases the accuracy, which is only possible if the refractive index does not change drastically.
Schematic for thin film interference on substrates with higher refractive indices (left). Exemplary reflectance spectrum of P3HT:PCBM drying from ODCB solution measured with white light reflectometry. Interference fringes are present after the absorption edge of P3HT. Reproduced from Ref. Reference Güldal, Kassar, Berlinghof, Ameri, Osvet, Pacios, Li Destri, Unruh and Brabec49 with permission from RSC.

The calculation of film thickness from white light reflectometry (i.e., spectral reflectometry) varies slightly, especially when the measured layer’s refractive index changes over a certain wave length range where fringes are present. The film thickness from such layers can be determined from two adjacent maxima (or minima) as in Eq. (3) Reference Swanepoel33 :
 $$d = {{{\lambda _1}{\lambda _2}} \over {2\left( {{\lambda _1}{n_2} - {\lambda _2}{n_2}} \right)}}\quad .$$
Although not as accurate as ellipsometry, reflectometry is a powerful tool when the experiments and data processing are handled correctly. Caution must be exercised when reflectometry is utilized for drying of BHJ layers:
-
(i) The interference phenomenon stems from ‘coherence’. The interference fringes vanish when the path length difference between two reflected light waves is greater than the coherence length of the source. Reference Ficek and Swain34 Hence, if a white light source is taken, which has finite coherence length, the wet layer thickness of a freshly coated layer should not exceed few tens of µm. This can be resolved by utilizing a narrow band filter or a monochromatic light source with longer coherence length, for example a laser. Nevertheless, the spectral information would be lost in the case of laser being the light source.
-
(ii) Despite the fact that spectral reflectometry with white light source has limited coherence length, the spectral information can be advantageous for thin film drying experiments. Although it cannot be translated directly, reflection spectrum of a drying BHJ layer on a higher refractive indexed substrate would show the absorption behavior within a certain wave length range depending on the band gap of the materials used. Within the absorption range, interference fringes are either damped or completely lost. Therefore, as mentioned previously, thickness calculations are generally conducted in the transparent range (between absorption edge and 1100 nm), where interference fringes are seen. However, changes in the absorption spectrum during drying affect the optical constants of the layer which translate into reflection spectrum. This allows the user to track the evolution of absorption behavior of the layer.
-
(iii) The calculation based on fringe counting, as explained above, is only possible if the optical constants do not change drastically during drying. This is however hardly the case with a crystallizing layer. Since most of the donor materials used for BHJs are semicrystalline materials, crystallization takes place during drying. Due to the increasing ordering and solvent evaporation, optical constants change massively, Reference Campoy-Quiles, Schmidt, Nassyrov, Pena, Goni, Alonso and Garriga35 hence interference fringes will be damped or even lost. Another mechanism which might affect the interference patterns detrimentally is scattering. If for any reason (e.g., immiscibility) two phases with different optical densities form within a drying layer with sizes in the order of the incident wave length, the main optical process would be scattering. Due to its incoherent nature, Reference Berne and Pecora36 scattering causes interference losses. This additionally causes decay of fringe intensity (lower fringe visibility) toward UV region, since scattering is stronger in UV region than in visible or IR region (Rayleigh scattering). Reference Berne and Pecora36
An alternative to reflection measurements is transmission-based optical measurements. In transmission geometry, the information of the film thickness would be lost. Nevertheless, the absorption behavior during the transition from solution state to solid state can be recorded. Reference Zhao, Hu, Spada, Jagadamma, Yan, Abdelsamie, Yang, Yu, Munir, Li, Ndjawa and Amassian37,Reference Abdelsamie, Zhao, Niazi, Chou and Amassian38
B. Ellipsometry
Ellipsometry in general is a very sensitive measurement technique based on polarized light for characterization of thin films and surfaces. It analyzes the phase and amplitude of reflected polarized light to extract information from the layer. Since the information contains ‘phase’ information, this measurement technique is more sensitive than reflectometry. Reference Woollam39 Some of the common material properties which can be determined by ellipsometry are optical constants, thin film thickness, surface roughness, optical anisotropy, and compositional changes within the measured material/thin film. One of the most used ellipsometry type is variable angle spectroscopic ellipsometry (VASE). The fitting of the data can be conducted more easily if the measured data provide more details for the model parameters which are to be determined or fixed. Hence, spectral measurements and various incidence angles give the measurement technique more flexibility than single-angle and/or single-wavelength ellipsometers.
Spectroscopic ellipsometry (SE) measures the response of the material as a function of the angular frequency ω. The determined properties are the refractive index n(ω) and dielectric function ε(ω). In absorbing materials like BHJ layers, the dielectric function and the refractive index are complex [Eqs. (4) and (5)] Reference Losurdo and Hingerl40 :
 $$\tilde n(\omega ) = n(\omega ) + {\rm{i}}k(\omega )\quad .$$
 $$\tilde \varepsilon (\omega ) = {\varepsilon _1}(\omega ) + {\rm{i}}{\varepsilon _2}(\omega )\quad .$$
The imaginary part of the equations is proportional to energy dissipation (absorption of the light). The real and imaginary part of the dielectric function can be directly calculated from the refractive index (n) and extinction coefficient (k) [Eqs. (6) and (7)] Reference Losurdo and Hingerl40 :
 $${\varepsilon _1} = {n^2} - {k^2}\quad .$$
 $${\varepsilon _2} = 2nk\quad .$$
In the case of the reflection of a light beam from a planar interface between two optically isotropic media, the ratio of p- and s-polarized Fresnel reflection coefficients (i.e., complex reflection ratio) is the quantity measured by SE with the help of ellipsometric angles Ψ and Δ [Eq. (8)] Reference Tompkins and Irene41 :
 $$\tilde \rho = {{{{\tilde r}_p}} \over {{{\tilde r}_s}}} = \tan \psi {e^{i\Delta }}\quad .$$
Fresnel coefficients provide a connection between the measured Ψ and Δ with intrinsic sample properties like dielectric function. Originally these coefficients stem from the boundary conditions defined by the Maxwell equations, which lead to Fresnel equations. Reference Losurdo and Hingerl40 At the end, a dielectric function is derived by using the measured parameters and Fresnel coefficients [Eq. (9)] Reference Losurdo and Hingerl40 :
 $$\varepsilon = {\sin ^2}\phi \left( {1 + {{\tan }^2}\phi {{\left( {{{1 - \rho } \over {1 + \rho }}} \right)}^2}} \right)\quad .$$
Quantitative data for the measured samples can be derived by theoretical models to fit the real and imaginary parts of the dielectric function. Two of the models used for transparent films are Cauchy and Sellmeier models. One of the restrictions of Cauchy model is its Kramers–Kroening inconsistency. Hence, compared to Sellmeier which is Kramers–Kroening consistent, the Cauchy model can lead to unphysical optical dispersions. Reference Tompkins and Irene41 Nevertheless, both models provide good approximations for transparent films or absorbing films in transparent range. Absorbing films in the absorption range, on the other hand, must account for real and imaginary parts, as explained previously. For this purpose, many dispersion relationships use oscillator theories. Some of the most common oscillators are Lorentz, Harmonic, and Gaussian oscillators. Since they are all Kramers–Kroening consistent, the modeled imaginary part is used to define the real component. More information on the theory and explanation of these oscillators and their more advanced versions (e.g., Tauc-Lorentz) can be found elsewhere. Reference Tompkins and Irene41
SE can be operated in in situ mode, which enables direct observation of BHJ drying. Including to the notes mentioned earlier for reflectometry measurements, we must add few more comments on the application of SE for drying BHJ layers:
-
(i) Theoretically, all optical models (especially Fresnel) for SE considers planar interface, as explained previously. However, a drying layer hardly provides such interface due to the dynamic motion within the film caused by solvent evaporation. Therefore, it is extremely challenging to model such ellipsometry (also reflectometry) data since all the provided models are insufficient. It is not unlikely that the intensity of the fringes is not matched with the model selected. Hence, it should always be kept in mind that the calculated SE data (or reflectometry data) for drying layers might have greater error range than usual.
-
(ii) Ellipsometry signal can actually provide much more information on the drying behavior of a BHJ thin film than just its intrinsic properties or thickness. One of the most common signal behaviors is the beating effect. It is a phenomenon which occurs when two or more signals with different frequencies are combined. Reference Weik42 It is not unlikely that a drying layer would go through a vertical segregation. Such vertical phase separation creates another interface within the film, which reflects the light differently than the bulk due to different optical properties. Hence, two (or more) light waves with different frequencies induce a beat in the interference pattern, which can then be modeled accordingly. Although, this phenomenon has not been reported for drying BHJ layers so far, we believe that ellipsometry signal can be examined more thoroughly, and such effects can provide greater insight into the dynamics of BHJ drying.
-
(iii) An inhomogeneous medium composed of different materials in structured manner must take into account the collective behavior of the particles within a medium and their effect on each other. Hence, such media can be modeled with effective medium approximation (EMA). Reference Hinrichs and Eichhorn43 A layer or an interface can be defined as an effective material if the particles within the medium are smaller than the incident wave length, and if the particles are randomly distributed. Widely used is Bruggeman theory, which is a good approximation for rough surface or interfaces and for randomly disturbed particles. Reference Hinrichs and Eichhorn43 The idea behind EMA concept is to connect macroscopic permittivity of the medium as whole with the microscopic polarizabilities of the constituents. Hence, it is a relatively good approximation for drying BHJ films and swollen BHJ layers (e.g., during solvent annealing).
C. Photoluminescence
Although photoluminescence (PL) measurements are generally easy to conduct in in situ mode, the processing of in situ data can become very challenging. To be able to utilize PL measurements in in situ mode for BHJ film drying, luminescence theory of organic compounds and relevant quenching mechanisms should be understood well.
Luminescence in general is a phenomenon of light emission from any substance from excited electronic states. Reference Lakowicz44 In quantum mechanics, electronic states with spin 0 and 1 are called singlet and triplet states, respectively. Two types of luminescence can be explained very briefly with the spin selection rules Reference Mikhnenko45 : (i) fluorescence is the emission from excited singlet states, where the electron is paired with ground state in opposite spin. Hence, the return to ground state is spin allowed, and it usually occurs within few nanoseconds. Reference Lakowicz44,Reference Mikhnenko45 (ii) Phosphorescence is the emission from excited triplet states, where the electron has the same spin direction as the ground state. Since the decay from an excited triplet state involves a spin flip, it is spin forbidden; hence the emission lifetimes can take up to seconds. Reference Lakowicz44,Reference Köhler and Bässler46,Reference Yersin and Finkenzeller47
In an organic compound (small molecule or polymer), these transitions between electronic states occur between highest occupied molecular orbital (HOMO) and lowest unoccupied molecular orbital (LUMO). Although there are several ways to excite an electron from HOMO to LUMO (such as electrical current, chemical reaction…), photoexcitation is one of the most common methods, hence luminescence upon photon absorption inherits the term PL. Phosphorescence is generally very weak in organic compounds due to the selection rules explained previously. Additionally, in order for the triplet excitons to be generated, photoexcitation alone is not sufficient. Thus, spin–orbit coupling is necessary for intersystem crossing from singlet to triplet state and radiative and nonradiative transitions from triplet to ground state. Reference Mikhnenko45,Reference Yersin and Finkenzeller47 With all the lightweight atoms organic compounds have, they show only weak spin–orbit coupling. Reference Lakowicz44 For more visible phosphorescence, organic compounds are combined with transition metals, which are triplet emitters, forming organo-transition metal complexes [e.g., Ir(ppy)3]. Reference Yersin and Finkenzeller47 It should be noted that, BHJs are organic molecules without any transition metals, hence the term ‘PL’ is used in this review to indicate fluorescence emission.
PL quenching is a phenomenon of reduction in PL intensity of a compound due to a certain mechanism. There are several PL quenching mechanisms for fluorescent conjugated systems: intra-chain defects, impurities/dopants, photochemical oxidation, concentration quenching, aggregation quenching leading to interchain species (e.g., excimers, exciplexes, polaron pairs), as well as an efficient photo-induced charge transfer to a quencher (e.g., fullerene or nonfullerene acceptors). The observed PL quenching in a material system is generally a result of few mechanisms occurring simultaneously. Since drying of BHJ systems is a transition from solution to solid state, some of these mechanisms would dominate the quenching process:
-
(i) Concentration quenching: in theory and practice, it was shown that PL decay kinetics is a function of concentration. Reference Lakowicz44,Reference Nguyen, Martini, Liu and Schwartz48 At sufficiently diluted concentrations, the molecules (or polymer chains) do not ‘see’ each other, and the PL signal remains constant during the drying. Reference Güldal, Kassar, Berlinghof, Ameri, Osvet, Pacios, Li Destri, Unruh and Brabec49 Additionally, other quenching mechanisms (impurities/dopants, existence of a second compound acting as a quencher and photochemical oxidation) are also concentration dependent. This concentration dependency can be explained by the Stern–Volmer theory: it is suggested that two of the most common quenching types are dynamic and static quenching. Both quenching types require molecular contact between the fluorophore and quencher. While dynamic quenching [Eq. (10)] Reference Lakowicz44 requires the quencher to be diffused to the fluorophore within the excited state lifetime, static quenching [Eq. (11)] Reference Lakowicz44 is a nonradiative relaxation of a ground state complex formed by fluorophore and quencher:
 $${{{I_0}} \over I} = 1 + {k_{\rm{q}}}{\tau _0}\left[ Q \right]\quad ,$$
 $${{{I_0}} \over I} = 1 + {k_{\rm{S}}}\left[ Q \right]\quad ,$$
where I 0 is the PL intensity without any quencher, I is the PL intensity with quencher, [Q] is the quencher concentration, k q is the bimolecular quenching constant, τ0 is the PL lifetime with the absence of quencher, and K S is the association constant. The bimolecular quenching constant in Eq. (10) can be related to bimolecular rate constant, k 0, and quenching efficiency, f Q. The bimolecular rate constant, additionally is a function of diffusion coefficients, D, and sphere radii, R, of fluorophore and quencher:
 $${k_0} = \left( {{R_{\rm{f}}} + {R_{\rm{q}}}} \right)\left( {{D_{\rm{f}}} + {D_{\rm{q}}}} \right)\quad .$$
 $${k_{\rm{q}}} = {k_0}{f_{\rm{Q}}}\quad .$$
The collision frequency Z of a fluorophore can then be defined as the function of bimolecular rate constant and the concentration of the quencher:
 $$Z = {k_0}\left[ Q \right]\quad .$$
Concentration quenching in general is a mechanism which is observed at every quencher concentration. However, the relation between concentration [Q], diffusion D, collusion frequency Z, and bimolecular quenching constant k q presented above is established for sufficiently dilute solutions where free diffusion of molecules is possible. Reference Lakowicz44 This condition is generally not fulfilled when a random BHJ solution prepared specifically for solar cell processing is taken for drying experiments with PL due to high concentration. Therefore, it should be noted that the calculation of sphere radii (also called: sphere of action) becomes cumbersome at high concentrations since PL signal (I) would not be dominated only by one quencher type but by many quenchers, including the self-quenching mechanisms of the fluorophore.
-
(ii) Aggregation quenching: PL quenching occurs additionally by the effect of polymer chain aggregation which leads to high quantum yield of interchain species which tends to relax nonradiatively. Reference Wang, Collison and Rothberg50 This is a well-known self-quenching mechanism of the fluorophore, which is a function of fluorophore concentration. Therefore, during BHJ drying, while the increase in the acceptor concentration induces concentration quenching, the increase in donor concentration would additionally trigger aggregation quenching.
If PL measurements are conducted correctly, aggregation and concentration quenching are the dominant quenching mechanisms for BHJ drying experiments. Care must be taken that the oxidation and laser-induced degradation of the organic molecules do not take place during the PL measurements. This ensures that the recorded PL signal is a direct translation of the molecular self-assembly of the donor and acceptor materials during drying. Although PL does not provide any quantitative result, it is an invaluable measurement method for in situ drying experiments for BHJs, Reference Güldal, Kassar, Berlinghof, Ameri, Osvet, Pacios, Li Destri, Unruh and Brabec49,Reference Engmann, Bokel, Ro, Delongchamp and Richter51 since it is the only measurement method which is very sensitive to the thermodynamic properties of the solution and its components (solubility, miscibility…).
D. Light scattering
Light scattering is the direction and intensity alteration of a light beam upon striking an object due to the combined effects of reflection, refraction, and diffraction. Reference Diebold52 More specifically, scattering occurs when the electron cloud of the material re-emits the energy of the light beam (photon by photon) without altering it otherwise. In other words, due to the polarizability of the molecule, the oscillating dipole emits the electromagnetic wave of the same wave length as the incident wave. Hence, it is called elastic scattering. Reference Schaertl53
The intensity of scattered light is a function of wave length, particle size, scattering angle, and the relative refractive index of the particles and the medium in which the particles exist. Light scattering is only observable when there is a difference in the refractive indices between the particles and the medium. Reference Diebold52 If this condition is fulfilled, the scattering phenomenon is determined to a great extent by the size of the particle with respect to the wave length. For the particle sizes comparable or larger than the wave length, Mie theory has been developed. The general Mie theory applies to the scattering of monochromatic light by isotropic spherical particles. For particles smaller than λ/20, Rayleigh theory has been developed. Reference Schaertl53 For visible light range, the particle size must be then between 20 and 40 nm, which is mostly violated by solutions containing polymers with good or theta solvents. For large particles, the light can scatter from different parts of the particle. Hence, this might lead to constructive and destructive interferences. These interferences are scattering angle dependent, and they must be corrected by so-called particle form factor. Reference Teraoka54 This correction leads to Zimm equation:
 $${{Kc} \over {{R_\theta }}} = \left( {{1 \over {{M_{\rm{W}}}}} + 2{A_2}c} \right)\left( {1 + {{16{\pi ^2}} \over {3{\lambda ^2}}}{{\left\langle {{s^2}} \right\rangle }_W}{{\sin }^2}{\theta \over 2}} \right)\quad ,$$
where K is the contrast factor, R θ is the absolute scattered intensity (also called Rayleigh ratio), M W is the molecular weight, A 2 is the second virial coefficient which is a quantitative measure for solvent–solute interactions (originating from van’t Hoff law), Reference Teraoka54 c is the mass concentration, θ is the scattering angle, and 〈s 2〉 is the radius of gyration. When the Rayleigh theory is corrected for large particles, particle size must be smaller than λ/2, instead of λ/20. Reference Schaertl53 Therefore, within the visible range polymer coils or any other scattering substance should be in the range of 200 and 400 nm.
Light scattering has been used widely for the drying experiments of BHJ layers. Reference Güldal, Kassar, Berlinghof, Ameri, Osvet, Pacios, Li Destri, Unruh and Brabec49,Reference van Franeker, Turbiez, Li, Wienk and Janssen55 Due to the measurements being conducted at a single scattering angle, calculations for second virial coefficient and radius of gyration are not possible. However, since light scattering originates from refractive index differences, a type of a phase separation between donor and acceptor, which leads to structures with sizes in the order of the wave length, would induce scattering. Therefore, the light scattering signal during drying generally allows the operator to track the course of phase separation within the wet film.
E. GIWAXS/GISAXS
Grazing incidence small-angle and wide-angle X-ray scattering GISAXS/GIWAXS have become major techniques for the characterization of thin films and nanostructures. Reference Renaud, Lazzari and Leroy56 They can be used for any kind of sample environment providing high depth sensitivity and statistical averaging as opposed to imaging techniques. GISAXS and GIWAXS have already provided an insight into complex multilength-scale structures in BHJ thin films. Reference Chen, Nikiforov and Darling57,Reference Liu, Gu, Shen, Ferdous, Wang and Russell58 By the means of these well-established techniques, structure formation on the nano- and microscale of BHJ thin films can be investigated and analyzed dynamically.
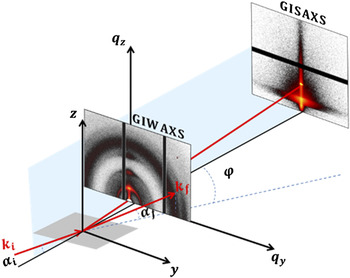
The incident beam in grazing-incident scattering geometry hits the sample surface under very shallow angle, i.e., αi < 0.5°. Figure 3 shows a schematic drawing of the scattering geometry for GISAXS/GIWAXS with the incident wavevector k i in the xz plane, the incident and exit angles (αi and αf) and the in-plane angle φ (or 2θf) of the scattered wavevector k f projected on the sample plane. The absence of scattering features results in pure specular scattering, which fulfills the law of optics αi = αf. Reference Born and Wolf59 The presence of scatterers gives rise to diffuse scattering and diffraction peaks, which carry the desired information about the morphology of the probed film. The scattering intensity, I(q), is measured as a function of the wavevector transfer |q| = |k f − k i| = 4π/λ × sin(θ), with λ being the wave length of the incident X-ray beam, and 2θ being the angle between incoming and outgoing wavevectors. The angular coordinates are related to the wavevector transfer coordinates according to Eq. (16):
 $$\matrix{ {{q_x} = {k_0}\left[ {\cos \varphi \cos {\alpha _{\rm{f}}} - \cos {\alpha _{\rm{i}}}} \right]} \cr {{q_y} = {k_0}\left[ {\sin \varphi \cos {\alpha _{\rm{f}}}} \right]} \cr {{q_z} = {k_0}\left[ {\sin {\alpha _{\rm{f}}} + \sin {\alpha _{\rm{i}}}} \right]} \cr {{k_0} = \left| {{k_{\rm{i}}}} \right| = \left| {{k_{\rm{f}}}} \right| = {{2\pi } \mathord{\left/ {\vphantom {{2\pi } \lambda }} \right. \kern-\nulldelimiterspace} \lambda }\quad .} \cr}$$
Schematic picture of the geometry of grazing incidence small/wide angle X-ray scattering (GISAXS/GIWAXS) measurements. The scattered signal is collected using a 2D detector.

The scattering signal obtained from thin films by standard diffraction techniques in transmission geometry is very poor due to the small scattering volume. For organic thin films, it is even worse because X-ray scattering cross-section of organic materials is small. However, thin films can be probed with sufficient statistics due to the footprint effect of the grazing incidence conditions. Although the footprint can be confined with microfocusing X-ray optics,
Reference Giri, Li, Smilgies, Li, Diao, Lenn, Chiu, Lin, Allen, Reinspach, Mannsfeld, Thoroddsen, Clancy, Bao and Amassian60,Reference Smilgies, Li, Giri, Chou, Diao, Bao and Amassian61
the sampled region is generally in a macroscopic size and thereby produces averaged information. Since the incidence angle is small, it is necessary to consider the effects of refraction and reflection at the interfaces.
Reference Sinha, Sirota, Garoff and Stanley62–Reference Yoneda64
The scattering depth is strongly affected by refraction when αi is close to the critical angle for total external reflection of the surface
 ${\alpha _{\rm{c}}} = \sqrt {2 \times {\mathop{\rm Re}\nolimits} (1 - n)} \propto \sqrt \rho$
, with n being X-ray refractive index of the material and ρ being the electron density. When αi ≪ αc, the scattering depth is limited to few nanometers. It rapidly increases to hundreds of nanometers or even few micrometers when αi is larger than αc.
Reference Renaud, Lazzari and Leroy56
Therefore, grazing incidence is used to minimize the undesired background and bulk scattering and to enhance the near-surface scattering. The scattering volume depends on the footprint of the beam on the sample and on the penetration depth. An interference phenomenon between the incident and transmitted X-ray beam occurs when αi,f = αc, resulting in so-called ‘wave guiding enhancement’ of the scattering intensity,
Reference Jiang, Lee, Narayanan, Wang and Sinha65
and the maximum of the diffuse scattering called Yoneda peak.
Reference Yoneda64
The scattering pattern is usually acquired using a 2D detector. Depending on the distance from the sample to the detector, different ranges of q ranges can be probed, and the related experiments can be typically referred as GIWAXS or GISAXS. GIWAXS, also called GIXD for grazing incidence X-ray diffraction, is usually used to probe crystalline structures on the atomic length scale, e.g., the orientation of crystallites, an estimation of crystallite sizes, and the degree of crystallinity. Reference Wu, Jeng, Su, Wei, Su, Chiu, Chen, Su, Su and Su66–Reference Roehling, Baran, Sit, Kassar, Ameri, Unruh, Brabec and Moulé68 GISAXS, on the other hand, probes length scales up to several hundred nanometers. Reference Hexemer and Müller Buschbaum69 In GIWAXS measurements, the incidence angle lies between the critical angles of the film, and a substrate is often selected to obtain information about the crystalline structures in the entire film as well as weak background from the substrate. Bragg peaks appear along the out-of-plane and in-plane directions in the case of a film with an orientation of the lattice planes (or crystals) parallel and perpendicular to the substrate surface, respectively. Usually an arc is observed when the film has an angular distribution of the orientation of crystals.
The positions of peaks for organic conjugated molecules characteristic to the lamellar stacking can be used to determine whether the crystallites are preferentially face-on or edge-on oriented with respect to the substrate. 1D line cut profiles in the out-of-plane direction and in-plane direction are used to obtain peak position and peak width. Peak positions are used to determine the lattice parameters. Full-width-half-maximum (FWHM) of the peak can be utilized to calculate the crystalline correlation length (CCL) via the Scherrer equation if the resolution of the apparatus is accurately accounted for. Reference Smilgies70 The para-crystalline nature of the conjugated polymers contributes to the broadening of Bragg peaks; hence higher order Bragg peaks need to be used in the analysis. Reference Rivnay, Mannsfeld, Miller, Salleo and Toney71 The relative degree of crystallinity (rDoC) can also be calculated. Reference Boudouris, Ho, Jimison, Toney, Salleo and Segalman72,Reference Gomez, Barteau, Wang, Toney and Loo73 Due to the grazing incidence geometry and ill-defined X-ray absorption, it is still hard to obtain the absolute crystallinity from GIWAXS. Reference Liu, Gu, Shen, Ferdous, Wang and Russell58
GISAXS probes larger length scales, e.g., fullerene aggregates, and provides morphological information such as phase sizes, structural length scales, and intermixing ratios of the components. If the incident angle is above the critical angle of all involved materials, the specular and the Yoneda peak are well separated along the z-axis of the detector allowing for resolving large scale structures. Reference Müller-Buschbaum, Gomez, Nogales, Garcia-Gutierrez and Ezquerra74 To enhance the GISAXS signal and reduce air scattering background, an evacuated flight path is used. The probed depth can be varied by tuning the incident angle; hence the surface-near structures can be separated from the structure in the bulk film. Horizontal line cuts of the 2D GISAXS data are performed at the film’s Yoneda peak to enhance the sensitivity to its structures. Reference Müller Buschbaum75 They can be fitted by a model of polydisperse spheres with a Schultz size distribution to account for the polydispersity, a structure factor of hard spheres and Debye–Buche correlation function to account for the increase in intensity at very low q y values. Reference Wu, Jeng, Su, Wei, Su, Chiu, Chen, Su, Su and Su66 However, this analysis model is adapted from transmission scattering experiments using Born approximation (BA) which is only valid when αi and αf are larger than ∼3αc. The distorted wave born approximation (DWBA) is more suitable at lower angles as it accounts for the contribution of different single scattering processes arising from perturbations of the incident, reflected, and refracted wavefields by the nanostructures. Reference Sinha, Sirota, Garoff and Stanley62,Reference Rauscher, Salditt and Spohn63 The form factor and the shape of nanoparticles can be extracted by modeling the full 2D GISAXS pattern in the framework of the DWBA Reference Renaud, Lazzari and Leroy56 by several software packages: IsGISAXS, Reference Lazzari76 FitGISAXS, Reference Babonneau77 and BornAgain. 78
It should be taken care that the incident X-rays do not damage the organic molecules, since they are vulnerable against high intensity irradiation (i.e., hard X-rays). Additionally, care must be taken when BHJ system contains chlorinated solvents. Due to X-ray absorption of the solvent, the probing depth reduces to few hundreds of nanometers. Nevertheless, kinetic investigations making use of time-resolved GISAXS/GIWAXS measurements help toward a better understanding of the processes taking place during the formation of BHJ thin films upon drying. Reference Kassar, Güldal, Berlinghof, Ameri, Kratzer, Schroeder, Destri, Hirsch, Heeney, McCulloch, Brabec and Unruh79
III. MICROSTRUCTURE FORMATION OF POLYMER:POLYMER BLENDS
Research in the field of morphology formation of polymer blends has developed strongly since the mid-1990s. Since immiscible polymer blends were in great interest not only for photovoltaics but also for transistors and light-emitting diodes, the dynamics of phase separation has been studied in great detail with both ex situ and in situ methods. Reference Halls, Walsh, Greenham, Marseglia, Friend, Moratti and Holmes9,Reference Moons80,Reference Granstrom, Petritsch, Arias, Lux, Andersson and Friend81
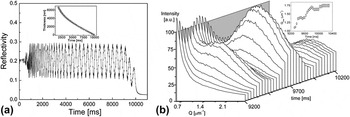
One of the very first in situ film formation studies was conducted by Jukes et al. by utilizing specular reflectometry (RF) and off-specular small-angle light scattering (SLS) simultaneously on a spin coated drying blend of poly(9,9′-dioctylfluorene-co-benzothiadiazole) (F8BT) and poly(9,9′dioctylfluorene-co-bis-N,N′-(4-butylphenyl)-bis-N,N′-phenyl-1,4-phenylenediamine) (PFB). Reference Jukes, Heriot, Sharp and Jones82 As PFB being the electron donor and F8BT electron acceptor, these conjugated polymers were of interest for application in blend-based diodes for a very long time. Reference Moons80,Reference McNeill and Greenham83 Since spin coating is the most common coating method for processing, PFB:F8BT blends were spin coated on a substrate and measured with RF and SLS during drying. The motivation was to track the thinning behavior of the layer via RF and the lateral phase separation by SLS because of optimal phase separation being the cause of more efficient devices. Reference Moons80 The calculation of layer thickness was conducted based on interference theory, as constructive and destructive interferences were observed [Fig. 4(a)]. The refractive index changes were assumed having linear behavior from solution state to the solid state. The SLS profile shows the averaged scattering data over peak wavevector Q max with respect to drying time [Fig. 4(b)]. The moment, at which the scattering was first observed, was taken as the onset of lateral phase separation. The formation of phase separation was discussed in terms of two mechanisms: (i) unstable growth due to composition fluctuations (e.g., spinodal decomposition) and (ii) surface energy differences between two polymers leading to interfacial instabilities during drying. The authors suggest that the second mechanism as the most likely here, due to the shrinking size of the phase-separated domains from 5.7 µm to 3.6 µm calculated from Q max, proving the secondary phase separation taking place within the larger domains formed by the instabilities. Reference Jukes, Heriot, Sharp and Jones82
(a) Specular reflectivity of F8BT:PFB blend with constructive and destructive interferences. The inset shows the drying curve calculated from this data. (b) In situ light scattering data, plotted over time and wavevector Q. The inset shows the peak wavevector behavior over time. Reproduced from Ref. Reference Jukes, Heriot, Sharp and Jones82 with permission from ACS.

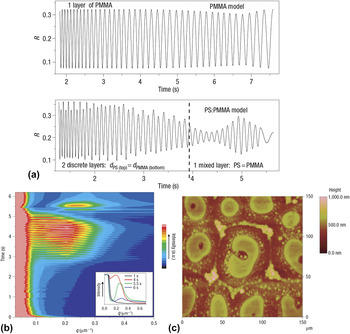
A complementary but more detailed work from the same group was presented shortly after on the blend of polystyrene (PS) and polymethylmethacrylate (PMMA). Reference Heriot and Jones84 A very similar drying and phase separation behavior was observed here as well. However, to be able to distinguish between the bulk spinodal decomposition and lateral interfacial instability, a more detailed analysis of the reflectometry data was conducted. As we mentioned in Sec. II, in situ reflectometry measurements can be extremely powerful if fringe visibility and fringe modulations are analyzed in detail. The periodicity of the modulations, which can be modeled, and the fringe visibility of a reflectometry data can be interpreted to indicate several phenomena during drying, such as roughening of the film, formation of a lateral interface or skin formation. By deeply analyzing the reflectometry data and supporting the SLS data of PS:PMMA layers [Figs. 5(a) and 5(b)], it has been concluded that the immiscible polymer:polymer blends first adapt a two layer formation with different compositions, and then the surface tension between these two layers become unstable, leading to lateral phase-separated domains [Fig. 5(c)]. Reference Heriot and Jones84 It should be noted that although reflectometry (and ellipsometry) has been utilized in many in situ studies, this study was the first and unfortunately the last in situ study relevant for organic blends, at which a reflectometry data has been analyzed in such detail.
(a) Models used to replicate pristine PMMA layer and PS:PMMA layer dryings. For pristine layer, PMMA is modeled alone. For PS:PMMA, until 3.9 s, the model was established with 2 discrete layers on top of each other. After 3.9 s, the model was switched to 1 mixed layer. (b) Light scattering data of PS:PMMA. The inset shows some snapshots of the profiles. (c) Atomic force microscopy of the dried film of PS:PMMA. Reproduced from Ref. Reference Heriot and Jones84 with permission from Nature Publishing Group.

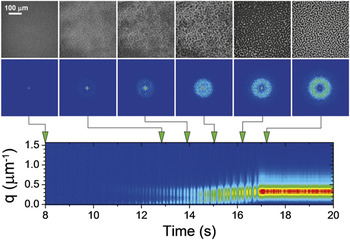
Ebbens and co-workers introduced an alternative stroboscopic imaging method in 2011 to track micrometer-scale lateral and vertical phase separation in polymer–polymer blends relevant for photovoltaic applications. Reference Ebbens, Hodgkinson, Parnell, Dunbar, Martin, Topham, Clarke and Howse85 Spin coated polystyrene:polyisoprene samples were imaged with short LED pulses and a CCD camera, and interferometric height reconstruction has been conducted, where constructive and destructive interferences led to contrast in the images. Together with the FFT analysis of the raw optical images, it has been concluded that the phase separation of PS:PI blends starts from the film surface and propagates toward the underlying regions of the film during drying (Fig. 6). As the fine details of the phase-separated morphology appeared at the last seconds of the drying, the phase separation mechanism was caused mainly by a straightforward spinodal decomposition process. Especially for visualizing dynamics of micrometer-scale phase separation, this method provides invaluable high-resolution images, which could be applicable not only for spin coating but also other coating methods, such as roll-to-roll coating or doctor blading.
Unprocessed stroboscopic optical reflectance images recorded during spin coating of PS:PI blend from o-xylene are shown on top. The corrected 2D Fourier transformed images are shown below each frame. The integrated Fourier transform for the entire drying process is shown at the bottom. Reproduced from Ref. Reference Ebbens, Hodgkinson, Parnell, Dunbar, Martin, Topham, Clarke and Howse85 with permission from ACS.

In the last decade, instead of polymer:polymer blends, research on polymer:fullerene BHJs has been increasing rapidly, mainly due to the lack of efficient polymer acceptors, which can replace fullerene-based acceptors. However, there is a growing interest to replace fullerene acceptors with polymers to lower costs, to broaden absorption spectrum and to improve mechanical and thermal stability of the devices. Reference Gu, Yan, Kurosawa, Schroeder, Gu, Zhou, To, Oosterhout, Savikhin, Molina-lopez, Tassone, Mannsfeld, Wang, Toney and Bao86,Reference Holliday, Ashraf, Wadsworth, Baran, Yousaf, Nielsen, Tan, Dimitrov, Shang, Gasparini, Alamoudi, Laquai, Brabec, Salleo, Durrant and McCulloch87 Some of the most promising polymer acceptors are: naphthalene diimide thiophene-based acceptors, Reference Gu, Yan, Kurosawa, Schroeder, Gu, Zhou, To, Oosterhout, Savikhin, Molina-lopez, Tassone, Mannsfeld, Wang, Toney and Bao86,Reference Earmme, Hwang, Murari, Subramaniyan and Jenekhe88,Reference Gao, Zhang, Xue, Min, Zhang, Wei and Li89 perylene diimide-based acceptors, Reference Li, Zhang, Zhao, Ye, Yao, Yang, Zhang and Hou90 and indacenodithiophene-based acceptors. Reference Holliday, Ashraf, Wadsworth, Baran, Yousaf, Nielsen, Tan, Dimitrov, Shang, Gasparini, Alamoudi, Laquai, Brabec, Salleo, Durrant and McCulloch87 Although these polymer acceptors present almost comparable efficiencies in OSCs like fullerene acceptors, one of the biggest challenges to overcome for better all-polymer solar cells is the unfavorable phase separation which causes low current density values. Reference Gu, Yan, Kurosawa, Schroeder, Gu, Zhou, To, Oosterhout, Savikhin, Molina-lopez, Tassone, Mannsfeld, Wang, Toney and Bao86
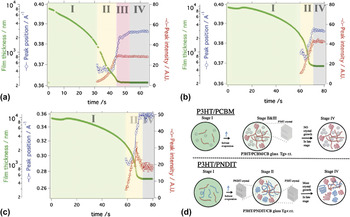
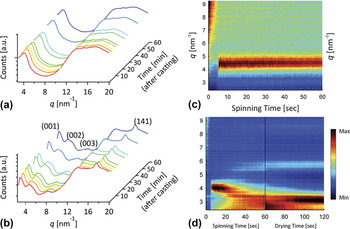
To be able to understand the mechanism behind phase separation in all-polymer BHJs and to compare it with the mechanism in polymer:fullerene BHJs, Bao and coworkers examined the film formation of two systems: (i) poly(3-hexylthiophene-2,5-diyl) (P3HT) with [6,6]-phenyl-C61-butyric acid methyl ester (PCBM) and (ii) P3HT with naphthalene diimide thiophene-based acceptor (PNDIT). Reference Gu, Yan, Kurosawa, Schroeder, Gu, Zhou, To, Oosterhout, Savikhin, Molina-lopez, Tassone, Mannsfeld, Wang, Toney and Bao86 Chlorobenzene-based solutions were doctor bladed on Si wafers at 35 °C, and the microstructure formation has been observed with GIXD and optical reflectometry. As presented in Fig. 7, drying for both films has started with well dissolved solutions. Supersaturation via solvent evaporation initiates nucleation and crystal formation of one of the components, which crosses the solubility limit first. For P3HT:PCBM, the high glass temperature (T g) of PCBM increases the overall T g of the polymer:fullerene:solvent glass during the drying, hence further P3HT crystallization is hindered. This causes small phase separation between P3HT and PCBM. On the other hand, PNDIT has low T g, hence the T g of the polymer:polymer mixed region is also lowered, which leads to further crystallization of both components increasing the degree of phase separation. This work is for now the only in situ morphology formation study on polymer:polymer BHJ systems. For future development of such systems, more research on the mechanisms of crystallization and phase separation are required, especially with the development of novel polymers with tunable crystallization behavior.
Evolution of P3HT [100] diffraction peak from (a) from P3HT:PCBM and (b) from P3HT:PNDIT solutions. (c) Evolution of PNDIT [100] diffraction peak from P3HT:PNDIT solution. (d) Drying process of P3HT:PCBM and P3HT:PNDIT represented schematically. Stage I: dissolved state, Stage II: nucleation and growth, Stage III: solvent swollen glass state, Stage IV: glassy state. Reproduced from Ref. Reference Gu, Yan, Kurosawa, Schroeder, Gu, Zhou, To, Oosterhout, Savikhin, Molina-lopez, Tassone, Mannsfeld, Wang, Toney and Bao86 with permission from Wiley VCH.

IV. MICROSTRUCTURE FORMATION OF POLYMER:FULLERENE BLENDS
Since precise morphology control is a key to improve organic solar cell performance, in situ characterization methods have gained great interest from the OSC community, especially for the polymer:fullerene blends. The motivation of understanding the interactions between polymer and fullerene with the solvent and connecting this information with drying conditions and morphology have encouraged researchers to implement such experiments. Since P3HT:PCBM was one of the best performing blend mixtures for a long time, it has been studied very extensively, especially with in situ measurement methods.
A. Development of in situ measurement methods with P3HT:PCBM
The very first in situ study on morphology formation during drying was introduced by Schmidt-Hansberg and coworkers in 2009. Reference Schmidt-Hansberg, Klein, Peters, Buss, Pfeifer, Walheim, Colsmann, Lemmer, Scharfer and Schabel91 They have investigated P3HT:PCBM layers from ortho-dichlorobenzene (ODCB) solution, coated from doctor blade under different drying temperatures (15, 25, and 40 °C). Optical reflectometry was utilized with interference theory. The measured drying curves were additionally modeled by self-developed model based on vapor–liquid equilibria and mass transfer theories. Reference Schmidt-Hansberg, Klein, Peters, Buss, Pfeifer, Walheim, Colsmann, Lemmer, Scharfer and Schabel91 Although it has been stated that the drying has shown a constant rate drying with a following falling rate period, it is a very limited information on the governing thermodynamic and kinetic processes during drying. To gain a full mechanistic understanding of microstructure formation, it is necessary to couple few measurement methods.
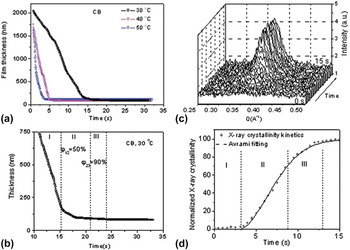
Wang and coworkers addressed this issue by utilizing ellipsometry and GIXD simultaneously in 2010. Reference Wang, Dunbar, Staniec, Pearson, Hopkinson, MacDonald, Lilliu, Pizzey, Terrill, Donald, Ryan, Jones and Lidzey92 P3HT:PCBM films from chlorobenzene (CB) were doctor bladed at various temperatures (30, 40, and 50 °C). As shown in Figs. 8(a) and 8(b), three stages in film drying have been identified: (i) rapid solvent evaporation: the drying showed constant rate behavior, (ii) moderate solvent evaporation and crystallization: P3HT started to crystallize rapidly [Figs. 8(c) and 8(d)], hence the crystals hindered the diffusion of solvent toward the surface. The drying has become diffusion-dominated. (iii) Slow solvent evaporation and slow crystallization: P3HT crystallization finalized. It is additionally suggested that the nucleation dynamics of P3HT indicated heterogeneous nucleation behavior, as the crystallization growth mechanism was explored using the Avrami equation with Avrami exponent lower than 2, which is indicative for heterogeneous nucleation. Reference Wang, Dunbar, Staniec, Pearson, Hopkinson, MacDonald, Lilliu, Pizzey, Terrill, Donald, Ryan, Jones and Lidzey92
(a) The thickness of a P3HT:PCBM blend film as a function of time after casting determined using spectroscopic ellipsometry at different temperatures. (b) is the re-plot of the data for 30 °C after 10th second of drying. (c) is the out-of-plane cross sections X-ray intensity of P3HT [100] peak. (d) is the crystallinity data determined from (c). Reproduced from Ref. Reference Wang, Dunbar, Staniec, Pearson, Hopkinson, MacDonald, Lilliu, Pizzey, Terrill, Donald, Ryan, Jones and Lidzey92 with permission from RSC.

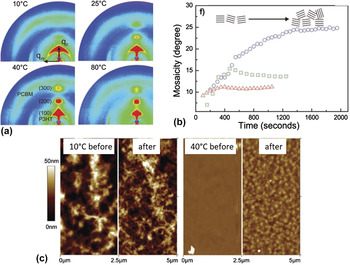
Schmidt-Hansberg and coworkers followed up with a very similar study on P3HT:PCBM with an in situ setup based on reflectometry and GIXD in 2011. Reference Sanyal, Schmidt-Hansberg, Klein, Colsmann, Munuera, Vorobiev, Lemmer, Schabel, Dosch and Barrena93 P3HT:PCBM layers were doctor bladed from ODCB-based solution at various temperatures (10, 25, 40, and 80 °C). It has been shown that at all drying temperatures, P3HT (h00) diffraction peaks are formed along out-of-plane directions, which is indicative for edge-on orientation [Fig. 9(a)]. The drying at lower temperatures; however, led to more random distribution of P3HT crystallites (i.e., higher degree of mosaicity) but greater π–π stacking [Fig. 9(b)]. It was additionally proposed that the poor molecular kinetics at low drying temperature hindered the phase separation of P3HT and PCBM, which was confirmed by AFM measurements [Fig. 9(c)] indicating smaller domains for the sample processed at low temperature after washing PCBM away with octanedithiol (ODT). Therefore, it was advised that lowering substrate temperature can be a simple route to optimize device efficiency.
(a) 2D diffraction pattern of P3HT:PCBM dried at 10, 25, 40 and 80 °C. (b) Mosaicity of P3HT plotted with respect to drying time. (c) Atomic force microscopy topography images of P3HT:PCBM dried at 10 and 40 °C. The images on the left and right are the samples without and with ODT treatment, respectively. Reproduced from Ref. Reference Sanyal, Schmidt-Hansberg, Klein, Colsmann, Munuera, Vorobiev, Lemmer, Schabel, Dosch and Barrena93 with permission from Wiley VCH.

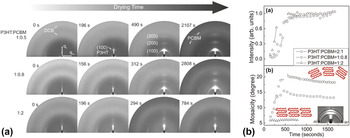
While the temperature was found to affect the orientation of P3HT crystallites, the effect of PCBM content on the P3HT orientation has been additionally studied by Schmidt-Hansberg and co-workers with in situ GIXD. Reference Sanyal, Schmidt-Hansberg, Klein, Munuera, Vorobiev, Colsmann, Scharfer, Lemmer, Schabel, Dosch and Barrena94 P3HT:PCBM layers with 2:1, 1:0.8, and 1:2 weight ratios were doctor bladed from ODCB-based solutions. The crystallization process of P3HT was estimated by quantifying the integrated (100) Bragg peak of P3HT as solvent evaporates [Fig. 10(a)], and the orientation distribution of P3HT crystallites (i.e., mosaicity) was additionally plotted as a function of time [Fig. 10(b)]. It has been found that with increasing amount of PCBM, larger portion of edge-on P3HT crystallites were formed during drying. Furthermore, high PCBM content hindered the development of P3HT π–π stacking, as the characteristic peak (010) was absent for the sample with 1:2 blend ratio. This work has introduced the microscopic understanding of the film formation mechanism under the influence of blend ratio, which is vital for the further development of efficient OSCs.
(a) 2D X-ray diffraction images of P3HT:PCBM drying plotted at certain time segments for samples with 2:1, 1:0.8 and 1:2 ratios. (b) Evolution of total integrated intensity of P3HT (100) Bragg peak (top) and mosaicity of P3HT crystals (bottom) which was calculated from the azimuthal integration of the first-order Bragg peak shown in inset. Reproduced from Ref. Reference Sanyal, Schmidt-Hansberg, Klein, Munuera, Vorobiev, Colsmann, Scharfer, Lemmer, Schabel, Dosch and Barrena94 with permission from ACS.

The effect of PCBM content on the P3HT crystallization behavior has been additionally investigated by Chou and coworkers. Reference Chou, Yan, Li, Li, Zhao, Anjum, Alvarez, Gassaway, Biocca, Thoroddsen, Hexemer and Amassian95 The solvent was selected as CB instead of ODCB. The spin coated samples were probed with GIXD/GISAXS, reflectometry and ellipsometry. The PCBM content has been varied in the range of 0–75 wt%. The drying was extremely rapid, and the crystallization and phase separation have occurred simultaneously and instantly. As the highest solar cell performance was observed for the blend with 37.5 wt% PCBM content, this blend was also showing the most phase separation. It was observed that the crystallization kinetics of P3HT has slowed down with an increasing content of PCBM, as PCBM hindered the aggregation process. Nevertheless, the mosaicity of the P3HT crystallites was lower under the presence of high PCBM content, which was also observed by Schmidt-Hansberg and coworkers, as explained previously. Reference Sanyal, Schmidt-Hansberg, Klein, Munuera, Vorobiev, Colsmann, Scharfer, Lemmer, Schabel, Dosch and Barrena94,Reference Chou, Yan, Li, Li, Zhao, Anjum, Alvarez, Gassaway, Biocca, Thoroddsen, Hexemer and Amassian95
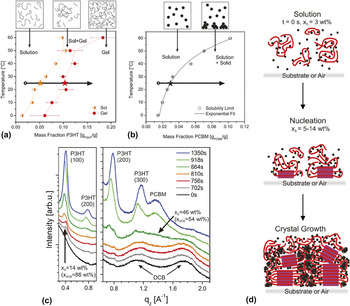
To design better performing materials and to optimize fabrication methods, the desire to gain greater insight into the dominant mechanisms for self-assembly during film formation led the research toward establishing phase diagrams from in situ measurements. Although it was only presented on P3HT:PCBM, Schmidt-Hansberg and coworkers investigated the thermodynamics of molecular ordering during film drying and provided a method to establish ternary phase diagrams based on structural changes during crystallization. Reference Schmidt-Hansberg, Sanyal, Klein, Pfaff, Schnabel, Jaiser, Vorobiev, Müller, Colsmann, Scharfer, Gerthsen, Lemmer, Barrena and Schabel96 For that, binary phase diagrams of P3HT and PCBM with the solvent (DCB) was measured with the help of a refractometer at different temperatures. It was found that the P3HT solution in DCB was stable for concentrations below 3 wt% at 25 °C [Fig. 11(a)], and the solubility limit was reached at a mass fraction of 5.1 wt%. While the solution has started to experience bimodal demixing, polymer chains have started to aggregate at the mass fraction of 10.2 wt%, leading to partially gel state. PCBM, on the other hand, experienced a single solubility limit without any gel state, and its solubility limit has increased stronger than P3HT with increasing temperature [Fig. 11(b)]. The crystallization behavior of P3HT:PCBM layer casted from DCB at 25 °C on PEDOT:PSS was observed in situ with GIXD and compared with the superposition of the binary phase diagrams. The solid mass fraction from the drying experiments were calculated from reflectometry measurements. The evolution of GIXD profiles during drying indicate that the P3HT (100) Bragg peak has appeared at around 156th second of the drying, which refers to a mass fraction of 4.6 wt%. On the other hand, it was rather impossible to recognize the time point for the initiation of PCBM diffraction due to the overlap of PEDOT:PSS diffraction with the PCBM. Hence, another 25 °C measurement was conducted on a Si wafer [Fig. 11(c)]. The P3HT (100) Bragg peak appeared at a mass fraction of 14 wt%, while the PCBM diffraction peak started to form at 46 wt%, which is much lower than the measured value presented on the binary phase diagram. As a conclusion, it was suggested that P3HT has a nucleation range between 4.6 and 14 wt%, which was in agreement with the binary phase diagram presented. However, the suppressed aggregation of PCBM has suggested that there are strong interactions between P3HT and PCBM [Fig. 11(d)], which prevail over fullerene–fullerene interactions, thus hindering PCBM aggregation. Reference Schmidt-Hansberg, Sanyal, Klein, Pfaff, Schnabel, Jaiser, Vorobiev, Müller, Colsmann, Scharfer, Gerthsen, Lemmer, Barrena and Schabel96
(a) Binary phase diagram of P3HT solution in ODCB. (b) Binary phase diagram of PCBM solution in ODCB. (c) GIXD profile plots at increasing drying times indicating the emergence of the diffraction peaks of PCBM, P3HT (h00) Bragg peaks. (d) Scheme shows the stages of molecular arrangement during solvent evaporation with nucleation at the substrate or air interface. Purple squares are crystalline P3HT, and dots are PCBM molecules. Reproduced from Ref. Reference Schmidt-Hansberg, Sanyal, Klein, Pfaff, Schnabel, Jaiser, Vorobiev, Müller, Colsmann, Scharfer, Gerthsen, Lemmer, Barrena and Schabel96 with permission from ACS.

B. Additive effects on microstructure formation investigated by in situ methods
To achieve the most optimized BHJ active layer morphology, several methods have been utilized, such as solution optimization, thermal annealing and solvent annealing. Reference Diao, Shaw and Mannsfeld20,Reference Engmann, Ro, Herzing, Snyder, Richter, Geraghty and Jones97,Reference Huang, Kramer, Heeger and Bazan98 Within all these methods, employing low volatile solvents, i.e., additives, has become a widely accepted microstructure optimization method. Reference Liao, Ho, Chang, Jao, Darling and Su17,Reference Perez, Chou, Love, Van Der Poll, Smilgies, Nguyen, Kramer, Amassian and Bazan25 In spite of the ex situ characterization data providing the information on how additives influence final BHJ structure, little was known regarding the dynamics of the morphology formation mechanism under the presence of an additive due to the lack of proper characterization methods. Hence, the development of in situ techniques has allowed the deeper investigation of additive effect on morphology formation.
One of the very first in situ studies regarding the additive effect on a polymer:fullerene blend system was introduced by Rogers and coworkers in 2012. Reference Rogers, Schmidt, Toney, Bazan and Kramer99 They have investigated the crystallization evolution of the blend of poly{2,1,3-benzothiadiazole-4,7-diyl[4,4-bis(2-ethylhexyl)-4H-cyclopenta[2,1-b:3,4b′]dithio-phene-2,6-diyl]} (PCPDTBT) and PC70BM, where 3 vol% ODT to the chlorobenzene (CB) solution was reported to increase the efficiency significantly. Reference Peet, Kim, Coates, Ma, Moses, Heeger and Bazan100 It has been observed that the film coated from neat CB solution showed an amorphous, isotropic scattering pattern which has not changed during the drying. On the other hand, the film coated from CB + ODT solution has shown a (100) Bragg peak immediately after coating, and the scattering intensity has increased during the drying. The CCL was estimated as 9 nm, which stayed constant over the course of the drying. Hence, it was suggested that the ODT has introduced additional nucleation processes rather than further growth of the existing crystallites. All in all, this study was the first additive-related study, which suggested that the functioning mechanism of additives on BHJ blends might be related to the early aggregation of the donor material and prolonged reorganization time within the layer. Reference Rogers, Schmidt, Toney, Bazan and Kramer99
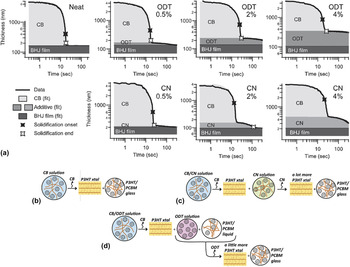
Additives, such as ODT or 1,8-diiodooctane (DIO), are accepted as selective solvents for fullerenes in the organic photovoltaic community. Reference Liao, Ho, Chang, Jao, Darling and Su17 On the other hand, additives, such as 1-chloronapthalene (CN) or DIO, are also capable of dissolving both polymer and the fullerene. Reference Machui, Maisch, Burgués-Ceballos, Langner, Krantz, Ameri and Brabec101,Reference Güldal, Berlinghof, Kassar, Du, Jiao, Meyer, Ameri, Osvet, Li, Li-Destri, Fink, Ade, Unruh and Brabec102 Since the kinetics of microstructure formation is determined by the thermodynamics of the coated solution during drying, the quality of the selected additive regarding the component solubility is an attractive aspect to investigate, especially with in situ characterization methods. A very detailed study was presented by Shin and coworkers on P3HT:PCBM blend with different amounts of ODT (as poor solvent for P3HT) and CN (as good solvent for P3HT). Reference Shin, Richter, Herzing, Kline and DeLongchamp29 The polymer order and the changes in the thickness and morphology were tracked with spectroscopic ellipsometry. The drying curves for all the samples indicate the aggregation onset (i.e., solidification onset) and final film formation (i.e., solidification end) [Fig. 12(a)]. It has been observed that the rate of CB drying was similar for all samples, independent of the amount of additive used. However, the aggregation onset has shifted to earlier times with increasing amount of both additives, indicating that both additives have promoted early crystallization of P3HT, which was promoted by supersaturation. The mechanism behind this behavior was attributed to the additives lowering the host solvent quality in terms of solubility. Nevertheless, CN being a partially good solvent for P3HT, the ordering of the polymer has continued even after CB removal, leading to a prolonged reorganization in the system.
(a) The thickness versus time data plotted on a log–log scale for P3HT:PCBM films processed without additive and with different amounts of ODT and CN, as indicated accordingly. Graphical summary of film solidification for P3HT:PCBM films studied from solutions with (b) CB only, (c) CB + CN and (d) CB + ODT. Reproduced from Refs. Reference Shin, Richter, Herzing, Kline and DeLongchamp29 and Reference Richter, Delongchamp, Bokel, Engmann, Chou, Amassian, Schaible and Hexemer103 with permission from Wiley VCH.

A follow up work on doctor bladed P3HT:PCBM in CB with ODT or CN was presented by Richter and coworkers with in situ GIXD/GISAXS and reflectometry. Reference Richter, Delongchamp, Bokel, Engmann, Chou, Amassian, Schaible and Hexemer103 As explained earlier, the layer with neat CB has dried quickly with a very rapid crystallization of P3HT and the formation of a mixed phase of amorphous P3HT and PCBM. Under the presence of CN [Fig. 12(b)], early aggregation of polymer has taken place, and the crystallization has followed a similar pattern to that of additive-free layer. It was suggested that the layer has adapted into a two phase structure after the drying of host solvent: P3HT crystal and a CN mixture of P3HT and PCBM. Hence, CN regulated the rest of the crystallization and ordering in the layer during its drying. With ODT, however, most of the P3HT crystallization has happened during CB drying, triggered by early aggregation. In this case, PCBM has been removed from the P3HT-rich phase by ODT, which has improved the phase separation compared to additive-free layer. Reference Richter, Delongchamp, Bokel, Engmann, Chou, Amassian, Schaible and Hexemer103
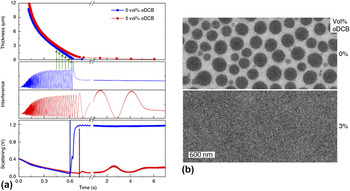
The dynamics and interplay of phase separation and polymer aggregation under the presence of additives were additionally investigated by van Franeker and coworkers with a different blend system than P3HT:PCBM. Reference van Franeker, Turbiez, Li, Wienk and Janssen55 They have taken diketopyrrolopyrrole-quinquethiophene copolymer (DPP5T) with PC70BM in chloroform (CF) solution and added different amounts of ODCB or DIO as additives. The evolution of microstructure formation has been measured by absorption, reflectometry and light scattering. It has been observed that DPP5T:PC70BM in CF has formed big fullerene droplets [Fig. 13(b)], which has introduced a high light scattering signal before any aggregation was observed at the absorption plot [Fig. 13(a)]. Hence, the nature of the phase separation was labeled as liquid–liquid phase separation i.e., spinodal demixing, which preceded polymer aggregation and influenced the cell performance detrimentally. However, if an additive such as ODCB or DIO were used as bad solvents for the polymer, DPP5T was then forced into aggregation under supersaturation conditions, which hindered the liquid–liquid phase separation by either forming gel aggregates or precipitates.
(a) Detecting liquid–liquid phase separation with time. Film thickness, normalized interference and light scattering of DPP5T:PC70BM in solvent mixtures is monitored during spin coating. The solvent is chloroform (blue squares) and chloroform with 5 vol% ODCB (red circles). Green arrows schematically indicate the thickness reconstruction from the measured interference signal. The dashed lines indicate the onset of scattering. (b) Bright-field TEM images of DPP5T:PC70BM blends spin coated from chloroform and chloroform + 3 vol% ODCB solutions. Reproduced from Ref. Reference van Franeker, Turbiez, Li, Wienk and Janssen55 with permission from Nature Publishing Group.

Especially with the help of in situ characterization studies, it has been widely accepted that there are two guidelines followed when selecting an effective additive: (i) the additives should be non-solvents or worse solvents than host solvents for one component (generally the donor material since the solubility of fullerenes are generally very high in such solvents), and (ii) the additive should have lower volatility than the host solvent, ensuring a more controlled microstructure formation. Although CN is an exception among all additives since it provides good solubility for both components, the presented in situ studies so far indicate that the working principle of all additives follows the same manner: additives reduce the quality of the host solvents by accelerating the polymer aggregation/crystallization, hence they additionally prolong the crystallization procedure, and the total drying time would be increased due to the low vapor pressure. However, the interplay between component solubility, solid solutions and microstructure formation kinetics in the presence of additives was not well understood.
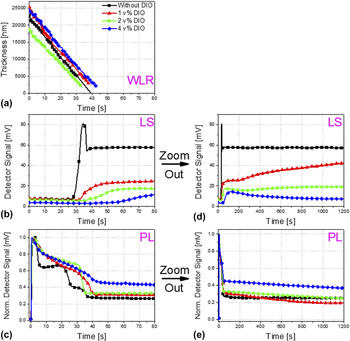
To investigate the effect of component solubility in additives on microstructure formation, Güldal and coworkers presented an in situ study on a blend system with poly-thieno[3,2b]thiophene-diketopyrrolopyrrole-co-thiophene (DPP-TT-T) and PCBM. Reference Güldal, Berlinghof, Kassar, Du, Jiao, Meyer, Ameri, Osvet, Li, Li-Destri, Fink, Ade, Unruh and Brabec102 In this study DPP-TT-T:PCBM system was utilized with the additive DIO as a better solvent for both components than the host solvent, o-xylene:mesitylene mixture, and an alternative morphology formation mechanism has been introduced. The drying kinetics and solution thermodynamics have been observed by reflectometry, light scattering and PL simultaneously on doctor bladed solutions with different amounts of DIO, where PL has been specifically used for tracking molecular self-assembly. It has been observed that without any DIO, the blend has gone through a polymer gelation due to o-xylene and then aggregation/crystallization. Reference Güldal, Kassar, Berlinghof, Ameri, Osvet, Pacios, Li Destri, Unruh and Brabec49 However, when DIO was added (Fig. 14), it has led the evolution of morphology formation toward thermodynamic equilibrium (i.e., all kinetic mechanisms were suppressed), and a solid solution was formed. It was observed that the kinetic mechanisms (e.g., crystallization) have taken place during DIO drying only. It was confirmed that host solvents do not play a major role on morphology evolution, and the component solubility is an important factor playing role on the formation mechanism of solid solutions and microstructure.
Time evolution of DPP-TT-T:PCBM drying was measured by WLR (a), LS (b) & (d), PL (c) & (e). Figures (b) and (c) are additionally ‘zoomed out’ (i.e., plotted over longer time scale), which are presented at figures (d) and (e), respectively. Increasing amount of DIO hinders PCBM aggregation (i.e., lower LS signals) and the self-quenching mechanisms of DPP-TT-T (i.e., higher PL signals right after host solvent drying). Reproduced from Ref. Reference Güldal, Berlinghof, Kassar, Du, Jiao, Meyer, Ameri, Osvet, Li, Li-Destri, Fink, Ade, Unruh and Brabec102 with permission from RSC.

C. Up-scaled BHJ layers investigated by in situ characterization methods
No matter how extensive studies are being conducted on lab scale BHJ layers with in situ and ex situ methods, the transfer of the coating and drying information from lab scale processing methods, such as spin coating and doctor blading, to industrial scale processing methods, such as slot-die coating and roll-to-roll coating (R2R), is not straightforward. Although some processes are similar to each other, industrial scale printing requires higher amount of solutions to be printed on wider and longer substrates under very different coating and drying conditions. Hence, the need of dynamic microstructure formation analysis has emerged not only for lab scale BHJ layers but also for upscaled BHJ layers.
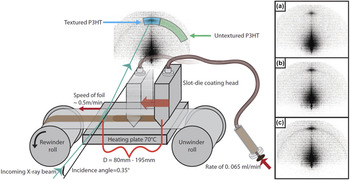
In 2014, Rossander and coworkers were the first group installing a miniature R2R coater on a SAXS unit (Fig. 15) and observing the crystal formation of P3HT:PCBM layers in situ. Reference Rossander, Zawacka, Dam, Krebs and Andreasen104 P3HT:PCBM solution in CB was injected in a coating head and printed on a PET foil at 70 °C. SAXS measurements were conducted at two different distances between coating head and illumination point, leading to two different drying times (14 and 23 s). It was observed that the P3HT (100) Bragg peak appeared at out-of-plane direction, indicating edge-on oriented crystals [Fig. 15(a)]. When the in situ SAXS results have been compared with an ex situ measurement of the dried film after 1 h, the intensity of the randomly distributed crystals (i.e., the ring) has increased, indicating a residual solvent being trapped in the film causing further ordering [Fig. 15(c)]. However, the ring formation has occurred very slowly and much after than the formation of edge-on crystals [Fig. 15(b)]. Hence, it was concluded that edge-on oriented crystals started to build up at interfaces (i.e., heterogeneous nucleation) while randomly distributed crystal formation was controlled by supersaturation, which contradicts with the results presented for lab-scale P3HT:PCBM formation, indicating that the governing nucleation and crystal formation mechanism for oriented and randomly distributed crystals is different for R2R coating compared to lab scale processing methods.
Schematic of the SAXS roll coater (left), with 3 examples of measurements on the right with different distances from the coating head, corresponding to 14 s (a), 23 s (b) and 1 h (c) drying time, respectively. The 1 h experiment was recorded ex situ by rewinding back the coated film after 1 h. Reproduced from Ref. Reference Rossander, Zawacka, Dam, Krebs and Andreasen104 with permission from AIP Publishing.

Liu and coworkers, on the other hand, presented a mini version of a slot-die coater installed on a GIXD/GISAXS stage by observing the solvent mixture effect on the crystallization and domain formation of a blend mixture composed of low band gap conjugated copolymer of diketopyrrolopyrrole and quaterthiophene (DPPBT) and PC71BM. Reference Liu, Ferdous, Schaible, Hexemer, Church, Ding, Wang and Russell105 The crystallization was controlled with a solvent mixture of CF and ODCB, where ODCB was taken as a non-solvent for DPPBT. In situ GIXD has revealed that with the increasing amount of non-solvent in the solution, the ordering of DPPBT has occurred more and more in solution phase, and faster aggregate formation was observed. In situ GISAXS has indicated that for low non-solvent concentrations, the phase separation was seen before crystallization. With more ODCB in the solution, the onset of the crystallization and phase separation initiation were in sync. It was, however, expected that the phase separation has occurred at earlier time scales due to the high amount of non-solvent separating PC71BM from DPPBT more readily.
D. Morphology formation of BHJs based on polymers with aggregation extremities
Although most conjugated polymers for OPV are semi crystalline in nature, some polymers are either amorphous or highly crystalline. Such polymers are of interest for improving the performance of OPV as well. Therefore, within the last years such polymers were also subjects of in situ investigations.
One of the most well-known and widely used amorphous polymers in organic solar cells is poly[N-9′-heptadecanyl-2,7-carbazole-alt-5,5-(4′,7′-di-2-thienyl-2′,1′,3′-benzothiadiazole)] (PCDTBT), which was once exhibiting the highest efficiency with 6.1% and internal quantum efficiency up to 100%. Reference Park, Roy, Beaupre, Cho, Coates, Moon, Moses, Leclerc, Lee and Heeger106 It was additionally reported that amorphous polymers generally need high loading of acceptor material due to the miscibility, which is not the case for the semi crystalline polymers. Hence, PCDTBT was especially interesting material to investigate in situ in combination with PC71BM to distinguish the differences in the microstructure formation mechanism in an amorphous polymer:fullerene blend. Nevertheless, it is challenging to measure a blend based on an amorphous polymer, given the fact that most of the in situ studies utilize GIXD. Pearson and coworkers, on the other hand, have utilized GIXD and ellipsometry, with which they observed the microstructure formation of doctor-bladed PCDTBT:PC70BM films. Reference Pearson, Wang, Dunbar, Yi, Watters, Coles, Staniec, Iraqi, Jones and Lidzey107 With GIXD, it has been observed that PCDTBT underwent a very weak lamella ordering at the very end of the drying while fullerene has aggregated right after its solubility limit has been reached. However, unlike what has been reported so far on semi crystalline systems, fullerene aggregation has preceded the weak polymer arrangement, and the polymer chains had to arrange themselves around the fullerene aggregates.
In contrast to PCDTBT, one of the most efficient polymers reported to date is a highly aggregating polymer, which shows a strong temperature-dependent aggregation Reference Liu, Zhao, Li, Mu, Ma, Hu, Jiang, Lin, Ade and Yan108 : poly[(5,6-difluoro-2,1,3-benzothiadiazol-4,7-diyl)-alt-(3,3‴-di(2-octyldodecyl)-2,2′;5′,2″;5″,2‴-quarter thiophen-5,5-diyl)] (PffBT4T-2OD). Although PffBT4T-2OD and similar variants’ advantage is the strong tendency to aggregate resulting in robust morphologies which lead to high performances, temperature dependency pushes the processing conditions toward high temperatures (>90 °C). Hence, the adaptation of the process from spin coating to doctor blading (or to slot-die coating) becomes challenging. Nevertheless, this transition was investigated in situ by Wook Ro and coworkers very recently. Reference Ro, Downing, Engmann, Herzing, DeLongchamp, Richter, Mukherjee, Ade, Abdelsamie, Amassian, Jagadamma, Yan and Liu23 PffBT4T-2OD:PC71BM solutions were doctor bladed and spin coated at 90–100 °C from CB:ODCB-based solutions with DIO as additive. The in situ measurements were conducted with reflectometry and UV-Vis absorbance at 700 nm which is indicative of aggregation. The thickness has evolved in two stages: primary solvent drying and DIO drying (Fig. 16). The aggregation has occurred very late in the host solvent drying stage and was completed until DIO drying phase. On the other hand, spun-coat film has shown a much earlier aggregation onset (Fig. 16), which was explained with the cooling effects on the sample by convection reducing the aggregation onset. It was suggested that the PffBT4T-2OD has the ability to have multiple morphologies leading to similar performances, independent from the coating method.
Film thickness (black) and absorbance at 700 nm (red) from in situ UV-Vis absorbance studies during spin-coating and blade-coating. Increase in red-shifted absorbance at 700 nm is indicative of aggregation. Reproduced from Ref. Reference Ro, Downing, Engmann, Herzing, DeLongchamp, Richter, Mukherjee, Ade, Abdelsamie, Amassian, Jagadamma, Yan and Liu23 with permission from RSC.

V. MICROSTRUCTURE FORMATION OF SMALL MOLECULE:FULLERENE BLENDS
Small molecules are conjugated polycyclic compound with low molecular weights. Due to easier synthesis and processing, researchers were motivated to investigate the use of small molecules in OPV. With precise design of molecules and improved processing conditions, it has been shown that small molecules perform as efficiently as conjugated polymers. Reference van der Poll, Love, Nguyen and Bazan109,Reference Zhang, Kan, Liu, Long, Wan, Chen, Zuo, Ni, Zhang, Li, Hu, Huang, Cao, Liang, Zhang, Russell and Chen110 Therefore, structural studies are necessary to provide deeper insight into the mechanism and driving force for microstructure formation leading to high efficiency solar cells.
Although there are many small molecules exist in literature, one of them attracted the most attention in terms of in situ microstructural studies. It has been reported that 7,7′-(4,4-bis(2-ethylhexyl)-4H-silolo[3,2-b:4,5-b′]dithiophene-2,6-diyl)bis(6-fluoro-4-(5′-hexyl-[2,2′-bithiophen]-5-yl)benzo[c][1,2,5]thiadiazole) [p-DTS(FBTTh2)2] blended with PC71BM demonstrated PCE of 7% with just 0.4 vol% solvent additive DIO in CB-based solution. Reference van der Poll, Love, Nguyen and Bazan109 The amount of the solvent additive used in this system was indicative of the sensitivity of the small molecule to this processing condition, which was not observed in any polymer:fullerene system. Due to this interesting effect of DIO on (p-DTS(FBTTh2)2):PC71BM system, real-time investigations during film formation were conducted with GIXD by two different research groups. Reference Perez, Chou, Love, Van Der Poll, Smilgies, Nguyen, Kramer, Amassian and Bazan25,Reference Engmann, Bokel, Herzing, Ro, Girotto, Caputo, Hoven, Schaible, Hexemer, DeLongchamp and Richter111 Since these two studies present very similar results, we present the study published by Perez and coworkers, as it precedes the work presented by Engmann and coworkers.
Perez and coworkers spin coated p-DTS(FBTTh2)2:PC71BM films from CB-based solution with and without 0.4 vol% DIO and observed the crystallization dynamics with GIXD. Reference Perez, Chou, Love, Van Der Poll, Smilgies, Nguyen, Kramer, Amassian and Bazan25 Without any additive, the samples have formed broad peaks at q = 4.8 and 17.3 nm−1, which correspond to lamella packing and π–π stacking, respectively [Fig. 17(a)]. The broad peak at q = 13.2 nm−1 was probably a contribution of several structures, such as PC71BM and glassy regions of p-DTS(FBTTh2)2:PC71BM. On the other hand, the sample with 0.4 vol% DIO has shown narrow (100) Bragg peak at q = 2.8 nm−1 [Fig. 17(b)]. In situ records of integrated scattered intensity [Fig. 17(c)] has revealed that additive-free sample has experienced a very rapid crystallization, which lasted around 0.18 s with the peak at q = 4.8 nm−1, matching to the peak position in Fig. 17(a). However, the sample with additive has experienced a complex rearrangement during film formation, with a peak forming at q = 3.8 nm−1, which was attributed to a metastable intermediate phase. The presence of additive has slowed the crystallization down since the formation of final structure took around 60–70 s to stabilize. At the end, the metastable phase was gradually converted into the crystals with the peak at q = 2.8 nm−1 and enhanced degree of crystallinity. It was additionally stated by several other reports in literature that DIO has delayed the crystallization of p-DTS(FBTTh2)2, which indicates direct plasticization of the donor material under the presence of additive, though DIO was reported as a worse solvent for p-DTS(FBTTh2)2 than CB. Reference Engmann, Bokel, Herzing, Ro, Girotto, Caputo, Hoven, Schaible, Hexemer, DeLongchamp and Richter111–Reference McDowell, Abdelsamie, Zhao, Smilgies, Bazan and Amassian113
Line cut profiles of (a) p-DTS(FBTTh2)2:PC71BM and (b) p-DTS(FBTTh2)2:PC71BM with 0.4 vol% DIO 2, 6, 9, 12, 15, 25, 30, 45, and 60 min after casting show that the structure is static 2 min after casting regardless of the solvent composition. In situ GIWAXS image plots of (c) p-DTS(FBTTh2)2:PC71BM show that a static structure forms ≈5 s into spin-casting, while image plots for (d) p-DTS(FBTTh2)2:PC71BM with 0.4 vol% DIO show that the initial formation of a metastable polymorph that gradually attenuates to a different final structure ≈25 s after casting that finishes growing ≈30 s after spin casting is complete. Reproduced from Ref. Reference Perez, Chou, Love, Van Der Poll, Smilgies, Nguyen, Kramer, Amassian and Bazan25 with permission from Wiley VCH.

VI. CONCLUSION AND PERSPECTIVES
In this review, we have summarized different optical and reciprocal-space measurement methods, which were utilized in situ, i.e., during film formation, to understand the influence of processing conditions on the morphology of organic BHJs films. Our focus was to explore these methods theoretically and to give examples of application of such methods from the selected literature for different types of organic BHJ systems.
As we have tried to give a chronological evolution of the in situ studies on organic BHJs, we must point out that over the years, the need of deeper insight into microstructure formation has led the researchers to utilize more than one in situ technique simultaneously. Therefore, with that motivation, the development and the application of these techniques have developed immensely within a very short period of time.
The very first in situ studies were on polymer:polymer blends, since polymer:fullerene blends were not used that commonly, though already introduced. Unfortunately, such investigations were really limited, and they were based on different polymers under different conditions. Hence, to be able to connect different works with each other was mostly impossible. Nevertheless, the goal for in situ measurements was clear: to be able to distinguish and name the mechanisms controlling crystallization and phase separation. This goal has especially played a big role on investigating morphology formation mechanisms in polymer:fullerene BHJs.
Most of the in situ studies were tested and developed with the benchmark P3HT:PCBM system. It has been broadly understood that morphology formation of many polymer:fullerene blends, especially P3HT:PCBM, experiences few evolution steps with different self-assembly characteristics of the components depending on the solution properties, coating and drying conditions. In terms of these properties and conditions, main comparisons made were:
-
(1) Different drying rates: here, it is referred to the effect of different drying temperatures and not to the solvent selection. It has been reported that different drying temperatures affect the vapor pressure of the solvent and the solubility of the components in the selected solvent. Reference Schmidt-Hansberg, Klein, Peters, Buss, Pfeifer, Walheim, Colsmann, Lemmer, Scharfer and Schabel91,Reference Sanyal, Schmidt-Hansberg, Klein, Colsmann, Munuera, Vorobiev, Lemmer, Schabel, Dosch and Barrena93 These influence aggregation dynamics of the components directly, as slow drying or rapid solidification might be beneficial for crystallization of the polymer and indirectly for degree of phase separation.
-
(2) Selected host solvents and additives: the solvent and additive effects on the microstructure formation was the most researched with in situ methods. Most studies on additive effects were conducted on P3HT:PCBM system, and critically they became repetitive. However, together with the investigation of different polymer:fullerene systems, it has been understood that the functioning mechanism of additives is dominated by the solubility behavior of the components in the host solvents and additives themselves. Depending on the solubility, a polymer can experience either direct plasticization or indirect plasticization, which might lead to same or different morphologies, yet it is an invaluable knowledge on the precise control of the aggregation kinetics of the polymer. Reference Liao, Ho, Chang, Jao, Darling and Su17,Reference Perez, Chou, Love, Van Der Poll, Smilgies, Nguyen, Kramer, Amassian and Bazan25,Reference Shin, Richter, Herzing, Kline and DeLongchamp29,Reference Guo, Herzig, Naumann, Tainter, Perlich and Müller-Buschbaum30,Reference van Franeker, Turbiez, Li, Wienk and Janssen55,Reference Machui, Maisch, Burgués-Ceballos, Langner, Krantz, Ameri and Brabec101–Reference Richter, Delongchamp, Bokel, Engmann, Chou, Amassian, Schaible and Hexemer103,Reference Engmann, Bokel, Herzing, Ro, Girotto, Caputo, Hoven, Schaible, Hexemer, DeLongchamp and Richter111,Reference Kwon, Park, Kim, Kim, Yu, Lee, Jo, Kim, Kang, Kim, Kim and Lee114,Reference Kwon, Kang, Lee, Lee, Hong, Kim and Lee115 On the other hand, the phase separation dynamics are additionally controlled by the solubility, since fullerenes are generally more soluble in additives than polymers are, hence some amount of fullerene is generally removed from the polymer due to the solubility differences under the presence of additives.
-
(3) Fullerene content: depending on the crystallization behavior of the donor material and the degree of the miscibility between the acceptor and donor materials can lead to different donor:acceptor ratios for the most optimized morphology. It has been reported that amorphous polymers need high amounts of fullerene to achieve high performances due to high miscibility. On the other hand, the crystallinity of semicrystalline polymers, such as P3HT, is vulnerable against high fullerene content since fullerenes postpone or completely hinder the onset of polymer aggregation during film formation. It can be observed that BHJ blends with high fullerene contents might have more polymer:fullerene glassy phases due to rapid solidification and the delay of aggregation onset. Reference Sanyal, Schmidt-Hansberg, Klein, Munuera, Vorobiev, Colsmann, Scharfer, Lemmer, Schabel, Dosch and Barrena94,Reference Chou, Yan, Li, Li, Zhao, Anjum, Alvarez, Gassaway, Biocca, Thoroddsen, Hexemer and Amassian95
-
(4) Coating methods: the information achieved from comparing two BHJ films processed with two or more coating methods might be useful when the process transfer from one method to other is under question. Reference Ro, Downing, Engmann, Herzing, DeLongchamp, Richter, Mukherjee, Ade, Abdelsamie, Amassian, Jagadamma, Yan and Liu23,Reference Zhao, Hu, Spada, Jagadamma, Yan, Abdelsamie, Yang, Yu, Munir, Li, Ndjawa and Amassian37 This, however, is very challenging. Due to different coating methods, the drying conditions would change massively. Therefore, the solution thermodynamics and drying kinetics would follow a different path with each coating method. Although we have not summarized the selected works one by one in terms of coating methods, it is still very important to recognize the differences in morphology formation at different coating methods, especially when a transfer between processes is needed.
From the published literature on in situ characterization on microstructure formation of organic BHJ films, we have concluded that most of the studies utilize such characterization methods to explain and/or support the solar cell performances achieved with the selected BHJ solution under specific conditions. Critically, this makes it extremely difficult to compare two or more works, which use the same BHJ combination, e.g., P3HT:PCBM, but with different solvents, different concentrations, different temperatures and different coating methods. Therefore, caution must be exercised in generalzing conclusions about the materials themselves when drawing upon investigations where several of these system parameters differ substantially.
Unfortunately, the limitation of resources of any individual laboratory to investigate multiple processing techniques simultaneously, coupled with a significant emphasis on device-performance metrics, has limited the predictive power of the process-property links identified in many in situ investigations. We suggest that there exists a pressing need to develop a roadmap for organic BHJs characterization, which outlines strategies for connecting device physics to more generalizable parameters that can be tuned across various processing methods. Such a roadmap may outline a greater role for techniques in areas such as rheology, for example, within the standard characterization toolbox of the organic BHJ ink developer. Importantly, in situ methods are well established over the years and they can be applied with few constraints on organic BHJs, enabling more fundamental research such as investigation of interaction between donor, acceptor and solvent molecules and inspection of solution thermodynamics of BHJs (e.g., solubility, miscibility) together with drying kinetics, not just microstructure formation. We believe that in situ characterization methods must play a substantial role in this roadmap to facilitate the transfer of promising materials systems from the laboratory through to up-scaled processes. Such a structured framework based on generalized, process transferable parameters has the potential to reduce the time- and resource-intensive trial and error procedure in ink formulations, and to offer a faster delivery of high-performance OPV for clean, renewable energy.
ACKNOWLEDGMENT
The authors gratefully thank Deutsche Forschungsgemeinschaft (DFG) in the framework of SFB 953 (Synthetic Carbon Allotropes) and Cluster of Excellence ‘Engineering of Advanced Materials’ and GRK 1896 In situ Microscopy with Electrons, X-rays and Scanning Probes.