

The economic crisis generated by COVID-19 led to growth in social protection measures around the world as governments resorted to social assistance and social insurance measures. In Latin America, public policy responses relied mainly on social assistance tools, although some countries were also able to provide relevant responses using contributory mechanisms oriented toward formal workers (ECLAC 2022b). Uruguay is among the countries that could respond through both social assistance and social insurance measures, thanks to the greater relative development of its social protection system compared with other countries in the region.
The extent and effect of these responses have not yet been analyzed in depth, as no suitable information was available until very recently. Existing studies on fiscal policies to address COVID-19 and its impacts in Uruguay include Brum and De Rosa (Reference Brum and De Rosa2021), who used prepandemic data with “nowcasting” techniques, and Rodríguez et al. (Reference Rodríguez, Jara, Dondo, Arancibia, Macas Romero, Riella, Urraburu, Jouste, Kanbur, Pirttilä and Rattenhuber2025), who analyzed Uruguay as part of a seven-country comparative study using 2020 data. However, this study is the first to utilize actual information from 2020 and 2021. Our study provides original evidence about the impacts of the measures undertaken by the Uruguayan government during the COVID-19 crisis by using representative household survey data from the National Household Survey of Uruguay, collected by the Instituto Nacional de Estadística (INE), for the years 2019, 2020, and 2021. Specifically, using a static microsimulation approach, we analyze the role of benefit and tax policies in mitigating the effects of the COVID-19 crisis on household disposable income in Uruguay, considering the distributional and poverty dimensions. The main policy measures adopted by the Uruguayan government were the increase in the amount of existing cash transfers, the introduction of a new cash-transfer program to reach informal workers, and the simplification of requirements for unemployment insurance benefits. On the tax side, the government implemented a temporary income tax (COVID-19 Emergency Tax) for public workers (excluding health workers) and pensioners receiving an income above a certain threshold. This tax was levied for two months in 2020 and two months in 2021.
The new fiscal measures introduced in the face of COVID-19 were not enough to prevent poverty and extreme poverty from increasing, but they attenuated their impacts. Our results indicate that these measures, taken together, prevented a further increase in poverty of around 1.3 and 1.6 percentage points (pp) in 2020 and 2021, respectively, with a greater effect on households with children. The main instruments were the COVID-19 unemployment insurance and Asignaciones Familiares (AFAM) in 2020, and AFAM in 2021. Food baskets had negligible effects on poverty incidence. In terms of the equalizing effects of these new social protection measures, they prevented an additional increase in the Gini coefficient of more than half a percentage point.
Our evidence on the effectiveness of public interventions implemented in the face of the COVID-19 crisis contributes to the discussion about the potentialities of the current social protection system to cope with unexpected shocks, as well as the question of how to facilitate more effective responses. Although our study focuses specifically on the redistributive impacts of direct tax-benefit measures, it should be understood within the broader policy context. Bucacos et al. (Reference Bucacos, Carballo, Mello and Ponce2022) provide a comprehensive survey of the full range of policy responses implemented in Uruguay during COVID-19, including health measures, monetary policy, credit guarantee programs, and regulatory measures. Our microsimulation analysis complements their work by providing detailed quantification of a key component of this broader policy response.
Public policies and COVID-19: What happened in Latin America?
All countries implemented or strengthened different types of measures to support households during the crisis. The profile of this expansion differed by region, depending on the starting point and the degree of consolidation of social protection systems. According to the systematization of emergency measures in the face of COVID-19 presented by Gentilini et al. (Reference Gentilini, Almenfi, Iyengar, Okamura, Downes, Dale and Weber2022), social assistance represents the most prevalent form of support across regions and country income groups, accounting for an average of 61 percent of all measures. The other forms of support were supply-side labor market programs (20 percent) and social insurance (19 percent) (Figure 1). Even in high-income settings such as European countries, social assistance represented half of the enacted measures, although measures linked to the labor market (including wage subsidies, adjustments to labor regulations, training, and reduction of working hours) were also important in this context. In Latin America and the Caribbean, 60 percent of measures consisted of social assistance interventions, mainly in addition to the existing extended network of cash transfers. Generalizations about the size of responses in terms of household protection and government orientations are not straightforward: Brazil’s right-wing government implemented very generous cash transfers, whereas the leftist government in Mexico did not expand social assistance (Lustig et al. Reference Lustig, Pabon, Sanz and Younger2023).
Social protection and labor market measures during COVID-19, by component and region.
Notes: Based on Gentilini et al. (Reference Gentilini, Almenfi, Iyengar, Okamura, Downes, Dale and Weber2022). Social assistance includes cash transfers and food assistance. Social insurance includes unemployment benefits and pension adjustments. Labor market measures include wage subsidies, work-sharing programs, and employment support.

Figure 1. Long description
A stacked bar graph comparing social protection and labor market measures during COVID-19 by component and region. The horizontal axis lists regions: Africa, East Asia Pacific, Europe and Central Asia, Latin America and the Caribbean, Middle East and North Africa, North America, South Asia, and World. The vertical axis represents the percentage from 0 percent to 100 percent. Each bar is divided into three segments representing social assistance, social insurance, and labor market measures. The color scheme includes gray for social assistance, dotted gray for social insurance, and white for labor market measures. Africa has 77 percent social assistance, 8 percent social insurance, and 15 percent labor market measures. East Asia Pacific has 64 percent social assistance, 17 percent social insurance, and 19 percent labor market measures. Europe and Central Asia have 49 percent social assistance, 26 percent social insurance, and 25 percent labor market measures. Latin America and the Caribbean have 60 percent social assistance, 18 percent social insurance, and 22 percent labor market measures. Middle East and North Africa have 59 percent social assistance, 24 percent social insurance, and 17 percent labor market measures. North America has 62 percent social assistance, 24 percent social insurance, and 14 percent labor market measures. South Asia has 78 percent social assistance, 11 percent social insurance, and 11 percent labor market measures. The World average is 61 percent social assistance, 19 percent social insurance, and 20 percent labor market measures.
This prevalence of social assistance measures in Latin America and the Caribbean is consistent with high levels of informality in the labor market and the main features of social protection systems in the region (ECLAC 2022a, 2022b). An important dimension highlighted by recent research is that Latin American tax-benefit systems are characterized by limited automatic stabilization capacity, which refers to the ability of systems to respond to economic shocks through built-in adjustments without discretionary government action (Bargain et al. Reference Bargain, Jara and Tasseva2024). This limited capacity stems from the same structural features: large informal sectors, high tax-exemption thresholds, and the design of cash-transfer programs as proxy means-tested rather than income-tested benefits.
Despite being a region with incomplete and weak welfare states, Latin America was able to implement relatively quick responses to the COVID-19 crisis.Footnote 1 The effectiveness of these measures, however, depended on the amount of the transfers and their coverage. According to ECLAC (2022a, 2022b), from March to December 2021, the average monthly amount of transfers exceeded the poverty line only in Chile, whereas only four of the sixteen Latin American countries (Brazil, Chile, Dominican Republic, and Panama) provided monetary transfers of an average monthly amount higher than the extreme poverty line. The comparison of the average amount of cash transfers by region provided by Gentilini et al. (Reference Gentilini, Almenfi, Iyengar, Okamura, Downes, Dale and Weber2022) indicates that the average transfer in Europe was almost three times that in Latin America (see Figure A1 in the online appendix).
A fast-growing literature has analyzed the economic and distributional impact of COVID-19 around the world, including in Latin America. Most of these studies assess the impacts of COVID-19 measures on the basis of pre-COVID-19 data and consider secondary information (e.g., sectors shut down by law, macroeconomic statistics, information about unemployment benefits) to predict income losses.Footnote 2 These studies tend to find that the largest impacts were experienced in the informal sector, and that the effect of tax-benefit mitigation policies was limited, in some cases with higher losses for the middle deciles rather than the poorest (Avellaneda et al. Reference Avellaneda, Chang, Collado, Jara, Mideros, Montesdeoca, Rodríguez, Torres and Vanegas2021; Jara et al. Reference Jara, Montesdeoca and Tasseva2021; Huesca et al. Reference Huesca, Llamas, Jara, Vargas and Rodríguez2021; Lustig et al. Reference Lustig, Pabon, Sanz and Younger2023; Corredor et al. Reference Corredor, Ríos and Rodríguez2021; Cuesta and Pico Reference Cuesta and Pico2020; ECLAC 2022a, 2022b). This pattern is attributed to the sectoral positioning of workers from different industries along the income spectrum and to the protective effect of existing social assistance programs for lower-income households.
Using nowcasting techniques (i.e., the use of timely, high-frequency data to infer the current state of a slowly measured variable, before its official figure becomes available) across seven Latin American countries, Rodríguez et al. (Reference Rodríguez, Jara, Dondo, Arancibia, Macas Romero, Riella, Urraburu, Jouste, Kanbur, Pirttilä and Rattenhuber2025) reveal considerable cross-country heterogeneity in both earnings losses and the effectiveness of tax-benefit policies. For the second quarter of 2020, they demonstrate that emergency policies predominantly targeted households in the lower segments of the income distribution, though with substantial variation in generosity. While countries like Mexico implemented policies with minimal impact, others such as Bolivia and Argentina provided substantial support, with the poorest households reaching up to 87 percent of prepandemic disposable income. In contrast, automatic stabilizers played a limited role in poverty alleviation across the region as a result of high labor informality rates, with their effects more pronounced at higher income levels, particularly in Mexico, Uruguay, and Ecuador.
Studies focusing specifically on Uruguay include Brum and De Rosa (Reference Brum and De Rosa2021), who nowcast poverty and inequality on the basis of prepandemic household data, and Rodríguez et al. (Reference Rodríguez, Jara, Dondo, Arancibia, Macas Romero, Riella, Urraburu, Jouste, Kanbur, Pirttilä and Rattenhuber2025), who analyze Uruguay as part of their comparative regional study using actual 2020 survey data. Brum and De Rosa estimate the poverty rate during the COVID-19 crisis, focusing on the second trimester of 2020 and based on the 2019 Uruguayan household survey. Their results show a rapid increase in the poverty rate, which climbs from 9 percent to 11.8 percent in their central scenario, and positive but modest ameliorating effects of government policies announced during the second quarter of 2020. The authors argue that a greater reduction in poverty rates could have been achieved at low costs (around 0.5 percent of gross domestic product, or GDP). Rodríguez et al. (Reference Rodríguez, Jara, Dondo, Arancibia, Macas Romero, Riella, Urraburu, Jouste, Kanbur, Pirttilä and Rattenhuber2025) find that Uruguay experienced relatively moderate income losses compared to other countries in their seven-country analysis, with emergency policies providing important cushioning effects at the bottom of the income distribution during 2020. Finally, Beccaria et al. (Reference Beccaria, Bertranou and Maurizio2022) focused on employment effects, providing comparative evidence for the relatively more moderate effects in Uruguay and highlighting the role of unemployment insurance in the context of COVID-19 in the country.
The COVID-19 crisis in Uruguay and benefit and tax responses
The Uruguayan government did not implement complete lockdown measures, but there were strong recommendations to stay at home, and economic activity was significantly affected. In this context, the impact of the pandemic on poverty and income distribution is not direct but mediated by other factors, such as the direct effect of the restrictions on employment (and especially how this effect is distributed across occupations), and the magnitude and targeting of the policies implemented in response to the economic crisis.Footnote 3
Uruguay faced two peaks of infection, one around the end of March 2021 and the other, with a higher incidence of infections, at the beginning of 2022. COVID-19 deaths were concentrated in the first wave of infection; by the time of the second wave, mass vaccination had already been implemented in Uruguay. Constraints on economic activity in Uruguay were concentrated in the second quarter of 2020 and the first half of 2021. Therefore, participation and employment rates decreased, whereas the unemployment rate climbed to 11 percent in 2020. The withdrawal of the labor force from the labor market in the face of the prevailing adverse conditions explains why the increase in the unemployment rate was not even higher. It is also important to note that workers who reported in the household survey that they had a job to which they would return within the following three months were classified as absent employed; that is, they were not counted among the unemployed (Amarante et al. Reference Amarante, Bucheli and Scalese2021). This is explained by the fact that the Uruguayan social protection system has long included subsidies for temporary reductions in economic activity for firms that face adverse demand shocks. These subsidies are considered part of the unemployment insurance program. As discussed in the following section, during the health crisis, the relaxation of unemployment insurance allowed a considerable number of workers to enter the program. This also helps explain why an explosion in unemployment did not accompany the significant fall in GDP.
Because of these constraints and parallel with labor market performance, per capita GDP declined strongly in the second quarter of 2020, after which it recovered, with oscillations (Figure 2), which also were associated with mobility and activity constraints.
Evolution of GDP and household per capita income during COVID-19.
Notes: Based on Uruguayan household surveys (ECH) and Banco Central del Uruguay. GDP per capita from national accounts. Household income per capita from household surveys (ECH). Both series deflated to constant prices. Source: authors’ construction.

The evolution of per capita household income was smoother in the second and third quarters of 2020. By the end of the second quarter of 2020, per capita GDP was 10 percent lower than in the first quarter of 2020, whereas per capita household income was 7.2 percent lower and labor income, in turn, was 12.2 percent lower than in the previous quarter. The fact that the decline in household income was lower than that in GDP or labor income suggests that public policies played a role in protecting household incomes. During 2021, household income recovered and by the last quarter it was 2.2 percent higher than in the first quarter of 2020. But the recovery of GDP per capita was much more vigorous: By the end of 2021, it was 9.5 percent higher than in the first quarter of 2020. Labor income was at the same level as in the quarter before the pandemic. These figures indicate that economic recovery did not reach labor income and household income to the same extent as GDP. A more detailed analysis of changes in household income along the income distribution is presented later in this article.
Benefits and transfers during COVID-19
Declines in household income would have been worse had social protection measures not been implemented. From the onset of the COVID-19 crisis, the Uruguayan government implemented social protection adjustments and new measures, all of them conceived as temporary measures. As discussed in Bastagli and Lowe (Reference Bastagli and Lowe2021), the configuration of the precrisis social protection system was crucial in ensuring rapid support for existing program participants. On the benefit side, the main measures consisted of an increase in the amount of existing cash-transfer measures (Asignaciones Familiares, or AFAM, and Tarjeta Uruguay Social, or TUS), as well as intensive use of the unemployment insurance program and the implementation of a new transfer targeted at informal workers. On the tax side, a temporary income tax (COVID-19 Emergency Tax) for public workers (excluding health workers) and pensioners receiving an income above a certain threshold was introduced. This tax was levied for two months in 2020 and two months in 2021.
The TUS is an unconditional monthly cash transfer, granted through a prepaid card to households with extreme economic vulnerability. The card can be used in a network of affiliated stores to purchase food and cleaning and hygiene products (purchases with the card are exempt from the value-added tax). The monthly transfer amounts range from around US$30 for a household with no children or one child and up to US$81 for a household with four or more children; the supplement per pregnant woman or per child younger than four years of age amounts to US$7. Since 2011, households in the worst economic situation have received double the standard transfer.
The AFAM is a cash transfer focused on poor households with pregnant women or children younger than eighteen years old, conditional on certain educational and health requirements. Around 40 percent of Uruguayan children younger than eighteen are beneficiaries of the program. The amount of the transfer depends on the number of children in the household, based on an equivalence scale, and to generate positive incentives for education, higher transfer amounts are granted according to the beneficiaries’ progress in the educational system. The basic amount of the transfer is around US$53, and the supplement for secondary education attendance is around US$23. Most households receiving TUS are also beneficiaries of AFAM (94 percent). The exception is the few poorer households in the lowest 10 percent of the distribution with no child in the household.
The other social protection program that played a relevant role during COVID-19 was unemployment insurance. This program had different schemes in operation in Uruguay before COVID-19: the typical design to face a layoff event but also modalities of suspension and reduction. These modalities act like a work-sharing or shared-work program, constituting a subsidy for temporary reductions in the number of hours worked in firms that face adverse demand shocks, the objective being to avoid laying workers off.
Contrary to what happened in other countries in the region, the number of beneficiaries of the two main cash transfers, AFAM and TUS, did not increase during the COVID-19 crisis: The Uruguayan government decided to scale up benefits in these programs without increasing the programs’ coverage. Starting in April 2020, the government increased the amount of the cash transfers received by vulnerable households. The original rule was that if a household received both TUS and AFAM, the stipulated relative increase was applied to the TUS transfer amount, whereas if a household received only AFAM, the relative increase was applied to the AFAM transfer. The increases were set at 50 percent of the corresponding transfer amount from April to December 2020, except for October. Given the amounts involved in each transfer, this original design implied relevant horizontal inequalities, as poorer households received a duplicate TUS (which was less than if AFAM was duplicated). This was corrected during 2021, when all households that were receiving both AFAM and TUS received an increase of 50 percent of the amount of the AFAM transfer from January to May; from June to August, they received double the (standard) transfer amount. Finally, increases of 70 percent and 50 percent in the amount of the transfer were given in September and October, respectively. In addition, the government established that prenatal AFAM beneficiaries and those up to and including three years of age would receive an increase of US$60 in their benefit from September to December 2021.Footnote 4
The other measure related to cash transfers was the introduction of a new program called Canasta de Emergencia, which applied in supermarkets and other food stores. The amount received with Canasta de Emergencia was around US$30. This transfer was targeted at informal workers not covered by TUS or AFAM or any contributory public program. At its beginning, the program involved the delivery of emergency food baskets, but in May 2022 it was changed to a cash-transfer modality.Footnote 5
The benefit could be requested via telephone, with a code then being sent by SMS for redemption. The code was unique to each user and nontransferable, associated with a particular identity card and a cell phone. It is important to note that, given the design of the transfer, any person not registered as a formal worker (or a beneficiary of social security, TUS, and AFAM) could participate in Canasta de Emergencia. Someone living in a household covered by AFAM or TUS could also receive the transfer if he or she was not the benefit holder. In fact, according to the household survey, of all households receiving at least one Canasta de Emergencia, 40 percent in 2020 and 32 percent in 2021 also received TUS or AFAM (see Table A1 in the appendix). Unfortunately, administrative data related to this program, which would have allowed us to understand the profile of beneficiaries and the overlapping of policies, are not available, so we can explore these aspects only through household surveys.
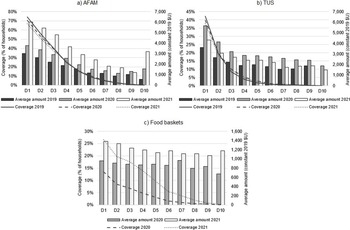
Both AFAM and TUS beneficiaries are concentrated in the lower income deciles, and both transfers present good targeting performance (Figure 3; see also Figure A2).Footnote 6 The available information also indicates that the increase in the coverage of food baskets was in the lower part of the distribution, although leakages were also detected (Figure 3). Whereas in 2019 only 0.2 percent of households received a food basket, the coverage increased to 3.1 percent in 2020 and 6.5 percent in 2021. In terms of the amounts of transfers, TUS was on average higher in 2020 than AFAM, but that reversed in 2021, when transfers of existing programs were channeled through AFAM (and not through AFAM or TUS as during 2020) and reinforced by the pilot program for Bono Crianza during the last months of 2021.
Based on Uruguayan household surveys (ECH). Coverage and average amounts of cash-transfer programs, by income deciles.
Notes: AFAM = Asignaciones Familiares (conditional cash transfer for families with children); TUS = Tarjeta Uruguay Social (unconditional cash transfer for extremely vulnerable households); food baskets = Canasta de Emergencia (emergency food assistance for informal workers). Amounts in constant 2019 Uruguayan pesos. Deciles based on per capita disposable income including all transfers.

Concerning unemployment insurance, this was an effective tool for containing the effects of the COVID-19 crisis in Uruguay (Amarante et al. Reference Amarante, Bucheli and Scalese2021; Marinakis Reference Marinakis2020). Regulatory modifications were implemented to facilitate access to the program (less demanding requirements), and in April 2020, the number of entrants to the program was eight times higher than during the previous two months (Figure 4). Most of the admissions to unemployment insurance after the crisis caused by COVID-19 occurred in the modality of suspension, which acts as a subsidy for temporary reductions in the number of hours worked in firms that face adverse demand shocks, to avoid layoffs. In 2021, the relative importance of the different causes changed, with that of reduction gaining importance.
Monthly new entrants to the unemployment insurance program, by type.
Notes: Based on Anuario Estadístico, Banco de Previsión Social. Layoff = traditional unemployment insurance for dismissed workers; suspension = temporary suspension of work (job preserved, partial income via unemployment insurance [UI]); reduction = reduced working hours or days (wage top-up via UI).

The percentage of households benefiting from the unemployment insurance program increased systematically in 2020 and 2021 over 2019, and it also changed its profile. The COVID-19 unemployment insurance had a higher incidence in the lower deciles, and it consistently resulted in lower average benefits than those of regular unemployment insurance (see Table A2 in the appendix). The flexibility of the program seems to have facilitated the incorporation of more vulnerable individuals into the pool of formal workers. In any case, beneficiaries of unemployment insurance are much more spread out along the income distribution than are beneficiaries of cash transfers (Figure A2).
In terms of resources, the flexibility of unemployment insurance accounted for 33 percent of the total amount that the government assigned to fight COVID-19 in 2020 (via the Coronavirus Fund), whereas cash transfers represented 18 percent of this fund during the same year (10 percent corresponding to Canasta de Emergencia, 4 percent to income supplements via TUS, and 4 percent to income supplements via AFAM; see Table A3).Footnote 7 It is important to note that, whereas cash-transfer programs (especially TUS and to a lesser extent AFAM) are targeted at vulnerable households, the unemployment insurance program covers private formal workers, who generally do not belong to the lower income deciles.
On the tax side, a temporary income tax (COVID-19 Emergency Tax) for public workers (excluding health workers) and pensioners receiving income above a certain threshold was introduced. This tax was levied for two months in 2020 and two months in 2021. For those receiving a gross monthly income over $U120,000 (around US$3,000), four income brackets were defined, and a mean tax rate (increasing with income) was applied. De Rosa et al. (Reference De Rosa, Lanzilotta, Perazzo and Vigorito2020) indicate that those who paid the emergency tax belonged to the upper 4 percent of the distribution of personal incomes. However, around 75 percent of those belonging to this upper 4 percent did not have to contribute to the tax (including private workers and employers), which poses serious doubts about the horizontal equity of the policy design. Moreover, although these taxpayers are among the highest-income groups in the distribution of income earners, their households are located along the entire income distribution and are not concentrated in the higher portion of the distribution of household income. As De Rosa et al. (Reference De Rosa, Lanzilotta, Perazzo and Vigorito2020) emphasize, an alternative way to identify the contributory capacity of income earners would be to consider their total income instead of relying exclusively on the institutional sector of employment. This could be done, using the mechanisms already in place, through personal income tax (IRPF) and include both capital and labor incomes.
In fact, all payers of the COVID-19 Emergency Tax also paid the main direct taxes in Uruguay: the Impuesto a la Renta de las Personas Físicas (IRPF) and the Impuesto a la Asistencia de la Seguridad Social (IASS) on pensions. The IRPF is a dual tax on residents’ labor and capital income.Footnote 8
Methodological aspects
Data
Our analysis is based on representative household survey data from the National Household Survey of Uruguay, collected by INE, for the years 2019, 2020, and 2021.Footnote 9 The survey is nationally representative and contains detailed information about personal and household characteristics, as well as detailed data on labor and nonlabor income, contributory and noncontributory pensions, and cash transfers, among other things. Both pension and labor incomes are collected in net terms (after direct taxes). As in many countries, the COVID-19 outbreak affected survey data collection and in-person surveys were replaced by phone surveys from March 2020 to July 2021. This implied a significant reduction in the length of the questionnaire, but the survey was still able to provide adequate information about the labor market situation and income during the whole period.Footnote 10 At the same time, methodological changes were implemented, as the survey moved from a cross-sectional design to a rotating panel, but this does not affect cross-sectional comparisons (see INE 2022).
An important aspect of the household survey is its ability to capture the payment of extra conditional cash transfers associated with COVID-19. The household survey identifies the beneficiaries of cash transfers, both TUS and AFAM, and the amounts received via each.Footnote 11 The analysis of the amounts collected in the survey shows no variation in 2020 and 2021 with respect to 2019. This may be because families were not able to identify the increase in transfers, which was announced month by month and was not constant over time. It may also be due to problems in the quality of the survey data. If we impute the income corresponding to the transfers in each month during the three years, according to the design rules of the programs and the COVID-19 supplements, there is a significant difference from the amounts reported by the survey (Figure 5). During 2019 and in months when no COVID-19 complements were paid, the imputed amounts coincide with the figures collected by the household survey. With this analysis, and given that our main objective is to analyze the impacts on poverty and inequality of the measures implemented to address COVID-19, including cash transfers, we opted to construct a new vector of household income. This vector is essentially the same as the one reported in the household survey, but instead of taking the transfer amounts collected in the survey, which in our view does not appropriately reflect the COVID-19 supplements, it considers the imputed TUS and AFAM amounts. This is the baseline household income in our analysis.
Comparison of reported vs. imputed average cash transfers.
Notes: Based on Uruguayan household surveys (ECH). Reported amounts from household survey responses. Imputed amounts calculated based on program rules and COVID-19 supplements. Includes TUS (Tarjeta Uruguay Social) and AFAM (Asignaciones Familiares) transfers. Amounts in constant Uruguayan pesos.

In the case of the emergency food baskets, however, we consider the values collected by the household survey. It is important to note that a household may receive more than one of these baskets, due to the design of the program.
As mentioned, the Uruguayan household survey does not have information about direct taxes and contributions. To analyze the effects of the COVID Emergency Tax, which is levied on nominal remuneration and pensions, we estimate the contributions paid by employers and employees, as well as pensioners, to reconstruct the taxable income and simulate the COVID Emergency Tax. We assume that workers, who do not contribute to the social security system, do not pay direct taxes.
Method
This research is based on a static microsimulation approach, and so constitutes a partial equilibrium analysis. This study employs an independently developed static microsimulation model, programmed specifically for Uruguay’s tax-benefit system.Footnote 12 Microsimulation models apply the main rules that define the tax and benefit system to each household in a representative sample of the population (household survey). Besides showing the redistributive impact of the existing systems, these models allow us to assess the redistributive impacts of reforms on taxes and/or benefits. We apply the Uruguayan tax and benefit rules to the Uruguayan household survey for the years 2019, 2020, and 2021.
The modeling of Uruguay’s income tax system required reconstructing gross incomes from the net amounts reported in the household survey. We estimated gross labor income by applying the inverse of the tax and social security contribution schedules to reported net incomes, using iterative calculations to account for the progressive tax structure. For the COVID Emergency Tax, we identified eligible taxpayers based on employment sector (public workers and pensioners with gross monthly income above $U120,000, excluding health workers) and applied the corresponding progressive rates for the specified periods. Given that the COVID Emergency Tax was levied only for specific months (two months in 2020 and two months in 2021), whereas the household survey data represent annual income, we applied a temporal adjustment to accurately reflect the limited duration of this tax. For eligible taxpayers, we calculated the monthly tax liability based on their reported monthly gross income and applied this tax only for the months when the emergency tax was in effect. The annual impact was then calculated by summing the tax payments across the relevant months while leaving the remaining months untaxed. This approach ensures that our estimates reflect the actual temporal implementation of the policy rather than incorrectly applying the tax across the entire year, which would overestimate its distributional impact.
We reconstruct two vectors of income, market income (
 $Y_h^{market}$
) and disposable income
 ${\rm{\;}}(Y_h^{dis{\rm{\;}}})$
, defined as follows:
 $$Y_h^{dis}=Y_h^{market} - \left(\sum\nolimits_i {{T_i}} + \sum\nolimits_i {T_i^{Covid}} \right) + \left( {\;\sum\nolimits_i {{B_i}} + \sum\nolimits_i {B_i^{Covid}} } \right),$$
where
 $\sum\nolimits_i {{T_i}} $
represents regular direct taxes paid by members i of household h (IASS and IRPF),
 $\sum\nolimits_i {T_i^{Covid}} $
represents COVID-19-related taxes (COVID Emergency Tax),
 $\sum\nolimits_i {{B_i}} $
represents regular benefits received by household members (standard cash transfers and unemployment insurance), and
 $\sum\nolimits_i {B_i^{Covid}} $
represents COVID-related benefit modifications (transfer supplements, emergency food baskets, and COVID-19 unemployment benefits). For 2019, all COVID-19-related components (
 $\sum\nolimits_i {T_i^{Covid}} $
and
 $\sum\nolimits_i {B_i^{Covid}} $
) equal zero.
To reflect the impact of social benefits on poverty and extreme poverty incidence, we compute the traditional poverty measures based on disposable income and recalculate them assuming that each of the benefits was zero. For the poverty analysis, we use the official national poverty and extreme poverty lines as defined by INE (2006). Uruguay employs household-composition-adjusted poverty lines that vary according to household size, as well as geographic location (urban vs. rural areas), reflecting different consumption needs and cost structures. The poverty line represents the cost of a basic basket of goods and services needed to meet minimum living standards, whereas the extreme poverty (indigence) line represents the cost of a basic food basket required for survival. Expressed in per capita terms, the average poverty line was equivalent to approximately US$427 per month at 2019 purchasing power parity (PPP), whereas the extreme poverty line averaged approximately US$137 per month at 2019 PPP across the analysis period (INE 2006). The COVID Emergency Tax is not considered in the poverty analysis, as it only affects higher-income households.
To analyze the progressivity of each intervention, we display concentration curves. To consider the redistributive impact of the interventions, we calculate the marginal effect of each tax and transfer, by recalculating the Gini index and excluding the analyzed instrument from the income vectors. In this way, we decompose the total redistributive action during 2020 and 2021 into the part that is due to the precrisis tax-benefit program that Uruguay had and the part that is due to COVID-19-related emergency measures.
Main results
Changes in household income, poverty and indigence
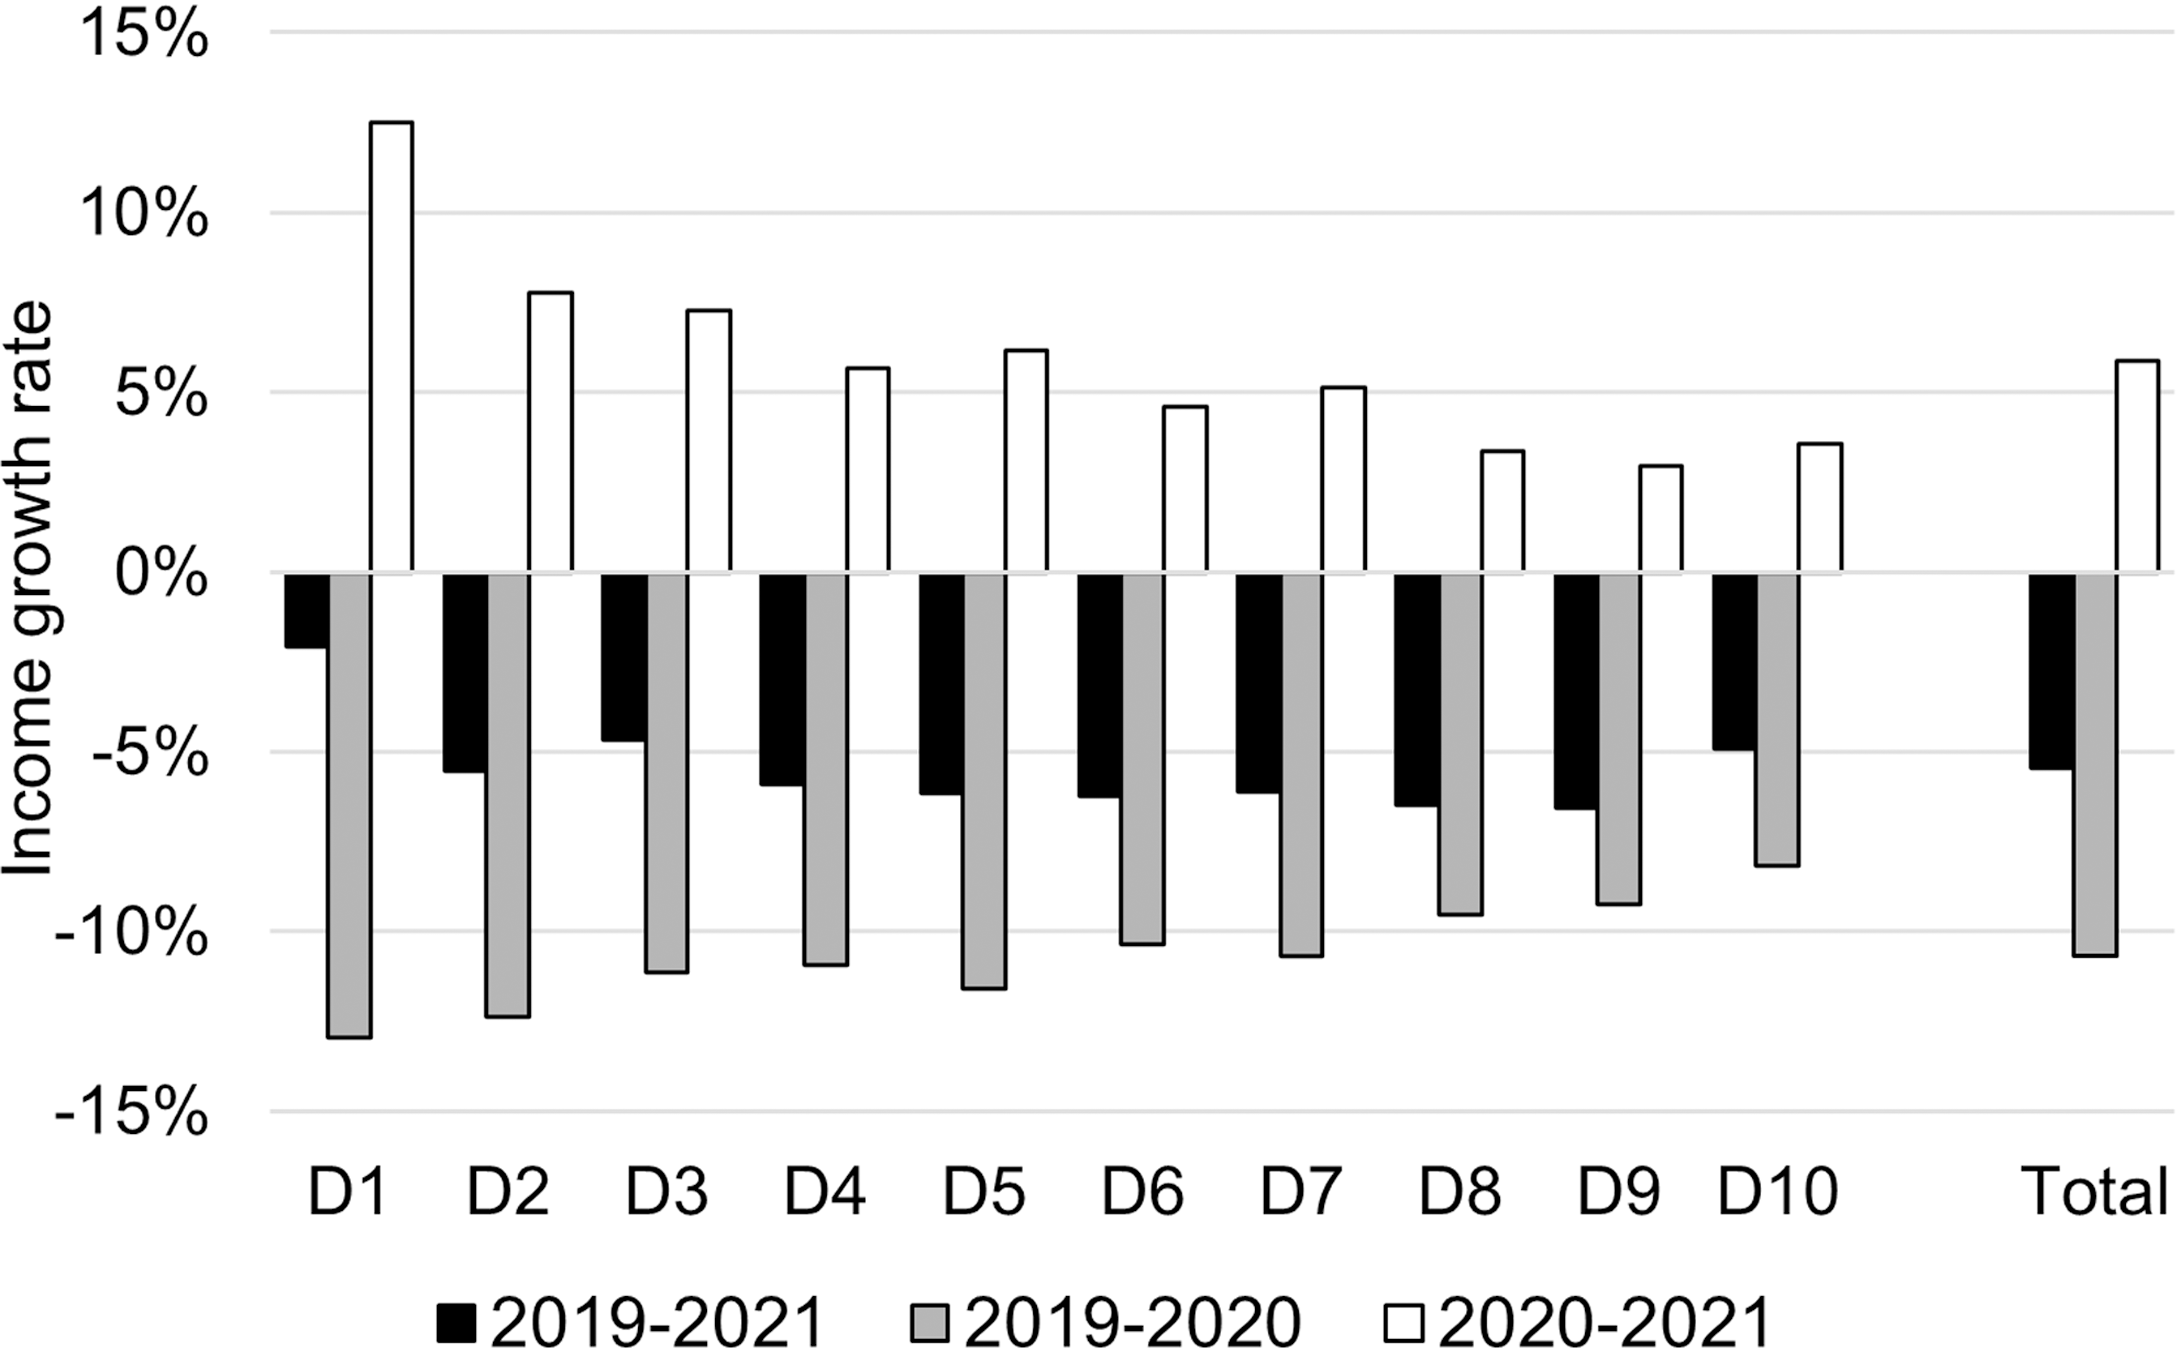
Between 2019 and 2020, the decline in (per capita) household disposable income was higher, in relative terms, for households at the lower part of the distribution, as shown in Figure 6, which presents changes in household income by income decile. Household income recovered during 2021, and recovery was stronger for households in the lower deciles. Comparing 2019 and 2021, the decline in household income was rather similar along the income distribution, except in the first decile, which presented a lower decline. Therefore, poverty and inequality increased during 2020 but figures improved during 2021, although they did not return to pre-COVID-19 levels (Figure 6 and Table 1).Footnote 13 Previous results for Ecuador (Jara et al. Reference Jara, Montesdeoca and Tasseva2021), Colombia (Corredor et al. Reference Corredor, Ríos and Rodríguez2021), and Argentina, Brazil, Colombia, and Mexico (Lustig et al. Reference Lustig, Pabon, Sanz and Younger2023) found that the middle strata experienced the greatest loss of income.
Changes in per capita household disposable income, by income decile.
Notes: Based on Uruguayan household surveys (ECH). Growth rates calculated as percentage change from previous year. Negative values indicate income decline. Deciles based on per capita disposable income in base year.

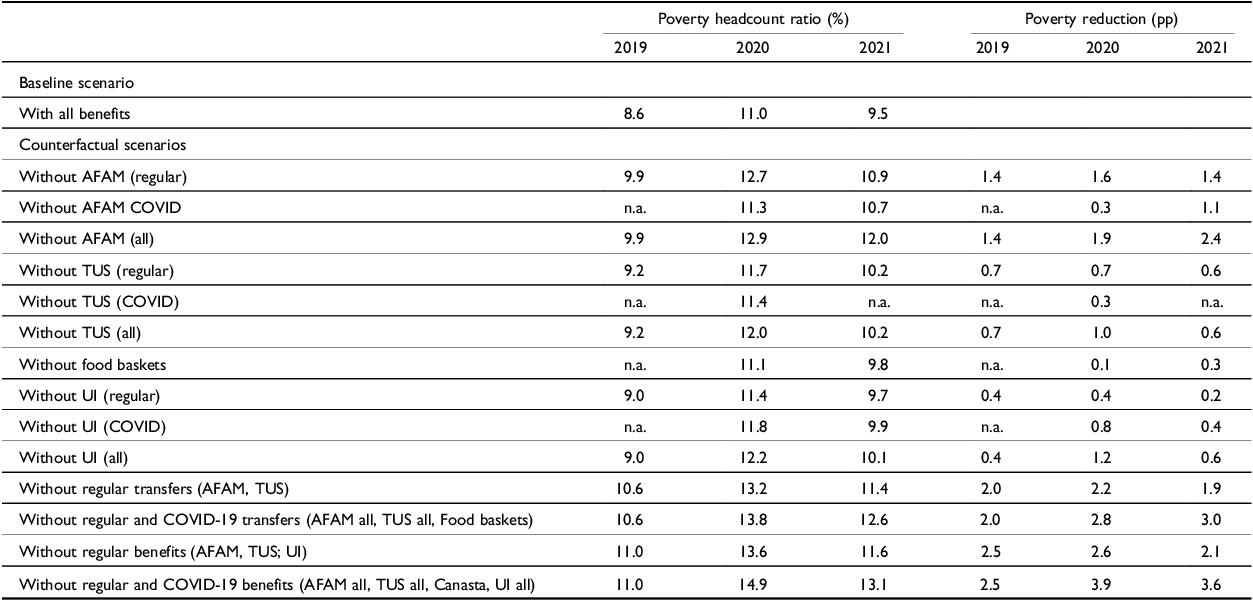
Impact of social protection benefits on poverty incidence (all households).

Table 1. Long description
A table comparing the impact of social protection benefits on poverty incidence across different scenarios and years. The table has 16 rows and 6 columns. The columns are labeled Poverty headcount ratio (%) for the years 2019, 2020, and 2021, and Poverty reduction (pp) for the years 2019, 2020, and 2021. The rows are labeled with different scenarios, including a baseline scenario and various counterfactual scenarios without specific benefits. Row 1: Baseline scenario, With all benefits, 8.6, 11.0, 9.5,, , . Row 2: Counterfactual scenarios, Without AFAM (regular), 9.9, 12.7, 10.9, 1.4, 1.6, 1.4. Row 3: Without AFAM COVID, n.a., 11.3, 10.7, n.a., 0.3, 1.1. Row 4: Without AFAM (all), 9.9, 12.9, 12.0, 1.4, 1.9, 2.4. Row 5: Without TUS (regular), 9.2, 11.7, 10.2, 0.7, 0.7, 0.6. Row 6: Without TUS (COVID), n.a., 11.4, n.a., n.a., 0.3, n.a. Row 7: Without TUS (all), 9.2, 12.0, 10.2, 0.7, 1.0, 0.6. Row 8: Without food baskets, n.a., 11.1, 9.8, n.a., 0.1, 0.3. Row 9: Without UI (regular), 9.0, 11.4, 9.7, 0.4, 0.4, 0.2. Row 10: Without UI (COVID), n.a., 11.8, 9.9, n.a., 0.8, 0.4. Row 11: Without UI (all), 9.0, 12.2, 10.1, 0.4, 1.2, 0.6. Row 12: Without regular transfers (AFAM, TUS), 10.6, 13.2, 11.4, 2.0, 2.2, 1.9. Row 13: Without regular and COVID-19 transfers (AFAM all, TUS all, Food baskets), 10.6, 13.8, 12.6, 2.0, 2.8, 3.0. Row 14: Without regular benefits (AFAM, TUS, UI), 11.0, 13.6, 11.6, 2.5, 2.6, 2.1. Row 15: Without regular and COVID-19 benefits (AFAM all, TUS all, Canasta, UI all), 11.0, 14.9, 13.1, 2.5, 3.9, 3.6.
Notes: Based on Uruguayan household surveys (ECH). Shows poverty headcount ratios with and without specific social protection benefits. Regular transfers include standard AFAM (Asignaciones Familiares) and TUS (Tarjeta Uruguay Social) programs. COVID-19 transfers include AFAM and TUS supplements and food baskets (Canasta de Emergencia). Regular benefits include regular transfers plus standard unemployment insurance. COVID-19 benefits include COVID-19 transfers plus extended unemployment insurance. UI stands for Unemployment Insurance. Each row excludes only the indicated benefit while including all other benefits in the calculation. N.a. = program not implemented in that year. Poverty reduction calculated as the difference between each counterfactual scenario (without the specified program) and the baseline scenario (with all programs).
Both in 2020 and 2021, social protection benefits alleviated pressure on household budgets, reinforcing the role of traditional cash transfers. Figure 7 presents the composition of household income separating pre-COVID-19 benefits and benefits implemented due to COVID-19. The powerful role of the preexisting benefits in the lower part of the distribution, and the weak reinforcement through COVID-19 measures, is depicted.
Social protection benefits as share of per capita household disposable income, by income percentiles.
Notes: Based on Uruguayan household surveys (ECH). Figure shows social protection benefits as a percentage of total household disposable income across the income distribution. Pre-COVID-19 benefits include regular AFAM and TUS transfers plus standard unemployment insurance. COVID-19 benefits include transfer supplements, emergency food baskets (Canasta de Emergencia), and expanded unemployment insurance. Figure does not show wages, pensions, or capital income components.

To reflect the impact of the different measures adopted, we depart from poverty and indigence incidence, measured by disposable household income, and recalculate poverty and indigence rates deducting benefits (cash transfers, food baskets, and unemployment insurance) one by one. We consider the separate effects of the existing programs and the modifications due to COVID-19. Table 1 and Figure A3 in the appendix show the main results of this analysis for all households.
If we consider the regular components of the benefit system, the main effect on poverty is due to AFAM. The regular transfer allows for the poverty incidence to decrease by around 1.6 pp. The supplements imply an additional 0.3-pp deduction in 2020, climbing to 1.1 in 2021 when the design of the supplement was changed and an additional supplement for children aged zero to three was given, as discussed in the previous section.
The effect of the regular TUS transfer on poverty incidence is lower, as it is targeted at more vulnerable households, whose income is furthest from the poverty threshold. In this case, the effect is 0.7 pp in 2020 and 0.6 in 2021, with an additional 0.3 pp in 2020 thanks to the supplemental value, which was not implemented in 2021. An even smaller decline than the one obtained by the supplemental TUS is achieved through the food basket, which implies a 0.1 and 0.3 pp decline in poverty in 2020 and 2021, respectively, underlining the negligible effects of this COVID-19 transfer due to the low amounts involved. The effect of the traditional unemployment insurance payment is around 0.4 pp in 2020, but the modifications to this program due to COVID-19 significantly boosted the poverty impact of this benefit, suggesting a reduction of an additional 0.8 and 0.4 pp in 2020 and 2021. This means that, considering the benefits globally, the major impact on poverty incidence was obtained through AFAM, although the flexibility of unemployment insurance had a relevant effect, especially in 2020.
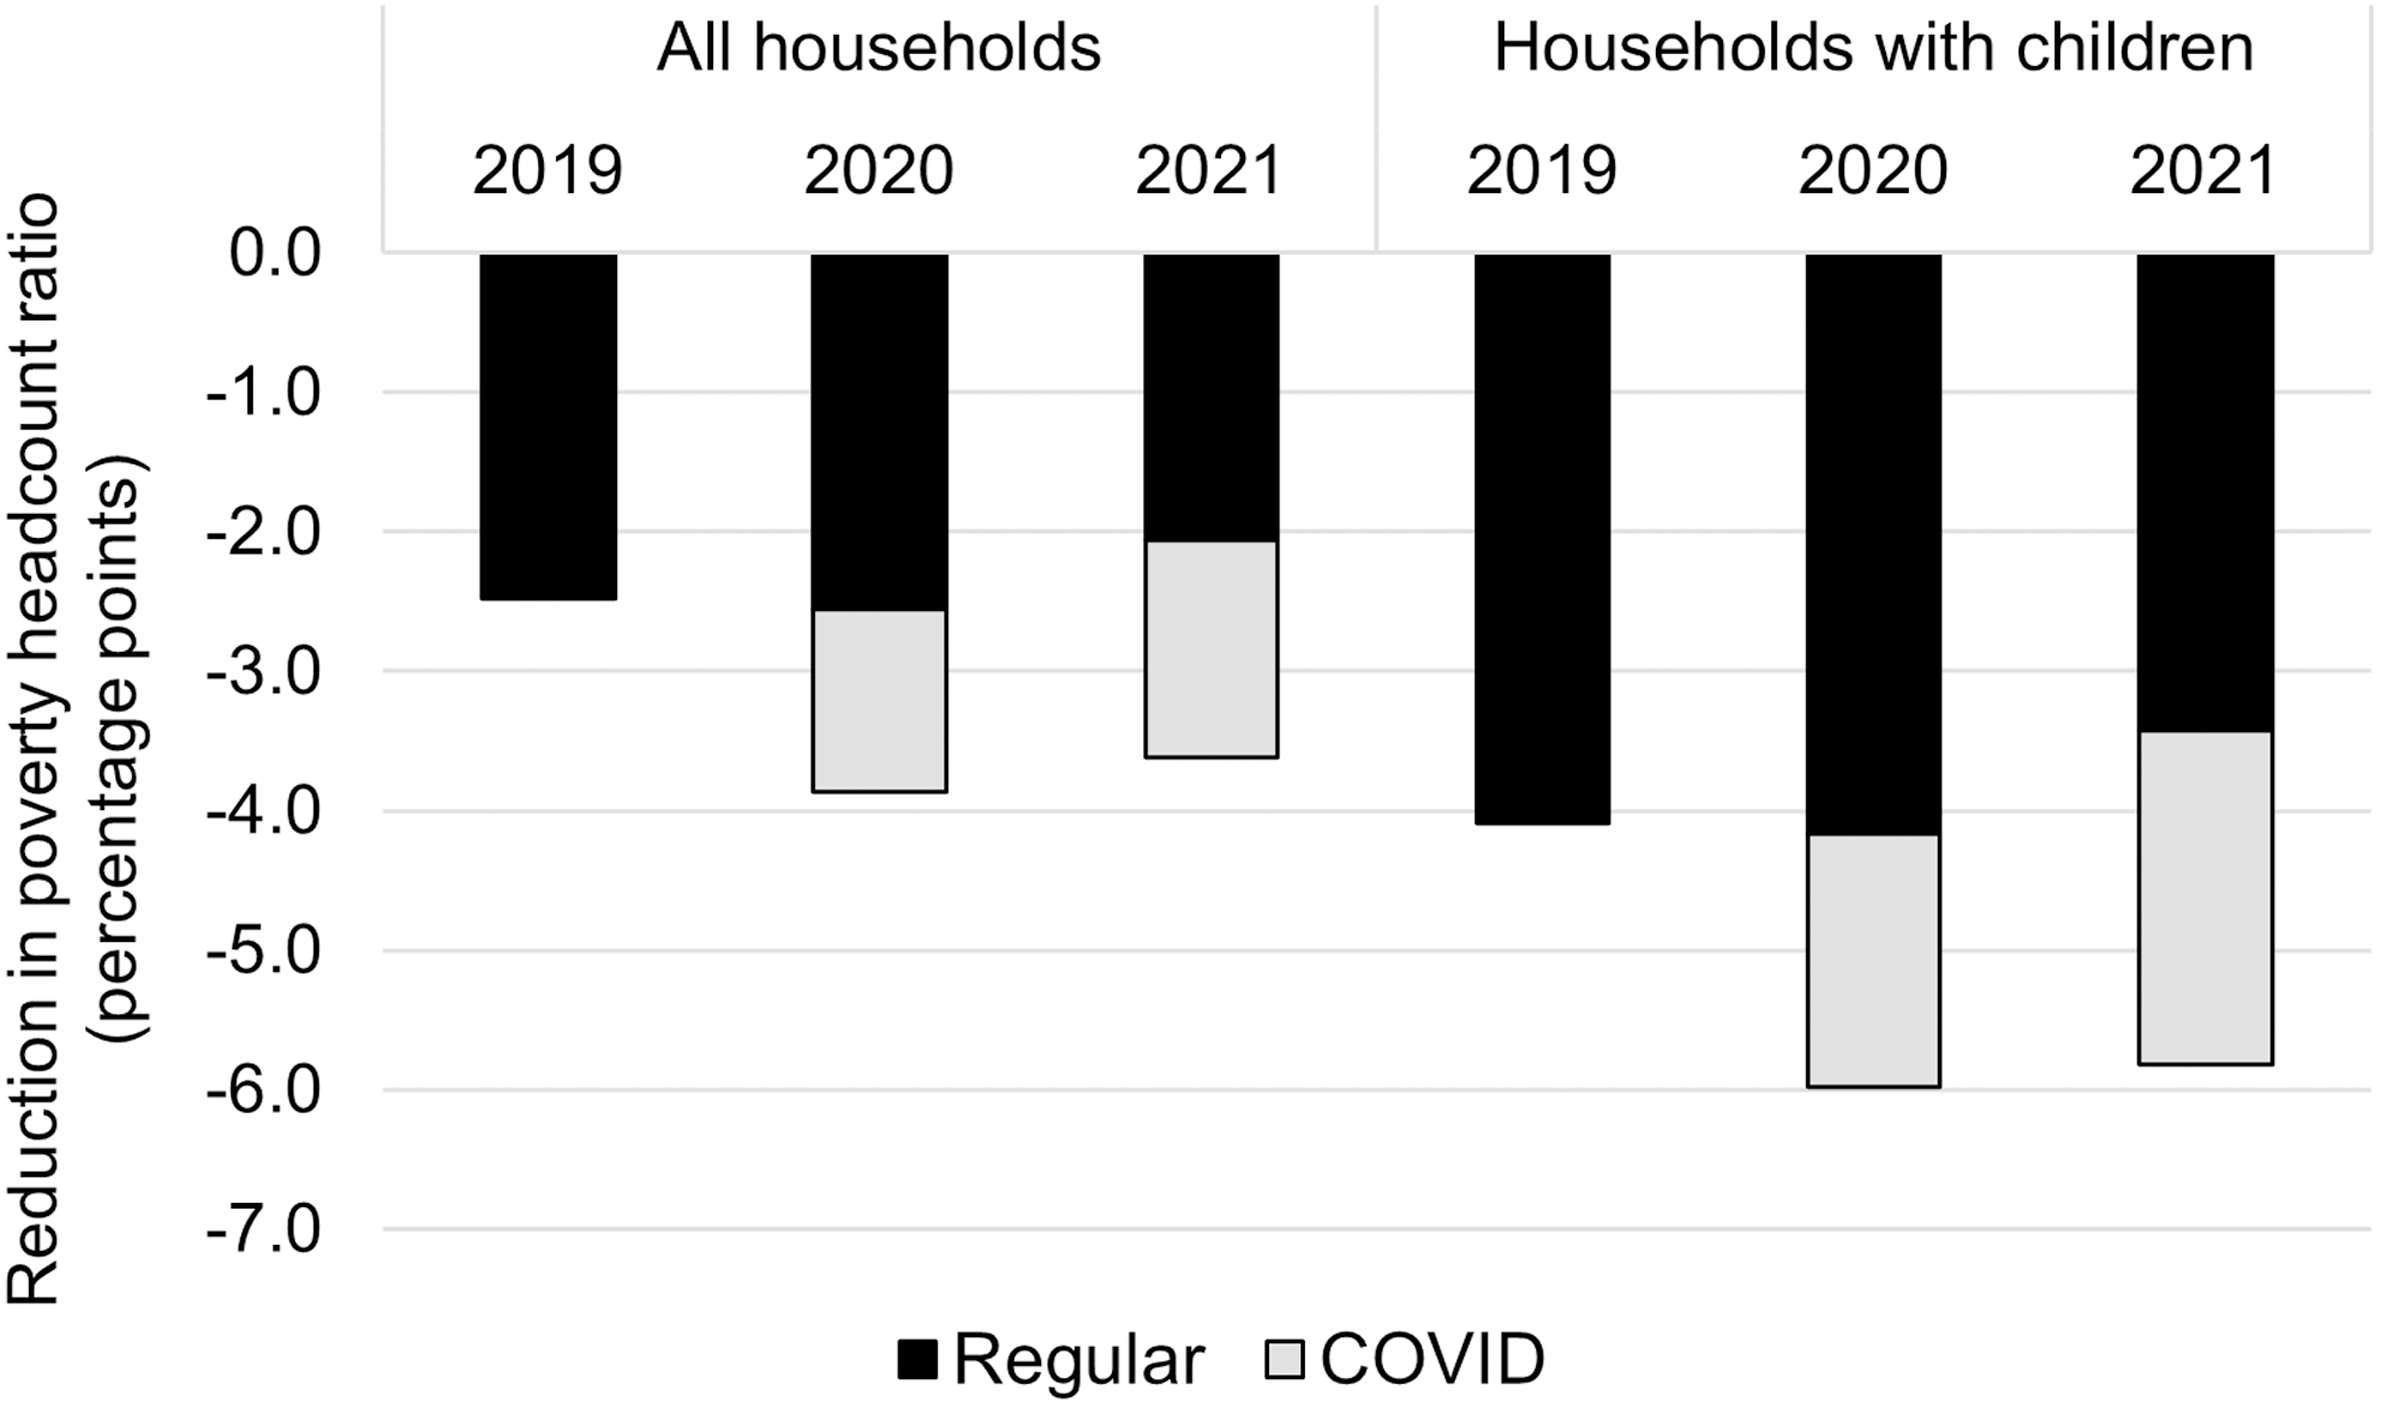
In summary, without any social protection, poverty would have reached 14.9 percent in 2020 and 13.1 percent in 2021, compared to the observed rates of 11.0 percent and 9.5 percent with the full system in place. Preexisting social protection programs (regular transfers and unemployment insurance) accounted for reductions of 2.6 and 2.1 pp in 2020 and 2021, respectively. The modifications introduced to face COVID-19 provided an additional reduction of 1.3 pp in 2020 and 1.5 pp in 2021, demonstrating how emergency measures complemented the existing social protection framework during the crisis. These results are consistent with Rodríguez et al. (Reference Rodríguez, Jara, Dondo, Arancibia, Macas Romero, Riella, Urraburu, Jouste, Kanbur, Pirttilä and Rattenhuber2025), who found that for Uruguay, COVID-19 emergency policies provided cushioning effects primarily for households at the bottom of the distribution during 2020, though our extended analysis through 2021 reveals the sustained and evolving impact of these measures.
If we restrict the analysis to households with children (Table A4 and Figure A4 in the Appendix), the effect of AFAM is higher, especially in 2021. It is important to remember that poverty in Uruguay has a clearly defined profile, with a high concentration of households with children (Colacce and Tenenbaum Reference Colacce and Tenenbaum2016; De Armas Reference De Armas2017). Again, AFAM is the main COVID-19 measure in terms of impact on poverty, but the unemployment benefits also played a role for these households. If no modifications had been undertaken in social protection as a response to COVID-19, poverty would have been 1.8 and 2.4 pp higher among households with children in 2020 and 2021, respectively. In comparative terms, this effect with COVID-19 measures is an intermediate result when compared with regional results (see Figure 2) and a meager one when compared with results in the developed world.
Uruguay’s extremely low indigence rates throughout the study period reflect the country’s relatively developed social protection system compared to regional standards. While Table A5 and Figure A5 present the technical impact of different benefits on extreme poverty, the near-zero baseline levels limit the analytical significance of these comparisons. The fact that indigence remained minimal even during the COVID-19 crisis demonstrates the effectiveness of Uruguay’s existing social safety net in preventing the most severe forms of deprivation. Although all programs showed some effect on extreme poverty, results should be interpreted cautiously, given the very small base rates from which changes are calculated.
The global effects of the additional COVID-19 benefits were moderate for all households in terms of poverty reduction and had a slighter higher impact when we restrict the analysis to households with children (Figure 8).
Poverty reduction effect of social protection benefits.
Notes: Based on Uruguayan household surveys (ECH). Shows the reduction in poverty incidence when social protection benefits are included versus excluded from household income. Regular benefits include preexisting cash-transfer programs and unemployment insurance. COVID-19 benefits include pandemic-related transfer supplements, emergency food assistance, and expanded unemployment insurance programs implemented during the crisis.

Progressivity of benefits and taxes and redistributive impact
The redistributive impact of each instrument will depend on the progressive character of the instrument, population coverage, and the amount involved. As Figure 9 shows, all the benefits that we are considering are progressive, as their concentration curves lie above the pretransfer Lorenz curve, indicating that benefits as a share of pretransfer income decline with income. Moreover, all transfers (TUS, AFAM, and the food baskets) are pro-poor, as their concentration curves lie above the diagonal, TUS being the most pro-poor transfer and food baskets the least. This means that the benefit declines with pretransfer income in absolute terms (and not only as a share). The unemployment insurance benefit, in turn, is progressive but not pro-poor.
Concentration curves for social protection benefits.
Notes: Based on Uruguayan household surveys (ECH). Benefits are progressive when the concentration curve lies above the pretransfer Lorenz curve. Benefits are pro-poor when concentration curve lies above the 45-degree line (diagonal). AFAM = Asignaciones Familiares; TUS = Tarjeta Uruguay Social; UI = Unemployment Insurance; Population ranked by household disposable income excluding the analyzed benefit.

Figure 9. Long description
The image contains four concentration curves, each representing different social protection benefits for households with children in 2020 and 2021. Panel A shows the concentration curves for 2020 transfers, while Panel B shows the concentration curves for 2021 transfers. Panel C displays the concentration curves for 2020 unemployment insurance benefits, and Panel D shows the concentration curves for 2021 unemployment insurance benefits. Each panel includes multiple lines representing different types of benefits: household income without benefits, regular AFAM, COVID AFAM, regular TUS, COVID TUS, and food baskets for Panels A and B; household income without benefits, regular unemployment insurance, and COVID unemployment insurance for Panels C and D. The x-axis in each panel represents the cumulative percentage of households, ranging from 1 to 100 percent. The y-axis represents the cumulative percentage of benefits received, also ranging from 0 to 100 percent. The red diagonal line in each panel represents the line of equality, where each decile of the population receives an equal share of the benefits. The curves above the red line indicate that the benefits are concentrated among the poorer segments of the population. The curves for regular AFAM, COVID AFAM, regular TUS, and COVID TUS in Panels A and B show that these benefits are more concentrated among the poorer households compared to household income without benefits. Similarly, the curves for regular unemployment insurance and COVID unemployment insurance in Panels C and D indicate that these benefits are also more concentrated among the poorer households. The food baskets in Panel A and B show a similar pattern of concentration among the poorer households. The trends in the curves suggest that the social protection measures implemented during the COVID-19 pandemic had a significant impact on reducing poverty among households with children.
Concerning taxes, all direct taxes are globally progressive, as the concentration curve lies below the pretax Lorenz curve, and the COVID Emergency Tax is more progressive (Figure 10).
Concentration curves for direct taxes.
Notes: Based on Uruguayan household surveys (ECH). Taxes are progressive when the concentration curve lies below the pretax Lorenz curve. IRPF = personal income tax; IASS = social security contribution tax on pensions. COVID Emergency Tax applied to high-income public workers and pensioners for limited periods. Population ranked by household income before taxes.

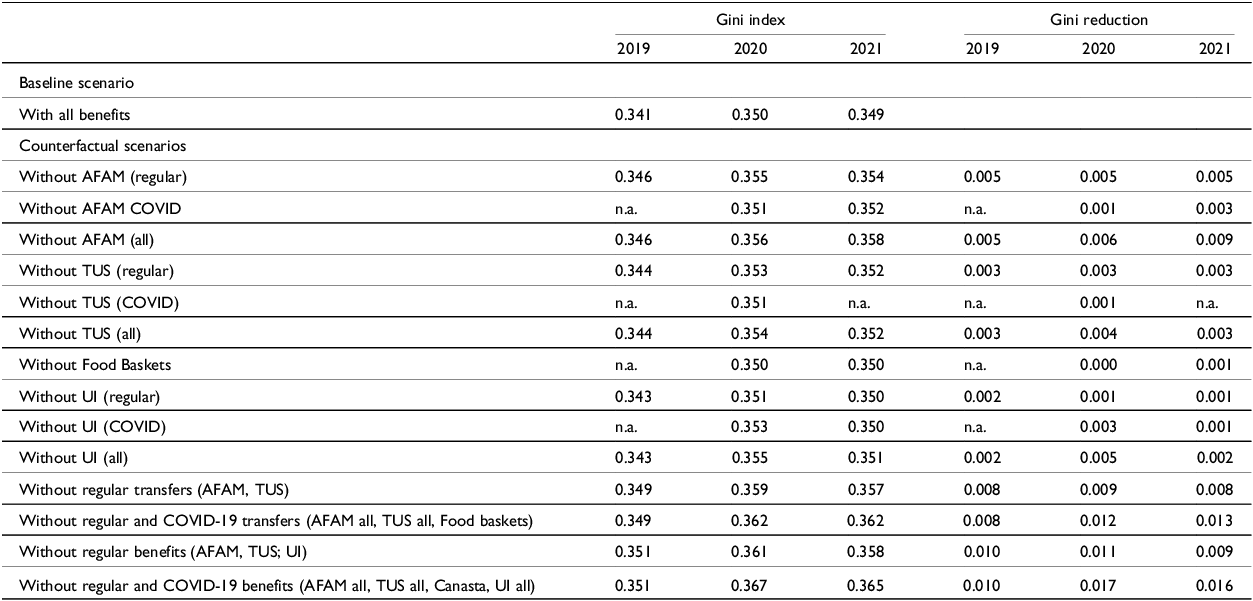
To measure the redistributive impact of each instrument, we calculate its marginal contribution to inequality reduction. This marginal contribution is the difference between the Gini index calculated on household disposable income with all benefits and taxes included, and the Gini index calculated excluding the specific benefit (or including the tax) that we are analyzing. Direct taxes have a significant redistributive effect, leading to decreases in inequality of around 3 pp, mainly through IRPF and IASS. The COVID Emergency Tax does not change income distribution indicators, primarily because it was applied to a small group of workers and for very limited periods.
The higher marginal contribution is given by the action of AFAM, which in regular times implies a reduction of around half a percentage point in the Gini index. During COVID-19 this effect climbed to 0.6 in 2020 and 0.9 in 2021 (see Table 2), when the pilot program for smaller children was implemented. TUS also had a nearly half-point impact on the Gini index in 2020, when the supplemental transfer was introduced. The marginal contribution of the unemployment insurance program was doubled thanks to the COVID-19 modifications. During 2020 it implied an equalizing effect of half a percentage point on the Gini index. Taken together, the modifications to the social protection system introduced during the COVID-19 crisis prevented the Gini index from increasing by an additional 0.6–0.7 percentage points.
Redistributive impact of fiscal instruments on income inequality.

Table 2. Long description
A table comparing the Gini index and Gini reduction across different scenarios and years. The table has 16 rows and 6 columns. The columns are labeled as follows: Gini index for the years 2019, 2020, and 2021, and Gini reduction for the years 2019, 2020, and 2021. The rows are labeled with different scenarios, including a baseline scenario and various counterfactual scenarios without specific benefits or transfers. Row 1: Baseline scenario, With all benefits, Gini index: 0.341, 0.350, 0.349, Gini reduction: empty, empty, empty. Row 2: Counterfactual scenarios, Without AFAM (regular), Gini index: 0.346, 0.355, 0.354, Gini reduction: 0.005, 0.005, 0.005. Row 3: Without AFAM COVID, Gini index: n.a., 0.351, 0.352, Gini reduction: n.a., 0.001, 0.003. Row 4: Without AFAM (all), Gini index: 0.346, 0.356, 0.358, Gini reduction: 0.005, 0.006, 0.009. Row 5: Without TUS (regular), Gini index: 0.344, 0.353, 0.352, Gini reduction: 0.003, 0.003, 0.003. Row 6: Without TUS (COVID), Gini index: n.a., 0.351, n.a., Gini reduction: n.a., 0.001, n.a. Row 7: Without TUS (all), Gini index: 0.344, 0.354, 0.352, Gini reduction: 0.003, 0.004, 0.003. Row 8: Without Food Baskets, Gini index: n.a., 0.350, 0.350, Gini reduction: n.a., 0.000, 0.001. Row 9: Without UI (regular), Gini index: 0.343, 0.351, 0.350, Gini reduction: 0.002, 0.001, 0.001. Row 10: Without UI (COVID), Gini index: n.a., 0.353, 0.350, Gini reduction: n.a., 0.003, 0.001. Row 11: Without UI (all), Gini index: 0.343, 0.355, 0.351, Gini reduction: 0.002, 0.005, 0.002. Row 12: Without regular transfers (AFAM, TUS), Gini index: 0.349, 0.359, 0.357, Gini reduction: 0.008, 0.009, 0.008. Row 13: Without regular and COVID-19 transfers (AFAM all, TUS all, Food baskets), Gini index: 0.349, 0.362, 0.362, Gini reduction: 0.008, 0.012, 0.013. Row 14: Without regular benefits (AFAM, TUS, UI), Gini index: 0.351, 0.361, 0.358, Gini reduction: 0.010, 0.011, 0.009. Row 15: Without regular and COVID-19 benefits (AFAM all, TUS all, Canasta, UI all), Gini index: 0.351, 0.367, 0.365, Gini reduction: 0.010, 0.017, 0.016.
Notes: based on Uruguayan household surveys (ECH). Shows Gini index values with and without specific fiscal instruments. Regular transfers include standard AFAM (Asignaciones Familiares) and TUS (Tarjeta Uruguay Social) programs. COVID-19 transfers include AFAM and TUS supplements and food baskets (Canasta de Emergencia). Regular benefits include regular transfers plus standard unemployment insurance. COVID-19 benefits include COVID-19 transfers plus extended unemployment insurance. UI = Unemployment Insurance. Each row excludes only the indicated benefit while including all other benefits in the calculation.
Final comments and discussion
The outbreak of COVID-19 impacted economic activity around the world, and countries were faced with the urgent need to implement responses to protect the population. In the case of Uruguay, these responses were operationalized mainly through an increase in the amounts of existing transfers, less demanding conditions of entry to unemployment insurance, and the creation of a new, low-value benefit for people who were not entitled to social assistance or social security and were not formal workers.
The existing conditional cash transfers cannot act as automatic stabilizers in a situation like the COVID-19 pandemic, due to their design, consistent with the broader regional pattern identified by Bargain et al. (Reference Bargain, Jara and Tasseva2024) by which proxy means-tested transfers fail to provide automatic stabilization. To provide immediate support to affected households, an adjustment of the eligibility rules would have been needed. This was not the path followed by the Uruguayan government, which opted to increase benefits to pre-COVID-19 beneficiaries and to implement a new program. The alternative could have been a temporary expansion of the existing cash transfers to members of the population who proved vulnerable. This could, for example, have included households with scores somewhat higher than the cutoff point of the transfer proxy means test, households that had recently lost the transfer due to noncompliance with conditions, or households whose adolescents had reached the age of eighteen. In principle, these alternatives could have been implemented by using the information contained in the programs’ administrative records. New applications for existing cash transfers could also have been opened.
This alternative reaction would have meant allocating more resources to fight COVID-19, as the average amount of the cash transfers, especially in the case of AFAM, was higher than the cost of the emergency food basket finally implemented to reach those outside the coverage of social assistance. The resources implied by each option are very different. Additionally, extending the coverage of pre-COVID-19 transfers would probably have entailed a more complex political dimension, as the phasing out of such an expansion could have been resisted more strongly than the closing of a new program clearly announced as temporary.
The implementation of an income tax for public workers (but not private workers) with higher salaries and on high-income pensioners also calls into question the social acceptability of such fiscal plans. The fact that the public sector (excluding some essential services and, of course, health workers) immediately switched to teleworking may have been a compensating factor, contributing to the acceptance of the measure by the population in general and neutralizing the opposition of public workers. The absence of public discussion of this measure or its distributive justice is consistent with the idea that the social acceptability of alternative tax and transfer plans is much more culture- and context-specific than the conventional economic rationale linked to efficiency and equity, as discussed by Kanbur and Levy (Reference Kanbur and Levy2022). The taxation only of high-wage public workers (and high-income pensioners) took place in a country context where public-sector productivity is frequently questioned. In addition, the government in power had a liberal orientation and a favorable view of a limited role for the state and the public sphere. The idea that the resources would go toward a worthy cause, such as the urgent fight against COVID-19, may also have contributed to the measure’s acceptance. All these contextual elements help us understand the path taken by the Uruguayan government in response to COVID-19.
Our findings complement and extend those of Rodríguez et al. (Reference Rodríguez, Jara, Dondo, Arancibia, Macas Romero, Riella, Urraburu, Jouste, Kanbur, Pirttilä and Rattenhuber2025), who analyzed Uruguay alongside six other Latin American countries using actual 2020 household survey data. Both studies find that COVID-19 emergency policies provided important protection for households at the bottom of the distribution while automatic stabilizers played a limited role. Our analysis, covering both 2020 and 2021 with actual survey data, confirms their findings for 2020 and reveals how policy effects evolved through 2021. Both studies also point to the limited capacity of automatic stabilizers in Uruguay’s social protection system.
It is important to note that our microsimulation analysis captures only the direct tax-benefit components of Uruguay’s broader COVID-19 response. As documented by Bucacos et al. (Reference Bucacos, Carballo, Mello and Ponce2022), the government implemented additional measures including credit guarantees, monetary policy actions, and regulatory changes that likely had complementary effects on household welfare through employment preservation and business continuity. Our estimates should therefore be interpreted as the contribution of direct fiscal measures within this larger policy framework.
The fiscal efforts of the Uruguayan government were not enough to prevent poverty from increasing, but they attenuated its impacts. Our results indicate that Uruguay’s enhanced social protection system, which combined existing programs with COVID-19 modifications, prevented poverty from increasing by 2.8 and 3.7 percentage points in 2020 and 2021, respectively, with greater effects on households with children. This total protective effect demonstrates the government’s comprehensive effort during the pandemic, where COVID-19 enhancements (contributing 1.3 and 1.6 pp) built on and amplified the ongoing protection provided by traditional programs such as AFAM and unemployment insurance. In terms of the equalizing effects of these new social protection measures, they impeded an additional increase of the Gini coefficient of more than half a percentage point. The COVID Emergency Tax, which was progressive but implied severe horizontal inequalities, did not have any distributive effect, as it was collected for only four months. In summary, Uruguay’s integrated approach (enhancing existing social protection rather than creating entirely new programs) proved effective in cushioning the pandemic’s impact. While the total protective effects were positive in terms of poverty alleviation and prevention of increases in inequality, they were insufficient to fully offset the crisis’s negative effects.
Beyond the specific Uruguayan context, our study contributes to broader international research on welfare systems and crisis response. Our findings on the interaction between existing social protection systems and emergency measures offer insights relevant to comparative welfare state analysis and emergency preparedness planning. The evidence that preexisting institutional capacity facilitates rapid policy deployment has implications for countries designing resilient social protection systems that can respond to unexpected shocks.
Supplementary material
The supplementary material for this article can be found at https://doi.org/10.1017/lar.2026.10146.









 Open access

