1. Introduction
Graphical models are very useful to decompose probability distributions over a multidimensional space. Graph-based representations express the conditional dependence structure within the random variables or characterise groups of random variables as common factors. They are commonly used in Bayesian statistics and machine learning. Their popularity has grown in recent years due to the development of efficient algorithms for performing computationally intensive inference in high-dimensional models with applications ranging from causal inference, information extraction to speech recognition, natural language processing and computer vision. Numerous applications in actuarial science have recently emerged. Lin et al. (Reference Lin, Neil and Fenton2014) considered Bayesian networks (which are a particular case of graphical models) to perform convolution of loss distributions required to aggregate risk in the presence of common causal dependencies. Recently, Ramsahai (Reference Ramsahai2020) showed that some actuarial models in current practice can be expressed graphically to exploit the advantages of such an approach and concluded that the graphical models can be very useful for applications, e.g. in the modelling of home insurance property damage. Oberoi et al. (Reference Oberoi, Pittea and Tapadar2020) applied graphical models to simulate economic variables for the purpose of risk calculations over long time horizons. Chen et al. (Reference Chen, Cummins, Sun and Weiss2020) modelled interconnectedness in the US property and casualty reinsurance market with a network, both at the level of intra- and inter-group transactions. This shows that graphical dependence has a great potential to describe relationships in insurance studies.
The present paper aims at contributing to the literature on risk sharing when risks are dependent and their distributions can be efficiently summarised with graphical models. To this end, we use the conditional mean risk-sharing rule proposed by Denuit & Dhaene (Reference Denuit and Dhaene2012). According to this rule, each participant to an insurance pool contributes the conditional expectation of the loss brought to the pool, given the total loss experienced by the entire pool. This risk-sharing mechanism is regarded as beneficial by all risk-averse economic agents in the expected utility setting for choice under risk. If all the conditional expectations involved are non-decreasing functions of the total loss then the conditional mean risk sharing is Pareto-optimal. Denuit (Reference Denuit2019, Reference Denuit2020) demonstrated that conditional mean risk sharing is the appropriate theoretical tool to share losses in collaborative, or Peer-to-Peer (P2P) insurance schemes. More generally, it is an effective mechanism to distribute total losses amongst participants within an insurance pool.
Denuit & Robert (Reference Denuit and Robert2020a, Reference Denuit and Robert2021) established several attractive properties of the conditional mean risk-sharing rule. Denuit & Robert (Reference Denuit and Robert2020b) developed formulas of the conditional mean risk-sharing rule for multivariate risk distributions for which risks are no more independent. They considered three important cases: vectors of risks with absolutely continuous distributions, with discrete distributions or with zero-augmented distributions. They proved for the first and the third cases that the conditional mean risk-sharing rule is proportional to the ratio of the density function of the sum of the components of a multivariate weighted version of the vector of the risks and of the density function of the sum of the risks. Denuit & Robert (Reference Denuit and Robert2020b) noted that the distribution of the multivariate weighted version of the vector of the risks may belong to the same class of distributions as the vector of the risks, which is an interesting property for the computation of the conditional mean risk sharing rule. Several examples are discussed, including Liouville and infinitely divisible multivariate distributions, for which the conditional mean risk-sharing rules are linear in the total loss amount, as well as conditionally independent losses correlated by common latent factors in a multivariate mixture model. These examples, however, provide a limited number of dependence models that are not necessarily encountered in practice.
In this paper, we assume that the risks can be represented by zero-augmented random variables whose joint occurrences distributions and claim amount distributions are based on network structures and may be derived from graphical models. This corresponds to an individual risk model with dependent occurrences that are correlated according to the position of individual units in a graph. We focus more specifically on graphical models that have the same “stability” property as the previous examples considered in Denuit & Robert (Reference Denuit and Robert2020b), i.e. on graphical models for which the distribution of the multivariate weighted version of the vector of the risks (that appears in the conditional mean sharing rule formulas) may be characterised by a network structure belonging to the same family of graphical models as the vector of the risks.
More specifically, we assume that the random vectors of occurrences obey the Ising model. This multivariate Bernoulli distribution, named after the physicist Ernst Ising, consists a graph with nodes representing binary variables. Pairwise relationships amongst the nodes are described in terms of edges, which induce correlation in the statistical sense. This construction enjoys the pairwise Markov property in the sense that every pair of Bernoulli occurrence indicators is conditionally independent given all other variables if the associated nodes are not linked by an edge.
Severities remain independent between individual units, but inside each of them, the individual loss amount structures is based on decomposable graphical models. Graphical dependence is thus used at two levels in the proposed individual model. In the first stage, the Ising model describes loss contagion amongst individual units. And in the second stage, when a loss occurs for a given participant, the corresponding severity obeys a specific graphical model describing the spread of losses within the participant’s organisation (local IT infrastructure in cyber risk, for instance). The junction trees of decomposable graphical models are used to obtain an explicit form for the factorisation of the multivariate distributions of individual claim amounts.
From a methodological point of view, we derive the representation for the conditional mean risk-sharing rule in a new individual model with graphically dependent occurrence. Precisely, we apply the general representation derived by Denuit & Robert (Reference Denuit and Robert2020b) for any multivariate loss distribution to derive an analytical formula in the individual model considered in this paper. This formula may be used in particular to design effective simulation procedures to obtain these contributions. The choice of the Ising model for the random vectors of occurrences and the choice of decomposable graphical models for claim severities actually lead to expressions that bring into play random vectors associated to graphical models belonging to the same classes of graphical models as those of the risks. Numerical illustrations demonstrate the usefulness of the proposed approach for risk allocation. Moreover, for some graphical dependence structures, this analytical formula also yields a closed-form expression that can be used for direct evaluation of the respective participants’ contributions.
The model proposed in this paper is typically useful for modelling operational risk or cybersecurity risk. In operational risk management, detailed causal modelling at business process level is required for the understanding of organisation specific input to highlight the criticality of causal factors or to identify the potential lack of controls/barriers, for instance. This approach may create more value than a risk model based solely on actuarial techniques, as argued by Politou & Giudici (Reference Politou and Giudici2009). Cyber risks refer to threats to businesses or individuals such as data breaches or malicious cyber hacks on work computer systems. One property that distinguishes cyber risks from conventional risk is the network environment: IT resources are strongly interconnected inside the firm, but also between firms by the internet network. Cyber risks emerge from this interconnection, therefore the analysis of risk and potential losses may fruitfully take into account the inter-dependencies between connected nodes of the network through graphical models as demonstrated by Xie et al. (Reference Xie, Li, Ou, Liu and Levy2010).
The remainder of this paper is organised as follows. Section 2 describes the individual risk model with correlated loss occurrences obeying Ising multivariate Bernoulli distribution. Section 3 then introduces graphical models describing the spread of losses inside each individual unit, when a loss occurs, based on decomposable graphical models for absolutely continuous multivariate distributions. The conditional mean risk-sharing rule is discussed in section 4. Using a general representation result derived in Denuit & Robert (Reference Denuit and Robert2020b) for correlated losses, we derive the conditional mean risk allocation for the losses in the individual risk model considered in this paper. These results are applied in section 5 for an extensive numerical illustration demonstrating the high flexibility of the proposed approach. The final section 6 briefly discusses the results. Detailed specifications of the graphical models considered in section 5 (number of vertices, number of edges, sets of maximal cliques, sets of minimal seperators, precision matrices of the associated multivariate Gaussian random variables, etc.) are provided in Appendix.
2. Individual Risk Model with Joint Occurrences Obeying Ising Graphical Dependence Structure
2.1 Individual risk model with dependent occurrences
Throughout this paper, we consider n participants to an insurance pool, numbered
 $i\in \{1,2,\ldots ,n\}$
. Participant i faces a zero-augmented risk
 $X_{i}$
, that is,
 $X_{i}$
is a non-negative random variable with a positive probability mass at zero:
 $\mathrm{P}\left[ X_{i}=0\right] >0$
and
 $X_i$
possesses a probability density function over
 $(0,\infty)$
.
In accordance with the individual model of risk theory, we write
 $X_{i}=I_{i}C_{i}$
where
 $I_{i}$
is a Bernoulli random variable and
 $C_{i}$
is a strictly positive, absolutely continuous random variable modelling the corresponding severity. Contrarily to the classical setting where individual losses are assumed to be independent, we allow here for some correlation between occurrences. Precisely, we assume that severities
 $C_{i}$
are independent and independent of the random vector
 $\textbf{\textit{I}}=(I_{1},...,I_{n})$
gathering possibly correlated Bernoulli random variables modelling the occurrence of losses for each participant. We refer the reader to Dai et al. (Reference Dai, Ding and Wahba2013) for a review of multivariate Bernoulli distributions.
In the next section, we present the graphical models used for describing the correlation structure inside the loss occurrence random vector
 $\textbf{\textit{I}}$
.
2.2 Ising model
The Ising model is a classical example of a graphical model for binary random variables in statistical physics. It was named after the physicist Ernst Ising. Specifically, let
 $V=\{1,...,n\}$
and let
 $\mathcal{P}_{2}(V)$
denote the unordered subsets of V of size 2 (assuming that
 $n\geq 2$
). For
 $E\subseteq \mathcal{P}_{2}(V)$
, an undirected graph is denoted by
 $G=(V,E)$
where V is the set of vertices/nodes and E is the set of edges of G. We associate to each node
 $i\in V$
the Bernoulli random variable
 $I_{i}$
. Components
 $I_{i}$
and
 $I_{j}$
of the full random vector
 $\textbf{\textit{I}}$
interact “ directly” only if i and j are joined by an edge in the graph.
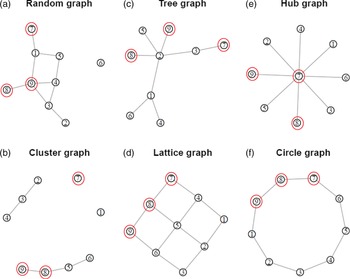
To illustrate this paper, we consider the hypothetical network structures depicted in Figure 1. We can see there (a) a purely random graph (edges have been chosen randomly), (b) a cluster graph, (c) a tree graph (edges have been chosen randomly but there is no cycle in the graph), (d) a lattice graph (nodes are on a lattice), (e) a hub graph (a non-random star-shaped graph), (f) a circle graph (nodes are on a circle). These graphs can be used to describe a wealth of situations encountered in risk modelling. Specifically, each node corresponds to a participant to the insurance pool and edges account for the various relationships existing between participants: commercial links between firms, connections by rivers or airlines for natural catastrophes or the spread of epidemics or some physical IT infrastructure in cyber risk. Even if the graphs in Figure 1 are purely hypothetical, they are representative of the variety of situations that can be accounted for by the Ising model. To keep the same number of participants in all cases, we work here with
 $n=9$
(the number required for populating the lattice graph).
Examples of Ising graphs used in this paper.

The distribution of vector
 $\textbf{\textit{I}}$
of the Ising model is defined for an undirected graph
 $G=(V,E)$
and is characterised by the following exponential family with joint probability mass function:
 \begin{equation}p_{\textbf{\textit{I}}}\!\left( \textbf{\textit{y}}\right)=\mathrm{P}[I_1=y_1,\ldots,I_n=y_n] =\exp\! \left( \sum_{i\in V}\theta _{ii}y_{i}+\sum_{\left(i,j\right) \in E}\theta _{ij}y_{i}y_{j}-A\!\left( \boldsymbol{\theta}\right)\right) \end{equation}
where
 $\textbf{\textit{y}}\in \{0,1\}^{n}$
,
 $\boldsymbol{\theta}=\left( \theta_{ij}\right) _{i\in V,\left( i,j\right) \in E}$
, and the normalising function
 $A(\cdot)$
satisfies
 \begin{equation*}A\!\left( \boldsymbol{\theta}\right) =\log \sum_{\textbf{\textit{y}}\in\{0,1\}^{n}}\exp \!\left( \sum_{i\in V}\theta _{i}y_{i}+\sum_{\left(i,j\right) \in E}\theta _{ij}y_{i}y_{j}\right)\end{equation*}
Here,
 $\theta _{ij}\in \mathbb{R}$
quantifies the strength of edge (i,j) linking participants i and j. For
 $\left( i,j\right) \notin E$
,
 $i\neq j$
, we have that
 $I_{i}$
and
 $I_{j}$
are conditionally independent, given all other
 $I_k$
,
 $k\neq i,j$
. For this reason, the Ising model is said to satisfy the pairwise Markov property.
The Ising model can be generalised in a number of different ways. Equation (1) includes only pairwise interactions, but it is possible to take into account higher order interactions amongst the random variables. For example, to include coupling
 $\{i,j,k\}$
of order 3, we could add a monomial of the form
 $y_{i}y_{j}y_{k}$
with corresponding canonical parameter
 $\theta _{ijk}$
. Note, however, that higher order interactions can also be converted to pairwise ones through the introduction of additional variables so that (1) is enough for practical purposes. See also Dai et al. (Reference Dai, Ding and Wahba2013) for a related generalisation of the Ising model.
The Ising model does not provide the unique approach to model dependence for multivariate Bernoulli random vectors. Dependence structures for multivariate binary random variables have also been characterised, e.g. with weighted trees in Hu et al. (Reference Hu, Xie and Ruan2005) or partially ordered binary trees in Kizildemir & Privault (Reference Kizildemir and Privault2018). Such dependence structures induce dependence orders for these multivariate Bernoulli distributions like the upper/lower orthant order, the multivariate concordance order, the supermodular order. Such order properties could be transfered to dependent individual risk models. We then refer to Zhang et al. (Reference Zhang, Li and Cheung2018) for stochastic order comparisons for the aggregate claim amounts from dependent individual risk models, and to Torrado & Navarro (Reference Torrado and Navarro2020), Zhang et al. (Reference Zhang, Cai and Zhao2020) for stochastic order comparisons for the extreme claim amounts of these models.
3. Individual Severity Model
3.1 Additive decomposition of individual severities
Since the total losses
 $C_i$
for participant i may be the result of an aggregation of several individual losses in practice, we assume that the absolutely continuous part of
 $X_{i}$
may be written as a sum:
 $C_{i}=\sum_{j=1}^{n_{i}}Z_{ij}$
where
 $\textbf{\textit{Z}}_{i}=(Z_{i1},...,Z_{in_{i}})$
is a vector of non-negative random variables of size
 $n_{i}\in \{1,2,\ldots \}$
.
Each individual entity thus possesses its own volume measured by the number
 $n_i$
of items susceptible to produce losses once it has been hit by the peril under consideration. In cyber risk, for instance,
 $n_i$
corresponds to the number of machines connected to the internal IT network and the correlation structure within the random vector
 $\textbf{\textit{Z}}_i$
reflects the loss control strategy implemented within the ith individual unit (e.g. firewalls or anti-virus softwares installed on the machines).
Inside each unit, a specific graphical model is used to represent the possible loss spread once it has been hit (that is, when
 $I_i=1$
). In the next section, we present the graphical models used for the random vectors
 $\textbf{\textit{Z}}_{i}$
,
 $i\in \{1,2,\ldots ,n\}$
.
3.2 Decomposable graphical models
In this section, we assign an undirected graph
 $G_i=(V_i,E_i)$
to each individual unit i to describe the spread of losses inside this unit. Whereas, the graph
 $G=(V,E)$
of section 2 is used to correlate occurrences between the unit,
 $G_i=(V_i,E_i)$
is used here at a secondary level to model the impact of the peril under consideration within unit i once it has been hit (that is, when
 $I_i=1$
). Considering cyber risk, for instance, the Ising model on G describes the spread of virus between individual units within the insurance pool, whereas
 $G_i$
accounts for the impact of the virus once it has entered the local IT infrastructure of unit i. The undirected graph
 $G_i=(V_i,E_i)$
thus models the spread of losses inside individual unit i and we associate the components
 $Z_{ij}$
of the random vector
 $\textbf{\textit{Z}}_i$
to the nodes of
 $G_i$
. Henceforth, we denote as
 $f_{\textbf{\textit{Z}}_i}$
the joint probability density function of
 $\textbf{\textit{Z}}_i$
.
To define decomposable graphical models for
 $\textbf{\textit{Z}}_i$
yielding tractable expression for
 $f_{\textbf{\textit{Z}}_i}$
, we need to introduce the following definitions that are stated for a generic graph
 $G=(V,E)$
. For a subset
 $A\subset V$
, the subgraph of G induced by A is henceforth denoted as
 $G_{A}\,:\!=\,(A,E_{A})$
with
 $E_{A}\,:\!=\,\{(i,j)\in E|i\in A,j\in A\}$
.
Definition 3.1. (Clique). A graph
 $G=(V,E)$
is said to be complete if
 $E=\mathcal{P}_{2}(V)$
. If
 $G_{A}$
is complete for
 $A\subseteq V$
, A is said to be a clique of
 $G $
. A maximal clique of G is a clique for which every superset of vertices of G is not a clique.
Definition 3.2. (Path). Let
 $\alpha $
,
 $\beta $
be two distinct nodes in V. A path from
 $\alpha $
to
 $\beta $
is a sequence
 $\alpha =\gamma _{0},...,\gamma_{m}=\beta $
,
 $m\geq 1$
, of distinct nodes such that, for all
 $1\leq i\leq m$
,
 $\{\gamma _{i-1,}\gamma _{i}\}\in E$
. A cycle is a path from a node to itself.
Definition 3.3. (Separation). Let A,B,C be subsets of V. Then, C is said to separate
 $A $
from B if any path from
 $\alpha \in A$
to
 $\beta \in B$
intersects C.
Definition 3.4. (Decomposition). A pair (A,B) of subsets of V is said to be a decomposition of G if
 $V=A\cup B$
, the subgraph induced by G on
 $A\cap B$
is complete and
 $A\cap B$
separates A from B. If A and B are both proper subsets of V (i.e. they are strictly included in V), the decomposition is said to be proper. A graph G is said to be decomposable if it is either complete or if there exists a proper decomposition of G into two decomposable subgraphs.
The definition of a decomposable graph is thus recursive. The equivalent notion of chordality may be easier to handle. A graph G is said to be chordal if all cycles of four or more vertices have a chord, which is an edge that is not part of the cycle but connects two vertices of the cycle. Proposition 2.5 in Lauritzen (Reference Lauritzen1996) shows that a graph G is decomposable if, and only if, G is a chordal graph.
In the next definition, a connected component is a subgraph in which any two vertices are connected to each other by paths, and which is connected to no additional vertices in the rest of the graph.
Definition 3.5. A subset S of V is a separator in G when
 $G_{V\backslash S}$
has more than one connected component. S is a minimal separator, when it does not contain another separator as a proper subset.
Whenever a graph G is decomposable, the set
 $\mathcal{S}$
of its minimal separators can be built by the following algorithm. Begin with the empty set
 $\mathcal{S=\varnothing }$
. Then, consider a proper decomposition (A,B) of G such that
 $A\cap B$
is of minimal cardinality. If there is no such decomposition, it means that G is complete and the procedure stops. Otherwise, add
 $A\cap B$
to
 $\mathcal{S}$
and apply the same procedure to the subgraphs
 $G_{A}$
and
 $G_{B}$
. For any subset
 $S\in \mathcal{S}$
, let
 $\nu (S)$
denote the number of times it appeared in the procedure. Notice that this algorithm also produces the set
 $\mathcal{C}$
containing the maximal cliques of G.
This algorithm is referred to as the junction tree algorithm because the result of this algorithm can be represented by a factor graph, i.e. a bipartite graph whose vertices are indexed by
 $\mathcal{C}$
and
 $\mathcal{S}$
(which puts an edge between
 $C\in \mathcal{C}$
and
 $S\in \mathcal{S}$
if, and only if,
 $C\cap S=S$
). The graph obtained this way is the junction tree. An example is provided in Figure 2 to figure out the procedure followed in this paper. Figure 2 illustrates the variety of situations covered by the approach proposed in this paper. It corresponds to the graph describing the spread of losses inside the unit corresponding to participant 1 in the numerical illustrations of section 5.
An example of decomposable graph with its junction tree for modelling the distribution of
 $\textbf{\textit{Z}}_i$
.

Whenever
 $G_{i}$
is decomposable, the junction tree algorithm can be used to obtain an explicit formula for the joint probability density function of
 $\textbf{\textit{Z}}_{i}$
since it factorises over
 $G_{i}$
into a products of marginal distributions over complete subsets. Indeed, if
 $f_{\textbf{Z}_{C}}\!\left( \textbf{z}_{C}\right) $
denotes the density function of
 $\textbf{Z}_{C}=\left( Z_{ij}\right) _{j\in C}$
, and if
 $\mathcal{S}_{i}$
and
 $\mathcal{C}_{i}$
respectively denote the set of minimal separators and maximal cliques of
 $G_{i}$
yielded by the junction tree algorithm, it can be shown that
 \begin{equation}f_{\textbf{\textit{Z}}_{i}}\!\left( \textbf{\textit{z}}\right) =\frac{\prod_{C\in\mathcal{C}_{i}}f_{\textbf{\textit{Z}}_{C}}\!\left( \textbf{\textit{z}}_{C}\right) }{\prod_{S\in \mathcal{S}_{i}}f_{\textbf{\textit{Z}}_{S}}\!\left( \textbf{\textit{z}}_{S}\right) ^{\nu \!\left( S\right) }},\textbf{\textit{z}}\in (0,\infty)^{n_{i}} \end{equation}
where
 $\nu \left( S\right) $
is equal to
 $d\!\left( S\right) -1$
. Here,
 $d\!\left( S\right) $
denotes the degree of the node corresponding to S in the junction tree (i.e. the number of edges connected to this node). We refer the reader to Theorem 4 in Bartlett (Reference Bartlett2003) for a formal derivation of (2).
4. Conditional Mean Risk Sharing in the Individual Model with Graphical Dependence Structure
4.1 Conditional mean sharing rule
We denote by
 $S=\sum_{i=1}^{n}X_{i}$
the sum of the individual losses to be distributed amongst the n participants. There are several ways to allocate the total losses to the n individuals forming the pool. In this paper, we use the conditional mean risk-sharing rule presented next.
The distribution of the total losses S amongst the n participants is described by a set of functions
 $h_{i}$
,
 $i\in \{1,2,\ldots ,n\}$
, where
 $h_{i}(S)$
is the part of S attributed to participant i, with
 $\sum_{i=1}^{n}h_{i}(S)=S$
. In the design of a risk-sharing scheme, it is important that the sharing rule between participants represented by the functions
 $h_{1},h_{2},\ldots ,h_{n}$
, is both intuitively acceptable and transparent. In that respect, the conditional mean risk-sharing rule
 $h_{i}^{\ast }$
proposed by Denuit & Dhaene (Reference Denuit and Dhaene2012) is particularly attractive. It is simply defined as
 \begin{equation}h_{i}^{\ast }(S)=\mathrm{E}[X_{i}|S],i=1,2,\ldots ,n\end{equation}
In words, participant i must contribute the expected value of risk
 $X_{i}$
brought to the pool, given the total loss S. Clearly, the conditional mean risk sharing
 $\left( 3\right) $
allocates the full risk S as we obviously have
 \begin{equation*}\sum_{i=1}^{n}h_{i}^{\ast }(S)=\sum_{i=1}^{n}\mathrm{E}[X_{i}|S]=S\end{equation*}
so that the sum of participants’ contributions covers the entire loss S.
The conditional mean risk-sharing rule has been thoroughly investigated by Denuit (Reference Denuit2019, Reference Denuit2020) and Denuit & Robert (Reference Denuit and Robert2020a, Reference Denuit and Robert2021) for individual losses
 $X_i$
. The next section applies this allocation to the correlated risks considered in this paper.
4.2 Conditional mean sharing rule for dependent zero-augmented risks
Before providing analytical formulas for the conditional mean risk-sharing rule, we define the size-biased transformation of a risk: the size-biased version
 $\widetilde{X}$
of a non-negative real-valued random variable X is defined through its distribution function by
 \begin{equation*}\mathrm{P}[\widetilde{X}\leq t]=\frac{1}{\mathrm{E}[X]}\int_{0}^{t}x{d}F_{X}(x)\end{equation*}
We are now ready to state the main result of this paper that describes the conditional mean risk-sharing rule in the individual model with correlated occurrences considered in this paper. This result is useful to compute individual contributions
 $h_i^{\ast }(s)$
to total losses s, as precisely explained later on.
Proposition 4.1. Let
 $X_{1},\ldots ,X_{n}$
be zero-augmented random variables of the form
 $X_{i}=I_{i}C_{i}$
with positive probability masses at 0 and probability density functions over
 $(0,\infty )$
. Assume that
 $\textbf{\textit{I}}$
,
 $C_{1}$
,
 $\ldots $
,
 $C_{n}$
are independent. Then,
-
(i)
 $h_{i}^{\ast }(0)=0$
and, for any
$s>0$
, the representation holds true where
\begin{equation*}h_{i}^{\ast }(s)=\frac{\mathrm{E}\left[ X_{i}\right] f_{T_{i}}(s)}{\sum_{j=1}^{n}\mathrm{E}\left[ X_{j}\right] f_{T_{j}}(s)}s\end{equation*}
with
\begin{equation*}T_{j}=\widetilde{C}_{j}+\sum_{k\neq j}I_{k}^{[j]}C_{k}\end{equation*}
$\textbf{\textit{I}}^{[j]}$
,
$C_{1}$
,
$\ldots $
,
$C_{n}$
,
$\widetilde{C}_{1}$
,
$\ldots $
,
$\widetilde{C}_{n}$
, all independent, and
$\textbf{\textit{I}}^{[j]}\overset{\mathrm{d}}{=}\textbf{\textit{I}}|I_{j}=1$
.
-
(ii) If
$\textbf{\textit{I}}$
obeys the Ising model (1) then
$\textbf{\textit{I}}^{[k]}$
,
$k\in \{1,2,\ldots ,n\}$
, obeys the Ising model defined on the graph
$G_{V\backslash \{k\}}$
with parameter
$\boldsymbol{\theta }^{^{[k]}}=(\theta _{ij}^{^{[k]}})_{i\in V\backslash \{k\},\left(i,j\right) \in E_{V\backslash \{k\}}}$
satisfying, for
$i\in V\backslash\{k\}$
,
$\theta _{ii}^{[k]}=\theta _{ii}+\theta _{ik}\mathrm{I}[\left(i,k\right) \in E]$
, and, for
$\left( i,j\right) \in E_{V\backslash \{k\}}$
,
$\theta _{ij}^{[k]}=\theta _{ij}$
. -
(iii) If
$C_{i}=\sum_{j=1}^{n_{i}}Z_{ij}$
where
$\textbf{\textit{Z}}_{i}$
has joint probability density function (2) then where the random variable
\begin{equation*}\widetilde{C}_{i}\overset{\mathrm{d}}{=}\sum_{j=1}^{n_{i}}Z_{ij}^{[K_{i}]}\end{equation*}
$K_{i}$
is valued in
$\{1,2,\ldots ,n_{i}\}$
, independent of
$\textbf{\textit{Z}}_{i}$
and of
$\textbf{\textit{Z}}_{i}^{[1]},\ldots ,\textbf{\textit{Z}}_{i}^{[n_{i}]}$
such that
$\mathrm{P}[K_{i}=k]=\frac{\mathrm{E}[Z_{ik}]}{\mathrm{E}[C_{i}]}$
for
$k\in \{1,2,\ldots ,n_{i}\}$
, and the joint probability density function of
$\textbf{\textit{Z}}_{i}^{[k]}$
is given by where
\begin{equation*}f_{\textbf{\textit{Z}}_{i}^{[k]}}\!\left( \textbf{z}\right) =\frac{\prod_{C\in\mathcal{C}^{[k]}}f_{\textbf{Z}_{C}^{[k]}}\!\left( \textbf{z}_{C}\right) }{\prod_{S\in \mathcal{S}^{[k]}}f_{\textbf{Z}_{S}^{[k]}}\!\left( \textbf{z}_{S}\right) ^{\nu \left( S\right) }}\frac{\prod_{C\in \mathcal{C}\backslash\mathcal{C}^{[k]}}f_{\textbf{Z}_{C}}\!\left( \textbf{z}_{C}\right) }{\prod_{S\in \mathcal{S}\backslash \mathcal{S}^{[k]}}f_{\textbf{Z}_{S}}\!\left(\textbf{z}_{S}\right) ^{\nu \left( S\right) }}\end{equation*}
$\mathcal{C}^{[k]}$
is the subset of
$\mathcal{C}$
for which node
$k\in C$
, and
$\mathcal{S}^{[k]}$
is the subset of
$\mathcal{S}$
for which node
$k\in C$
.


Proof. Let us start with item (i). The announced representation for the conditional mean risk-sharing rule can be obtained following the lines of Proposition 3.1 (iii) of Denuit & Robert (Reference Denuit and Robert2020b). Clearly,
 $h_{i}^{\ast }(0)=0$
. Let us now consider
 $s>0$
. For any measurable function g, we can write
 \begin{eqnarray}\mathrm{E}[X_ig(S)]&=&\int_0^\infty\cdots\int_0^\infty x_ig(x_1+\ldots+x_n){d}F_{\textbf{\textit{X}}}(x_1,\ldots,x_n)\nonumber\\[5pt]&=&\mathrm{E}[X_i]\int_0^\infty\cdots\int_0^\infty g(x_1+\ldots+x_n)\frac{x_i{d}F_{\textbf{\textit{X}}}(x_1,\ldots,x_n)}{\mathrm{E}[X_i]}\nonumber\\[5pt]&=&\mathrm{E}[X_i]\mathrm{E}[g(X_1^{[i]}+\ldots+X_n^{[i]})] \end{eqnarray}
where the random vector
 $\textbf{\textit{X}}^{[i]}=(X_{1}^{[i]},\ldots ,X_{n}^{[i]})$
has joint distribution function
 $F_{\textbf{\textit{X}}^{[i]}}$
given by
 \begin{eqnarray}F_{\textbf{\textit{X}}^{[i]}}(x_{1},\ldots ,x_{n}) &=&\int_{0}^{x_{1}}\cdots\int_{0}^{x_{n}}\frac{y_{i}\mathrm{d}F_{\textbf{\textit{X}}}(y_{1},\ldots ,y_{n})}{\mathrm{E}[X_{i}]} \notag \\[5pt]&=&\frac{\mathrm{E}[X_{i}|X_{1}\leq x_{1},\ldots ,X_{n}\leq x_{n}]}{\mathrm{E}[X_{i}]}F_{\textbf{\textit{X}}}(x_{1},\ldots ,x_{n})\end{eqnarray}
Let us apply (4) to the function g given by
 \begin{equation*}g(x_1,\ldots,x_n)=\mathrm{I}\left[\sum_{j=1}^nx_j\leq s\right]=\left\{\begin{array}{l}1\text{ if }\sum_{j=1}^nx_j\leq s\\ \\0\text{ otherwise}\end{array}\right.\end{equation*}
to get the identity
 \begin{equation}\mathrm{E}\big[X_i\mathrm{I}\left[S\leq s\right]\big]=\mathrm{E}[X_i]\mathrm{P}\left[X_1^{[i]}+\ldots+X_n^{[i]}\leq s\right]\end{equation}
Now, we can also write
 \begin{equation*}\mathrm{E}\big[X_i\mathrm{I}[S\leq s]\big]=\int_0^s\mathrm{E}\big[X_i\big|S=t\big]f_S(t){d}t\end{equation*}
Taking the derivative of these expressions with respect to s gives
 \begin{equation}h_{i}^{\ast }(s)=\frac{\mathrm{E}\left[ X_{i}\right] f_{X_{1}^{[i]}+\ldots +X_{n}^{[i]}}(s)}{f_S(s)}\end{equation}
Summing identity (7) over i, we obtain
 \begin{equation*}sf_S(s)=\sum_{i=1}^n\mathrm{E}\left[ X_{i}\right] f_{X_{1}^{[i]}+\ldots +X_{n}^{[i]}}(s)\end{equation*}
Hence, we end up with
 \begin{equation*}h_{i}^{\ast }(s)=\frac{\mathrm{E}\!\left[ X_{i}\right] f_{X_{1}^{[i]}+\ldots +X_{n}^{[i]}}(s)}{\sum_{j=1}^{n}\mathrm{E}\left[ X_{j}\right]f_{X_{1}^{[j]}+\ldots +X_{n}^{[j]}}(s)}s\end{equation*}
Considering the risks
 $X_i=I_iC_i$
with correlated occurrences
 $I_i$
but independent severities
 $C_i$
, we have
 \begin{eqnarray*}F_{\textbf{\textit{X}}^{[i]}}(x_{1},\ldots ,x_{n}) &=&\frac{1}{\mathrm{E}\left[X_{i}\right] }\mathrm{E}\big[ X_{i}\mathrm{I}[X_{1}\leq x_{1},...,X_{n}\leq x_{n}]\big] \\&=&\frac{1}{\mathrm{E}\left[ I_{i}C_{i}\right] }\mathrm{E}\big[ I_{i}C_{i}\mathrm{I}[I_{1}C_{1}\leq x_{1},...,I_{n}C_{n}\leq x_{n}]\big] \\&=&\frac{1}{\mathrm{E}\left[ I_{i}C_{i}\right] }\mathrm{E}\Big[ \mathrm{E}\big[ I_{i}C_{i}\mathrm{I}[I_{1}C_{1}\leq x_{1},...,I_{n}C_{n}\leq x_{n}]\big|I_{1},...,I_{n}\big] \Big]\end{eqnarray*}
Because
 \begin{eqnarray*}&&\mathrm{E}\big[ I_{i}C_{i}\mathrm{I}[I_{1}C_{1}\leq x_{1},...,I_{n}C_{n}\leq x_{n}]\big|I_{1},...,I_{n}\big] \\[5pt]&=&\mathrm{E}\big[ I_{i}C_{i}\mathrm{I}[I_{i}C_{i}\leq x_{i}]\big|I_{1},...,I_{n}\big] \prod_{j\neq i}\mathrm{P}\left[ I_{j}C_{j}\leq x_{j}|I_{1},...,I_{n}\right]\end{eqnarray*}
and
 \begin{eqnarray*}&&\frac{\mathrm{E}\left[ I_{i}C_{i}\mathrm{I}[I_{i}C_{i}\leq x_{i}]|I_{1},...,I_{n}\right] }{\mathrm{E}\left[ I_{i}C_{i}\right] } \\[5pt]&=&\frac{\mathrm{E}\left[ I_{i}C_{i}\mathrm{I}[I_{i}C_{i}\leq x_{i}]|I_{1},...,I_{n}\right] }{\mathrm{E}\left[ I_{i}C_{i}|I_{1},...,I_{n}\right] }\times \frac{\mathrm{E}\left[ I_{i}C_{i}|I_{1},...,I_{n}\right] }{\mathrm{E}\left[ I_{i}C_{i}\right] } \\[5pt]&=&\frac{\mathrm{E}\left[ I_{i}C_{i}\mathrm{I}[I_{i}C_{i}\leq x_{i}]|I_{1},...,I_{n}\right] }{\mathrm{E}\left[ I_{i}C_{i}|I_{1},...,I_{n}\right] }\times \frac{I_{i}}{\mathrm{E}\left[ I_{i}\right] },\end{eqnarray*}
the joint distribution (5) in the individual model with correlated occurrences writes
 \begin{equation*}F_{\textbf{\textit{X}}^{[i]}}(x_{1},\ldots ,x_{n})=\mathrm{E}\left[ \frac{\mathrm{E}\left[ I_{i}C_{i}\mathrm{I}[I_{i}C_{i}\leq x_{i}]|I_{1},...,I_{n}\right] }{\mathrm{E}\left[ I_{i}C_{i}|I_{1},...,I_{n}\right] }\times \frac{I_{i}}{\mathrm{E}\left[ I_{i}\right] }\prod_{j\neq i}\mathrm{P}\left[I_{j}C_{j}\leq x_{j}|I_{1},...,I_{n}\right] \right]\end{equation*}
We can further rewrite the joint distribution function
 $F_{\textbf{\textit{X}}^{[i]}}$
as
 \begin{equation*}F_{\textbf{\textit{X}}^{[i]}}(x_{1},\ldots ,x_{n})=\mathrm{E}\left[ \mathrm{P}\left[ \widetilde{C}_{i}\leq x_{i}\right]\prod_{j\neq i}\mathrm{P}\left[I_{j}C_{j}\leq x_{j}|I_{1},...,I_{n}\right]\Big| I_i=1 \right]\end{equation*}
We deduce that
 $\textbf{\textit{X}}^{[i]}\overset{\mathrm{d}}{=}\left(I_{1}^{[i]}C_{1},...,I_{i-1}^{[i]}C_{i-1},\widetilde{C}_{i},I_{i+1}^{[i]}C_{i+1},...,I_{n}^{[i]}C_{n}\right) $
since the random vector
 $\textbf{\textit{I}}^{[i]}$
is distributed as
 $\textbf{\textit{I}}$
given
 $I_{i}=1$
. This ends the proof of item (i).
Turning to item (ii), it suffices to notice that the joint probability mass function of the random vector
 $\textbf{\textit{I}}^{[k]}$
is given by
 \begin{eqnarray*}p_{\textbf{\textit{I}}^{[k]}}\left( \textbf{\textit{y}}\right)&=&p_{\textbf{\textit{I}}}\left( \textbf{\textit{y}}|I_{k}=1\right) \\&=&\frac{1}{\mathrm{E}\left[I_{k}\right] }p_{\textbf{\textit{I}}}\left( y_{1},\ldots ,y_{k-1},1,y_{k+1},\ldots,y_{n}\right) \\&=&\exp \left( \sum_{i\in V\backslash \{k\}}\theta_{ii}^{[k]}y_{i}+\sum_{\left( i,j\right) \in E_{V\backslash \{k\}}}\theta_{ij}^{[k]}y_{i}y_{j}-A^{[k]}(\boldsymbol{\theta}^{^{[k]}})\right)\end{eqnarray*}
where
 $A^{[k]}$
is the normalising constant entering Ising specification. This completes the proof of item (ii).
Considering the last item (iii), we know from (5) that the joint probability density function of the random vector
 $\textbf{\textit{Z}}_i^{[k]}$
is given by
 \begin{equation*}f_{\textbf{\textit{Z}}_i^{[k]}}\left( z_{1},...,z_{n}\right) =\frac{z_{k}f_{\textbf{\textit{Z}}_i}\left( z_{1},...,z_{n}\right) }{\mathrm{E}[Z_{ik}]}\end{equation*}
In the factored form of
 $f_{\textbf{\textit{Z}}}$
give in equation (2),
 $z_{k}$
only appears in
 $f_{\textbf{\textit{Z}}_{C}}$
for
 $C\in \mathcal{C}^{[k]}$
and in
 $f_{\textbf{\textit{Z}}_{S}}$
for
 $S\in \mathcal{S}^{[k]}$
. The announced formula for
 $f_{\textbf{\textit{Z}}_i^{[k]}}$
then follows by noting that
 \begin{equation*}\frac{z_{k}}{\mathrm{E}[Z_{ik}]}\frac{\prod_{C\in \mathcal{C}^{[k]}}f_{\textbf{\textit{Z}}_{C}}\left( \textbf{\textit{z}}_{C}\right) }{\prod_{S\in \mathcal{S}^{[k]}}f_{\textbf{\textit{Z}}_{S}}\left( \textbf{\textit{z}}_{S}\right) ^{\nu \left( S\right) }}=\frac{\prod_{C\in \mathcal{C}^{[k]}}\left( f_{\textbf{\textit{Z}}_{C}}\left(\textbf{\textit{z}}_{C}\right) z_{k}/\mathrm{E}[Z_{ik}]\right) }{\prod_{S\in \mathcal{S}^{[k]}}\left( f_{\textbf{\textit{Z}}_{S}}\left( \textbf{\textit{z}}_{S}\right) z_{k}/\mathrm{E}[Z_{ik}]\right) ^{\nu \left( S\right) }}=\frac{\prod_{C\in \mathcal{C}^{[k]}}f_{\textbf{\textit{Z}}_{C}^{[k]}}\left( \textbf{\textit{z}}_{C}\right) }{\prod_{S\in\mathcal{S}^{[k]}}f_{\textbf{\textit{Z}}_{S}^{[k]}}\left( \textbf{\textit{z}}_{S}\right) ^{\nu\left( S\right) }}\end{equation*}
The size-biased version of sums of correlated random variables is studied in section 2.4 of Denuit & Robert (Reference Denuit and Robert2020b). We follow the same reasoning here, applied to
 $C_i=\sum_{j=1}^{n_i}Z_{ij}$
. Consider a (measurable) function g and write
 \begin{eqnarray}\mathrm{E}[C_ig(C_i)]&=&\int_0^\infty xg(x){d}F_{C_i}(x)\nonumber\\[4pt]&=&\mathrm{E}[C_i]\int_0^\infty g(x)\frac{x{d}F_{C_i}(x)}{\mathrm{E}[C_i]}\nonumber\\[4pt]&=&\mathrm{E}[C_i]\mathrm{E}[g(\widetilde{C}_i)]\end{eqnarray}
Now, inserting the function
 \begin{equation}g(x)=\mathrm{I}[x\leq t]=\left\{\begin{array}{l}1\text{ if }x\leq t\\ \\0\text{ otherwise}\end{array}\right.\end{equation}
in identity (8), we see that the representation
 \begin{equation}\mathrm{E}[C_i|C_i\leq t]=\mathrm{E}[C_i]\frac{\mathrm{P}[\widetilde{C}_i\leq t]}{\mathrm{P}[C_i\leq t]}\end{equation}
is valid for any threshold t. Now, (6) allows us to write
 \begin{eqnarray*}\mathrm{E}[C_i|C_i\leq t]&=&\sum_{j=1}^{n_i}\mathrm{E}[Z_{ij}|C_i\leq t]\\&=&\sum_{j=1}^{n_i}\mathrm{E}\left[Z_{ij}\right] \frac{\mathrm{P}[Z_{i1}^{[j]}+\ldots+Z_{in_i}^{[j]}\leq t]}{\mathrm{P}[Z_{i1}+\ldots+Z_{in_i}\leq t]}\end{eqnarray*}
Combining these identities, we get
 \begin{equation*}\mathrm{P}[\widetilde{C}_i\leq t]=\sum_{j=1}^{n_i}\frac{\mathrm{E}\left[Z_{ij}\right]}{\mathrm{E}[C_i]}\mathrm{P}[Z_{i1}^{[j]}+\ldots+Z_{in_i}^{[j]}\leq t]\end{equation*}
The latter expression shows that
 $\widetilde{C}_{i}$
can be represented as the mixture
 \begin{equation*}\widetilde{C}_{i}\overset{\mathrm{d}}{=}\left\{\begin{array}{l}Z_{i1}^{[1]}+\ldots +Z_{in_{i}}^{[1]}\text{ with probability }\frac{\mathrm{E}[Z_{i1}]}{\mathrm{E}[C_{i}]} \\ \\Z_{i1}^{[2]}+\ldots +Z_{in_{i}}^{[2]}\text{ with probability }\frac{\mathrm{E}[Z_{i2}]}{\mathrm{E}[C_{i}]} \\\vdots \\Z_{i1}^{[n_{i}]}+\ldots +Z_{in_{i}}^{[n_{i}]}\text{ with probability }\frac{\mathrm{E}[Z_{in_{i}}]}{\mathrm{E}[C_{i}]}\end{array}\right.\end{equation*}
We thus have
 $ \widetilde{C}_{i}\overset{\mathrm{d}}{=}\sum_{j=1}^{n_{i}}Z_{ij}^{[K_i]}$
, as announced. This ends the proof.
It is noteworthy that the distributions of the random vectors
 $\textbf{\textit{I}}^{[k]}$
,
 $k=1,\ldots ,n$
, can be characterised as distributions associated to Ising models defined on subgraphs of G, and that the distribution of the random vectors
 $\textbf{\textit{Z}}_{i}^{[k]}$
,
 $k=1,\ldots ,n_{i}$
, can be characterised by the same decomposable graph
 $G_{i}$
(and hence with the same set of minimal separators and maximal cliques,
 $\mathcal{S}_{i}$
and
 $\mathcal{C}_{i}$
). These properties are very convenient to compute by simulation the conditional mean risk-sharing rules since it is only needed to use algorithms dedicated to the specific classes of graphical models of participants’ risks.
We can also mention that distribution (5) is a multivariate weighted version of the distribution function for
 $\textbf{\textit{X}}$
and has been considered by Arratia et al. (Reference Arratia, Goldstein and Kochman2019) in relation to size-biasing sums of random variables. Multivariate weighted distributions have been reviewed by Navarro et al. (Reference Navarro, Ruiz and Del Aguila2006). The weight function w corresponding to (5) is
 $w(x_{1},\ldots ,x_{n})=x_{i}/\mathrm{E}[X_{i}]$
that has been considered in Jain & Nanda (Reference Jain and Nanda1995).
The next example describes a particular case where a closed-form expression can be obtained for the conditional mean risk-sharing rule.
Example 4.2. (Hub graph and Gamma severities) We consider the case where the participants’ network is characterised by the hub graph (e) in Figure 1. Participant 7 is the central participant with whom all other participants are related. We assume that these participants are identically connected with participant 7. More specifically, we have
 \begin{equation*}\theta _{7j}=\alpha >0,\text{ }j\neq 7,\quad \theta _{77}=\beta >0,\quad\theta _{jj}=\gamma >0,\text{ }j\neq 7\end{equation*}
The Ising model
 $\textbf{\textit{I}}^{[7]}\overset{\mathrm{d}}{=}\textbf{\textit{I}}|I_{7}=1$
corresponds to the case where participants j,
 $j\neq 7$
, have independent and identically distributed Bernoulli distributions with parameter
 $p=\exp \left( \alpha +\gamma \right) /(1+\exp \left( \alpha+\gamma \right) )$
.
The Ising model
 $\textbf{\textit{I}}^{[i]}\overset{\mathrm{d}}{=}\textbf{\textit{I}}|I_{i}=1$
,
 $i\neq 7$
, is characterised by a hub graph where participant 7 is still the central participant and participant j disappears. This Ising model has for parameters
 \begin{equation*}\theta _{7j}=\alpha ,\text{ }j\neq 7,i,\quad \theta _{77}=\alpha +\beta>0,\quad \theta _{jj}=\gamma >0,\text{ }j\neq 7,i\end{equation*}
Note also that the Ising model
 $\textbf{\textit{I}}|I_{i}=1,I_{7}=1$
,
 $i\neq 7$
, corresponds to the case where participants j,
 $j\neq i,7$
, have independent and identically distributed Bernoulli distributions with parameter
 $p=\exp \left( \alpha +\gamma \right) /(1+\exp \left( \alpha+\gamma \right) )$
, and that the Ising model
 $\textbf{\textit{I}}|I_{i}=1,I_{7}=0$
,
 $i\neq 7$
, corresponds to the case where participants j,
 $j\neq i,7$
, have independent and identically distributed Bernoulli distributions with parameter
 $p^{\prime }=\exp \left( \gamma \right) /(1+\exp \left( \gamma\right) )$
. We let
 $\nu =\mathrm{P}[I_{7}=1|I_{i}=1]$
.
For simplicity, we assume that total losses
 $C_{i}$
have Gamma distributions and we do not use graphical models for these distributions. We consider the following specifications:
 \begin{equation*}C_{7}\sim Gamma\left( \delta ,\tau \right) ,\text{ }\quad C_{j}\sim Gamma\left( \eta ,\tau \right) ,\text{ }j\neq 7\end{equation*}
The size-biased version of the total losses are
 $\tilde{C}_{7}\sim Gamma\left( \delta +1,\tau \right) $
and
 $\tilde{C}_{j}\sim Gamma\break \left( \eta+1,\tau \right) ,$
 $j\neq 7$
. We deduce from the different assumptions that
 $T_{7}=\widetilde{C}_{7}+\sum_{k\neq 7}I_{k}^{[j]}C_{k}$
has a Gamma mixture distribution characterised by
 \begin{equation*}T_{7}\sim \sum_{k=0}^{6}\left(\begin{array}{c}6 \\k\end{array}\right) p^{k}\left( 1-p\right) ^{6-k}Gamma\left( \delta +1+k\eta ,\tau\right)\end{equation*}
Moreover, for
 $j\neq 7$
,
 $T_{j}=\widetilde{C}_{j}+\sum_{k\neq j}I_{k}^{[j]}C_{k}$
has a Gamma mixture distribution characterised by
 \begin{eqnarray*}T_{j} &\sim &\nu \sum_{k=0}^{5}\left(\begin{array}{c}5 \\k\end{array}\right) p^{k}\left( 1-p\right) ^{5-k}Gamma\left( \delta +1+(k+1)\eta ,\tau\right) \\&&+(1-\nu )\sum_{k=0}^{5}\left(\begin{array}{c}5 \\k\end{array}\right) \left( p^{\prime }\right) ^{k}\left( 1-p^{\prime }\right)^{5-k}Gamma\left( 1+(k+1)\eta ,\tau \right)\end{eqnarray*}
Since
 $\mathrm{E}\left[ X_{j}\right] =\mathrm{P}[I_{j}=1]\mathrm{E}\left[C_{j}\right] $
, it follows that
 \begin{equation*}\mathrm{E}\left[ X_{7}\right] f_{T_{7}}(s)=\mathrm{P}[I_{7}=1]\frac{\delta }{\tau }e^{-s\tau }\sum_{k=0}^{6}\left(\begin{array}{c}6 \\k\end{array}\right) \frac{p^{k}\left( 1-p\right) ^{6-k}\tau ^{\delta +1+k\eta }}{\Gamma\left( \delta +1+k\eta \right) }s^{\delta +k\eta }\end{equation*}
and, for
 $j\neq 7$
,
 \begin{eqnarray*}&&\mathrm{E}\left[ X_{j}\right] f_{T_{j}}(s) \\&=&\mathrm{P}[I_{j}=1]\frac{\eta }{\tau }e^{-s\tau }\sum_{k=0}^{5}\!\left(\begin{array}{c}5 \\k\end{array}\right)\! s^{(k+1)\eta }\left( \frac{\nu p^{k}\left( 1-p\right) ^{5-k}\tau^{\delta +1+(k+1)\eta }}{\Gamma \left( \delta +1+(k+1)\eta \right) }s^{\delta }+\frac{\left( p^{\prime }\right) ^{k}\left( 1-p^{\prime }\right)^{5-k}\tau ^{1+(k+1)\eta }}{\Gamma \left( 1+(k+1)\eta \right) }\right)\end{eqnarray*}
It is now easily seen that the functions
 $h_{j}^{\ast }$
,
 $j=1,\ldots ,9$
, are ratios of polynomials in s for this specific example.
5. Numerical Illustrations
In order to demonstrate the usefulness of the graphical model approach presented in this paper, we consider numerical examples for which the pool is composed of
 $n=9$
participants. Note that we will provide more detailed comments for the subgroup of three participants
 $\{7,8,9\}$
in the remainder of this section.
We use several R packages to generate graphs and simulate occurrence and severity data: BDgraph for simulating multivariate distributions with different types of underlying graph structures, GLSE for generating decomposable graphs based on given numbers of vertices and edges in graphs and igraph for creating graphs from adjacency matrices.
5.1 Ising graphical dependence structures
Claim occurrences for the participants are represented by several Ising models associated to the six graphs shown in Figure 3. As explained in section 2, these graphs can be used to describe a wealth of situations encountered in risk modelling. The random graph (a) is associated to the Erdos–Rényi model, where a graph is constructed by connecting nodes randomly: each edge is included with a fixed probability independently from every other edge. The cluster graph (b) is a graph formed from the disjoint union of subgraphs. Such a graph is interesting to model disjoint communities. The tree graph (c) is a graph in which any two vertices are connected at most by one path. Such a graph is used when the objects of interest naturally forms a hierarchy. The lattice graph (d) is a graph whose drawing is embedded in
 $\mathbb{Z}^{n}$
, and forms a regular tiling. The hub graph (e) is a graph where a node has connections with many other nodes. Emergence of hub graphs in real life is a consequence of a scale-free property of the network. The circle graph (f) is a graph whose vertices can be associated with chords of a circle such that two vertices are adjacent if and only if the corresponding chords cross each other. The last three graphs have a very regular structure compared to the first three graphs. When the number of nodes increases, the diversity of shapes of these graphs makes them possible to get closer to real-life situations.
Ising graphs where the three participants
 $\{7,8,9\}$
have been surrounded.

The participants of the subgroup
 $\{7,8,9\}$
are linked in different ways according to the graphical dependence structures under consideration. For the three last graphical dependence structures ((d), (e) and (f)), the three participants 7,
 $8$
and 9 are strongly connected since there exists a path of length 3 that interconnects them. For the two first graphical dependence structures ((a) and (b)), there is an edge between participants 8 and 9, and participant 7 is either not connected to the these two participants in case of (b) or connected but separated by other participants in case of (a). For the last structure (c), the three participants are separated by at least another participant. For none of these structures the triplet
 $\{7,8,9\}$
is a clique.
The values of the probabilities of the univariate Bernoulli distributions are given in Figure 4 for each participant and each graph. For the random graph, the tree graph, the hub graph and the lattice graph, these probabilities are roughly homogeneous between participants. For the cluster graph and the circle graph, one or two participants may have a probability of occurrence significantly lower than for the other participants. We chose randomly the parameters in such a way that that there exists at least one participant with a marginal probability of occurrence different from the other participants.
Ising probabilities.

Correlation matrices for the Ising models.

For the graphical dependence structures (a), (c) and (f), participants 7 and 8 have approximately the same marginal occurrence probability and participant 9 has a higher probability, while participant 7 has the higher probability for the structure (e). For the graphical dependence structure (d), the occurrence probabilities are the same for the three participants. For the graphical dependence structure (b), the occurrence probability of participant 8 is very low compared to the other ones.
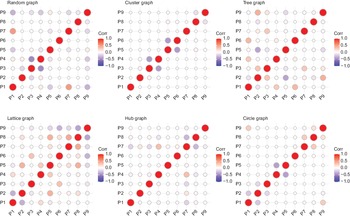
We also provide in Figure 5 the graphical representations of the correlation matrices for the Bernoulli random vector
 $\textbf{\textit{I}}$
for each graph to visualise the intensity of dependencies between occurrences of participants. Notice that the correlation coefficients may be either positive, negative or null, showing the adaptability of the Ising model. However, they are bounded by functions of the probabilities of the (univariate) Bernoulli distributions: if
 $\rho _{ij}$
denotes the correlation coefficient between
 $I_{i}$
and
 $I_{j}$
, then
 \begin{equation*}\max \left\{ -\sqrt{\frac{p_{i}p_{j}}{\left( 1-p_{i}\right) \left(1-p_{j}\right) }},-\sqrt{\frac{\left( 1-p_{i}\right) \left( 1-p_{j}\right) }{p_{i}p_{j}}}\right\} \leq \rho _{ij}\leq \sqrt{\frac{p_{i}\wedge p_{j}\left(1-p_{i}\vee p_{j}\right) }{p_{i}\vee p_{j}\left( 1-p_{i}\wedge p_{j}\right) }}\end{equation*}
where
 $p_{i}=\mathrm{P}[I_{i}=1]$
, as explained, e.g. in Joe (Reference Joe1997), page 2010. Figure 5 shows that very different correlation patterns emerge from the different graphs, as shown in Figure 1. We observe that the correlation matrices are relatively sparse and that the significant values may be either positive or negative. The values of the parameters of the Ising models have been chosen (randomly) to show the variety of the intensities of dependencies between the nodes of the network.
For the first three graphical dependence structures (a), (b) and (c), for which there is no path of length 3 between participants 7, 8 and 9, the correlations between their respective occurrences are close to zero. For the last three Ising graphs for which there is a path of length 3 between these participants, significant correlations are obtained but the correlation structures may differ significantly. For the lattice graph (d), participants 7 and 8 have positively correlated occurrences while participants 8 and 9 have negatively correlated occurrences. For the hub graph (e), participants 7 and 8 have positively correlated occurrences while participants 8 and 9 have uncorrelated occurrences. For the circle graph (f), participants 7 and 8, as well as participants 8 and 9, have positively correlated occurrences.
5.2 Individual severity models
For the graphs
 $G_{i}$
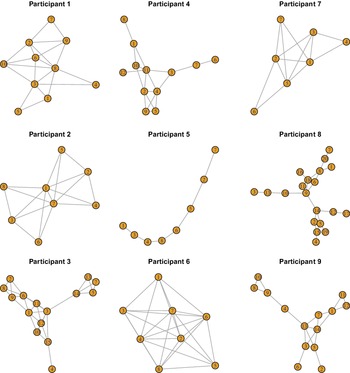
describing the spread of losses inside each participating unit, we consider the decomposable graphs given in Figure 6. The numbers of vertices, the numbers of edges, the sets of maximal cliques and the sets of minimal separators for all graphs are listed in Appendix for the reader who would like to build their junction tree. We selected (randomly) different shapes and intensities of interconnectedness, once again to show the flexibility provided by the family of decomposable graphs. The graph describing the spread of losses inside the unit corresponding to participant 1 has been analysed in Figure 2. A similar analysis can be performed for the graphs of the other participants considered in the numerical illustration.
Participants’ graphs
 $G_i$
,
 $i\in\{1,\ldots,9\}$
.

For each participant i, the random vector
 $\textbf{\textit{Z}}_{i}$
obeys multivariate LogNormal distribution based on the decomposable graph
 $G_{i}$
. LogNormal distributions are traditionally used by actuaries for rate-making or for the estimation of reserves. The means of the associated multivariate normal distributions are assumed to be equal to zero and their precision matrices (the inverse of the variance–covariance matrices) are listed in Appendix. Notice that every multivariate normal distributions defined on a maximal clique have precision matrices with non-zero entries. Figure 7 displays the histograms of the severities for each participant. They have been obtained with
 $10^{6}$
simulations. As aggregations of dependent, LogNormally distributed random variables, their shape are also close from the one of a LogNormal distribution. The distributions for participants 1, 2, 6 and 7 appear to be skewer compared to other participants.
Histograms of participants’ individual severities
 $C_{i}$
.

For the subgroup of participants 7, 8 and 9, we observe that the distributions of their aggregated losses are quite different. Participant 7 has the distribution with the smaller mean and the skewer distribution in this subgroup, while participant 8 has the larger total losses mean.
5.3 Conditional mean risk-sharing values
The conditional mean risk-sharing values as well as the conditional mean risk-sharing proportions are provided, respectively, in Figures 8 and 9 according to the values of the sum of the risks, S. These values have been estimated using
 $10^{6}$
simulations. Depending on the Ising models, the shapes and the levels of the conditional mean risk-sharing values and proportions change significantly. We can see that the curves of the conditional expectations are non-linear most of the time.
Conditional mean risk-sharing values.

Cumulated conditional mean risk-sharing proportions. Dashed lines provide the values of the cumulated (unconditional) mean risk-sharing proportions.

Let us now focus more specifically to the subgroup of participants 7, 8 and 9. First, notice that the unconditional participants’ proportions differ between the several Ising graphical dependence structures mainly because of the different values of their marginal occurrence probabilities. In particular, participant 8 has low proportions for all the values of S for the cluster graphical structure compared to the other graphical dependence structures because, as mentioned previously, her occurrence probability is more than three times smaller than the probabilities for the other graphical dependence structures.
Second, it can be observed on Figure 8 that, as S becomes large (around 70), the conditional mean risk-sharing values of participant 8 begins to dominate the conditional mean risk-sharing values of the other participants except for the cluster graphical structure (for the reason explained above). This is because the probabilities to observe total losses higher than 20 are only significant for participant 8 and implies that, when S is large, it is expected that participant 8 contributes mostly to S.
Third, the conditional mean risk-sharing proportions of participant 7 are roughly constant whatever the value of S except for the hub graphical dependence structure where her conditional mean risk-sharing proportions decrease with S, while at the same time, the conditional mean risk-sharing proportions of participant 8 increase. This can be explained by the fact that the aggregated losses mean is smaller for participant 7 than for participant 8, and that there exists a negative correlation between their joint occurrences.
Fourth, for the graphical dependence structures for which participants 8 and 9 are linked by an edge (structures (a), (b), (d) and (f)), the respective conditional mean risk-sharing proportions of these participants vary significantly with S. The conditional mean risk-sharing proportions of participant 8 are negligible compared to participant 9 for small values of S, while they become dominant for values of S around and above 80. We conclude that the existence of an edge between these participants has a strong impact on their conditional mean risk-sharing proportions.
5.4 Alternative scenarios for the tree graphical dependence structure
To understand the impact of some assumptions on the results, we consider alternative scenarios. Here, we only consider the case of the tree graphical dependence structure (c). The conclusions are broadly similar for the other graphical dependence structures.
First, we replace the assumption of dependencies between participants by the assumption of independent occurrences, but assuming the marginal occurrence probabilities of the participants are the same in both cases. We observe on Figure 10 that the independence assumption modifies significantly the conditional mean risk-sharing proportions of all participants, but that the differences between these proportions disappear when S becomes very large.
Cumulated conditional mean risk-sharing proportions when the participants’ graph structure is the tree graph (left panel) and when the occurrences of the participants are assumed to be independent with the same marginal probabilities (right panel).

Second, we replace the assumption that the individual losses (the random variables
 $Z_{ij}$
) have a LogNormal distribution by the assumption that they have a Gamma distribution with the same means and variances (see Figure 11). The conditional mean risk-sharing proportions of the participants are almost not modified.
Cumulated conditional mean risk-sharing proportions for the tree graphical dependence structure and when the distributions of individual losses are LogNormal (left panel) and when the distributions of individual losses are Gamma with same means and variances (right panel).

Cumulated conditional mean risk-sharing proportions for the tree graphical dependence structure and when the distributions of individual losses are LogNormal (left panel) and when the distributions of individual losses are LogNormal with same means, but with four times greater variances (right panel).

Third, we modify the parameters of the LogNormal distributions of the individual losses so that their variances are multiplied by a factor 4 and their means are left unchanged. The conditional mean risk-sharing proportions of the participants remain mostly unchanged (see Figure 12).
We deduce from these alternative scenarios that the graphical dependence structure of the occurrences may have a stronger impact on the conditional mean risk-sharing values than the distributions of the individual losses or their variabilities.
6. Conclusion and Discussion
The conditional mean risk-sharing rule proposed by Denuit & Dhaene (Reference Denuit and Dhaene2012) has proven to be relevant for actuarial applications when risks are assumed to be independent. Denuit & Robert (Reference Denuit and Robert2020b) provides results for the conditional expectations involved in this allocation rule when risks are no more independent, but their analytical expressions may be difficult to be handled for general models and when the number of participants is large. Noteworthy exceptions are models for which these conditional expectations are linear in the total loss amount (e.g. infinitely divisible multivariate distributions) or models, where risks are conditionally independent losses correlated by common latent factors in a multivariate mixture model. In this paper, we propose an individual model with graphical dependencies that are very convenient to compute the conditional mean risk-sharing values. Graphical models offer a powerful opportunity to summarise efficiently the conditional dependence structures through graph-based representations. The choice of the Ising model for the joint loss occurrences as well as the decomposable graphical models for severities allows to use the same graphs or sub-graphs of these models to compute the sharing losses amounts.
The present paper offers practitioners new tools for managing community-based insurance pools when dependencies between participants or dependencies within each participant’s structure cannot be ignored.
Acknowledgements
The authors would like to thank two anonymous Referees, an Associate Editor and the Editor for their constructive comments, which greatly helped to significantly improve this paper compared to an initial version.
Appendix
Participant 1’s decomposable graph and precison matrix
-
• Number of vertices: 10
-
• Number of edges: 20
-
• Maximal cliques
–1: 5 3 1 –2: 8 3 1 –3: 8 3 4 –4: 8 3 6 10 –5: 8 2 6 10 –6: 8 2 6 9 –7: 7 2 9
-
• Minimal separators
–1: –2: 3 1 –3: 8 3 –4: 8 3 –5: 8 6 10 –6: 8 2 6 –7: 2 9
-
• Precision matrix of the Gaussian vector:

Participant 2’s decomposable graph and precison matrix
-
• Number of vertices: 8
-
• Number of edges: 17
-
• Maximal cliques
–1: 1 7 4 2 –2: 1 7 5 2 –3: 1 7 3 6 –4: 1 7 3 8
-
• Minimal separators
–1: –2: 1 7 2 –3: 1 7 –4: 1 7 3
-
• Precision matrix of the Gaussian vector:

Participant 3’s decomposable graph and precison matrix
-
• Number of vertices: 15
-
• Number of edges: 30
-
• Maximal cliques
–1: 3 1 11 6 –2: 3 1 11 12 –3: 3 1 10 12 –4: 3 15 12 10 –5: 9 6 1 –6: 2 6 8 9 –7: 4 15 –8: 3 14 –9: 5 7 13 14
-
• Minimal separators
–1: –2: 3 1 11 –3: 3 1 12 –4: 3 12 10 – 5: 6 1 –6: 6 9 –7: 15 –8: 3 –9: 14
-
• Precision matrix of the Gaussian vector:

Participant 4’s decomposable graph and precison matrix
-
• Number of vertices: 12
-
• Number of edges: 18
-
• Maximal cliques
–1: 8 1 –2: 11 1 10 –3: 11 2 10 –4: 11 2 4 –5: 11 3 4 –6: 5 4 2 9 –7: 7 3 –8: 6 7 – 9: 11 12
-
• Minimal separators
–1: –2: 1 –3: 11 10 –4: 11 2 –5: 11 4 –6: 4 2 –7: 3 –8: 7 –9: 11
-
• Precision matrix of the Gaussian vector:

Participant 5’s decomposable graph and precison matrix
-
• Number of vertices: 8
-
• Number of edges: 7
-
• Maximal cliques
–1: 1 3 –2: 3 4 –3: 4 8 –4: 6 8 –5: 6 5 –6: 2 5 –7: 2 7
-
• Minimal separators
–1: –2: 3 –3: 4 –4: 8 –5: 6 –6: 5 –7: 2
-
• Precision matrix of the Gaussian vector:

Participant 6’s decomposable graph and precison matrix
-
• Number of vertices: 8
-
• Number of edges: 25
-
• Maximal cliques
–1: 2 4 6 7 3 1 –2: 2 4 6 7 3 8 –3: 2 4 6 7 5 8
-
• Minimal separators
–1: –2: 2 4 6 7 3 –3: 2 4 6 7 8
-
• Precision matrix of the Gaussian vector:

Participant 7’s decomposable graph and precison matrix
-
• Number of vertices: 7
-
• Number of edges: 13
-
• Maximal cliques
–1: 1 2 5 3 –2: 1 2 5 7 –3: 6 5 2 –4: 1 4 3
-
• Minimal separators
–1: –2: 1 2 5 –3: 5 2 –4: 1 3
-
• Precision matrix of the Gaussian vector:

Participant 8’s decomposable graph and precison matrix
-
• Number of vertices: 20
-
• Number of edges: 25
-
• Maximal cliques
–1: 8 1 –2: 8 6 18 –3: 9 18 6 –4: 9 18 11 –5: 9 10 –6: 13 10 –7: 3 13 –8: 9 14 –9: 2 5 14 –10: 2 5 15 –11: 5 19 15 –12: 4 15 –13: 16 18 –14: 12 14 –15: 12 17 –16: 8 20 –17: 7 20
-
• Minimal separators
–1: –2: 8 –3: 18 6 –4: 9 18 –5: 9 –6: 10 –7: 13 –8: 9 –9: 14 –10: 2 5 –11: 5 15 –12: 15 –13: 18 –14: 14 –15: 12 –16: 8 –17: 20
-
• Precision matrix of the Gaussian vector:

Participant 9’s decomposable graph and precison matrix
-
• Number of vertices: 14
-
• Number of edges: 20
-
• Maximal cliques
–1: 1 7 14 –2: 13 14 7 –3: 13 14 5 3 –4: 2 5 –5: 13 4 –6: 9 4 –7: 8 9 10 –8: 11 12 1 –9: 6 3
-
• Minimal separators
–1: –2: 14 7 –3: 13 14 –4: 5 –5: 13 –6: 4 –7: 9 –8: 1 –9: 3
-
• Precision matrix of the Gaussian vector: