I. INTRODUCTION
Silicides are both scientifically and technologically important, and have been extensively studied (Szytuda and Leciejewicz, Reference Szytuda and Leciejewicz1994). The crystal structure of the Al3Ho2Si2 compound was firstly studied by neutron diffraction (Chen et al., Reference Chen, Sieve, Henning, Schultz, Brazis, Kannewurf, Cowen, Crosby and Kanatzidis1999). The compound is monoclinic, space group C12/m1, a = 10.083(3), b = 4.0175(9), c = 6.566(1) Å, β = 100.73(2)°, and Z = 2. These results agree with those obtained from single-crystal X-ray diffraction data by Bobev et al. (Reference Bobev, Tobash, Fritsch, Thompson, Hundley, Sarrao and Fisk2005).
Until now, experimental X-ray powder diffraction pattern for Al3Ho2Si2 has not been reported in the PDF (ICDD, Reference Kabekkodu2011). In this paper, we present high-quality powder X-ray diffraction data for well-crystallized Al3Ho2Si2.
II. EXPERIMENTAL
A. Synthesis
Polycrystalline specimen of Al3Ho2Si2 with a total weight of 2 g was prepared by arc melting the stoichiometric amounts of elemental constituents (99.9 wt% Al, 99.9 wt% Ho, and 99.999 wt% Si) under high purity argon atmosphere. To ensure the homogeneity of the sample, it was melted several times. The weight losses were less than 1 wt%. After melting, the sample was enclosed in an evacuated quartz tube and annealed at 1073 K for 720 h, and finally cooled down to room temperature at a rate of 10 K h−1. The annealed ingot was ground in an agate mortar, pestled to particle sizes of not larger than 10 µm, and then annealed in an evacuated quartz tube at 573 K for 48 h to remove residual stresses.
B. Data collection
Powder X-ray diffraction data were collected at room temperature on a Rigaku D/max 2006 diffractometer with CuKα radiation and a diffracted-beam graphite monochromator. The diffractometer was operated at 40 kV and 150 mA; the 2θ scan range was from 20 to 100° with a step size of 0.02° and a counting time of 2 s per step. After data collection, the stabilities of both the X-ray source and the specimen were checked by recording again the diffraction lines at low angles. Two sets of XRD data were collected, one with SRM 640 Si added as an internal standard to correct for possible systematical errors in the observed peak positions and the other without SRM 640 Si. The XRD pattern recorded from the specimen added with Si internal standard was used for indexing and for determining space group and unit-cell information, while the XRD pattern without Si internal standard was used for determining diffraction intensities. The 2θ obs values of the peaks were determined by the Savitzky–Golay second derivative using JADE 6.0 (2002) XRD Pattern Processing software of Materials Data, Inc. after smoothing the patterns, fitting and removing the background, and stripping the CuKα 2 peaks. Values of unit-cell parameters were then obtained by the least-squares method using JADE 6.0.
III. RESULTS
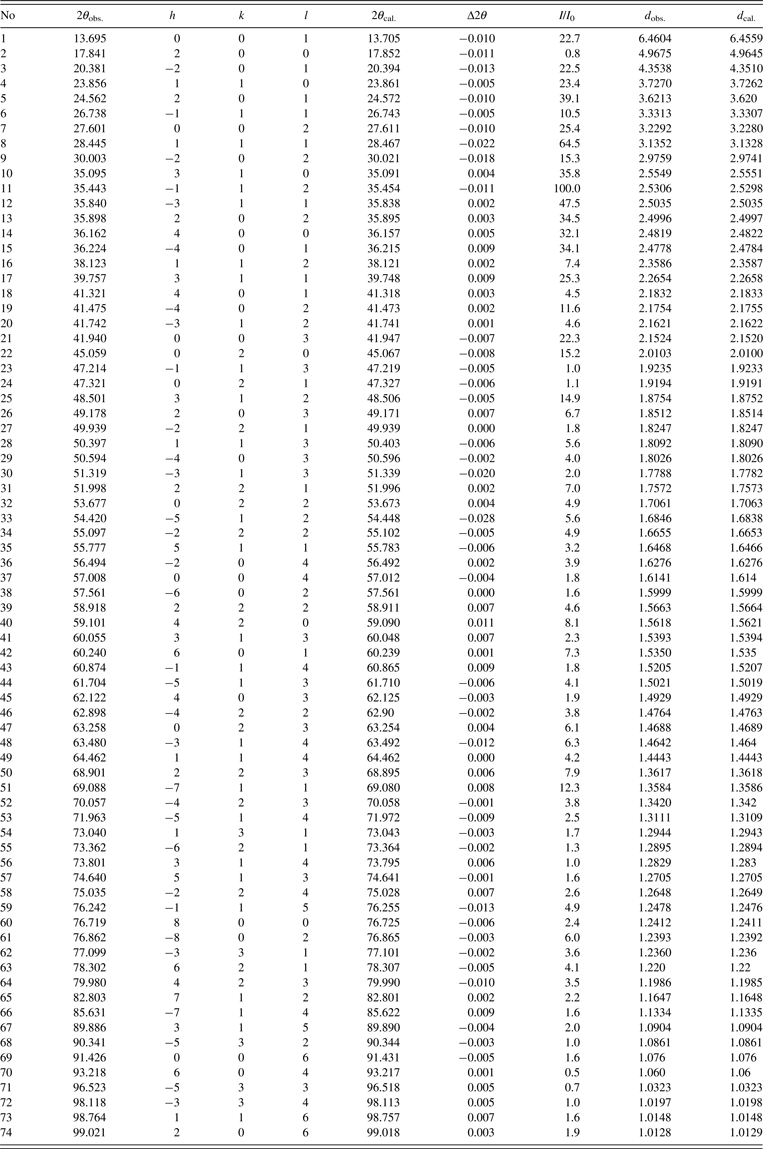
The powder diffraction pattern of Al3Ho2Si2 (Figure 1) were well indexed with the program JADE 6.0. The compound crystallizes in the C-centered monoclinic with the Al3Y2Si2 structure type (space group C12/m1), the lattice parameters a = 10.1096(2) Å, b = 4.020(6) Å, c = 6.5734(6) Å, β = 100.848(2)°, V = 262.37 Å3, Z = 2, and ρ x = 5.910 g cm−3. The figure of merit for indexing F N (Smith and Snyder, Reference Smith and Snyder1979) is F 30 = 142.8(0.006, 35). The value of RIR (RIR = 0.91) was obtained from the value of the ratio of the strongest line in the pattern to the strongest line of corundum in a 50–50 wt% mixture of the two compounds. The observed and the calculated X-ray powder diffraction data for Al3Ho2Si2 are listed in Table I.
The powder X-ray diffraction pattern of Al3Ho2Si2.

Powder diffraction data for Al3Ho2Si2 (CuKα1 , with λ = 1.5406 Å).

ACKNOWLEDGEMENT
This work was supported by the Natural Science Foundation of Guangxi (No. 2011GXNSFA018034).