I. INTRODUCTION
Ni-based alloys and austenitic stainless steel are frequently used as structural engineering materials under irradiation and high temperature in current and planned nuclear power systems. Reference Zinkle and Was1,Reference Kenik and Busby2 After exposure to high-temperature irradiation, microstructural changes exist due to the creation of irradiation-induced mobile point defects and defect agglomerations such as voids and dislocations. The nonequilibrium transport of solute atoms and point defects to grain boundaries (GBs) is known to cause dramatic changes in the localized solute composition and void distributions, which factor into irradiation assisted stress corrosion cracking and embrittlement. Reference Zinkle and Was1,Reference Bruemmer, Simonen, Scott, Andresen, Was and Nelson3,Reference Was, Wharry, Frisbie, Wirth, Morgan, Tucker and Allen4 In Ni–Cr based alloys, radiation-induced segregation (RIS) to GBs leads to unwanted Cr depletion at GBs and other point defect sinks. The response of individual GBs to RIS and other irradiation-induced defects, however, is dependent on a number of factors including the GB structure or character. Therefore, it is important to have comprehensive knowledge of how specific types of GBs respond after irradiation to assist in development of enhanced radiation tolerant materials for more demanding irradiation environments.
GB-dependent material response to irradiations and other extreme environments have garnered extensive research in the past with a number of studies that examine factors related to both the misorientation angle and GB plane in austenitic stainless steel, Reference Duh, Kai and Chen5–Reference Sakaguchi, Endo, Watanabe, Kinoshita, Yamashita and Kokawa8 Cu, Reference Demkowicz, Anderoglu, Zhang and Misra9–Reference Li, Hattar and Misra11 and ferritic martensitic alloys. Reference Field, Barnard, Parish, Busby, Morgan and Allen12,Reference Field, Miller, Chichester, Sridharan and Allen13 Recently, particular emphasis has been put on accounting for the variations in GB plane RIS behavior in stainless steels for the Σ3 twin, a particular low coincidence site lattice (CSL) GB. Reference Sakaguchi, Endo, Watanabe, Kinoshita, Yamashita and Kokawa8,Reference Barr, Vetterick, Unocic, Hattar, Bai and Taheri14,Reference Lee, Jin, Lee and Kwon15 The Σ3 coherent twin GB, a symmetric twin with {111} inclination, has been reported to have little to no Cr depletion. However, noncoherent Σ3 GBs and specifically incoherent twin GBs, a symmetric twin with {112} inclination, have shown extensive Cr depletion at the levels of random high-angle GBs. The width of GB void denuded zones (VDZs), regions depleted of voids adjacent to GBs, has also shown GB character-dependent response. Reference Demkowicz, Anderoglu, Zhang and Misra9,Reference Han, Fu, Demkowicz, Wang and Misra16 Han et al. Reference Han, Demkowicz, Fu, Wang and Misra17 found significant correlation between the widths of He irradiation-induced VDZs and GB character in Cu at elevated temperature, indicating variability in GB sink efficiency with misorientation angle and GB plane. Reference Han, Demkowicz, Fu, Wang and Misra17 The studies that examine VDZs and RIS on the same GB structure, however, are missing; these studies would result in a significantly more complete characterization of GB character response to irradiation damage and are the focus of this work.
Recent computational studies support the importance of GB structure on the evolution of RIS and behavior of radiation-induced defects. Atomistic modeling studies indicate significant variations in GB energy, vacancy formation energy, and interstitial formation energy as a function of GB character. Reference Bai, Vernon, Hoagland, Voter, Nastasi and Uberuaga18–Reference Tschopp, Horstemeyer, Gao, Sun and Khaleel21 For example, Bai et al. Reference Bai, Vernon, Hoagland, Voter, Nastasi and Uberuaga18 highlight the overall bias for GB absorption of interstitials compared to vacancies and indicate that different atomic GB structures, variations in tilt and twist character, can have different interactions with pristine and interstitial loaded GBs. In addition, to predictively understand RIS, recent studies have undertaken ab initio based rate theory modeling of RIS in model Ni–Cr alloys, an approach that accounts for both vacancy and interstitial defect–solute interactions. Reference Barnard, Tucker, Choudhury, Allen and Morgan22–Reference Tucker, Najafabadi, Allen and Morgan24 These models build on existing rate theory models that rely on experimental fitting and the assumption of vacancy dominated behavior. Reference Was, Wharry, Frisbie, Wirth, Morgan, Tucker and Allen4,Reference Perks, Marwick and English25,Reference Allen and Was26 The results, accounting for both self-interstitial diffusion and vacancy diffusion of Ni and Cr which are consistent with ab initio energetics, provide a good agreement with experimental RIS in a model Ni–18Cr alloy. Reference Barnard and Morgan23 In addition, Field et al. Reference Field, Barnard, Parish, Busby, Morgan and Allen12 compared similar ab initio based rate theory modeling with GB character-dependent boundary conditions to experimental results in a proton irradiated Fe–9 wt% Cr alloy. The excellent agreement between experiments and ab initio based models found by Field et al. indicates that GB character can account for variations in the level of Cr segregation seen experimentally.
In this study, a direct evaluation of experimental and ab initio based rate theory modeling of RIS with GB character variations is explored in a model Ni–5Cr alloy. The study provides an important step in developing predictive rate theory models that can account for GB character-dependent RIS and other radiation-induced phenomena such as VDZs. The experimental observations of the RIS and VDZ in this study reveal a significant dependence on GB plane in the Σ3 twin GB structure.
II. MATERIAL AND METHODS
A. Experimental methods
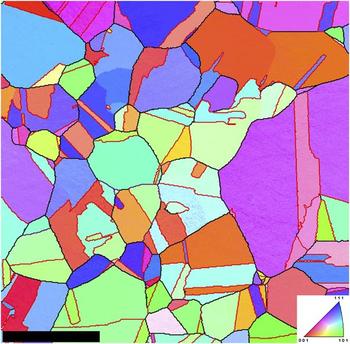
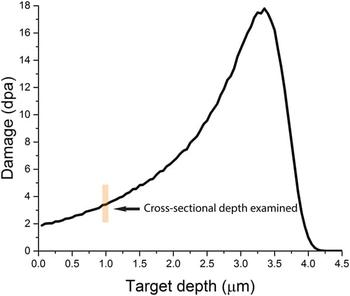
A Ni–5Cr binary alloy was used as model alloy with the nominal composition (given in wt%): 94.94 Ni, 5.0 Cr, 0.01 Si, 0.005 S, <0.005 P, 0.01 Co, with remaining impurities in the parts per million range or less. The alloy was thermomechanically processed from the as-received condition, which consisted of a 25% rolling reduction, followed by 1050 °C, 1 h solution anneal and water quench. Electron backscatter diffraction (EBSD) was used to determine the GB character distribution of the Ni–5Cr alloy; a representative microstructure is shown in Fig. 1. The average grain size diameter with twin boundaries included is 145 µm. Low CSL GBs such as the Σ3 twin boundary were calculated using the Brandon criterion. Reference Brandon27 The Σ3 GB plane normal was assessed using the in-plane angle of Σ3 GB line traces as described by Randle Reference Randle28 and automated in the EDAX-TSL orientation imaging microscopy (OIM) 6.1 software. Heavy-ion irradiations were completed at Sandia National Labs Ion Beam facility using 20 MeV Ni4+ ions at 500 ± 10 °C to a fluence of 1.9 × 10¹⁶ ions/cm2. This temperature was chosen to compare to the literature in which 500 °C is the most common temperature used for RIS studies in Fe–Ni–Cr alloys for Ni-ion irradiations to model neutron irradiation phenomena. Reference Bruemmer, Simonen, Scott, Andresen, Was and Nelson3,Reference Was and Allen29 The irradiation damage conditions were determined using the quick Kinchin-Pease calculation in SRIM 2013 with 40 eV displacement threshold energy and 0 eV lattice binding energy for both Ni and Cr. Reference Stoller, Toloczko, Was, Certain, Dwaraknath and Garner30 The resultant damage profile as a function of depth is shown in Fig. 2. At a cross-sectional depth of 1 µm, the corresponding displacement per atom (dpa) was 3.4. The depth of 1 µm is examined in this study to minimize any potential injected interstitial effect with the heavy Ni-ion irradiation Reference Garner31 and has the same dose across all samples for both the RIS and VDZ measurements. Following irradiation, EBSD was used to locate specific GBs for RIS measurements while FEI Strata Dual Beam 235 SEM-FIB was used to prepare GB character specific cross-sectional transmission electron microscopy (TEM) samples with an estimated thickness between 80 and 100 nm.
Inverse pole figure colored orientation map illustrating coarse grain microstructure of the thermomechanically processed Ni–5Cr alloy; GB segments are overlaid and shown by color where high-angle GBs are colored by black lines, low-angle GBs are colored by purple lines, and Σ3 GBs are colored by red lines; scale bar is 400 µm while the bottom right inset indicates color code for inverse pole figure.

SRIM-based calculation of damage (dpa) versus target depth (µm) for the examined fluence of 1.9 × 10¹⁶ ions/cm2 in the bulk Ni–5Cr 500 °C irradiation.

Scanning TEM (STEM)-energy dispersive x-ray spectroscopy (EDS) line profiles to determine RIS on different GB characters were completed using a Philips CM200 TEM/STEM with an EDAX-EDS detector at 200 kV, ∼1.2 nm full width, half maximum probe size. To provide an overview of the GB microchemistry, a minimum of 6 line scans per GB were completed on each GB character examined where GBs were edge-on to the incident electron beam. Two separate GBs were used in scenarios in which full GB character could be confirmed such as the coherent and incoherent twins. For all GB line scans analyzed, scans were completed within ±0.25 µm of the 1 µm cross-sectional targeted depth. The Cliff–Lorimer equation with experimental k-factor values was used to determine the composition in wt% of Ni and Cr (Ni + Cr = 1). Reference Williams and Carter32 VDZs were determined for the same GBs examined by STEM-EDS by measuring the region without voids adjacent to GBs in bright-field TEM micrographs. Voids were imaged using an underfocused bright-field TEM condition, while the VDZ was assessed at the same cross-sectional depth as the RIS measurements, 1 µm.
B. Ni–Cr rate theory model method
RIS was studied theoretically by an approach analogous to that of Field et al., Reference Field, Barnard, Parish, Busby, Morgan and Allen12 which was based upon the rate theory description of RIS developed by Wiedersich Reference Wiedersich, Okamoto and Lam33 with modified boundary conditions of Duh et al. Reference Duh, Kai, Chen and Wang34 Briefly, this approach is based upon solving coupled one-dimensional diffusion equations of the following form:
 $$\eqalignb{ & {{{\mathop{\rm d}\nolimits} {C_m}} \over {{\mathop{\rm d}\nolimits} t}} = - {{{\mathop{\rm d}\nolimits} {J_m}} \over {{\mathop{\rm d}\nolimits} x}} \cr & {{{\mathop{\rm d}\nolimits} {C_p}} \over {{\mathop{\rm d}\nolimits} t}} = {K_0} - \sum {{K_{{\rm{loss}}}}} - {{{\mathop{\rm d}\nolimits} {J_p}} \over {{\mathop{\rm d}\nolimits} x}}\quad {\rm{,}} \cr}$$
where C i and J i are the concentration and flux of component i as functions of time t and position x. The subscript m refers to metal species (Ni or Cr) and p refers to point defect species (vacancy or interstitial). The term K 0 is the net production rate of point defects and the summation over the K loss terms account for the loss of point defects by mechanisms such as mutual recombination and annihilation at sinks other than GBs (e.g., dislocations). A complete description of these terms can be found in Field et al. Reference Field, Barnard, Parish, Busby, Morgan and Allen12 and Barnard and Morgan. Reference Barnard and Morgan23 The fluxes in Eq. (1) are evaluated by the following expressions:
 $$\eqalignb{ & {J_{{\rm{Ni}}}} = - {d_{v{\rm{Ni}}}}\left[ {{C_v}\nabla {C_{{\rm{Ni}}}} - {C_{{\rm{Ni}}}}\nabla {C_v}} \right] - {d_{i{\rm{Ni}}}}\left[ {{C_i}\nabla {C_{{\rm{Ni}}}} + {C_{{\rm{Ni}}}}\nabla {C_i}} \right] \cr & {J_{{\rm{Cr}}}} = - {d_{v{\rm{Cr}}}}\left[ {{C_v}\nabla {C_{{\rm{Cr}}}} - {C_{{\rm{Cr}}}}\nabla {C_v}} \right] - {d_{i{\rm{Cr}}}}\left[ {{C_i}\nabla {C_{{\rm{Cr}}}} + {C_{{\rm{Cr}}}}\nabla {C_i}} \right] \cr & {J_v} = {d_{v{\rm{Ni}}}}\left[ {{C_v}\nabla {C_{{\rm{Ni}}}} - {C_{{\rm{Ni}}}}\nabla {C_v}} \right] + {d_{v{\rm{Cr}}}}\left[ {{C_v}\nabla {C_{{\rm{Cr}}}} - {C_{{\rm{Cr}}}}\nabla {C_v}} \right] \cr & {J_i} = - {d_{i{\rm{Ni}}}}\left[ {{C_i}\nabla {C_{{\rm{Ni}}}} + {C_{{\rm{Ni}}}}\nabla {C_i}} \right] - {d_{i{\rm{Cr}}}}\left[ {{C_i}\nabla {C_{{\rm{Cr}}}} + {C_{{\rm{Cr}}}}\nabla {C_i}} \right]\quad {\rm{,}} \cr}$$
where d pm is the diffusion coefficient of metal species m via diffusion mediated by point defect of type p.
While the boundary conditions in conventional Wiedersich-type RIS models typically treat one boundary of the system as an ideal defect sink, the Duh boundary conditions represent the sink boundary as a GB characterized by a tilt angle and a GB energy. These two parameters determine the strength of the sink: high angle, high GB energy GBs behave as strong sinks and result in large RIS values, while low angle, reduced GB energy GBs are weak, inefficient sinks which lead to more mild RIS. One exception in this work to the boundary condition used in the Duh model was made for the Σ3, 60° <111> GB. The model of Duh treats this GB as a special, low energy twin boundary that behaves similar to a low-angle GB. However, both coherent and incoherent Σ3 GBs were observed in this work. The Duh condition was applied for the coherent Σ3 GB, however, incoherent Σ3 GBs exhibit boundary energies that are comparable to general high-angle GBs. Therefore, the incoherent Σ3 GB was treated as a general high-angle GB in the Duh model, rather than as a special low-angle boundary. A tilt angle of 50° was chosen for this boundary to use in the model calculations, as the model gives nearly identical results for all general high-angle boundaries above about 15°. For misorientation angles above this value (with the exception of specific special CSL boundaries), the grain boundary energy and density of defect annihilation sites are high enough that the boundary behaves as an ideal sink. Thus, for all such boundaries, the ideal sink boundary condition behavior is observed and RIS is insensitive to the specific grain boundary angle in this regime. The boundary condition treatment allows the results of the RIS model to be compared to RIS measurements at different GBs in the real material. A modeled electron probe signal was convolved with the simulated concentration profiles to enable the most accurate comparison to the experimental profiles, using the same settings and approaches as done in Field et al. Reference Field, Barnard, Parish, Busby, Morgan and Allen12
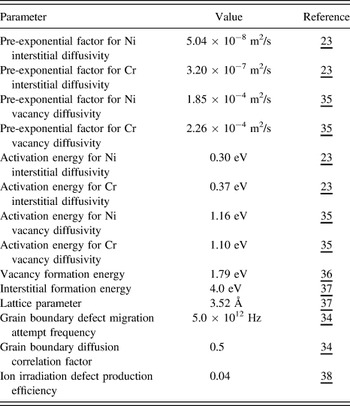
Field et al. Reference Field, Barnard, Parish, Busby, Morgan and Allen12 applied this modeling approach to RIS in Fe–Cr. Therefore, to model RIS in the Ni–5Cr alloy which is the topic of this study requires a set of model parameters appropriate for the Ni–Cr system. These parameters are summarized in Table I. RIS is predominantly determined by the relative diffusivities of the alloy species by the vacancy and self-interstitial mechanisms, appearing in Eq. (2). In this study, the Ni and Cr vacancy diffusivities were taken from experimental measurements, Reference Ruzickova and Million35 while the interstitial diffusivities were taken from first principles-based molecular dynamics simulations following the work of Barnard and Morgan. Reference Barnard and Morgan23 Cr is a faster diffuser than Ni by both the interstitial and vacancy mechanisms, however the bias is greater for the vacancy mechanism, which results in Cr depletion by RIS. The effect of interstitial diffusion is to partially counteract the vacancy effect, resulting in milder total segregation. The GB sink was implemented using GB energies in pure Ni as a function of boundary angle calculated via molecular dynamics simulations by Rittner and Seidman Reference Rittner and Seidman39 with the exception of the angle-axis pair of Σ3 twin, 60° <111> GB, which were obtained from the results of Olmsted et al. Reference Olmsted, Foiles and Holm40 The parameters in this model are independent of any RIS measurements; comparisons with experimental measurements are, therefore, entirely independent of predictions.
RIS model input parameters.

III. RESULTS
A. RIS as a function of GB character
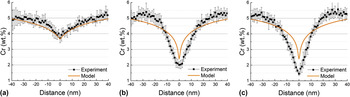
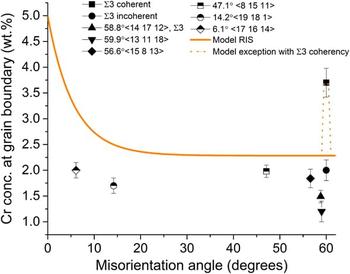
RIS profiles reveal notable variations in Cr depletion and Ni enrichment as a function of the GB character at 3.4 dpa. The most apparent difference is in the observed change in Cr depletion levels in the Σ3 GB as a function of inclination of the GB plane. Figure 3 highlights the large disparity in GB Cr concentration between the Σ3 coherent twin, {111}/{111} GB plane normal, and the Σ3 incoherent twin, {112}/{112} GB plane normal. The coherent twin has a GB Cr depletion level of 3.7 ± 0.3 wt% Cr compared to 2.0 ± 0.2 wt% Cr for the incoherent twin. These values correspond to 1.2 wt% Cr and 3 wt% Cr depletion at the coherent and incoherent GBs, respectively, which is between a factor of two to three times more depletion in the incoherent versus coherent twin. In addition to these two Σ3 symmetric tilt GBs, a third GB is considered which has a Σ3 CSL relationship but is highly deviated from the ideal 60° <111> Σ3 relationship. This GB shows a higher degree of Cr depletion compared to either the coherent or incoherent twin as highlighted in Fig. 3. The 58.8° <14 17 12> GB is considered a Σ3 GB using the Brandon criterion for CSL GBs but has a deviation of 8.2° from the ideal Σ3 misorientation. The level of Cr depletion seen in this highly deviated Σ3 is consistent with Cr depletion typically found in random high-angle GBs.
Experimental (black) and overlaid model (solid orange line) RIS profiles of (a) Σ3 coherent GB, (b) Σ3 incoherent GB, (c) 58.8 <14 17 12> Σ3 GB with a deviation of 8.2° from the ideal misorientation.

In addition to the Σ3 GBs measured, six other low- and high-angle GBs were examined in this study and are shown in Fig. 4. At this irradiation dose, the results indicate only small differences between different high-angle GBs and between the low- and high-angle GB regime. Figure 4 highlights the level of Cr depletion as a function of misorientation angle, which overall indicates a range of Cr depletion from 1.2 to 2.0% for all low- and high-angle GBs except the coherent twin. Due to this consistent RIS range, which varies by only 0.8 wt%, it appears that there is minimal difference in Cr depletion between low-angle and high-angle GBs examined in this study at 3.4 dpa.
Variation in Cr wt% concentration at the GB as a function of misorientation angle where bulk composition of Cr in matrix is 5.0 wt% Cr. The black line indicates the expected theoretical RIS Cr GB composition based on the rate theory model approach while the orange dashed line accounts for Σ3 coherency.

B. VDZs as a function of GB character
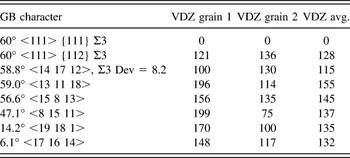
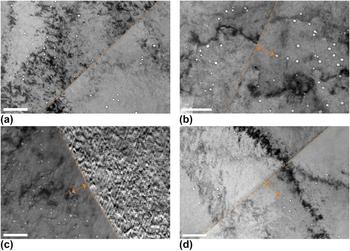
In parallel to the Cr depletion levels, Table II provides VDZs for each of the examined GB characters. The coherent twin shows effectively no VDZ, as is highlighted in Fig. 5(a), while the incoherent twin, shown in Fig. 5(b), indicates an average VDZ of 129 nm. The large difference in VDZ between the {111} and {112} symmetric tilt GB planes follows the same trend as the Cr RIS measurements. The effective zero VDZ of the coherent twin boundary is an indication of a weak sink for vacancies as compared to the incoherent twin GB. Figures 5(c) and 5(d) also highlight the large VDZ seen in the 58.8° highly deviated Σ3 GB and the 6.2° random low-angle GB, respectively.
Overview of the VDZ for all GBs examined in the study.

Void denuded zone in (a) coherent Σ3, (b) incoherent Σ3, (c) 58.8° highly deviated Σ3, and (d) 6.2° random low-angle GB; orange dashed line indicates location of grain boundary while orange lines with arrows are used to illustrate void denuded width; scale bar is 200 nm.

Table II also provides the VDZ behavior of the other random low- and high-angle GB. There appears to be no significant trend as a function of misorientation angle for the random GBs. Although no trends with misorientation angles are observed, the VDZ is asymmetric with respect to most of the GBs. The highest variation is seen in the 47.1° <8 15 11> where one side of the GB has VDZ of 75 nm and the other is 199 nm. Other large asymmetric VDZ behavior is seen with the 59° <13 11 18>, 14° <19 18 1>, and 6.1° <16 17 14> GBs.
C. Model Cr depletion versus experimental Cr depletion
Figure 3 compares the model predicted and experimentally measured Cr segregation profiles at three different GBs described in detail in Sec. III. A. The boundary depicted in Fig. 3(a) is a coherent Σ3 boundary. This boundary has a low enough energy or interaction with vacancies that it behaves as an inefficient defect sink. Consequently, RIS is reduced at this boundary. The GB model of Duh et al. Reference Duh, Kai, Chen and Wang34 captures this effect well and the model predicted that RIS profile shows good agreement with experimental measurement. In contrast, the angle of the boundary in Fig. 3(b) also corresponds to a Σ3 boundary, however it exhibits a grain boundary plane of an incoherent twin and is modeled differently from the coherent Σ3 boundary, as described in Sec. II. B. In both the model and experiments this GB appears to be a much more efficient defect sink than the coherent Σ3 boundary in Fig. 3(a) and therefore exhibits a much larger Cr depletion. Finally, the boundary depicted in Fig. 3(c) is close to a Σ3 GB, however it exhibits an 8.2 deviation from the ideal Σ3 misorientation. Therefore, even though the CSL notation as determined from the Brandon criterion labels the GB as Σ3, the large deviation indicates that it is not a coherent twin. Similar to the incoherent Σ3 boundary in Fig. 3(b), this boundary is a highly efficient defect sink which gives rise to a large RIS response. This GB type can be reasonably well characterized by the Duh model by treating it as a high-angle GB that is 8.2° deviant from the 60° Σ3 condition, and the predicted Cr segregation profile shows reasonable agreement with the experimental measurement.
In comparison of all the experimental RIS profiles with rate theory model, the RIS model generally seems to underestimate the RIS (see Fig. 4). The error is less than 1 wt% on average for the high-angle GBs but becomes more than 1.5 wt% for the 6.1° case, where the model predicts a strong reduction in RIS that is not observed in this low-angle GB. The origin of this discrepancy is not clear, but it appears that the model reduces the sink strength at too high an angle compared to experiment (see further discussion in Sec. IV. B). As mentioned above, the model does an excellent job predicting the very low RIS for the Σ3 twin system.
IV. DISCUSSION
A. Role of Σ3 twin boundary plane in void denuded zone and Cr depletion
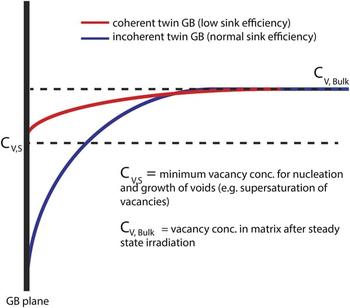
The Σ3 GB is a special case regarding anisotropic GB response to irradiation damage as indicated by the variation in Cr depletion and VDZ. It is clear based on both the Cr depletion and VDZs that the coherent twin is a defect sink with very low efficiency. However, the incoherent twin is comparable to random high angle defect sink efficiencies. The low and high sink efficiencies for the coherent and incoherent twin, respectively, can be related to the large variations in GB energy and are accounted for in the kinetic rate theory model. The weak interaction of the coherent twin boundary with point defects is supported by the inability to form a VDZ. Figure 6 provides a schematic of how the GB strength and vacancy point defect concentrations near the coherent and incoherent twin boundaries relate to the VDZ. At all distances away from the GB plane, there are observed voids near the coherent twin, and therefore the concentration of vacancies is above the threshold to nucleate and grow voids near this GB. On the other hand, the incoherent twin has an average VDZ of 120 nm (Table II). At distances below 120 nm, the steady state concentration of vacancies is below the threshold to nucleate and grow voids over the time scale of the experiment.
Schematic illustrating variation in vacancy concentration between coherent and incoherent twin Σ3 GBs.

Although the observation of no VDZ would indicate that the coherent twin does not interact with vacancies, the Cr depletion at this GB structure would indicate that this GB structure can interact with vacancies. RIS is well known to be linked to a preferential interaction between the vacancy defect flux and the Cr flux as shown by ab initio calculations of Barnard Reference Barnard and Morgan23 and discussed in Sec. II. B Ni–Cr rate theory model method. Therefore, the coherent twin is classified as a weak sink but still has a discernible interaction with irradiation enhanced point defects based on the Cr depletion at the GB from 5.0 to 3.7 wt% after irradiation. Recent studies have also indicated the ability of the coherent twin GB to interact with defect clusters during irradiation. Yu et al. Reference Yu, Bufford, Khatkhatay, Wang, Kirk and Zhang41 used in situ Kr ion irradiation in the TEM to observe both defect clusters being absorbed by coherent twin boundaries and the irradiation induced migration of twin boundaries in nanotwinned Ag. In a related study in nanotwinned Ag, Yu et al. Reference Yu, Bufford, Sun, Liu, Wang, Kirk, Li and Zhang42 also observed the removal or annihilation of stacking fault tetrahedra by coherent twin boundaries. They also show that the resultant interaction of stacking fault tetrahedra with twin boundaries which may rely on twin boundary migration create a high density of stacking faults adjacent to the twin boundary. The study indicates a possible mechanism related to the formation of incoherent twin boundary segments at the location of these stacking faults. These recent studies provide evidence that the coherent twin boundaries can interact with point defect clusters during irradiation but further experimental and modeling investigation is needed to link this behavior with vacancy and Cr and Ni solute interactions at this GB structure.
In addition to the coherent and incoherent twin boundaries examined, the heavily deviated from ideal Σ3 misorientation GB behaves similar to random high-angle GBs. The high angular deviation from the ideal misorientation of 8.2° is near the maximum cut off criterion of 8.6° for the Σ3 system using the Brandon criterion. The Brandon criterion, ΔΘ = 15° Σ3−0.5, provides a large range of GBs to be classified as a Σ3. Reference Engler and Randle43 More restrictive criterion such as the Palumbo–Aust, is recommended such that these highly deviated GBs are not categorized as Σ3 GBs. Reference Priester44 The 8.2° deviation from the ideal misorientation for this grain boundary, 58.8° <14 17 12>, indicates a significant amount of secondary dislocations in the GB if classified as a Σ3 GB. This is a larger angular misorientation than what is seen in the low angle 6.1° GB examined in results, which showed both high Cr depletion and large VDZs.
The variation of Cr depletion and VDZ with the coherent and incoherent symmetric tilt Σ3 GBs is a key indication of the large difference in atomic structure of these two GB structures. The coherent twin boundary has an extremely low GB energy compared to almost all other GBs. In pure fcc Ni, Olmsted et al. Reference Olmsted, Foiles and Holm40 calculated the GB energy of the coherent twin to be 64 mJ/m2 while the incoherent twin is 879 mJ/m2. It is clear that there is a link between the high atomic fit GB structure and energy of the coherent twin and the resultant minimized RIS and zero effective VDZ. Previous studies have also indicated this link between the coherency of the Σ3 GB structure and radiation-induced phenomena. Reference Sakaguchi, Endo, Watanabe, Kinoshita, Yamashita and Kokawa8,Reference Barr, Vetterick, Unocic, Hattar, Bai and Taheri14,Reference Han, Demkowicz, Fu, Wang and Misra17,Reference King and Smith45 Sakaguchi et al. Reference Sakaguchi, Endo, Watanabe, Kinoshita, Yamashita and Kokawa8 and Barr et al. Reference Barr, Vetterick, Unocic, Hattar, Bai and Taheri14 indicated that the level of Cr depletion is minimized at the coherent twin GB while the noncoherent twin GBs show similar Cr depletion as random high-angle GBs in 316L stainless steel. While Han et al. Reference Han, Demkowicz, Fu, Wang and Misra17 provided evidence of the variation in VDZs between coherent and incoherent twins in Cu after helium irradiation. Han et al. also find that the coherent twin GB in Cu has a zero effective VDZ, which is similar to the result found herein for the Ni–5Cr Σ3 coherent twin boundaries.
B. Low-angle and high-angle GB classification regimes for RIS and VDZ prediction
The model and experiment notably vary in the random high- and low-angle regime. First, at the reported 3.4 dpa, experimentally, the low- and high-angle GBs have similar Cr depletion. Therefore, the rate theory model, which has boundary conditions to account for assumed lower sink efficiency for lower energy, low misorientation angle GBs, diverges from the experimental findings. Based on the divergence in this case of the model and experiment, it would indicate that a model with sink strength boundary conditions to assume low-angle GBs have reduced sink strengths compared to high-angle GBs is unsuitable. Although random low-angle GBs typically have lower GB energies as compared to random high-angle GBs, it is apparent that GB energy or misorientation angle is an insufficient criterion to fully characterize the interaction of point defects with GBs and subsequently the GB sink strength or efficiency for low-angle GBs. This interpretation of the RIS modeling and experimental results (Figs. 3 and 4) are also supported by the large VDZ seen in the low-angle GBs: 133 and 135 nm for the 6.1° and 14.2° GBs, respectively. Duh et al. Reference Duh, Kai, Chen and Wang34 and Watanabe and Takamatsu Reference Watanabe and Takamatsu7 in 300 series stainless steel have previously indicated that lower angle GBs showed less Cr depletion, which supported the initial methodology of rate theory model. However, the reported dpa values were lower than this study and with different irradiation species, dose rate, temperature, and alloy system.
To support the observation that GB energy or misorientation angle is an insufficient criterion to determine a low-angle GB sink strength, a number of early studies have also found very little evidence for significant changes in sink strength down to quite low GB angles of just a few degrees of misorientation, Reference Burke and Stuckey46–Reference Siegel, Chang and Balluffi48 as summarized in Jiang et al. Reference Jiang, Swaminathan, Deng, Morgan and Szlufarska49 Siegel et al. Reference Siegel, Chang and Balluffi48 highlight the lack of variations in GB sink strength in quenched Au from high temperature by measurement of stacking fault tetrahedra free zone adjacent to GBs. They show that aside from the poor defect sink for the special Σ3 coherent twin GB, little variation is seen between various high- and low-angle GBs. More recently, in a study by Han et al., Reference Han, Demkowicz, Fu, Wang and Misra17 VDZ in He+ irradiations of Cu appears to indicate that a 15° GB has similar VDZ as GBs with misorientations in the high angle misorientation regime. These studies would agree with the observed similarities in the VDZ seen in the experimental high- and low-angle GBs in this work. One possible reason for the absence of the expected reduction in sink strength for small GB angles is GB strain effects, which are not included in the Duh model approach and have recently been suggested by Jiang et al., Reference Jiang, Swaminathan, Deng, Morgan and Szlufarska49 using numerical and analytical models, to reduce the influence of GB angle on sink strength. Jiang et al. highlight that the sink strength of symmetric tilt low-angle GBs in pure Cu can be higher than high-angle GBs. The inclusion of these strain contributions into RIS models is an area for further investigation. Furthermore, Tschopp et al. Reference Tschopp, Solanki, Gao, Sun, Khaleel and Horstemeyer20 have also indicated that lower energy GBs such as low-angle GBs do not correlate necessarily with a higher defect, vacancy or interstitial, formation energy in a molecular statics simulation of the interaction of vacancies and interstitials in pure Fe. It is apparent that GB energy or misorientation angle is insufficient to completely determine sink strength. GB-defect interactions such as vacancy formation energy and local strain accommodations are needed to more accurately understand and model sink strength. Overall, the VDZ and RIS experimental results highlight an insensitivity to GB misorientation character among the random low- and high-angle GBs.
V. CONCLUSIONS
-
(1) RIS and VDZ experiments emphasize major variations in the radiation response of the Σ3 GB coherent and incoherent twin GBs. The coherent twin has a very low sink strength while the incoherent twin behaves in a similar fashion to random GBs.
-
(2) Variations in irradiation response in the Σ3 GB are clearly linked to the variations in the atomic structure differences between the low GB energy coherent twin and high GB energy incoherent twin.
-
(3) Kinetic rate theory model with boundary conditions accounting for the differences in the Σ3 GB plane reasonably match experimental RIS for the Σ3 coherent and incoherent twins.
-
(4) The rate theory model underestimates the Cr depletion in general, and in particular predicts a stronger reduction at low GB angle than observed.
-
(5) RIS and VDZ measurements indicate little differences in defect sink strength at low- and high-angle GBs. This indicates the overall insensitivity to misorientation angle for GB character-dependent irradiation damage while indicating that additional defect–solute interaction phenomena are needed such as vacancy formation energy or localized GB strain effects.
ACKNOWLEDGMENTS
The authors C.M.B., J.N., L.B., I.S., D.M., and M.L.T. gratefully acknowledge funding from the National Science Foundation, Division of Materials Research, Metals and Metallic Nanostructures (MMN) program, Grant No. 1105681. C.M.B. and M.L.T. thank Carpenter Technology, Reading, PA for supplying the Ni–Cr alloy used in this project. M.L.T. and J.N. also gratefully acknowledge funding in part from the United States Department of Energy, Basic Energy Sciences under the Early Career program through contract DE-SC0008274. STEM-EDS measurements were supported through a user project supported by ORNL's Center for Nanophase Materials Sciences, which is sponsored by the Scientific User Facilities Division, Office of Basic Energy Sciences, U.S. Department of Energy. K.H. acknowledges support from the DOE Basic Energy Sciences. Sandia National Laboratories is a multiprogram laboratory managed and operated by Sandia Corporation, a wholly owned subsidiary of Lockheed Martin Corporation, for the U.S. Department of Energy's National Nuclear Security Administration under contract DE-AC04-94AL85000.