Introduction
Kawasaki disease is an acute systemic vasculitis that predominantly affects young children and is the leading cause of acquired heart disease in children in high-income nations. Reference Lin and Wu1,Reference Day-Lewis, Son and Lo2 Coronary artery aneurysms represent the most important complication of Kawasaki disease and may confer a long-term risk of coronary thrombosis, myocardial infarction, and sudden death. Reference Gordon, Daniels and Kahn3,Reference Zhang, Tuokan and Shi4 Coronary artery status during the subacute-to-convalescent phase is clinically relevant. According to the American Heart Association scientific statement, coronary artery dimensions generally stabilise or begin to regress at 4 to 8 weeks after disease onset. Reference McCrindle, Rowley and Newburger5,Reference Jone, Tremoulet and Choueiter6 In addition, patients without coronary artery abnormalities during this period rarely develop coronary artery lesions subsequently. Reference Lin, Sun, Wu, Wang, Lue and Wu7–Reference Scott, Ettedgui and Neches10 Therefore, coronary artery aneurysms at 4 to 8 weeks after Kawasaki disease onset is a clinically meaningful intermediate outcome and may provide important prognostic information for long-term coronary risk stratification.
Early and accurate identification of patients at high risk for coronary artery aneurysms is essential for intensified initial regimens and individualised follow-up strategies. Reference Jone, Tremoulet and Choueiter6,Reference Lin, He and He11 Although several risk-scoring systems and prediction models have been developed for Kawasaki disease, most have focused on acute-phase coronary artery lesions or intravenous immunoglobulin resistance, and few studies specifically predicted the risk of coronary artery aneurysms at 4 to 8 weeks after disease onset. Reference Gao, Peng, Liu and Zhao12–Reference Huang, Dong and Wang15 Serum ferritin, a circulating iron-storage protein, reflects iron metabolism and systemic inflammation and may be elevated in inflammatory states and macrophage activation. Reference Arosio, Elia and Poli16,Reference Cullis, Fitzsimons, Griffiths, Tsochatzis and Thomas17 Recent studies have suggested that serum ferritin may serve as a marker for Kawasaki disease diagnosis and intravenous immunoglobulin resistance. Reference Kim, Song, Yoon, Eom, Kang and Cho18,Reference Yamamoto, Sato, Hoshina, Kojiro and Kusuhara19 However, the relationship between baseline serum ferritin and coronary artery aneurysms during the subacute-to-convalescent phase of Kawasaki disease remains unclear, and whether serum ferritin provides incremental predictive information beyond established clinical and echocardiographic factors has not been evaluated.
Thus, this study aimed to investigate the association between baseline serum ferritin and coronary artery aneurysms at 4 to 8 weeks after the onset of Kawasaki disease, assess its incremental predictive value, and develop an internally validated ferritin-based nomogram for risk stratification.
Methods
Study design and population
This retrospective cohort study evaluated patients with Kawasaki disease admitted to the Children’s Hospital of Chongqing Medical University between January 2018 and December 2022. The diagnosis of Kawasaki disease was in accordance with the American Heart Association scientific statement. Reference McCrindle, Rowley and Newburger5 The inclusion criteria were as follows: 1) age < 18 years; 2) available baseline serum ferritin data; and 3) available echocardiographic data at both baseline and at 4 to 8 weeks after disease onset. Patients were excluded if they had a previous history of Kawasaki disease, received intravenous immunoglobulin before admission, did not receive standard initial intravenous immunoglobulin therapy at our centre, or had concomitant autoimmune diseases. The study was approved by the Ethics Committee of the Children’s Hospital of Chongqing Medical University (No. 2023112). The study was conducted in accordance with the Declaration of Helsinki.
Coronary artery dimensions of the right coronary artery, left main coronary artery, and left anterior descending coronary artery were measured by echocardiography. Measurements were normalised to body surface area and expressed as Z scores. Reference Dallaire and Dahdah20 The baseline maximum Z score was defined as the larger of the right coronary artery and left anterior descending coronary artery Z scores recorded before or within 48 hours of initial intravenous immunoglobulin administration. Consistent with American Heart Association guidelines, coronary artery status was stratified into 5 categories according to the maximum Z score: <2.0, 2.0 to <2.5, 2.5 to <5.0, 5.0 to <10.0, and ≥10.0. The primary outcome was the presence of coronary artery aneurysms at 4 to 8 weeks after Kawasaki disease onset, defined as a Z score ≥ 2.5 in the right coronary artery and/or left anterior descending coronary artery. Longitudinal changes in coronary artery status from baseline to the 4 to 8 weeks follow-up were categorised as improved (decrease of≥1 Z score category), unchanged, or progressed (increase of ≥1 Z score category).
Intravenous immunoglobulin resistance was defined as persistent or recrudescent fever ≥36 hours after completion of the initial intravenous immunoglobulin infusion. Reference Portman, Dahdah and Slee21 Patients with intravenous immunoglobulin resistance received a second dose of intravenous immunoglobulin alone or in combination with corticosteroids.
Data collection
Demographic, clinical, laboratory, and echocardiographic data were extracted from electronic medical records. Demographic variables included age and sex. Clinical variables included intravenous immunoglobulin response, interval from disease onset to hospital visit, duration of fever before intravenous immunoglobulin treatment, classic clinical manifestations of Kawasaki disease, and the presence of incomplete Kawasaki disease. Laboratory parameters were obtained before initial intravenous immunoglobulin therapy and included complete blood count, inflammatory markers, liver and renal function parameters, electrolytes, albumin, and serum ferritin. Derived inflammatory and nutritional indices, including the neutrophil-to-lymphocyte ratio, platelet-to-lymphocyte ratio, systemic immune-inflammation index, and prognostic nutritional index, were calculated as described in Supplemental Text. Echocardiographic data at baseline and at 4 to 8 weeks after disease onset were collected to determine baseline coronary artery status and the primary outcome.
Statistical analysis
Statistical analyses were performed using R software (version 4.2.3). Variables with <10% missing data were handled using multiple imputation (Supplemental Table 1). Continuous variables with a normal distribution are presented as mean ± standard deviation and were compared using Student’s t-test. Skewed continuous variables are presented as median (interquartile range) and were compared using the Mann–Whitney U test. Categorical variables are presented as frequencies and percentages and were compared using the chi-square test or Fisher’s exact test, as appropriate. A 2-sided p value < 0.05 was considered statistically significant.
Patients were randomly divided into training and internal validation cohorts in a 6:4 ratio. Least absolute shrinkage and selection operator regression was applied to the training cohort to select predictors with nonzero coefficients. Restricted cubic splines were used to evaluate potential nonlinear associations between selected continuous predictors (serum ferritin, platelet count, and albumin) and the primary outcome. Continuous predictors showing nonlinear associations were transformed into categorical predictors. Variance inflation factors were used to assess multicollinearity among predictors. The selected predictors were subsequently entered into multivariable logistic regression to construct a nomogram.
Model performance was evaluated in terms of discrimination, calibration, and potential clinical utility. Discrimination was quantified by the area under the receiver operating characteristic curve. Calibration was assessed using calibration curves and the Brier score. Potential clinical utility was evaluated using decision curve analysis. The nomogram was further compared with the Kobayashi and Egami scoring systems. Reference Kobayashi, Inoue and Takeuchi22,Reference Egami, Muta and Ishii23 To assess model robustness, sensitivity analyses were performed in subgroups stratified by age and duration of fever before intravenous immunoglobulin treatment and by repeating the analysis using complete cases without multiple imputation.
Risk stratification was performed according to the optimal cut-off value of the model-derived risk score. Patients were classified into low-risk and high-risk groups, and the proportion of patients with coronary artery aneurysms at 4 to 8 weeks after Kawasaki disease onset was compared between groups.
To quantify the incremental predictive value of serum ferritin, the performance of a comprehensive model incorporating serum ferritin (Model 1) was compared with that of a baseline clinical model excluding serum ferritin (Model 2). Improvement in model performance was assessed using net reclassification improvement and integrated discrimination improvement.
Results
Patient characteristics
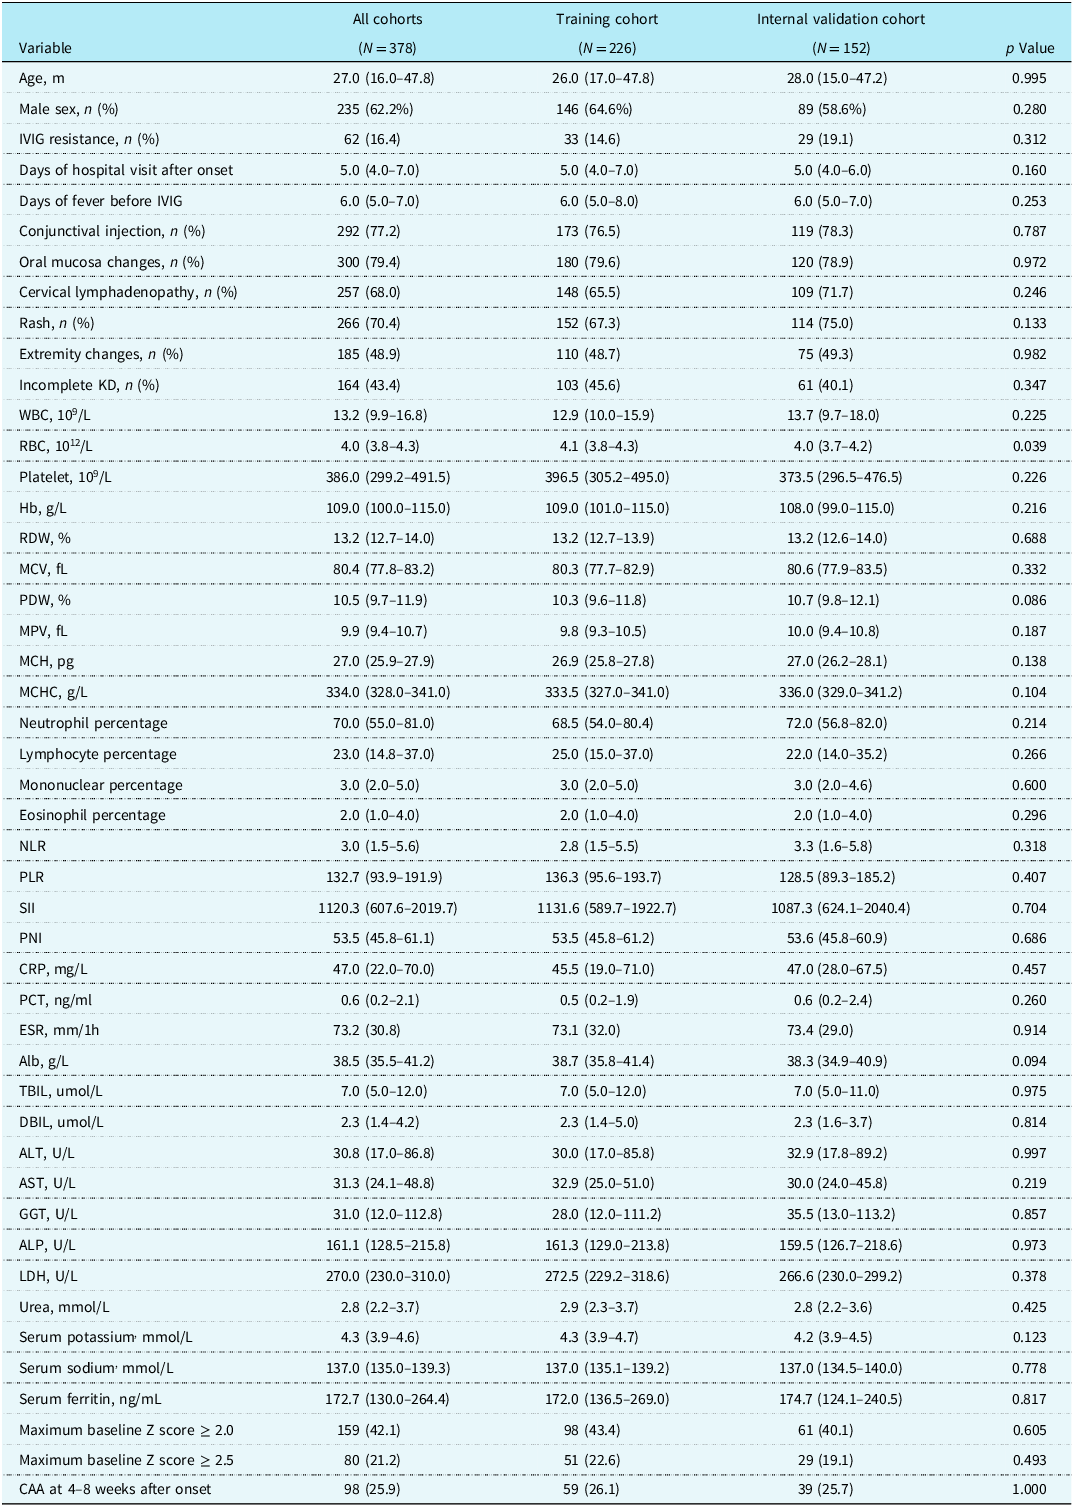
Of the 463 hospitalised patients with Kawasaki disease evaluated during the study period, 85 were excluded (prior history of Kawasaki disease [n = 40], pre-admission intravenous immunoglobulin therapy [n = 22], absence of standard intravenous immunoglobulin therapy post-admission [n = 20], and concomitant autoimmune disease [n = 3]). The final analytic cohort comprised 378 patients, who were randomly partitioned into a training cohort (n = 226) and an internal validation cohort (n = 152) (Supplemental Figure 1).
In the training cohort, 146 patients were male (64.6%), the median age was 26.0 months, 59 patients (26.1%) had coronary artery aneurysms at 4 to 8 weeks after disease onset, and 33 patients (14.6%) exhibited intravenous immunoglobulin resistance. In the internal validation cohort, 89 patients were male (58.6%), the median age was 28.0 months, 39 patients (25.7%) had coronary artery aneurysms at 4 to 8 weeks after disease onset, and 29 patients (19.1%) exhibited intravenous immunoglobulin resistance. Baseline characteristics were generally balanced between the training and internal validation cohorts, except for red blood cell count (Table 1). Trajectories of coronary artery status from hospitalisation to 4 to 8 weeks after disease onset are shown in Supplemental Figure 2.
Baseline characteristics of patients in the training and internal validation cohorts

Table 1. Long description
The table presents baseline characteristics of patients in training and internal validation cohorts. It has 37 rows and 6 columns. The columns are labeled as All cohorts, Training cohort, Internal validation cohort, and p Value. The rows are labeled with variables such as Age, Sex, IVIG resistance, Days of hospital visit after onset, Days of fever before IVIG, Conjunctival injection, Oral mucosa changes, Cervical lymphadenopathy, Rash, Extremity changes, Incomplete KD, WBC, RBC, Platelet, Hb, RDW, MCV, PDW, MPV, MCH, MCHC, Neutrophil percentage, Lymphocyte percentage, Mononuclear percentage, Eosinophil percentage, NLR, PLR, SII, PNI, CRP, PCT, ESR, Alb, TBIL, DBIL, ALT, AST, GGT, ALP, LDH, Urea, Serum potassium, Serum sodium, Serum ferritin, Maximum baseline Z score >= 2.0, Maximum baseline Z score >= 2.5, and CAA at 4-8 weeks after onset. Each row provides specific values for each cohort and the corresponding p value.
Data are presented as median (interquartile range), mean ± SD, or number (percent). IVIG = intravenous immunoglobulins; WBC = white blood cell count; RBC = red blood cell count; RDW = red blood cell distribution width; MCV = mean corpuscular volume; PDW = platelet distribution width; MPV = mean platelet volume; MCH = mean corpuscular haemoglobin; MCHC = mean corpuscular haemoglobin concentration; NLR = neutrophil-to-lymphocyte ratio; PLR = platelet-to-lymphocyte ratio; SII = systemic immune-inflammation index; PNI = prognostic nutritional index; CRP = C-reactive protein; PCT = procalcitonin; ESR = erythrocyte sedimentation rate; Alb = albumin; TBIL = total bilirubin; DBIL = direct bilirubin; ALT = alanine transaminase; AST = aspartate aminotransferase; GGT = gamma-glutamyl transpeptidase; ALP = alkaline phosphatase; LDH = lactic dehydrogenase; CAA = coronary artery aneurysms.
Predictor selection and nomogram construction
In the training cohort, 46 candidate variables were evaluated using least absolute shrinkage and selection operator regression. At the optimal penalty parameter (λ = 0.023), 10 variables with non-zero coefficients were retained (Supplemental Figure 3). Subsequent restricted cubic spline analysis confirmed linear positive associations of both serum ferritin and platelet count with the risk of coronary artery aneurysms at 4 to 8 weeks after disease onset. In contrast, albumin exhibited a non-linear relationship and was consequently transformed into a categorical variable (Supplemental Figure 4).
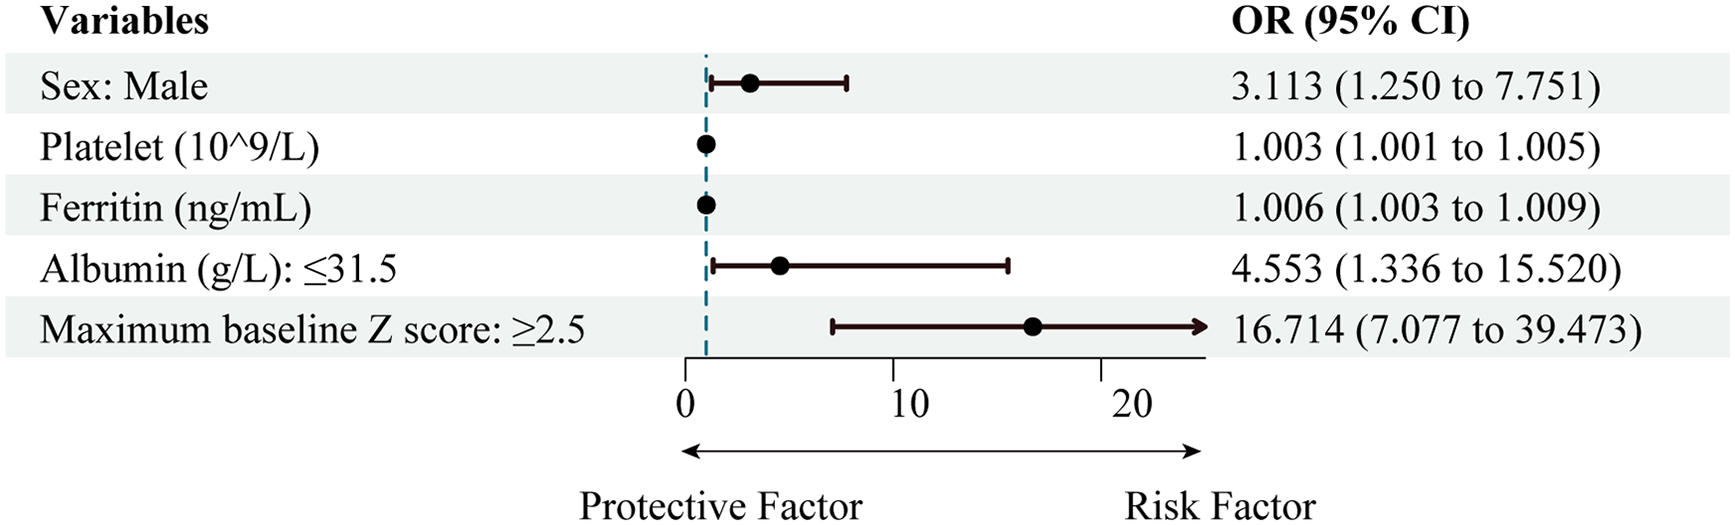
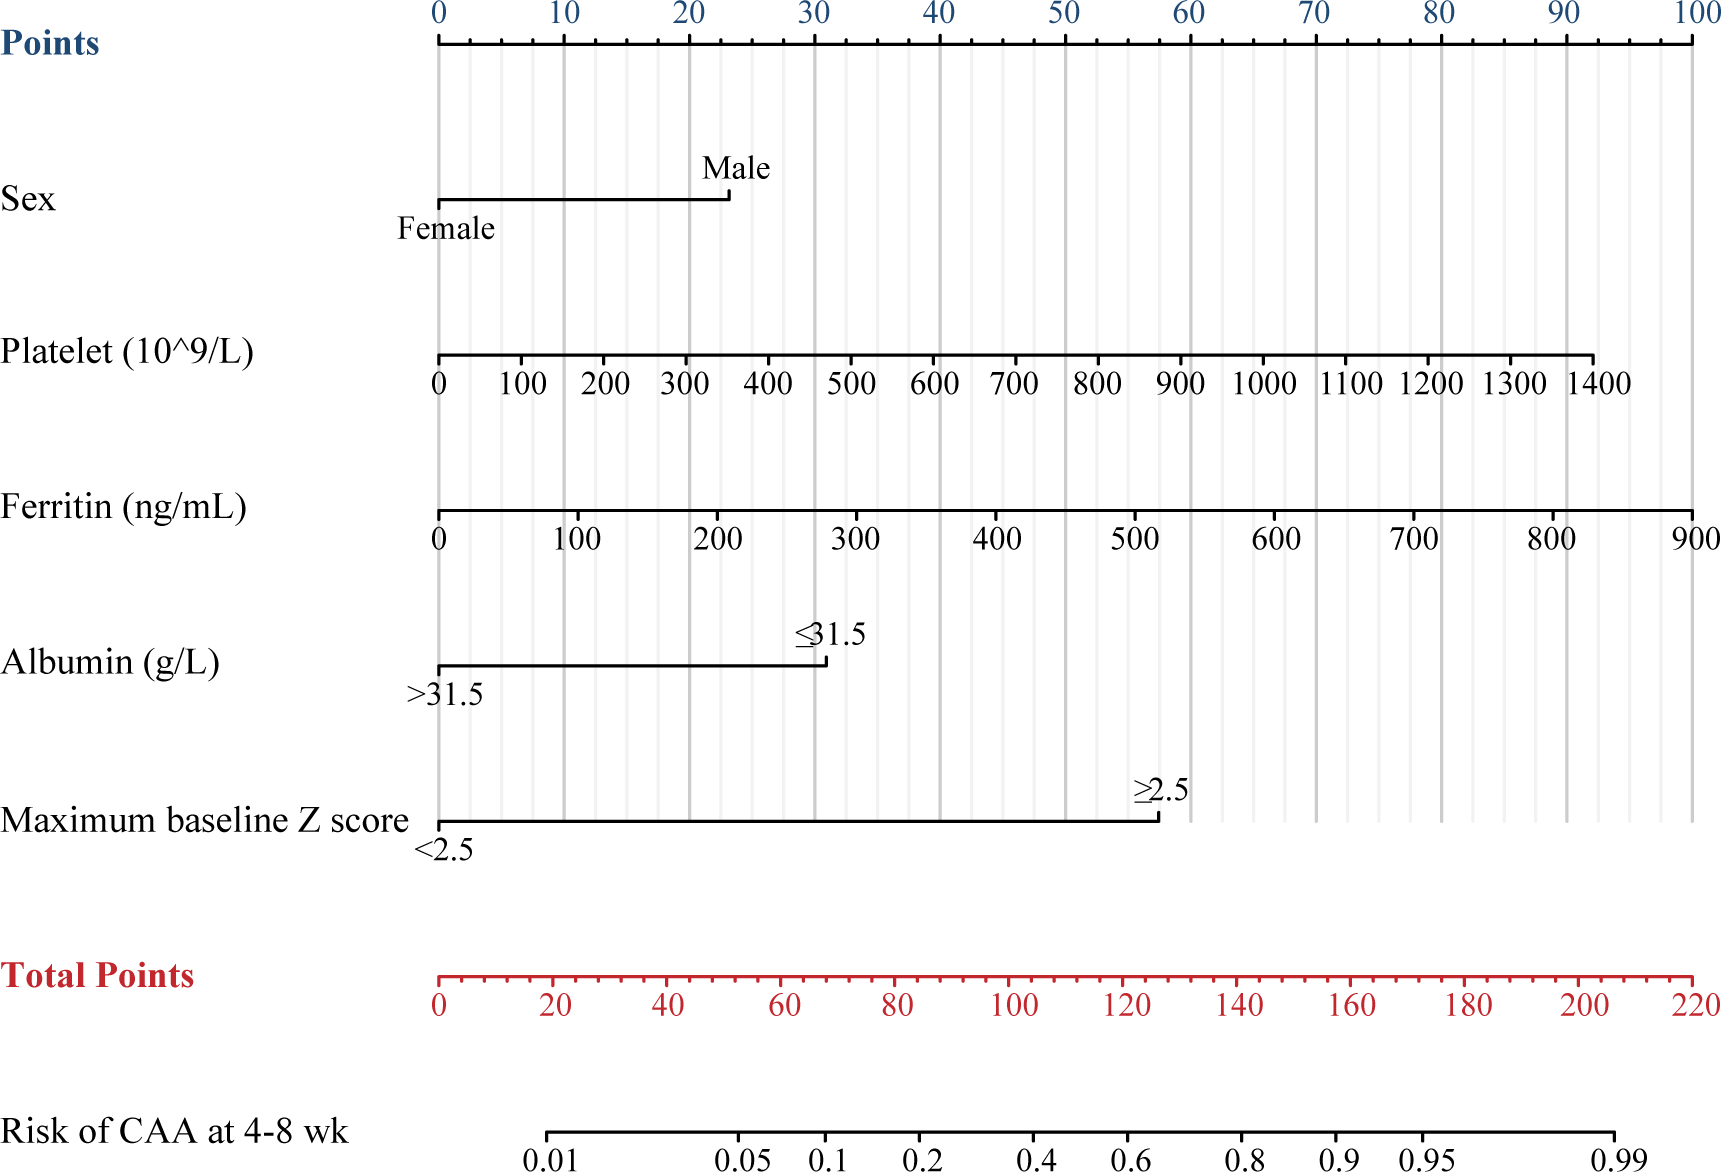
The 10 selected variables were subsequently entered into multivariable logistic regression. Five independent predictors for coronary artery aneurysms at 4 to 8 weeks were identified: male sex, platelet count, serum ferritin level, albumin ≤ 31.5 g/L, and baseline maximum coronary artery Z score ≥ 2.5. Collinearity diagnostics revealed no violation of the variance inflation factor criteria. The odds ratio and 95 % confidence interval of the predictors above are presented in Figure 1. A nomogram was constructed based on the 5 independent predictors (Figure 2). An interactive web-based calculator was deployed to calculate individual predicted probabilities (available at: https://sf-kdcaa.shinyapps.io/DynNomapp/).
Forest plot of predictors independently associated with coronary artery aneurysms at 4 to 8 weeks after Kawasaki disease onset.

Nomogram for predicting coronary artery aneurysms at 4 to 8 weeks after Kawasaki disease onset.

Model performance and incremental value of serum ferritin
Receiver operating characteristic curve analysis demonstrated that adding serum ferritin increased the area under the curve from 0.853 to 0.899 in the training cohort and from 0.842 to 0.868 in the internal validation cohort. Notably, the ferritin-based nomogram outperformed the Kobayashi and Egami scoring systems in both cohorts (Figure 3).
Receiver operating characteristic curves in the training cohort ( a ) and internal validation cohort ( b ). AUC, area under the receiver operating characteristic curve; Model 1, male sex, platelet count, serum ferritin, albumin ≤ 31.5 g/L, and baseline maximum coronary artery Z score ≥ 2.5; Model 2, male sex, platelet count, albumin ≤ 31.5 g/L, and baseline maximum coronary artery Z score ≥ 2.5.

Figure 3. Long description
Panel A: Receiver operating characteristic curves in the training cohort. The x-axis represents specificity, and the y-axis represents sensitivity. Four models are compared: Model 1 (red line), Model 2 (blue line), Kobayashi (green line), and Egami (orange line). Model 1 has an AUC of 0.899, Model 2 has an AUC of 0.853, Kobayashi has an AUC of 0.686, and Egami has an AUC of 0.586. Panel B: Receiver operating characteristic curves in the internal validation cohort. The x-axis represents specificity, and the y-axis represents sensitivity. Four models are compared: Model 1 (red line), Model 2 (blue line), Kobayashi (green line), and Egami (orange line). Model 1 has an AUC of 0.868, Model 2 has an AUC of 0.842, Kobayashi has an AUC of 0.671, and Egami has an AUC of 0.549.
Calibration curves and Brier scores demonstrated superior concordance between predicted and observed probabilities for Model 1(incorporated serum ferritin) than for Model 2 (excluded serum ferritin) (Figure 4). Decision curve analysis showed greater estimated net benefit for Model 1 than for Model 2 over a range of threshold probabilities in the training and internal validation cohorts (Figure 5).
Calibration curves in the training cohort ( a ) and internal validation cohort ( b ). Model 1, male sex, platelet count, serum ferritin, albumin ≤ 31.5 g/L, and baseline maximum coronary artery Z score ≥ 2.5; Model 2, male sex, platelet count, albumin ≤ 31.5 g/L, and baseline maximum coronary artery Z score ≥ 2.5.

Decision curve analysis in the training cohort ( a ) and internal validation cohort ( b ). DCA, decision curve analysis; Model 1, male sex, platelet count, serum ferritin, albumin ≤ 31.5 g/L, and baseline maximum coronary artery Z score ≥ 2.5; Model 2, male sex, platelet count, albumin ≤ 31.5 g/L, and baseline maximum coronary artery Z score ≥ 2.5.

Net reclassification improvement and integrated discrimination improvement analyses further supported the incremental predictive value of serum ferritin. Compared with Model 2, Model 1 yielded an net reclassification improvement of 0.502 and an integrated discrimination improvement of 0.067 in the training cohort, with corresponding values of 0.357 and 0.036 in the internal validation cohort. All p values were <0.05, indicating significant improvement in risk reclassification and discrimination driven by serum ferritin (Table 2).
NRI and IDI for model 1 versus model 2

Table 2. Long description
A table comparing net reclassification improvement (NRI) and integrated discrimination improvement (IDI) values for two models across a training cohort and an internal validation cohort. The table has two rows and four columns. Column headers are NRI (95%CI), p Value, IDI (95%CI), and p Value. Row labels are Training cohort and Internal validation cohort. Row 1: NRI (95%CI), 0.502 (0.214–0.790); p Value, <0.05; IDI (95%CI), 0.067 (0.0233–0.110); p Value, <0.05. Row 2: NRI (95%CI), 0.357 (0.002–0.711); p Value, <0.05; IDI (95%CI), 0.036 (0.001–0.072); p Value, <0.05.
NRI = net reclassification improvement; IDI = integrated discrimination improvement. Model 1, male sex, platelet count, serum ferritin, albumin ≤31.5 g/L, and baseline maximum coronary artery Z score ≥ 2.5; Model 2, male sex, platelet count, albumin ≤ 31.5 g/L, and baseline maximum coronary artery Z score ≥ 2.5.
In subgroup analyses stratified by age and duration of fever before intravenous immunoglobulin therapy, the nomogram showed consistent predictive performance for coronary artery aneurysms at 4 to 8 weeks after disease onset, and Model 1 consistently outperformed Model 2 (Supplemental Table 2). Complete-case analysis yielded results consistent with those obtained from the multiply imputed dataset, and Model 1 remained superior to Model 2 (Supplemental Table 3). These sensitivity analyses supported the robustness of the ferritin-based nomogram and the incremental value of serum ferritin in predicting coronary artery aneurysms at 4 to 8 weeks after Kawasaki disease onset.
Risk stratification
Based on receiver operating characteristic analysis in the training cohort, an optimal risk score cut-off of 95 points was identified for patient stratification. In both the training and internal validation cohorts, the proportion of patients with coronary artery aneurysms at 4 to 8 weeks was significantly higher in the high-risk group (total points ≥ 95) than in the low-risk group (total points < 95) (Supplemental Table 4).
Discussion
In this retrospective cohort study of patients with Kawasaki disease, baseline serum ferritin was independently associated with coronary artery aneurysms at 4 to 8 weeks after disease onset. By integrating serum ferritin with male sex, platelet count, albumin ≤ 31.5 g/L, and baseline maximum coronary artery Z score ≥ 2.5, we developed an ferritin-based nomogram that showed good discrimination in the training and internal validation cohorts. Adding serum ferritin improved model performance compared with a model without it, supporting its incremental predictive value for coronary artery aneurysms during the subacute-to-convalescent phase of Kawasaki disease.
Coronary artery aneurysms represent the most important cardiovascular sequela of Kawasaki disease and are associated with increased risks of coronary thrombosis, myocardial infarction, heart failure, transient ischaemic attack, and death. Reference Lee, Feldman, McCrindle, Li, Yeung and Widdifield24,Reference Robinson, Chanchlani and Gayowsky25 Kawasaki disease vasculopathy is characterised by three interrelated processes: acute necrotising arteritis, subacute/chronic vasculitis, and luminal myofibroblastic proliferation. By 4 to 8 weeks after disease onset, the acute neutrophilic necrotising process has generally subsided, with the disease shifting towards subacute or chronic vascular remodelling. Reference Orenstein, Shulman and Fox26 This window is clinically important because coronary dimensions often stabilise or begin to regress. Reference Tremoulet, Jain, Chandrasekar, Sun, Sato and Burns27 Consequently, both the American Heart Association and the Japanese Circulation Society guidelines leverage coronary artery status during this period to dictate long-term management strategies. Reference McCrindle, Rowley and Newburger5,Reference Jone, Tremoulet and Choueiter6,Reference Fukazawa, Kobayashi and Ayusawa28
The biological plausibility of the link between serum ferritin and vascular injury in Kawasaki disease is supported by its roles in iron metabolism, macrophage activation, and systemic inflammation. Ferritin is a highly symmetric iron-storage protein regulated by intracellular iron levels, but its expression and extracellular secretion may be upregulated by proinflammatory cytokines. Reference Hirayama, Kohgo and Kondo29–Reference Hentze, Muckenthaler and Andrews36 Serum ferritin is widely used as a clinical marker of body iron burden and systemic inflammation. In addition, the ferritin heavy chain has been implicated in proinflammatory signalling, suggesting that elevated serum ferritin may not merely reflect inflammation but also participate in inflammatory processes. Reference Seyhan, Pamuk, Pamuk and Çakır37–Reference Zhang, Meng and Yang41 In Kawasaki disease, elevated serum ferritin may reflect heightened macrophage activation and systemic inflammation, both of which are biologically linked to vascular injury and coronary artery aneurysms formation. Therefore, the association between serum ferritin and coronary artery aneurysms observed in this study is biologically plausible, although mechanistic studies are needed to clarify whether serum ferritin is a mediator, marker, or both in Kawasaki disease-related coronary artery injury.
The proportion of patients with coronary artery aneurysms at 4 to 8 weeks after Kawasaki disease onset in our cohort was 25.9%, higher than the 0.8% to 8.8% rates reported in several other populations. Reference Tang, Ding and Xu14,Reference Son, Gauvreau and Kim42,Reference Ae, Makino, Kosami, Kuwabara, Matsubara and Nakamura43 This discrepancy is likely multifactorial. Differences in coronary artery assessment methods and coronary artery aneurysms definitions, including the use of Z score-based criteria, may partly explain variations in reported rates. In addition, requiring available serum ferritin measurements and echocardiographic follow-up at 4 to 8 weeks may have introduced selection and surveillance bias because patients with less severe disease or normal early echocardiographic findings may have been less likely to undergo complete follow-up. Furthermore, as a national regional paediatric medical centre in Southwest China, our institution receives a substantial number of patients with complex or severe Kawasaki disease, potentially enriching the cohort for patients at higher coronary risk. Importantly, the high event rate and referral-enriched case mix may limit the transportability of the model to populations with a lower baseline risk of coronary artery aneurysms. Both discrimination and calibration may differ across populations, particularly when baseline coronary artery aneurysms risks and patient characteristics vary, and recalibration may be necessary to ensure accurate absolute risk estimates. Therefore, external validation in geographically and clinically distinct populations is required before the model can be used for individualised clinical risk estimation.
Single biomarkers often have limited predictive performance and may not achieve both high sensitivity and high specificity. By integrating multiple independent risk factors, our nomogram may help address this limitation. In addition to serum ferritin, male sex, platelet count, albumin ≤ 31.5 g/L, and baseline maximum Z score ≥ 2.5 were included in the nomogram.
Male sex has been widely reported as a risk factor for coronary artery aneurysms in Kawasaki disease, Reference Tang, Ding and Xu14,Reference Li, Zhang, Yin and Zhang44 potentially reflecting sex-related differences in immune response, vascular inflammation, or hormonal regulation. Thrombocytosis is a characteristic feature of Kawasaki disease and usually develops after the first week of illness. Elevated platelet counts during the acute phase are mediated by thrombopoietin and inflammatory cytokines, including interleukin-6, interleukin-8, and interleukin-11. Reference Arora, Guleria, Jindal, Rawat and Singh45 Platelets and platelet-derived mediators can amplify inflammation and contribute to vascular endothelial injury. Reference Noval Rivas, Kocatürk, Franklin and Arditi46 In our study, higher platelet count at admission predicted coronary artery aneurysms at 4 to 8 weeks, suggesting that heightened platelet activation or inflammation may reflect a greater risk of coronary artery injury, consistent with previous findings. Reference Li, Zhang, Yin and Zhang44,Reference Jeon, Kim, Ko, Byun and Lee47 Hypoalbuminaemia is closely related to the severity of systemic inflammation. Increased vascular permeability in Kawasaki disease may lead to albumin extravasation and subsequent hypoalbuminaemia. Reference Terai, Honda, Yasukawa, Higashi, Hamada and Kohno48 Previous studies have also confirmed an association between low albumin levels and coronary artery aneurysms. Reference Xie, Yan and Huang49 Baseline maximum Z score ≥ 2.5 was the strongest predictor in our model. When coronary artery outcomes were evaluated according to baseline maximum Z score categories, the highest improvement rate was observed in the 2.0 to <2.5 subgroup, whereas improvement was less frequent among patients with baseline maximum Z scores ≥ 2.5. In a North American cohort, baseline maximum Z score ≥ 2.0 was identified as a major predictor of coronary artery aneurysms at 4 to 8 weeks. Reference Son, Gauvreau and Kim42 In a Latin American population, baseline maximum Z score ≥ 2.5 was the most important predictor of coronary artery aneurysms sequelae. Reference Narayan, Lizcano and Lam-Hine50 These findings underscore the importance of early echocardiographic assessment in Kawasaki disease risk stratification.
The nomogram translates a multivariable prediction model into an intuitive visual and digital tool. Patients classified into the high-risk tier showed a substantially higher proportion of coronary artery aneurysms at 4 to 8 weeks than those in the low-risk group. This difference suggests that the nomogram may help identify patients at increased risk of coronary artery aneurysms.
Several limitations should be acknowledged. First, this was a retrospective study and may be subject to selection bias. Second, missing covariate data may have introduced bias, although the proportion of missing data for all variables was <10%, and multiple imputation was used to reduce this risk. Third, this was a single-centre study conducted in Southwest China with a high proportion of coronary artery aneurysms, and the model may reflect regional patient characteristics and referral patterns. Fourth, model validation was limited to a random split of the same cohort. Multicentre external validation is needed to assess generalisability and calibration in populations with different case mix and outcome frequencies.
Conclusions
Serum ferritin was associated with coronary artery aneurysms at 4 to 8 weeks after disease onset in patients with Kawasaki disease. A ferritin-based nomogram incorporating male sex, platelet count, serum ferritin, albumin ≤ 31.5 g/L, and baseline maximum coronary artery Z score ≥ 2.5 improved predictive performance compared with a model without serum ferritin. Multicentre external validation is warranted to assess the generalisability and clinical applicability of this model.
Supplementary material
The supplementary material for this article can be found at https://doi.org/10.1017/S1047951126124895
Data availability statement
The data supporting the findings of this study were generated and analysed during the current study and are not publicly available due to institutional and privacy restrictions. However, the data are available from the corresponding author upon reasonable request and with appropriate institutional permissions.
Acknowledgements
Not applicable.
Author contribution
Penghui Yang and Jing Zhang contributed equally to this article. Penghui Yang: Conceptualisation, formal analysis, writing—original draft. Penghui Yang and Jing Zhang: Data curation, methodology. Qijian Yi: Supervision. All authors reviewed and approved the final manuscript.
Financial support
None.
Competing interests
The authors declare no competing interests.
Ethical standard
The study was approved by the Ethics Committee of the Children’s Hospital of Chongqing Medical University (No. 2023112). The study was conducted in accordance with the Declaration of Helsinki.