





1. Introduction
Studies of flow over generic bodies such as a flat plate, cylinder or sphere have contributed to a better understanding of fluid mechanics and modelling of complex phenomena. A sphere is the simplest three-dimensional body, but the flow field is complicated even for such a simple body and the flow field varies depending on flow conditions.
The behaviour of flow past a sphere varies with Reynolds number  $(Re = {\rho _\infty }{u_\infty }d/{\mu _\infty })$ based on the free-stream density ρ∞, velocity u∞, viscosity coefficient and the diameter of a sphere d. This has been examined experimentally and numerically under incompressible conditions. Taneda (Reference Taneda1956) experimentally examined the wake of a sting-mounted sphere at 5 ≤ Re ≤ 300. He determined that the critical Re of the formation of an axisymmetric vortex ring behind a sphere is Re ≈ 24. Also, he observed a very long period oscillation of the axisymmetric vortex ring when Re reached Re = 130. Magarvey & Bishop (Reference Magarvey and Bishop1961) experimentally examined wake structures of a falling liquid droplet in liquid at 0 ≤ Re ≤ 2500. They observed that asymmetry appears in the recirculation region at around Re > 210. Nakamura (Reference Nakamura1976) also observed asymmetry in a steady recirculation region at Re > 190. Taneda (Reference Taneda1978) experimentally examined the wake behind a sphere at Re ranging from 104 to 106 using the surface–oil flow, smoke and tuft-grid methods. He observed wave motion in the wake at 104 ≤ Re ≤ 3.8 × 10⁵ and noted that it forms a pair of streamwise vortices at 3.8 × 10⁵ ≤ Re ≤ 106. Sakamoto & Haniu (Reference Sakamoto and Haniu1990) experimentally investigated vortex shedding from a sphere in uniform flow at 300 ≤ Re ≤ 4.0 × 10⁴. They examined the wake of a sphere by hot-wire and flow visualization experiments. They showed that the wake vortices change from laminar to turbulent when Re reached Re ≈ 800. In addition, they found that the higher- and lower-frequency modes of a Strouhal number (St = fd/u∞) coexist at 800 ≤ Re ≤ 1.5 × 10⁴. Here, f is the vortex shedding frequency. Johnson & Patel (Reference Johnson and Patel1999) experimentally and numerically examined at 20 ≤ Re ≤ 300. They numerically identified the critical Re for a steady axisymmetric flow (Re ≤ 210), steady non-axisymmetric (planar-symmetric) flow (210 < Re ≤ 270) and unsteady (periodic) flow (Re > 270) by direct numerical simulations (DNS) of the Navier–Stokes equations. Higher-Re conditions for flows over a sphere were studied by Tomboulides & Orszag (Reference Tomboulides and Orszag2000) and Rodriguez et al. (Reference Rodriguez, Borell, Lehmkuhl, Segarra and Oliva2011) for 25 ≤ Re ≤ 1000 and Re = 3700, respectively.
The flow properties are influenced by a Mach number  $(M=u_{\infty}/a_{\infty})$ in compressible flows, where
 $a_{\infty}$ is speed of sound in the free stream. Drag coefficients of a sphere under compressible low-Re conditions have been investigated by several researchers. Those data have been used for constructions of particle drag models (Carlson & Hoglund Reference Carlson and Hoglund1964; Crowe Reference Crowe1967; Henderson Reference Henderson1976; Loth Reference Loth2008; Parmar, Haselbacher & Balachandar Reference Parmar, Haselbacher and Balachandar2010). Such drag models can be used in the simulation of compressible multiphase flows, for example. However, Saito, Marumoto & Takayama (Reference Saito, Marumoto and Takayama2003) pointed out that the result of numerical simulations of compressible particle-laden flow using the particle drag model is changed by the drag model. In the aerospace application field, compressible multiphase flows appear in exhaust jets of rocket engines, combustion flow, etc. A particle-resolved simulation using the immersed boundary method (IBM) has been used for compressible or supersonic viscous particle-laden flow by Mizuno et al. (Reference Mizuno, Takahashi, Nonomura, Nagata and Fukuda2015), Schneiders et al. (Reference Schneiders, Günther, Meinke and Schröder2016) and Das et al. (Reference Das, Sen, Jacobs and Udaykumar2017). Since the flow properties around a sphere have not been sufficiently understood, the examination of the flow physics of the compressible low-Re flow over a single isolated sphere will help understanding of the compressible multiphase flow and extend the knowledge of fluid mechanics.
Kane (Reference Kane1951) was among the first to measure the drag force acting on the sphere and investigate Re effects in the high-speed flow. They measured sphere drag force using a low-density supersonic wind tunnel at 2.1 ≤ M ≤ 2.8 and 15 ≤ Re ≤ 800. May & Witt (Reference May and Witt1953) measured the drag coefficient of the sphere at 0.8 ≤ M ≤ 4.7 and 1.14 × 10³ ≤ Re ≤ 8.4 × 10⁶ using the pressurized ballistic range and spheres of 1/4 to 3/4 inch in diameter. Sphere drag coefficients were obtained from position–time data. They clarified that the variation of the drag coefficient is only 10 % in the range of 1.6 < M < 4.7 for 4.0 × 10³ < Re < 1.0 × 10⁶. Also, May (Reference May1957) obtained the drag coefficient of a sphere at 1.5 < M < 3.0 and 350 < Re < 3000 and derived a contour map of the drag coefficient on M and Re coordinates. Sreekanth (Reference Sreekanth1961) measured the drag coefficient of a sting-supported sphere at M = 2 and Knudsen numbers of 0.1 to 0.8 in a low-density wind tunnel. The influence of support interference on the measured drag force was also reported. Bailey & Hiatt (Reference Bailey and Hiatt1971, Reference Bailey and Hiatt1972), Bailey (Reference Bailey1974) and Bailey & Starr (Reference Bailey and Starr1976) carried out free-flight tests using a ballistic range and estimated the drag coefficient of the sphere for a wide range of Re and M (0.1 < M < 6 and 10−2 < Re < 107). Crowe et al. (Reference Crowe, Babcock, Willoughby and Carlson1969) calculated the drag coefficients of micron-size particles in subsonic free-flight tests by measuring the deceleration of the flight speed with a Faraday cage. In addition, Zarin & Nicholls (Reference Zarin and Nicholls1971) conducted wind tunnel tests with a sphere at 0.1 < M < 0.57 and 40 < Re < 5000. They used a one-component magnetic balance and suspension system and eliminated the support interference. These studies only focused on the drag coefficient, the number of studies on the flow field at compressible low-Re flows remains few.
The flow past a sphere under the compressible low-Re flow has numerically been studied by Nagata et al. (Reference Nagata, Nonomura, Takahashi, Mizuno and Fukuda2016), Riahi et al. (Reference Riahi, Meldi, Favier, Serre and Goncalves2018) and Sansica et al. (Reference Sansica, Robinet, Alizard and Goncalves2018). Nagata et al. (Reference Nagata, Nonomura, Takahashi, Mizuno and Fukuda2016, Reference Nagata, Nonomura, Takahashi, Mizuno and Fukuda2018a,Reference Nagata, Nonomura, Takahashi, Mizuno and Fukudab) used DNS with a body-fitted grid to investigate fundamental characteristics such as aerodynamic force coefficients, flow structures and flow regime, with a stationary adiabatic sphere at 0.3 ≤ M ≤ 2.0 and 50 ≤ Re ≤ 300. They showed that the wake behind a sphere under compressible flows is similar to that under incompressible flows (alternating hairpin vortex wake) for M ≤ 0.8, but the wake structure became a steady axisymmetric wake at M ≥ 0.95 and Re ≤ 300 (Nagata et al. Reference Nagata, Nonomura, Takahashi, Mizuno and Fukuda2016). Also, they investigated the fundamental characteristics of flow past a stationary heated/cooled sphere (Nagata et al. Reference Nagata, Nonomura, Takahashi, Mizuno and Fukuda2018a) and a rotating adiabatic sphere (Nagata et al. Reference Nagata, Nonomura, Takahashi, Mizuno and Fukuda2018b), respectively, at 0.3 ≤ M ≤ 2.0 and 100 ≤ Re ≤ 300. It should be noted that they imposed a fully no-slip condition on the surface of the sphere in all their simulations, even though a part of the flow condition was in a non-continuum regime (e.g. Knudsen number for M = 2.0 and Re = 50 is approximately 0.06). Riahi et al. (Reference Riahi, Meldi, Favier, Serre and Goncalves2018) computed the flow over a sphere at 0.3 ≤ M ≤ 2.0 and 50 ≤ Re ≤ 600 using the IBM. They found that the wake structure for M = 0.95 is unsteady (alternating hairpin wake) at Re = 600 and the wake for M = 2.0 is steady at Re ≤ 600. Sansica et al. (Reference Sansica, Robinet, Alizard and Goncalves2018) carried out a global stability analysis (GSA) at 0.1 ≤ M ≤ 1.2 and 200 ≤ Re ≤ 370. They examined the effects of Re and M on unsteadiness of the flow field and drew a stability map by tracking the bifurcation boundaries for different Re and M. These studies showed that the flow behind the sphere is stabilized when M increases, and unsteady flow patterns have not been observed at supersonic flows in the numerically investigated Re ranges. Nagata et al. (Reference Nagata, Noguchi, Nonomura, Ohtani and Asai2020b) investigated the higher-Re flow past a sphere at 0.9 ≤ M ≤ 1.6 and 3900 ≤ Re ≤ 380 000 by free-flight tests with schlieren visualization. They visualized the time-averaged and instantaneous flow structures at M = 1.4 for Re ≥ 3900 and Re ≥ 8100, respectively. As a result, an unsteady wake was observed at Re = 8100 and M = 1.4. Therefore, the critical Re for the transition from steady to unsteady flow at supersonic speeds should be observed at 600 < Re < 8100. The compressible flow over a circular cylinder at such Reynolds number range has been experimentally studied using a low-density wind tunnel by Nagata et al. (Reference Nagata, Noguchi, Kusama, Nonomura, Komuro, Ando and Asai2020a), but there is no report on the flow dynamics around a sphere in such Reynolds number range under the compressible conditions.
In the present study, the fundamental properties of flow past an isolated stationary adiabatic sphere at 250 ≤ Re ≤ 1000 and 0.3 ≤ M ≤ 3.0 were investigated. Flow regime maps for various Re and M values were drawn, and characteristic parameters of flow geometries, such as the length of the recirculation region, the position of the separation point and aerodynamic force coefficients were examined.
2. Methodology
2.1. Governing equations
The three-dimensional compressible Navier–Stokes equations were employed as governing equations. These equations in the Cartesian coordinate system are as follows:
 \begin{equation}\frac{{\partial \boldsymbol{Q}}}{{\partial t}} + \frac{{\partial \boldsymbol{E}}}{{\partial x}} + \frac{{\partial \boldsymbol{F}}}{{\partial y}} + \frac{{\partial \boldsymbol{G}}}{{\partial z}} = \frac{{\partial {\boldsymbol{E}_{\boldsymbol{v}}}}}{{\partial x}} + \frac{{\partial {\boldsymbol{F}_{\boldsymbol{v}}}}}{{\partial y}} + \frac{{\partial {\boldsymbol{G}_{\boldsymbol{v}}}}}{{\partial z}},\end{equation}
where Q contains conservative variables; E, F and G are the x, y and z components of an inviscid flux, respectively; and Ev, Fv and Gv are the x, y and z components of a viscous flux, respectively.
 \begin{gather}\left.
{\begin{array}{c@{}} \boldsymbol{Q} = {{(\begin{matrix}
\rho &{\rho u}&{\rho v}&{\rho w}& e
\end{matrix})}^\textrm{T}},\\
\boldsymbol{E} = {{(\begin{matrix} {\rho u}&{\rho {u^2} +
p}&{\rho uv}&{\rho uw}&{(e + p)u}
\end{matrix})}^\textrm{T}},\\
\boldsymbol{F} = {{(\begin{matrix} {\rho v}&{\rho
vu}&{\rho {v^2} + p}&{\rho vw}&{({e + p} )v}
\end{matrix})}^\textrm{T}},\\
\boldsymbol{G} = {{(\begin{matrix} {\rho w}&{\rho
wu}&{\rho wv}&{\rho {w^2} + p}&{({e + p} )w}
\end{matrix})}^\textrm{T}}, \end{array}}
\right\}\end{gather}
 \begin{gather}\left.
{\begin{array}{c@{}} {\boldsymbol{E}_{\boldsymbol{v}}} =
{{(\begin{matrix}
0&{{\tau_{xx}}}&{{\tau_{xy}}}&{{\tau_{xz}}}&{{\beta_x}}
\end{matrix})}^\textrm{T}},\\
{\boldsymbol{F}_{\boldsymbol{v}}} = {{(\begin{matrix}
0&{{\tau_{yx}}}&{{\tau_{yy}}}&{{\tau_{yz}}}&{{\beta_y}}
\end{matrix})}^\textrm{T}},\\
{\boldsymbol{G}_{\boldsymbol{v}}} = {{(\begin{matrix}
0&{{\tau_{zx}}}&{{\tau_{zy}}}&{{\tau_{zz}}}&{{\beta_z}}
\end{matrix})}^\textrm{T}}, \end{array}}
\right\}\end{gather}
 \begin{gather}\left.
{\begin{array}{c@{}} {\beta_x} = {\tau_{xx}}u +
{\tau_{xy}}v + {\tau_{xz}}w - {q_x},\\
{\beta_y} = {\tau_{yx}}u + {\tau_{yy}}v + {\tau_{yz}}w -
{q_y},\\ {{\beta_z} = {\tau_{zx}}u +
\tau_{zy}}v + {\tau_{zz}}w - {q_z}, \end{array}}
\right\}\end{gather}
where ρ is the density; u, v and w are the x, y and z components of velocity, respectively; τ is the component of a viscous stress tensor; and q is the heat flux. The total energy per unit volume e is written as follows in terms of an equation of state for ideal gases in the present study
 \begin{equation}e = \frac{p}{{\gamma - 1}} + \frac{1}{2}\rho ({u^2} + {v^2} + {w^2}).\end{equation}
Here, p and γ are the pressure and the specific heat ratio, respectively. In the present study, the specific heat ratio was set to be 1.4 by assuming air. Also, the Sutherland law (Sutherland Reference Sutherland1893) was employed for accounting the temperature dependence of the dynamic viscosity coefficient
 \begin{equation}\mu = {\mu _\infty }{\left( {\frac{T}{{{T_\infty }}}} \right)^{3/2}}\left( {\frac{{1 + C/{T_\infty }}}{{(T + C)/{T_\infty }}}} \right),\end{equation}
where C is constant for air in the Sutherland law (C = 110.4) and the Prandtl number was set to be 0.72. In addition, the three-dimensional Navier–Stokes equations in a general coordinate system are expressed as
 \begin{equation}\frac{{\partial \tilde{\boldsymbol{Q}}}}{{\partial t}} + \frac{{\partial \tilde{\boldsymbol{E}}}}{{\partial \xi }} + \frac{{\partial \tilde{\boldsymbol{F}}}}{{\partial \eta }} + \frac{{\partial \tilde{\boldsymbol{G}}}}{{\partial \zeta }} = \frac{{\partial {{\tilde{\boldsymbol{E}}}_{\boldsymbol{v}}}}}{{\partial \xi }} + \frac{{\partial {{\tilde{\boldsymbol{F}}}_{\boldsymbol{v}}}}}{{\partial \eta }} + \frac{{\partial {{\tilde{\boldsymbol{G}}}_{\boldsymbol{v}}}}}{{\partial \zeta }},\end{equation}
where
 \begin{gather}\left.
{\begin{array}{* {20}{c}} \tilde{\boldsymbol{Q}} =
\dfrac{Q}{J},\\ \tilde{\boldsymbol{E}}
= \dfrac{1}{J}\left( {\dfrac{{\partial \xi }}{{\partial
x}}E + \dfrac{{\partial \xi }}{{\partial y}}F +
\dfrac{{\partial \xi }}{{\partial z}}G}
\right),\\ \tilde{\boldsymbol{F}} =
\dfrac{1}{J}\left( {\dfrac{{\partial \eta }}{{\partial x}}E
+ \dfrac{{\partial \eta }}{{\partial y}}F +
\dfrac{{\partial \eta }}{{\partial z}}G}
\right),\\ \tilde{\boldsymbol{G}} =
\dfrac{1}{J}\left( {\dfrac{{\partial \zeta }}{{\partial
x}}E + \dfrac{{\partial \zeta }}{{\partial y}}F +
\dfrac{{\partial \zeta }}{{\partial z}}G} \right),
\end{array}}
\right\}\end{gather}
 \begin{gather}\left. {\begin{array}{* {20}{c}} {{\tilde{\boldsymbol{E}}}_{\boldsymbol{v}}} = \dfrac{1}{J}\left( {\dfrac{{\partial \xi }}{{\partial x}}{E_v} + \dfrac{{\partial \xi }}{{\partial y}}{F_v} + \dfrac{{\partial \xi }}{{\partial z}}{G_v}} \right),\\ {{\tilde{\boldsymbol{F}}}_{\boldsymbol{v}}} = \dfrac{1}{J}\left( {\dfrac{{\partial \eta }}{{\partial x}}{E_v} + \dfrac{{\partial \eta }}{{\partial y}}{F_v} + \dfrac{{\partial \eta }}{{\partial z}}{G_v}} \right),\\ {{\tilde{\boldsymbol{G}}}_{\boldsymbol{v}}} = \dfrac{1}{J}\left( {\dfrac{{\partial \zeta }}{{\partial x}}{E_v} + \dfrac{{\partial \zeta }}{{\partial y}}{F_v} + \dfrac{{\partial \zeta }}{{\partial z}}{G_v}} \right). \end{array}} \right\}\end{gather}
Here, J is the Jacobian, and ξ, η and ζ are the general coordinates.
2.2. Computational methods
The simulation was carried out by solving the Navier–Stokes equations on a boundary-fitted grid. The governing equations were non-dimensionalized by the density and speed of sound in the free stream and the sphere diameter. The convection and viscous terms were evaluated by the sixth-order adaptive central and upwind weighted essentially non-oscillatory scheme (WENOCU6-FP) proposed by Nonomura et al. (Reference Nonomura, Terakado, Abe and Fujii2015) and the sixth-order central difference method, respectively. The time integration was conducted by the third-order total variation-diminishing Runge–Kutta method proposed by Gottlieb & Shu (Reference Gottlieb and Shu1998). In the present study, the central difference of WENOCU6-FP was replaced by one of the splitting types proposed by Pirozzoli (Reference Pirozzoli2011) to stabilize the calculation. In particular, the WENO numerical flux Fweno for the convective term can be rewritten as the following expression:
 \begin{equation}{\boldsymbol{F}_{\boldsymbol{weno}}} = {\boldsymbol{F}_{{\boldsymbol{central}}\textit{-}{\boldsymbol{div}}}} + {\boldsymbol{F}_{{\boldsymbol{weno}}\textit{-}{\boldsymbol{dissipation}}}},\end{equation}
where Fcentral-div indicates the numerical flux corresponding to the sixth-order central difference, and Fweno-dissipation indicates the sixth-order dissipation term for the sixth-order WENOCU. Even though Fcentral is usually written in the form of a divergence, here it is replaced by the splitting form Fcentral-split of Pirozzoli (Reference Pirozzoli2011).
2.3. Computational grid
A computational grid around the sphere was generated as a body-fitted grid. The coordinate system and computational grid for Re = 300 are shown in figures 1 and 2, respectively. The diameter of the computational region was 100 times as large as that of the sphere. The region of 0.5d ≤ x ≤ 15d and (y 2 + z 2)0.5 ≤ 4d is the high-resolution region, where the high resolution of the computational grid was maintained and the wake structures were resolved. The grid size in the ζ direction was spread by 1.03 times from the minimum grid size, and the grid size became constant when the grid width reached Δζmax = 0.05d at Re = 300 in the region at ζ ≤ 15d. The minimum grid size in the ζ direction was calculated using the following equation adopted by Johnson & Patel (Reference Johnson and Patel1999):
 \begin{equation}\Delta {\zeta _{min}} = \frac{{1.13}}{{\sqrt {Re} \times 10.0}}.\end{equation}
It is noted that the maximum grid size in ζ ≤ 15D for higher-Re cases was determined as follows:
 \begin{equation}\Delta {\zeta _{max}} = \Delta {\zeta _{max\_ref}}\frac{{\sqrt {R{e_{ref}}} }}{{\sqrt {Re} }}\textrm{,}\end{equation}
Coordinate system.

Computational grid (Re = 300).

where the reference value was Reref = 300, and Δξmax and Δηmax were determined the same as in (2.12). The minimum grid size for the ξ and η direction was also determined the same as in (2.12). From 15d outward, the grid size increases by 1.2 times toward the outer boundary as a buffer region to prevent reflection of pressure waves. Note that the distance from the sphere to the outer boundary was much larger than that in previous incompressible simulations. The number of grid points for each Re and calculation conditions are shown in tables 1 and 2, respectively. The conditions investigated in the present study are the compressible low-Re flow because the goal of our project is the modelling of the compressible multiphase flow such as the exhaust jet of the rocket engines. For example, the exhaust jet of the solid rocket motor includes the alumina particles and aluminium droplets with a diameter of 1.1–200 μm (Shimada et al. Reference Shimada, Daimon and Sekino2006), and water droplets introduced by water injection are also included in the exhaust jet of the large-scale liquid rocket. The relative velocity between the particles and fluid becomes large when the particles pass the shock wave or shear layer, and the estimated flow condition around each particle is O(101)–O(103) with the compressible flow. Hence, the knowledge of the compressible low-Re flow is essential for modelling of the compressible multiphase flow. Here, several cases were omitted to reduce the computational cost, for supersonic conditions because most conditions expected to be steady axisymmetric flows. Also, the flow field at M = 0.3 seems to be almost the same as incompressible flows.
Number of grid points.

Flow conditions.

The boundary conditions on the sphere surface are no-slip and adiabatic conditions. At the boundaries in the ξ and η directions, a periodic boundary condition on the six overlapped grid points was imposed. The inflow and outflow boundary conditions were imposed at the outer boundary where the flow goes inside and outside at one point inside the boundary, respectively. All flow variables were fixed to their free-stream values at the inflow boundaries. All the variables were extrapolated from one point inside of the boundary at the supersonic outflow boundaries. The density and the velocities were similarly extrapolated and the pressure was fixed to its free-stream values in the subsonic outflow condition. All the variables on the singular point on the x-axis were set to be an average of the nearest surrounding nodes.
3. Time variation of flow field
3.1. Flow regime
According to studies of incompressible flow by Taneda (Reference Taneda1956), Magarvey & Bishop (Reference Magarvey and Bishop1961), Sakamoto & Haniu (Reference Sakamoto and Haniu1990) and Johnson & Patel (Reference Johnson and Patel1999), the flow structure at Re ≤ 1000 can be classified into six regimes. The flow is attached-laminar flow over the entire surface (fully attached flow) at Re < 24. Laminar separation occurs and a steady axisymmetric vortex ring forms behind the sphere at 24 < Re ≤ 210 (steady axisymmetric flow). The flow field is still steady, but axisymmetrical breakup occurs and the vortex ring assumes an asymmetric shape (steady planar–symmetric flow) at 211 ≤ Re ≤ 275. The flow over an isolated sphere becomes unsteady and hairpin vortex shedding begins at Re ≥ 275. The hairpin vortices are periodically released from the recirculation region of the sphere at 275 ≤ Re ≤ 420. The vortex shedding is highly organized (hairpin wake) in this Re range. The hairpin vortices are periodically released up to Re ≤ 800, but the heads of hairpin vortices roll in an azimuthal direction at 420 ≤ Re ≤ 800 (hairpin wake with azimuthal oscillation). The wake vortices become complicated and strongly random at Re ≥ 800. The wake consists of low-mode and high-mode structures and large-scale vortex structure forms and rolls in the azimuthal direction (helical wake).
Figure 3 shows the distribution of the flow regime in the Re–M plane under compressible conditions. The results of the previous studies by Nagata et al. (Reference Nagata, Nonomura, Takahashi, Mizuno and Fukuda2016), Riahi et al. (Reference Riahi, Meldi, Favier, Serre and Goncalves2018) and Sansica et al. (Reference Sansica, Robinet, Alizard and Goncalves2018) are shown for comparison with those of the present study. The result of Nagata et al. (Reference Nagata, Nonomura, Takahashi, Mizuno and Fukuda2016) is obtained by the three-dimensional DNS with a boundary-fitted coordinate (BFC) grid, the result of Riahi et al. (Reference Riahi, Meldi, Favier, Serre and Goncalves2018) is obtained the three-dimensional DNS with IBM, and the result of Sansica et al. (Reference Sansica, Robinet, Alizard and Goncalves2018) is obtained the three-dimensional GSA, respectively. In this plot, the seven different flow regimes described above are indicated as follows: fully attached flow (FA), steady axisymmetric flow (SA), steady planar-symmetric flow (SP), hairpin wake (HaW), hairpin wake 2 (HaW2), hairpin wake with azimuthal oscillation (HaWAO) and helical wake (HeW). However, in the article by Riahi et al. (Reference Riahi, Meldi, Favier, Serre and Goncalves2018), fully attached flow and hairpin wake with azimuthal oscillation did not appear. Those flow regimes seem to be included in steady axisymmetric flow and unsteady periodic flow (HaW in this article) in their articles, respectively. Fully attached flow also did not appear in the literature by Nagata et al. (Reference Nagata, Nonomura, Takahashi, Mizuno and Fukuda2016), but positions of the separation points were provided so that some of the conditions classified as steady axisymmetric flow in their article were re-classified here as fully attached flow. Figure 3 illustrates that the flow regime under the low subsonic flow at M = 0.3 is similar to that of incompressible flow. The regions of steady axisymmetric flow, steady planar–symmetric flow and the hairpin wake are slightly shifted toward the higher-Re side under high subsonic flow. This means that the steady regime expands to the higher-Re side. The relationship between flow regime and Re is drastically changed, and the flow field is significantly stabilized under transonic and supersonic conditions. Particularly, even non-axisymmetric flow does not appear for Re ≤ 1000 at M ≥ 1.5.
Distribution of flow regimes. Symbols:  Nagata et al. (Reference Nagata, Nonomura, Takahashi, Mizuno and Fukuda2016) (BFC);
 Riahi et al. (Reference Riahi, Meldi, Favier, Serre and Goncalves2018) (IBM);
 Sansica et al. Reference Sansica, Robinet, Alizard and Goncalves2018 (GSA);
 present study (BFC). Colours: black, fully attached flow (FA); blue, steady axisymmetric flow (SA); light blue, steady planar–symmetric flow (SP); green, hairpin wake (HaW); green with purple, hairpin wake 2 (HaW2); dark green, hairpin wake with azimuthal oscillation (HaWAO); magenta, helical wake (HeW). Note that FA and HaWAO did not appear in Riahi et al. (Reference Riahi, Meldi, Favier, Serre and Goncalves2018), but it seems that those flow regimes are classified as steady axisymmetric flow and unsteady periodic flow (HaW in this article) in their articles, respectively.

3.2. Wake structure
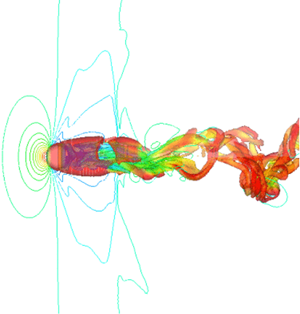
Figure 4 shows a wake structure visualized by the isosurface of the second invariant of the velocity gradient tensor, which is normalized by the free-stream velocity. Several kinds of wake structures appear at M ≤ 2.0 and Re ≤ 1000, and the wake structures become complex and simple as Re and M increase, respectively. The schematic diagram of the flow structure at supersonic conditions is also shown in the figure. As for the incompressible flow, a recirculation region is formed behind the sphere. The most different point between the subsonic and supersonic conditions is the existence of the shock wave. The bow shock is formed in the upstream of the sphere, and the shock standoff distance Ls is defined as the clearance between the bow shock and the upstream stagnation point. In addition, at moderate Re, the expansion wave and recompression wave are formed at around the position of the separation point and the end of the recirculation region, respectively.
Wake structure visualized by the second invariant of velocity gradient tensor  $(Q/u_\infty ^2 = 5.0 \times {10^{ - 4}})$. Contours and iso-surface colours represent the pressure coefficient and velocity magnitude distributions, respectively.

Streamwise steady vortices are generated behind the sphere at Re = 250 and M = 0.3. The flow becomes unsteady and hairpin vortices are generated in the recirculation region of the sphere at Re = 300 and 500. When Re further increases to 750 and 1000, the wake vortices form a helical structure with a high mode and a low mode. The size of the recirculation region at M = 0.8 becomes large compared with that at M = 0.3, and the pressure coefficient distribution is different. The Re evolution of the flow patterns for M = 0.8 is similar at M = 0.3 in figure 4, but the wake structure at M = 0.8 seems to be more complicated. Thus, the critical Re for each flow pattern might be different between M = 0.3 and 0.8. However, the details of the value of critical Re for each flow pattern cannot be discussed due to a lack of DNS data in the Re direction. The compressibility effect on the wake vortices becomes obvious for M ≥ 0.95. The pressure coefficient distribution is drastically changed and a recompression wave can be observed around the end of the recirculation region. In this case, there is only a steady recirculation region, and no unsteady wake vortices are formed downstream of the sphere up to Re = 300. At Re = 500, streamwise vortices can be observed, similar to those at Re = 250 and M = 0.3, and the wake becomes helical at Re ≥ 750, as at M = 0.3 and 0.8, but its structure is more complex than that under subsonic conditions. A bow shock is formed upstream of the sphere at M ≥ 1.05, and those waves include expansion and recompression waves that become stronger as M increases. At M = 1.05, the flow behind the sphere remains steady state up to Re = 500, and hairpin structures appear at Re ≥ 750. Stabilization effects of the wake by compressibility become strong as M increases, and the wake is steady at M ≥ 1.5 and Re ≤ 1000.
In the present study, the hysteresis phenomena on the flow field were also explored based on the time variation of the lift coefficients. The hysteresis phenomena were not observed during our simulations in periodic cases (HaW, HaW2 and HaWAO). Also, no hysteresis phenomena such as temporal stabilization of the flow field at the investigated flow conditions were observed.
As shown in the above, the flow pattern is significantly influenced by the compressibility. For example, the wake at Re = 750 of M ≤ 0.95, the wake has a helical structure, but it becomes hairpin wake at M > 0.95. This kind of trend can also be observed at other Re cases investigated in the present study, and the flow field becomes steady at higher-M conditions, eventually. Therefore, the flow pattern at the higher-M condition is similar to that of the incompressible low-Re flows. Since there is an increase in the viscosity coefficient due to aerodynamic heating and decrease of the fluid velocity due to the bow shock, the local Re around the sphere seems to be decreased. However, the dynamics of the released wake vortices should be different due to the influence of the shock wave and the difference in Re based on the free-stream quantities. Detailed structures of the wake vortices are displayed in figure 5. The wake structures at Re = 300 of M = 0.3 and 0.8 is the simple hairpin structure. The wake structure of at Re = 500 of M = 0.3 is a hairpin structure, but the head of the hairpin vortices is oscillating around the streamwise direction. The wake structure at the same Re is helical wake at M = 0.8. The twisting of the vortex tube can be confirmed so that the wake structure seems to be that of the higher-Re one. Since the λ shock wave changes the position of the separation point and the stability of the wake, it is considered that the flow structure behind the sphere becomes different from the incompressible one. Meliga, Sipp & Chomaz (Reference Meliga, Sipp and Chomaz2010) showed a similar trend by global stability analysis with an axisymmetric approximation. They pointed out that the instability of the wake becomes strong because of the modification of the base flow. The direction of the head of the hairpin vortices is slightly swaying at Re = 500 of M = 0.3 and is rotating around the streamwise axis with a twist in vortex tubes at M = 0.8 as shown in figure 5. Also, there is a twist in the vortex tube so that the higher-frequency structure is included compared to the wake at Re = 500 of M = 0.3. The direction of the head of the hairpin vortices is fixed at M = 0.95 and the flow pattern is quite similar to that of the wake structure at Re = 300 of M = 0.3 and 0.8 but there are higher-frequency structures. In addition, the vortex structure under transonic and supersonic conditions at Re = 750 and 1000 are also similar to that of the wake structure at Re = 300 of M = 0.3, but there is the higher-frequency structure similar to the wake at Re = 500 of M = 0.95. Hence, there is the effect of the free-stream Re and a compressibility effect in the wake structure, and the wake structures at lower-Re in subsonic flow and that at higher-Re in transonic and supersonic flow seem to be similar but essentially different.
Effect of M and Re on the structure of wake vortices in each flow regime.

Figure 6 shows the influence of M on St of vortex shedding. The Strouhal number of vortex shedding was computed by the velocity fluctuation at the maximum turbulent kinetic energy (TKE) point in the downstream. There is a discrepancy between the present and previous results (Nagata et al. Reference Nagata, Nonomura, Takahashi, Mizuno and Fukuda2016) at M = 0.95 of Re = 300. The Strouhal number of vortex shedding at Re = 300 by Nagata et al. (Reference Nagata, Nonomura, Takahashi, Mizuno and Fukuda2016) was computed from the time variation of the lift coefficient. In addition, the amplitude of the lift coefficient at Re = 300 and M = 0.95 observed in the previous study was almost zero. It is considered that such small fluctuations did not appear as velocity fluctuations in the wake. The simulation was conducted for a long duration (378–585 flow through times). Also, we checked the effect of the data length on the fast Fourier transformation results. The difference in the first peak of St calculated by full data (excluding the initial phase of the computations) and 66 % of full data was around 1 %. Overall, St of vortex shedding increases as Re increases, and the critical M, where St of vortex shedding becomes zero, move to the higher-M side as Re increases. The Strouhal number of vortex shedding at Re = 300 decreases as M increases under subsonic conditions and rapidly approaches zero around M = 0.95 because there is no vortex shedding at Re = 300 and M ≥ 0.95. The trend of St of vortex shedding at Re = 500 is similar to that at Re = 300, but St of vortex shedding does not decrease up to M = 0.95 and sharply approaches zero around M = 1.0. The Strouhal number of vortex shedding decreases at 0.3 ≤ M ≤ 0.8 and there are no M effects on St of vortex shedding at 0.8 ≤ M ≤ 1.05. It appears that the decrease in St of vortex shedding at 0.3 ≤ M ≤ 0.8 is due to the difference in the wake structure. As shown in figure 4, the wake structure at M = 0.8 and 0.95 of Re = 750 is more complicated and has a larger amplitude (resembling a higher-Re condition) compared to that of M = 0.3 or under incompressible flows. The difference in the wake structure is considered to be caused by the difference in the position of the separation point. Flow separation in the high-subsonic and transonic cases is promoted by the effect of the expansion wave formed near the separation point. This results in the unsteadiness of the recirculation region and complicated vortex structure but St of vortex shedding decreases. Also, the flow field is strongly stabilized under the supersonic regime the same as lower-Re cases, and then St of vortex shedding becomes zero for M ≥ 1.2. The overall trend is similar to Re = 1000 but the different trend of increasing and decreasing St at around M = 1 is observed in this range. This peculiar tendency is considered to be caused by the interference of recompression wave and wake, and the expansion wave and boundary layer. Under sufficiently high-Re conditions, for example for Re ≥ 105, the λ shock wave is formed, and flow separation occurs at around θ = 90°. The effect of the λ shock wave on the boundary layer seems to be limited at lower-Re conditions, as shown in figure 7(a), because the boundary layer on the sphere is quite thick and attenuates the λ shock wave. However, the complex interaction between the λ shock wave and the thick boundary layer might occur at the intermediate Re, which is at approximately 103 (figure 7b). Although this phenomenon cannot be clarified only by the results of the present study, it can be clarified by performing a global stability analysis or resolvent analysis in future studies.
Effect of M on primary peak St of velocity fluctuation at the maximum TKE point:  Re = 300 (St of CL) (Nagata et al. Reference Nagata, Nonomura, Takahashi, Mizuno and Fukuda2016),
 Re = 300,
 Re = 500,
 Re = 750,
 Re = 1000 (present study).

Distribution of the divergence of the velocity near the sphere surface at M = 1.05. (a) Re = 250; (b) Re = 1000.

Figure 8 is the lift phase diagram, and the effect of M is illustrated for each Re. The variations in the lift coefficient occur only in the z-direction under subsonic conditions of Re = 300 because the direction of the hairpin vortices is fixed. The diagrams for M ≥ 0.95 converge to a single point because of the steady axisymmetric flow. At Re = 500, the flow regime of the subsonic flow becomes HaWAO or HeW so that there are variations of the lift coefficient in both z- and y-directions. Also, the amplitude of the lift coefficients for M = 0.3 is larger than that for M = 0.8. The difference in the amplitude of the lift coefficient is due to the difference in the flow regime. The randomness of the release location and direction of the wake vortices are strong in the case of HeW, and thus the effect of the oscillation of the wake on the lift coefficient seems to be smaller than that in the case of HaWAO. The amplitude of the lift coefficients at higher-Re conditions is reduced for the same reasons.
Effects of Re and M on the lift phase diagram. (a) Re = 300; (b) Re = 500; (c) Re = 750; (d) Re = 1000.

The effect of M on the relationship between wake oscillation and the amplitude of the lift coefficient can be seen at Re = 750 as shown in figures 4 and 8(c). The amplitude of the lift coefficients is almost the same at M = 0.3 and 0.8, but the amplitude of the wake at M = 0.8 is larger than that at M = 0.3. Destabilization effects of the sphere wake at subsonic flow have been suggested by Meliga et al. (Reference Meliga, Sipp and Chomaz2010). They showed that the critical Re for a transition from steady to unsteady flow decreases as M increases up to M ≈ 0.6 by a global stability analysis of axisymmetric wakes. Therefore, the flow regime at M = 0.8 of Re = 750 is HeW even though the flow regime at M = 0.3 of Re = 750 is a transitional regime between HaWAO and HeW. The difference in the flow regime results in the difference in the amplitude of the wake and the distribution of the turbulent kinetic energy. The effect of M on the turbulent kinetic energy in the wake will be discussed in § 3.3. At M = 0.95 of Re = 750, the amplitude of the lift coefficients is further reduced but the amplitude of the wake is larger than or similar to that of lower-M conditions, and the vortex structure is more complicated. Since the direction of the flow past the sphere is forced close the recirculation region because of the expansion wave, the recirculation region is stabilized and the amplitude of the lift coefficients is reduced. Conversely, the larger amplitude of the wake oscillation appears due to the interaction between the wake and recompression wave formed around the end of the recirculation region. Consequently, the amplitude of the wake oscillation of the transonic flow is larger than that of the shock-free flow in spite of the smaller variation of the lift coefficients.
3.3. Turbulent kinetic energy in the wake
Figure 9 shows the distribution of TKE in the wake region. The TKE was computed and normalized by free-stream kinetic energy as follows:
 \begin{equation}TKE = \frac{1}{2}\frac{{\mathop {{{u^{\prime}}^2}}\limits^{\_\_\_\_} + \mathop {{{v^{\prime}}^2}}\limits^{\_\_\_\_} + \mathop {{{w^{\prime}}^2}}\limits^{\_\_\_\_} }}{{u_\infty ^2}},\end{equation}
Normalized TKE distribution in the wake region: (a) Re = 500; (b) Re = 1000.

where  $u^{\prime}$,
 $v^{\prime}$ and
 $w^{\prime}$ are the fluctuation components of fluid velocities which is defined as
 $u\mathrm{^{\prime}} = u - \bar{u}$. The overbar signifies the time-average value and the prime signifies the fluctuation value so that
 $\overline {u\mathrm{^{\prime}}} $ is equal to zero and
 $\overline {{{(u^{\prime})}^2}} $ is the mean square fluctuation. Also, the TKE was calculated in the high-resolution region (0.5d ≤ x ≤ 15d and
 $\sqrt {{y^2} + {z^2}} \le 4d$), and we determined the volume average by every Δx = 0.2d. Figure 9(a) illustrates that the TKE is continuously increasing approximately up to x = 2.5d. This is because of the end of the recirculation region of the unsteady case exists at around x = 2.0d. The TKE gradually decreases as the distance from the sphere increases. The TKE increases as M increases up to M ≤ 0.95, and it becomes less than 10−4 at M > 0.95 because the wake is steady. Figure 9(b) illustrates that the trend of the spatial distribution of the TKE at Re = 1000 is similar to that at Re = 500 and its value is higher than that at Re = 500. In addition, the TKE increases and decreases as M increase at M ≤ 0.95 and M ≥ 1.05, respectively. Therefore, it was confirmed that the TKE in the downstream of the sphere under higher-M conditions is larger than that under lower-M conditions with the same flow regime. In contrast, the TKE decreases as M increases at M ≥ 1.05 of Re = 1000 due to a change in the flow regime from helical wake to hairpin wake, and the TKE becomes less than 10−4 at M > 1.2 because of the steady wake. Hence, the compressibility effect not only leads to the stabilization of the flow field but also leads to the unsteadiness of the wake under an unsteady flow regime. The recirculation region is stabilized as M increases due to the expansion wave. On the other hand, the recompression wave formed in the downstream of the sphere facilitates a transition to turbulence. There is the recompression wave but the expansion wave is still weak at M = 0.95, and thus the TKE becomes maximum at around M = 1 of Re = 1000. The flow field becomes steady at M = 0.95 and M = 0.3 because of the low-Re conditions even though weak expansion waves.
4. Time-averaged flow properties
4.1. Flow geometries
Figure 10 shows the M effects on the position of the separation point. The position of the separation point moves upstream as M increases up to M = 0.8 because the flow separation is promoted because of the λ shock formed at around θ = 90°. In contrast, the position of the separation point moves downstream as M increases at M > 0.8 because of the influence of the expansion wave. The flow direction behind the expansion wave changes to the direction toward the recirculation region, which reduces the flow separation, and its effect becomes strong under higher-M conditions. Also, the relative position of the separation point does not change with Re; that is, there is no clear influence of Re on the M effect in the separation point.
Dependence of separation point position on M and Re: (a) M dependence:  Re = 300;
 Re = 500;
 Re = 750;
 Re = 1000.

Figure 11 shows the effects of M on the separation length. The separation length increases as M increases under subsonic conditions. The behaviour of the separation length is linked with the position of the separation point. The increment of the separation length rapidly increases at around the transonic regime, except at Re = 1000. On the other hand, the separation length decreases as M increases from the transonic to the supersonic regime, creating an inflection point in the separation length as M evolves. The inflection point moves to the higher-M side as Re increases because the separation length increases to its maximum value at around the critical M, which is the point at which the flow regime changes from steady to unsteady. Also, the maximum value of the separation length decreases as Re increases. A similar inflection point in the separation length exists at Re = 750 of M = 1.2, again because the inflection point appears when the flow changes from steady to unsteady. Therefore, the inflection point for M = 2.0 is considered to appear at Re ≥ 1000. It should be noted that the discrepancy in the length of the recirculation region at Re = 300 is due to the difference in the measurement method. In the study by Nagata et al. (Reference Nagata, Nonomura, Takahashi, Mizuno and Fukuda2016), the end of the recirculation region was explored on the x-axis. In the present study, on the other hand, the position of the end of the recirculation region is not limited to the x-axis. Since the shape of the recirculation region is skewed in the time-averaged field, and the end of the recirculation region is off-axis, the recirculation region provided by the present result is slightly longer than that of the result by Nagata et al. (Reference Nagata, Nonomura, Takahashi, Mizuno and Fukuda2016).
The Mach number dependence of recirculation region length.  Re = 300;
 Re = 500;
 Re = 750;
 Re = 1000.

4.2. Distribution of surface stress coefficients
Figures 12 and 13 show the distribution of pressure and friction coefficients, respectively, at Re = 300 and 1000 for various M. In the present study, the pressure and friction coefficients were acquired from the time-averaged field and were averaged around the x-axis. Figure 12(a) illustrates that the pressure coefficient increases as M increases. Discontinuity due to the shock wave, which was confirmed in the previous study with a rotating sphere under compressible low-Re flow (Nagata et al. Reference Nagata, Nonomura, Takahashi, Mizuno and Fukuda2018b), is not observed. The minimum value of CP exists at around θ = 90°, and its position moves downstream as M increases. Also, the minimum value of CP decreases and increases as M increases, respectively, under subsonic and supersonic conditions. The minimum value of CP at M = 2.0 is almost the same as CP at the downstream stagnation point. The trend of the M effect on CP distributions under subsonic conditions is similar to that of a cylinder at Re = 20 and 40 for M ≤ 0.5, as reported by Canuto & Taira (Reference Canuto and Taira2015). It should be noted that the change in the position of the separation point from M = 0 to 0.5 is less than 0.5°.
Pressure coefficient distribution on sphere surface: (a) Re = 300; (b) Re = 1000.

Friction coefficient distribution on sphere surface: (a) Re = 300; (b) Re = 1000.

The position where the CP value at M ≤ 0.8 is minimized moves downstream as M increases, even though the position of the separation point moves upstream. Figure 12(b) illustrates that the influence of M on the CP distribution at Re = 1000 is similar to that at Re = 300, but the influence of M on the CP minimum becomes clearer. Figure 13 shows the distribution of Cf at Re = 300 and 1000 for various M. The value of Cf at Re = 300 becomes the maximum at around θ = 70° as shown in figure 13(a), and the peak position moves downstream as M increases. In addition, the peak value of Cf increases and decreases as M increases under subsonic and supersonic conditions, respectively. The maximum value of Cf is smaller than that under the lower-M cases under higher-M conditions in the upstream region, particularly under supersonic conditions, due to the bow shock. The dynamic viscosity coefficient also increases due to aerodynamic heating under supersonic conditions, but the effect of the deceleration of the flow is more effective. In contrast, Cf under the higher-M condition is larger at the downstream side where Cf becomes the maximum because the position of the separation point moves downstream as M increases at M ≥ 0.8. Figure 13(b) illustrates that a similar trend to Re = 300 can be observed at Re = 1000.
4.3. Drag coefficient
Figure 14 illustrates the effect of M on the drag coefficients at Re = 100, 300, 750 and 1000. The total drag coefficient CD increases as M increases and its increment under transonic conditions is greater than that under subsonic and supersonic conditions due to increased wave drag. Under supersonic conditions, the increment of the drag coefficient becomes almost zero and is independent of M at around M > 1.5. A similar trend for inviscid hypersonic flows is well known as Oswatitsch's Mach number independence principle. The increment of the total drag coefficient by the effect of M is almost equivalent to the increase of the pressure component CDP, as shown in figure 14(b). The effect of M on the pressure drag coefficient can be predicted by the Prandtl–Glauert transformation shown by the dotted curve up to high-subsonic conditions, and the increment of the pressure component at M > 0.9 is mainly according to the increment of the wave drag. However, the influence of M on the viscous component CDv is smaller than that on the pressure component. The viscous component slightly decreases as M increases under subsonic conditions because the position of the separation point moves upstream as M increases. The position of the separation point moves downstream under transonic conditions and the mean velocity gradient on the surface of the sphere increases. In contrast, the viscous component is almost constant under supersonic conditions despite the separation becoming delayed as M increases because the flow is decelerated at the bow shock, and the velocity gradient on the surface of the sphere decreases. The fluid viscosity increases due to increasing temperature, but the decrease in the velocity gradient is more effective, as shown in figure 13.
Effect of M on CD: (a) total drag coefficient; (b) pressure drag coefficient; (c) viscous drag coefficient. Symbols:  Re = 100 (Nagata et al. Reference Nagata, Nonomura, Takahashi, Mizuno and Fukuda2016),
 Re = 300,
 Re = 750,
 Re = 1000 (present study).

Figure 15 shows the relationship between Re and CD at 0.3 ≤ M ≤ 2.0. The present results are compared to the drag curves predicted by the Loth model (Loth Reference Loth2008) and experimental drag data acquired by Sreekanth (Reference Sreekanth1961), Goin & Lawrence (Reference Goin and Lawrence1968), Zarin & Nicholls (Reference Zarin and Nicholls1971) and Bailey & Starr (Reference Bailey and Starr1976). There are experimental data in a wide range of Re and M, including the conditions investigated in the present study. Those drag data were acquired by wind tunnel experiments using a magnetic balance and suspension system, ballistic experiments and so on. Figure 15 illustrates that the drag coefficient increases as Re decreases for each value of M. The drag coefficients predicted by the drag model and DNS and measured by experiments show good agreement at M = 0.3. The present result agrees well with some experimental data at Re > 600 of M = 0.8, but the drag coefficient predicted by the Loth model is slightly lower than that by experiments and DNS. The difference between experimental and DNS data and the drag model becomes large as M increases under transonic conditions of 0.95 ≤ M ≤ 1.2, particularly in the low-Re conditions. The difference between experimental and DNS data also becomes large at lower-Re conditions because a no-slip boundary condition was used in the previous DNS study by Nagata et al. (Reference Nagata, Nonomura, Takahashi, Mizuno and Fukuda2016) despite the slightly rarefied regime. The drag model and experimental data show good agreement at M = 2.0, but the DNS overestimates the drag coefficient compared with the drag model and experimental data, particularly under the low-Re conditions. The overestimation by DNS is due to the influence of the no-slip boundary condition, and thus the difference between the DNS results and other data becomes small as Re increases. The Knudsen number at M = 2.0 of Re ≳ 250 is less than 0.001 so that the rarefaction effect is sufficiently small in that region, but there is a clear difference between the drag model and the experimental and DNS data.
Relationship between Re and drag coefficient: (a) M ≈ 0.3, (b) M ≈ 0.8, (c) M ≈ 0.95, (d) M ≈ 1.05, (e) M ≈ 1.2, (f) M ≈ 2.0. Symbols:  Loth (Reference Loth2008),
 Goin & Lawrence (Reference Goin and Lawrence1968),
 Zarin & Nicholls (Reference Zarin and Nicholls1971),
 Bailey & Starr (Reference Bailey and Starr1976),
 Bailey & Hiatt (Reference Bailey and Hiatt1971),
 Bailey & Hiatt (Reference Bailey and Hiatt1972),
 Sreekanth (Reference Sreekanth1961),
 Nagata et al. (Reference Nagata, Nonomura, Takahashi, Mizuno and Fukuda2016),
 present study.

The drag model proposed by Loth (Reference Loth2008) is based on theoretical formulas, experimental formulas and empirical corrections, but the model includes interpolation and approximation due to a lack of experimental data in the transitional regime of continuum and rarefied flows. In other words, the drag model is not based on sufficient experimental data, and thus the accuracy of the drag model gets worse in the transitional condition. According to the original paper of the drag model, the drag model proposed in the previous study is valid in the flow conditions investigated in our study. Such flow conditions appear in compressible particle-laden flow, and the drag models are used in the multiphase flow analysis. The results of the present study, particularly in figure 15, indicate that the drag model proposed by the previous study requires correction to improve the prediction accuracy.
Figure 16 shows the increment of the total drag coefficient with increasing M. In the present study, ΔCD was defined as follows:
 \begin{equation}\Delta {C_D} = {C_D}(Re,M) - {C_D}(Re,M = 0),\end{equation}
where CD(Re, M) indicates the drag coefficient predicted by the present DNS or previous experiments, and CD (Re, M = 0) indicates the drag coefficient under the incompressible flow, which was predicted by the drag model proposed by Clift & Gauvin (Reference Clift and Gauvin1971). Figure 16(a) illustrates that ΔCD increases as M increase at M ≥ 0.3, and its value appears to be only a function of M. The increment of ΔCD under transonic conditions is in particular larger than that under subsonic and supersonic conditions. The increment of ΔCD under subsonic conditions is caused by a compressibility effect, which can be explained by the Prandtl–Glauert transformation, and the pressure drag increases due to a decrease of the attached region, as illustrated in figure 14(b) and figure 10. The increment of the wave drag is almost constant at M > 1.5 and moderate Re; hence, the increment of ΔCD becomes small under higher-M conditions but also under low-Re conditions. At M = 0.3, ΔCD is negative because the drag coefficient at M = 0.3 is slightly smaller than that under incompressible flow conditions, due to the position of the separation point existing upstream compared to that under incompressible flows. The position of the separation point under lower-Re conditions exists downstream compared with that under higher-Re conditions, and thus the decrement of ΔCD is larger under lower-Re conditions. Figure 16(b) shows ΔCD as calculated using published experimental data. In this case, ΔCD is approximately characterized by M at M < 1.5, but Re dependence appears at M = 2.0. The value of ΔCD decreases as Re decreases for lower-Re conditions of M = 2.0, particularly at Re ≤ 200, because the Knudsen number based on the free-stream velocity and the sphere diameter is greater than 0.01 at Re ≤ 200 and M = 2.0. Hence, the slip effect on the wall caused by the rarefaction effect gradually strengthens as Re decreases.
Increment of drag coefficient by M effect: (a) present study:  Re = 300,
 Re = 500,
 Re = 750,
 Re = 1000; (b) published experimental results:
 Re = 50,
 Re = 100,
 Re = 200,
 Re = 500,
 Re = 1000,
 Re = 5000,
 Re = 10 000,
 Re = 100 000 (black symbols, Bailey & Hiatt Reference Bailey and Hiatt1972; grey symbols, Bailey & Starr Reference Bailey and Starr1976).

5. Characterization of drag coefficient and flow regime by position of separation point
Figure 17 shows the relationship between the positions of the separation point and drag coefficients. Figures 17(a)–17(c) illustrate that the total, pressure and viscous drag coefficients become small when the position of the separation point exists upstream at Re ≤ 1000. Also, the θs–CD curve for each M value has a similar shape. The position of the θs–CD curve for each M condition and gradient of those curves depend on M. However, a different trend can be seen in the pressure component, as shown in figure 17(b). The shape of the θs–CDP curve is different under subsonic, transonic and supersonic conditions in the case of the pressure component. The θs–CDP curve has nonlinearity under subsonic conditions. In contrast, nonlinearly in the θs–CDP curve under supersonic conditions is relatively weak, and the trend in the θs–CDP curves for transonic conditions is different from the trend under subsonic and supersonic conditions. In particular, the gradient of the θs–CDP curve at M = 0.95 is negative, thus the behaviours of the pressure field and flow field are different from those under subsonic and supersonic conditions due to the formation of shock waves. The pressure drag coefficient increases as M increases, but the position of the separation point is approximately the same up to M = 1.05. The increment of CDP with increasing M in this regime is caused by compressibility effects, which can be explained by the Prandtl–Glauert transformation and wave drag. At M ≥ 1.05, in contrast, the increment of CDP with increasing M is smaller and the position of the separation point moves downstream as M increases. The trend of the θs–CDv curves is similar as shown in figure 17(c), and M does not have a large impact on CDv, despite the position of the separation point moving downstream as M increases, particularly under supersonic conditions. This trend is caused mainly by the bow shock. The flow separation is reduced and the position of the separation point moves downstream as M increases under supersonic low-Re flow. Moreover, the flow decelerates at the bow shock, and thus the normalized velocity gradient on the surface of the sphere normalized by the free-stream velocity is lower than that in the subsonic cases. Since this reduces the lower wall shear stress, CDv does not increase when M increases.
Characterization of drag coefficient by position of the separation point: (a) total drag; (b) pressure component; (c) viscous component. Symbols:  M = 0.3,
 M = 0.8,
 M = 0.95,
 M = 1.05,
 M = 1.2,
 M = 2.0 (closed symbols, Nagata et al. Reference Nagata, Nonomura, Takahashi, Mizuno and Fukuda2016; open symbols, present study).

The position of the separation point moves from downstream to upstream as Re increases under incompressible flows of Re ≤ 1000, and the flow regime changes from fully attached flow to helical wake through steady axisymmetric, steady planar–symmetric and hairpin wake flows. In other words, the flow pattern appears to depend on the position of the separation point. Figure 18 characterizes the flow regime according to the position of the separation point. This figure illustrates that the flow regime can be characterized by the position of the separation point for every M investigated in the present study. The flow pattern changes to unstable wake as the position of the separation point moves upstream for all values of M; hence, the relationship between the flow regime and the position of the separation point under compressible flows is similar to that under incompressible flows. However, the effect of M on the flow regime remains, even when characterized using the position of the separation point. For example, the separation point at M = 0.3 and 0.8 shifts upstream, and the separation point for each flow pattern also shifts upstream with increasing M. This indicates that the change in the flow pattern with increasing M is not merely by a change in the position of the separation point. As M increases, a certain flow pattern appears when the position of the separation point exists relatively upstream up to M = 0.95. This means that the flow becomes stable despite the separation point existing upstream (resembling higher-Re conditions) compared with the position of the separation point under lower-M conditions. The situation under supersonic conditions is different from that under subsonic and transonic conditions. The separation angle is different because of the expansion wave even if the separation point exists at the same location. The Reynolds number of the flow in the supersonic case is higher than that in the subsonic cases for the same separation point with different M values, and thus supersonic flows appear to be less stable compared with subsonic flows for the same separation point.
Characterization of flow regime by position of the separation point. Symbols:  FA,
 SA,
 PS,
 HaW,
 HaWAO,
 HeW (closed symbols, Nagata et al. Reference Nagata, Nonomura, Takahashi, Mizuno and Fukuda2016 for 50 ≤ Re ≤ 250; open symbols, present study for 250 ≤ Re ≤ 1000).

6. Conclusions
In the present study, the compressible low-Re flow over a sphere was investigated by DNS of the three-dimensional compressible Navier–Stokes equations using a body-fitted grid with high-order schemes. The flow conditions were 250 ≤ Re ≤ 1000 and 0.3 ≤ M ≤ 2.0, and adiabatic and no-slip boundary conditions were imposed on the sphere surface. The present study investigated the time variation of the flow field such as the wake flow regime and TKE in the wake; the time-averaged flow properties such as the position of the separation point; the length of the recirculation region; the distributions of the surface stress coefficients; and the aerodynamic force coefficients.
The results showed that the wake is significantly stabilized as M increases. In the case of M = 1.2, for example, steady axisymmetric, steady-planar symmetric and hairpin wakes were observed at Re = 500, 750 and 1000, respectively. These flow regimes appear at 24 < Re ≤ 210, 211 ≤ Re ≤ 275 and 275 ≤ Re ≤ 420, respectively, in incompressible flows so that critical Re for each flow regime in the compressible flow is different from that in the incompressible cases, and the flow regime is shifted toward the lower-Re side as M increases. However, there is the effect of the free-stream Re and the compressibility effect in the wake structure. The wake structure at lower-Re in subsonic flow and that at higher-Re in transonic and supersonic flow seems to be similar but essentially different. The difference in the unsteady wake behaviour between low-speed and high-speed flows appears around the recompression wave. This characteristic is the same as that under higher-Re conditions of Re ≤ 104 in a similar M range.
The position of the separation point moves upstream and downstream as M increases under subsonic and greater-than-transonic conditions, respectively. Also, the separation point moves upstream as Re increases, and the magnitude of the change is almost the same for each M; hence, the interaction between M and Re does not change the position of the separation point. In contrast, the effects of M and Re interact to change the length of the recirculation region, which had a steep peak at around the transonic condition. The peak value of the length of the recirculation region decreases as Re increases, and the point at which the length of the recirculation region increases to its maximum value is shifted to higher-M values as Re increases. The recirculation length becomes the maximum value around the critical M, which is the boundary of steady and unsteady flows.
The drag coefficient increases as M increases mainly under transonic conditions due to the compressibility effect described by the Prandtl–Glauert transformation and wave drag. The Re effect also appears in the drag coefficient, but the increment of the drag coefficient due to compressibility effects in the continuum regime can be characterized by only M. In addition, few data are available for the drag coefficient under compressible low-Re conditions, particularly under transonic conditions. It seems that the accuracy of the previous drag model for transonic conditions was relatively low compared to that for subsonic and supersonic conditions.
Finally, the drag coefficient and the distribution of the flow regime were discussed based on the position of the separation point. The drag coefficient can be characterized by the position of the separation point for each M. This result suggests that the effect of Re on the drag coefficient can be characterized by the position of the separation point regardless of the compressibility effect. Although the influence of M is not characterized completely, characterization based on the position of the separation point works well compared to characterization using Re and M.
Acknowledgements
The present simulations were implemented on the supercomputer of the Japan Aerospace Exploration Agency. The present work was supported by the Japan Society for the Promotion of Science, KAKENHI grants 17K06167 and 18J11205.
Declaration of interests
The authors report no conflict of interest.
Appendix A. Computational grid
The distribution of the grid size in the ξ direction at the end of the high-resolution region is shown in figure 19.
Distribution of grid size in ξ direction at the end of the high-resolution region.

Appendix B. Grid size and time step size convergence study
Table 3 shows the drag coefficients computed using the baseline and fine grids at Re = 300, 500 and 750. The fine grid for each Re corresponds to the baseline grid for the next-higher Re value; for example, the fine grid for Re = 750 corresponds to the baseline grid for Re = 1000. Also, table 4 shows the list of the time step size Δt for each simulation. The time step size convergence study was conducted at Re = 750 of M = 0.3. The time step size of the fine case is half of the baseline case. The relative error in the time-averaged drag coefficient was 0.2 % (baseline, CD = 0.5085; fine, CD = 0.5099).
Drag coefficients computed by different grid resolutions.

Time step size Δt.


 Open access

