I. INTRODUCTION
Ultrafine-grained (UFG) metals have an average equiaxed grain size of between 100 nm and ∼1 μm, Reference Valiev, Estrin, Horita, Langdon, Zechetbauer and Zhu1–Reference Valiev and Langdon3 and are of interest due to their ability to achieve increased strength over their coarse-grained counterparts while maintaining significant ductility. Reference Valiev and Langdon3–Reference Estrin and Vinogradov6 These unique properties make UFG materials interesting from a fundamental perspective and attractive for numerous commercial applications. Reference Lowe7,Reference Valiev, Semenova, Latysh, Rack, Lowe, Petruzelka, Dluhos, Hrusak and Sochova8
One of the most common procedures for producing UFG metals is equal-channel angular pressing (ECAP). Reference Valiev and Langdon3,Reference Iwahashi, Wang, Horita, Nemoto and Langdon9–Reference Iwahashi, Furukawa, Horita, Nemoto and Langdon13 ECAP processing leads to a strong torsion texture in the resulting UFG material Reference Beyerlein and Tóth14–Reference Oh-ishi, Zhilyaev and McNelley16 with the final microstructure, which may be inhomogeneous, Reference Terhune, Swisher, Oh-ishi, Horita, Langdon and McNelley15–Reference Reihanian, Ebrahimi, Moshksar, Terada and Tsuji18 strongly influenced by the initial coarse-grained microstructure. Reference Li, Beyerlein, Alexander and Vogel19,Reference Zhu and Lowe20 The microstructure after four passes can consist of ultrafine grains separated by primarily high angle grain boundaries (HAGBs), Reference Kawasaki, Horita and Langdon21 separated by primarily low angle grain boundaries (LAGBs), or arranged in bands that have been designated in prior literature as “deformation bands”. Reference Oh-ishi, Zhilyaev and McNelley16,Reference Zhilyaev, Swisher, Oh-ishi, Langdon and McNelley17 The term “banded microstructure” is used here in place of “deformation bands” to avoid confusion when discussing digital image correlation (DIC) measured surface deformations.
The microstructure-scale strain localization behavior and deformation mechanisms active in ECAP processed aluminum are not fully understood, motivating the investigations carried out in this work. ECAP-processed pure aluminum and alloys have been examined in prior experimental and computational research, with the majority agreeing that grain boundaries play an important role in the plastic deformation of the material. Reference Chinh, Szommer, Horita and Langdon22–Reference Böhner, Maier, Durst, Höppel and Göken31 Evidence of grain boundary sliding Reference Chinh, Szommer, Horita and Langdon22–Reference May, Höppel and Göken29 was found in many of these works through the study of micro-indentations and offsets of fiducial lines, and the analysis of macroscopic stress–strain curves and activation energies from strain rate jump tests. Other works Reference May, Höppel and Göken29–Reference Böhner, Maier, Durst, Höppel and Göken31 have debated the contribution of grain boundary sliding and instead concluded that grain boundary diffusive processes, grain boundaries acting as sources and sinks for dislocations, or thermally activated climb controlled annihilation of lattice dislocations are responsible for enhanced UFG Al ductility.
In this work, full-field, in situ strains at the microstructural length scale of UFG high purity Al are measured through the application of an innovative experimental approach combining scanning electron microscopy (SEM) and DIC, Reference Peters and Ranson32–Reference Sutton, Orteu and Schreier34 referred to here as SEM-DIC. DIC measures full-field surface deformations by tracking markers that exist on, or have been artificially applied to, the surface under study. Optical microscopy DIC has previously been used to study strain localization in UFG Al–Mg alloy produced by cryomilling, Reference Ahn, Lavernia and Nutt35,Reference Ahn and Nutt36 and more recently, SEM-DIC was applied to a tension test on the same material. Reference Zhang, Topping, Lavernia and Nutt37 Those studies all concluded that strain localization occurred primarily in larger grains.
This work presents the first SEM-DIC experiments carried out on UFG, ECAP processed pure aluminum. In-SEM tension tests have been carried out on eight UFG Al samples. For brevity, the experimental results section presents results from two representative tests; however, analysis of data that was consistent across all tests is presented in the discussion section and conclusions. The goal of this work is to establish a relationship between the heterogeneous microstructure and strain localization and deformation mechanisms active in the material. This will improve our understanding of how strain is accommodated at the microstructural length scale and shed new light on the relationship between the active deformation mechanisms and microstructure characteristics.
II. EXPERIMENTAL MATERIAL AND PROCEDURES
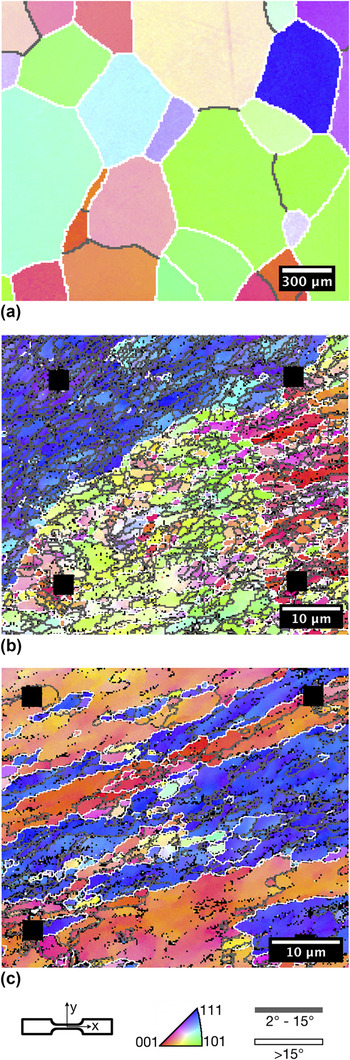
The material investigated in this work was 99.99% pure Al, purchased as 10 mm diameter × 65 mm long extruded rods from ESPI Metals (Ashland, OR). Prior to ECAP processing, the rods were annealed in air at 773 K for 1 h. Reference Kawasaki, Horita and Langdon21 Figure 1(a) shows an inverse pole figure map of the annealed coarse-grained material. The mean grain size of the annealed material was ∼500 μm (measured by electron backscatter diffraction (EBSD) grain diameter). ECAP processing was conducted at room temperature using a die with a 90° channel angle and an outer arc of curvature of 20°. The rods were lubricated with molybdenum disulfide (MoS2) lubricant prior to pressing and processed at a pressing rate of ∼7 mm/s through four ECAP passes following route BC. Reference Valiev and Langdon3,Reference Nakashima, Horita, Nemoto and Langdon38–Reference Oh-ishi, Horita, Furukawa, Nemoto and Langdon40 Following ECAP processing, flat dogbone-shaped tensile test specimens with a gage cross-section of 2 mm × 1 mm and length of 8 mm were fabricated by electrodischarge machining (EDM). Samples were cut with the tensile directions aligned with the ECAP pressing axis. The flat faces of the samples, on which DIC was performed, were parallel to the side faces of the billets at the point of exit from the die on the final pass.
Inverse pole figure maps of (a) the initial coarse-grained microstructure, (b) UFG-1 and (c) UFG-2. (b) and (c) represent two types of heterogeneous microstructure that can result from ECAP processing of aluminum.

Prior to testing, the sample faces were ground and polished, alignment markers were applied, EBSD was performed, and a SEM-DIC tracking pattern of self-assembled gold nanoparticles was applied. Polishing was carried out utilizing diamond suspensions and finishing with a final abrasive of Buehler MasterMet 2 Non-Crystallizing Colloidal Silica Suspension on a neoprene-style cloth. Next, platinum markers (500 nm diameter × 500 nm tall) were applied to the faces of the test specimens in the centers of the gage sections with a focused ion beam (FIB) to align the EBSD and SEM-DIC fields of view (FOV). EBSD was performed on the polished sides of the samples to create accurate microstructural representations of the test FOVs. Following EBSD, the samples were plasma cleaned and patterned using a self-assembly of 70 nm diameter gold nanoparticles as described in previous work by the authors. Reference Kammers and Daly41
Tests were performed using an in situ tension-compression stage (Kammrath & Weiss Tension/Compression Module) equipped with a 1 kN load cell and mounted in a FEI Quanta 200 3D FIB/SEM chamber. The samples were loaded at strain rates from 1.25 × 10⁻⁵ s−1 to 3.125 × 10⁻³ s−1. In all tests, loading was interrupted for image capture after strain steps of 0.5%. Images were captured using the following parameters: 30 kV accelerating voltage, 0.35 nA beam current, 10 μs dwell time, 4 image integrations, and 2048 × 1768 pixel images. Drift from stress relaxation was minimized by waiting six minutes between the end of loading and image capture. In the test labeled “UFG-1”, a 60 μm × 51.8 μm FOV on the specimen was used. For test specimen “UFG-2”, a slightly smaller 51.2 μm × 44.2 μm FOV was used, due to a finer tracking pattern resulting from less nanoparticle agglomeration. Agglomeration of nanoparticles in UFG-1 was consistent across the surface and probably resulted from insufficient rinsing of the specimen prior to patterning. First-pass DIC was performed using a commercial software 42 with a subset size of 45 × 45 pixels and a step size of 1 pixel. DIC data were then exported and corrected for the complex drift and spatial image distortions that are inherent to SEM. Reference Kammers and Daly43–Reference Sutton, Li, Garcia, Cornille, Orteu, McNeill, Schreier and Li46 The Lagrangian finite strain tensors were calculated using 15 × 15 datum point subsets of the distortion corrected displacement fields. The strain and displacement errors stated in this text represent the root mean square error (RMSE) calculated from stationary and translated calibration image pairs. Reference Bornert, Brémand, Doumalin, Dupré, Fazzini, Grédiac, Hild, Mistou, Molimard, Orteu, Robert, Surrel, Vacher and Wattrisse47
III. EXPERIMENTAL RESULTS
The two test FOVs presented here contained distinctly different microstructures typical of ECAP processed Al. Microstructures similar to these were investigated in the six additional tests included in the analysis presented in the discussion section and conclusions. The UFG-1 FOV contained a UFG microstructure composed of a primarily LAGB region and a primarily HAGB region as shown in Fig. 1(b). The microstructure in UFG-2 was composed of distinct microstructure bands as shown in Fig. 1(c). EBSD analysis of 135,000 μm2 of the ECAP processed microstructure across seventeen tension samples revealed that the ECAP material consisted of 40% UFG microstructure, 36% supergrains, and 24% microstructure bands. Note that the bands in banded microstructure are supergrains but are not included in the percentage of supergrains.
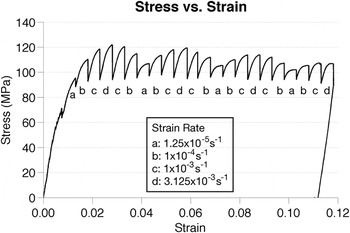
Strain rate sensitivity is visible as an increase (decrease) in stress with increasing (decreasing) strain rate as shown in Fig. 2 for UFG-1. From the load cell data and strain rate, the strain rate sensitivity,
 $m = {{\delta \ln \sigma } \mathord{\left/ {\vphantom {{\delta \ln \sigma } {\delta \ln \dot \varepsilon }}} \right. \kern-\nulldelimiterspace} {\delta \ln \dot \varepsilon }}$
, was calculated as 0.019, which is similar to values obtained by others for UFG pure and commercial purity Al.
Reference Sabirov, Barnett, Estrin and Hodgson26,Reference May, Höppel and Göken29,Reference Höppel, May, Eisenlohr and Göken30
Strain rate sensitivity was not observed in the local FOVs chosen for deformation mapping because the difference in incremental strain localization was below the noise-induced DIC strain error of up to 0.24%.
Macroscopic stress–strain curve calculated from grip displacement displaying strain rate sensitivity.

A. UFG-1 microstructure
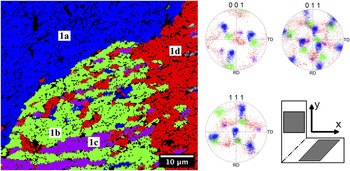
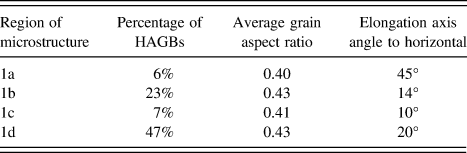
The FOV chosen in the test on UFG-1 demonstrates the microstructural heterogeneity that can result from ECAP processing of “parent grains” with different initial orientations. Regions of microstructure possessing different distinct orientations are highlighted and labeled 1a, 1b, 1c, and 1d in Fig. 3. The characteristics of the microstructure in each of these regions are summarized in Table I. The average grain size in the test FOV is 2.1 μm calculated from the EBSD grain diameter. 67% of the grain boundaries in the test FOV were LAGBs and HAGBs primarily had surface trace angles between 0° and 50°. This angle preference is centered about the predicted grain inclination angle of 26.6° for a cubic element passed through a single ECAP pass. Reference Iwahashi, Furukawa, Horita, Nemoto and Langdon13,Reference Zhu and Lowe20
Highlighted map of the UFG-1 FOV and corresponding pole figures. The FOV is broken up into four microstructure regions with distinct orientations. Black areas represent EBSD data points with a confidence index under 0.1.

UFG-1 microstructural characteristics for the regions labeled in Fig. 3. The largest percentage of HAGBs exists in region 1d and the grains in all of the regions have similar shapes.

B. UFG-2 microstructure
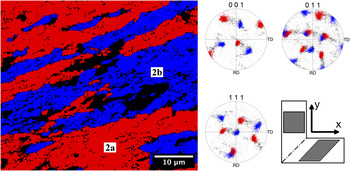
The FOV observed in the second test sample, UFG-2, was composed of microstructure bands as shown in Fig. 1(b). These bands were angled at nominally 20° to the horizontal with primarily two orientations, near (001)[110] (labeled 2a) and
 $\left( {111} \right)\;\left[ {\bar 211} \right]$
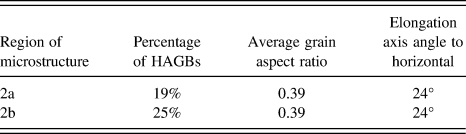
(labeled 2b) as shown in Fig. 4. The bands were separated by HAGBs with high misorientations of nominally 50° and greater. LAGBs separated the ultrafine grains within the individual microstructure bands. Microstructure characteristics for UFG-2 are shown in Table II and reveal that the grain boundaries and grain shapes within the individual bands are similar. The average grain size in the test FOV was 3.1 μm as calculated from the EBSD grain diameter. 54% of the grain boundaries had misorientations of <15°, while 26% had misorientations of >50°. These HAGBs with very high misorientations were primarily the boundaries separating the microstructure bands. Similar to UFG-1, the majority of the grain boundary trace angles was between 0° and 50°.
Highlighted map of the UFG-2 FOV and corresponding pole figures. The FOV is broken up into two microstructure bands exhibiting distinct orientations. Black areas represent EBSD datapoints with a confidence index under 0.1 and regions of microstructure that did not match either orientation.

UFG-2 microstructural characteristics for the regions labeled in Fig. 5. Region 2b has a slightly higher percentage of HAGBs but the grain shape and elongation axis are the same for each microstructure band.

C. Tensile test results
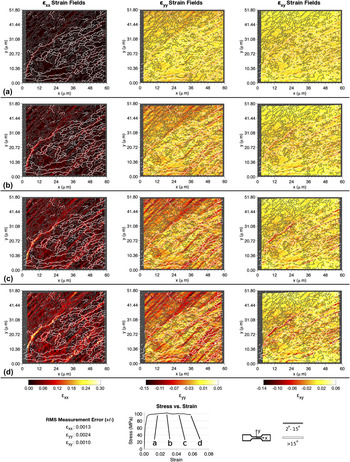
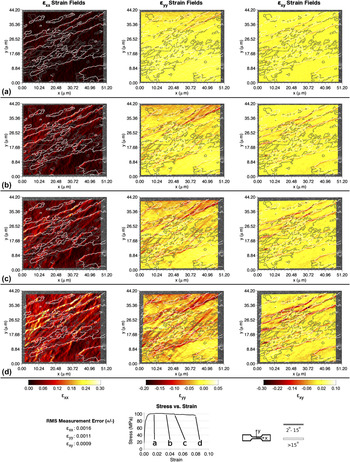
In all eight tests, the initial and strongest strain localization occurred at HAGBs. The heterogeneous strain localization during the tensile tests of UFG-1 and UFG-2 is shown at four load steps in Figs. 5 and 6. In these figures, the stress–strain curves were calculated from the load cell data and the mean axial strain within the DIC FOV. In UFG-1, shown in Fig. 5, strong axial strain (ε xx ) localization first occurred at the boundary between microstructure regions 1a and 1b. In UFG-2, shown in Fig. 6, localization in each strain component was first visible at the HAGBs separating microstructure bands. In both FOVs, strain localization from dislocation slip easily traversed regions of ultrafine-grains separated by LAGBs, including the interiors of microstructure bands.
Strain evolution during the tensile test on UFG-1 at mean axial strains of (a) 1.6%, (b) 2.8%, (c) 4.3%, and (d) 5.8%. Axial strain initially localizes at the boundary between microstructure regions 1a and 1b. Transverse strain localizes the strongest in region 1a while shear strain localizes between microstructure regions 1a and 1b and within regions 1b–1d.

Strain evolution during the tensile test on UFG-2 at mean axial strains of (a) 1.5%, (b) 3.4%, (c) 4.7%, and (d) 7.9%. For all strain components, localization is first apparent at the boundaries between microstructure bands. Axial and transverse strain then progresses into the grain interiors. Shear strain localization remains primarily at the microstructure band boundaries.

Shear strain localized differently in the two tests. In UFG-1, the greatest shear strain localization (of approximately 14%) occurred at the interface between grains with orientations 1a and 1b. Diffuse bands of shear localization were also observed within grains of orientations 1b–1d. In sample UFG-2, at a macroscopic strain of 8%, sharp shear strain localization on the order of 30% was observed along the grain boundaries separating the microstructure bands with nearly zero shear strain localization within the grains.
IV. DISCUSSION
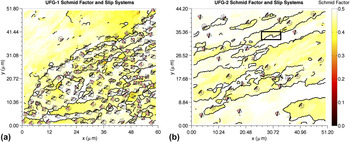
ECAP processed Al possesses a strong shear (torsion) texture, with the resulting microstructure's crystallographic orientation favorably oriented for dislocation slip under loading in the ECAP extrusion direction. This can be observed in Fig. 7, which shows the slip systems possessing the highest Schmid factor in UFG-1 and UFG-2. In all eight tests analyzed, 98.7% of the grains, by area, had a Schmid factor >0.4.
Schmid factor plots for (a) UFG-1 and (b) UFG-2. The crystal orientation and slip system with the highest Schmid factor is shown. The slip plane trace is represented by the black line in each crystal representation.

In all tests, dislocation slip was highly active in regions of microstructure with high Schmid factors that were composed of well-aligned grains, such as region 1a in UFG-1, and within the microstructure bands of UFG-2. This was particularly true when the highest Schmid factor slip system was well aligned with the angle of the theoretical shear plane (45°) of the final ECAP pass. This can be observed in UFG-2 in the microstructure band with near
 $\left( {111} \right)\;\left[ {\bar 211} \right]$
orientation (2b). High strain localization, particularly transverse strain, as a result of dislocation slip, was observed in this band as a result of its active slip system being better aligned with the theoretical shear plane in the final ECAP pass, with a disorientation of 23.24° ± 3.68° to this plane versus 39.79° ± 5.94° for the active slip system in the band with orientation 2a. Microstructure regions with near
 $\left( {111} \right)\;\left[ {\bar 211} \right]$
orientation in other tests and in region 1a in UFG-1 also exhibited high transverse strain localization, indicating that slip systems well aligned with the theoretical shear plane in the last ECAP pass are very active in tension.
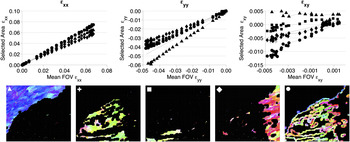
In these two tests, and in all tests analyzed, HAGBs separating distinct microstructure regions showed the greatest strain localization, indicating that grain boundary deformation processes are of critical importance at these interfaces. While dislocation slip was active in all test samples, the greatest strain localization occurred at HAGBs separating distinct microstructure regions. This is demonstrated for UFG-1 and UFG-2 in Figs. 8 and 9, which breaks up the FOV into each distinct orientation region and points within 500 nm of the HAGBs between regions. In these figures, the x-axis represents the mean value of the specified strain component over the entire FOV and the y-axis is the mean value of the selected strain component in the specified area. The black line in each plot is the mean strain value in the FOV.
Mean strain localization is affected only minimally by microstructure in UFG-1. ε yy is affected the most by the microstructure and is accommodated more in grains with orientation 1a than other orientations. The markers are larger than the root mean square measurement error.

Mean strain localization is strongly affected by microstructure in UFG-2. For every strain component, more strain is accommodated at the boundaries between deformation bands than within deformation bands. Similar to UFG-1, transverse strain is accommodated within the deformation band with near
 $\left( {111} \right)\;\left[ {\bar 211} \right]$
orientation (regions 2b), matching the boundary strain at the end of the test. The markers are larger than the root mean square measurement error.

In all tests, strain preferentially localized at HAGBs with surface trace angles near 26.6°. Although only 40% of the grain boundaries in all test FOVs were HAGB, HAGBs accounted for 66%, 58%, and 76% of the grain boundaries (by length) where strain localized in ε xx , ε yy , and ε xy , respectively (localization is defined as data points in the top 10% of each strain field). As visible in Figs. 5 and 6, strain localization was typically angled in similar directions. The mode trace angle for grain boundaries at which strain was localizing was 26.10°, 24.30°, and 24.31° for ε xx , ε yy , and ε xy , respectively.
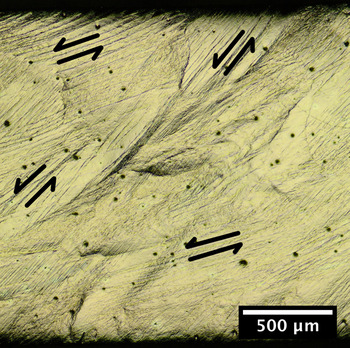
In all tests, the propensity for elongated grain boundaries and high-Schmid factor slip systems to be angled in similar directions led to shear strain localization to be principally of one sign. As demonstrated in the optical micrographs of post-test gage section in Fig. 10, surface deformation is aligned with the grain elongation axis and primarily angled between 15° and 52°. As tension was applied, shear primarily occurred along shear bands and slip bands in the directions shown by the arrows in the figure. This led to negative shear strain and likely contributed to the early necking in these samples at DIC measured axial strains of 0.026 ± 0.004.
Post-test surface deformation of test sample UFG-2 revealing surface deformation angled at between 15° and 52° to the tension direction (horizontal).

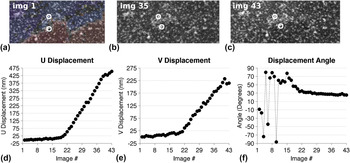
Very localized shear was found to occur parallel to the grain boundary plane as a result of grain boundary sliding. For example, in test sample UFG-2, grain boundary sliding was active at the HAGBs separating microstructure bands and led to shear offsets of up to 500 nm. These HAGBs had an average misorientation of 55.26° ± 2.62° and exhibited high shear strain localization as shown in Fig. 6. The largest instance of grain boundary sliding in test specimen UFG-2 occurred in the black box in Fig. 7 and will be discussed here. The speckle pattern in this area is shown in Figs. 11(a)–11(c): the reference (unloaded), intermediate, and final deformed images. Figures 11(d) and 11(e) show the relative horizontal and vertical displacements between the two large white circles in the speckle pattern images. Figure 11(f) shows the angle from horizontal for displacement of the lower white circle with respect to the upper white circle. At image 20, it is apparent that shear displacements initialized at the grain boundary. The displacement angle was random until plastic deformation occurred around image 20, at which point it stabilized near 30° which was also the angle of the grain boundary trace at this location.
Evidence of grain boundary sliding at the boundary between deformation bands contained within the white box in Fig. 7. (a), (b), and (c) show the speckle pattern in the reference, intermediate, and final deformed image. (d) and (e) show the relative horizontal and vertical displacement of the bottom circle with respect to the top circle in the speckle pattern images. (f) shows the angle from horizontal of the bottom circle's displacement. A sharp offset occurs in the speckle pattern images and shear displacement at the angle of the grain boundary occurs starting at image # 20. The markers are larger than the root mean square measurement error.

The results indicate that one condition conducive for grain boundary sliding is elongated, HAGBs like those found separating microstructure bands. Although separated by HAGBs, the highest Schmid factor slip systems in neighboring bands are moderately well-aligned, another condition conducive to grain boundary sliding. One measure of the ease of slip transmission between adjacent grains is the geometric compatibility factor m′ = cosψcosκ, Reference Luster and Morris48,Reference Bieler, Eisenlohr, Roters, Kumar, Mason, Crimp and Raabe49 where ψ is the angle between adjacent slip plane normals and κ is the angle between adjacent slip directions. A m′ value of 1 means that the slip systems in adjacent grains are perfectly aligned, while an m′ value of 0 means that either the slip plane normals, slip directions, or both are angled at 90° to each other and damage nucleation is likely. The active slip systems in the microstructure bands adjacent to the grain boundary sliding events had an average compatibility factor m′ of 0.54 ± 0.09, indicating moderate alignment of the slip systems in these adjacent areas. Similar geometric compatibility values of 0.56 ± 0.08 were measured in other test samples possessing microstructure bands with grain boundary sliding.
Grain boundary sliding is an active deformation mechanism at boundaries between microstructure bands. Ledges, evidence of out of plane grain boundary sliding, were found at some of the boundaries between microstructure bands, most likely due to differences in the underlying microstructure. Evidence of dislocation slip near the microstructure band grain boundaries was also observed. While the tests performed here were subject to the free boundary condition as discussed in Ref. Reference Böhner, Maier, Durst, Höppel and Göken31, grain boundary sliding occurred in-plane as well as out-of-plane, unlike the indentation work where the grains were forced out of the surface by the penetration of the indenter. Reference Chinh, Szommer, Horita and Langdon22,Reference Chinh, Szommer, Csanádi and Langdon23
V. CONCLUSIONS
This work presents the local deformation response of eight in-SEM tension tests on ECAP-processed UFG 99.99% pure Al. Two specimens were detailed as examples of different microstructures; however, the following conclusions were consistent across all tests. Full-field strain localization within individual ultrafine grains, and its relation to the underlying microstructure, was quantified using SEM-DIC. Strain localization was strongly related to microstructure heterogeneity.
-
(1) Areas of microstructure composed of primarily LAGBs behaved similarly to coarse-grained material, with dislocation slip occurring on the slip system best aligned with the theoretical shear plane of the last ECAP pass, and typically possessing the highest Schmid factor.
-
(2) The greatest strain localization occurred at HAGBs, especially those separating distinct microstructure regions and those angled at near 26.6°.
-
(3) Shear strain localization was strongly influenced by the grain inclination angle, and was primarily of one sign depending on the mean angle of the grain boundaries in the test FOV.
-
(4) The propensity for grain boundaries and high-Schmid factor slip systems to be angled near the plane of maximum shear stress in tension likely contributed to the early, narrow necking seen in these test samples.
-
(5) In banded microstructures, shear strains as high as 30% occurred at the HAGBs separating bands. The geometric compatibility of the active slip systems adjacent to the HAGBs separating bands was approximately 0.55.
-
(6) Sharp shear offsets of up to 500 nm, indicative of grain boundary sliding, were also observed at the interface between microstructure bands. Grain boundary sliding was only observed at HAGBs separating microstructure bands.
ACKNOWLEDGMENTS
This work was supported by the National Science Foundation under Grant No. 092753 and by the Rackham Graduate School Non-Traditional Student Fellowship from the University of Michigan. The authors would like to acknowledge Sara Nitz for her sample preparation work and experimental assistance. Portions of this work were performed at the Electron Microbeam Analysis Laboratory (EMAL) at the University of Michigan and at the Lurie Nanofabrication Facility (LNF), a member of the National Nanotechnology Infrastructure Network, which is supported in part by the National Science Foundation. The work was also supported in part by the National Science Foundation under Grant No. DMR-1160966 (JW-N and TGL) and in part by the European Research Council under ERC Grant Agreement No. 267464-SPDMETALS (TGL).