I. INTRODUCTION
Recently, the fabrication of magnetic nanowire arrays has received much attention due to their potential utilization in high-density magnetic recording media,Reference Lin, Chen, Chen and Cheng1–Reference Ji, Chen, Tang, Gu, Li and Du3 optics,Reference Kung, Xing, Donavan, Yang and Penner4 nanosensors,Reference Lupan, Ursaki, Chai, Chow, Emelchenko, Tiginyanu, Gruzintsev and Redkin5,Reference Sen, Kanitkar, Sharma, Muthe, Rath, Deshpande, Kaur, Aiyer, Gupta and Yakhmi6 and so on. The fabrication of nanowire arrays with controlled structure, morphology, and with high wire densities has attracted much interest because of their unique and tunable magnetic and magnetization properties.
Many methods have been developed to fabricate these kinds of nanomaterials. Among the various methods for the nanowire array preparation, the electrodeposition in nanoporous templates seems to be a very convenient one for producing large arrays of nanowires.Reference Jessensky, Müller and Gösele7–Reference Jagminas, Maţeika, Juška, Reklaitis and Baltrūnas9 Compared with other templates, the pore size of homemade anodic aluminum oxide (AAO) can be readily controlled by controlling the anodization conditions. High speed and low cost preparation are the main advantages of electrodeposited nanowires in AAO.Reference Li, Huang, Yan, Qi, Miao, Wang and Wang10,Reference Almasi Kashi, Ramazani, Adelnia Najafabadi and Heydari11 Strong shape anisotropy, high coercivity, and squareness are the most important characteristics of the AAO-assisted fabrication of nanowire arrays which have been controlled by controlling the electrolyte composition, electrodeposition potential, annealing temperature, and pH.Reference Wang, Tang, Shi, Fei, Nie and Du12–Reference Pirota, Béron, Zanchet, Rocha, Navas, Torrejón, Vazquez and Knobel14
On the other hand, it has been found that coercivity, saturation magnetization, and remanent magnetization are strongly dependent on the size, morphology, crystalline structure, and the composition of nanowires.Reference Pirota, Béron, Zanchet, Rocha, Navas, Torrejón, Vazquez and Knobel14–Reference Zhang, Jones, Shen, Donnelly and Li17 Most current research studies focused on binary systems of pure ferromagnetic elements.Reference Xu and Zangari18–Reference Saedi and Ghorbani22 Recently, ferromagnetic–nonmagnetic alloy systems such as Co–Ag,Reference Wang, Zhang, Meng, Peng, Jin and Zhang23 Fe–Ag,Reference Wang, Zhang, Meng, Peng, Jin and Zhang23 Co–Pb,Reference Ji, Tang, Gu and Du24 Co–Pt,Reference Min, Wu, Cho, Lee, Ko, Liu, Chung and Kim25 Ni–Pd,Reference Mo, Cheng, Cai, Wang, Zhang, Xing, Chen and Wu26 Ni–Zn,Reference Liu, Li, Fan, Gu, Li and Sun27 Fe–Pb,Reference Wang, Tang, Nie, Fei, Shi and Du28 Fe–Pt,Reference Li and Ren29 Co–Zn,Reference Koohbor, Soltanian, Najafi and Servati30 Co–Cu,Reference Wang, Li, Wang and Song31 and so on, have attracted much attention to improve the magnetic and mechanical performance of the nanowires for practical applications. It is practically accepted that different crystal structure of ferromagnetic–nonmagnetic metal alloy nanowires can be found by changing the type and content of the nonmagnetic metal in the nanowire structure. Though there have been numerous publications about heterogeneous alloys such as Sn-based alloy nanostructures, which have been widely investigated owing to their magnetic properties, Sn-based alloy nanowires have been scarcely reported in the literature. So, we determined to synthesize and characterize the Co–Sn systems.
In the present study, the Co–Sn nanowire arrays with different compositions embedded in the AAO template have been successfully fabricated by alternating current (AC) electrodeposition. At the same time, the influences of Co–Sn component, thermal annealing, pH, frequency, and wave form on the magnetic properties of the as-obtained nanowire arrays have been investigated.
II. METHOD AND MATERIALS
All chemicals were purchased from Merck (Darmstadt Co.) and used without further purification. All aqueous solutions were prepared using double distilled water at room temperature. Ordered AAO templates used in this research were prepared via a conventional two-step anodization process in sulfuric acid solution.Reference Masuda and Fukuda32–Reference Masuda, Yada and Osaka34 Discs of 8-mm diameter and 0.3-mm thick containing 99.99% aluminum were ultrasonically degreased in acetone for 6 min, annealed at 450 °C for 20 min in Ar atmosphere, and then etched in 3-M NaOH for 3 min for the oxide layer to be removed. Samples were then washed and electropolished in a 1:4 (vol/vol) mixture of perchloric acid (HClO4) and C2H5OH by applying a constant voltage of 20 V for 7 min at 25 °C.
The two-step anodization process was carried out at constant voltage mode to improve the arrangement of the ordered nanopore arrays. In the first step of the anodization, aluminum discs were anodized in a 0.3-M sulfuric acid electrolyte at 4 °C and 25 V for 7 h resulting in a textured surface, and then the formed anodic Al2O3 layer was removed in a mixed solution of 0.2-M chromic acid and 0.5-M phosphoric acid at 70 °C for 10 h. Subsequently, the discs were reanodized for 30 min under the same conditions as those in the first step.
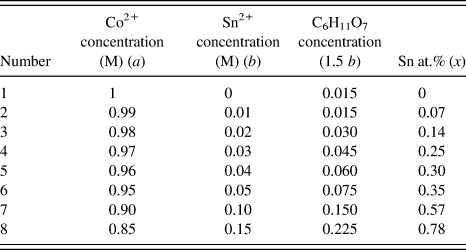
It is well known that aluminum anodization leads to a barrier layer that separates the nanoporous template from the underlying aluminum.Reference O’Sullivan and Wood35 To enable electrodeposition, this insulated barrier layer has to be either thinned down or completely removed, which requires complicated electrochemical or chemical treatment steps. The thickness of the barrier layer was reduced by a technique of reducing the anodization voltage in two steps from 25 to 8 V, linearly. In the first stage, the voltage was decreased by 0.03 V/S from 25 to 19 V. Then, it was decreased from 19 to 8 V at a rate of 0.01 V/S. Finally, the anodization voltage was being fixed at 8 V for 3 min to obtain a uniform barrier layer at the pore bottom. The co-electrodeposition of Co2+ and Sn2+ ions in the AAO was performed by using a standard double electrode bath and ac sine wave (V p–p = 30 V, f = 200 Hz) at room temperature. A homemade alumina template was used as the working electrode and a Pt foil as the other electrode. The electrolyte solution used for electrodeposition of Co–Sn had the following composition: a M CoSO4·7H2O, b M SnSO4 and 1.5b M sodium gluconate (NaC6H11O7) (a and b are as indicated in Table I). Here, sodium gluconate acts as a complexing agent in the electrolytes, which facilitates electrode potentials of ions coming together and leads to the successful co-deposition of Co2+ and Sn2+. The pH of the electrolyte was adjusted to 4 by adding appropriate amounts of dilute NaOH or H2SO4. The AC electrodepositions were conducted at different frequencies from 50 to 700 Hz. After electrodeposition, the Co–Sn nanowire arrays were annealed at different temperatures (200, 300, 400, 450, 500, 550, and 575 °C) in an Ar inert atmosphere for 20 min and then slowly cooled down to room temperature.
Molar concentrations of ions in the electrolyte and atomic percentages of Sn in Co1−xSnx nanowires.

The magnetic properties of nanowires were measured by an alternating gradient force magnetometer. A scanning electron microscope (SEM) has been used to examine the surface morphology of the AAO and nanowires, respectively. The phase structure characterization of nanowire arrays was done by x-ray diffraction (XRD), with Cu Kα radiation. The contents of the nanowires were determined using an energy dispersive spectrometer (EDS).
III. RESULTS AND DISCUSSIONS
Providing the conditions mentioned in Sec. II, these characters are available for the homemade AAO template. The average pore diameter is about 30 nm, the interpores about 50 nm, and the cell diameter about 44 nm. The rate of growth of the anodization layer was determined to be 0.08 µm/min, approximately.
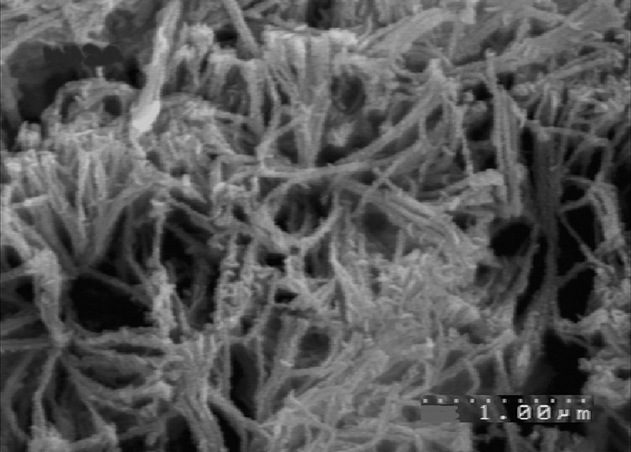
The SEM image of typical Co–Sn nanowires that release the template by dissolving AAO is shown in Fig. 1. It can be seen that nanowires are homogeneous.
SEM micrograph of the exposed Co0.65Sn0.35 nanowires after the alumina template membrane was dissolved away.
EDS analysis data verified the composition of Co–Sn nanowires synthesized at different molar concentrations of ions in the electrolyte. The atomic percentages of Sn in Co1−xSnx nanowires are listed in the last column of Table I. The amount of Sn in nanowires increased rapidly with increasing Sn2+ concentration in the electrolyte solution that revealed the abnormal co-electrodeposition; the Sn electrodeposition is faster than Co electrodeposition under the same conditions. Due to the production of Sn(OH)2 in the surface of the working electrode, reduction of Co2+ on pores of AAO occurred slowly.
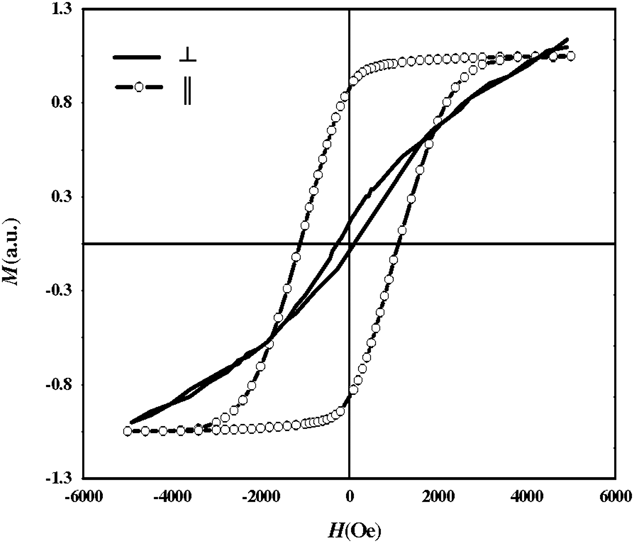
The room temperature hysteresis loops (M–H) for the typical Co–Sn nanowires embedded in the AAO template with external magnetic field applied parallel (||) and perpendicular (┴) to the nanowire axis are shown in Fig. 2. The obvious difference between loops indicates that the easy axis of nanowires is parallel to the nanowires, and shape anisotropy is the important factor in magnetic properties of Co–Sn nanowires. For all samples, the easy axis remained along the nanowires.
The normalized hysteresis loops of Co–Sn nanowire for two dimensions that was used as magnetic field parallel (||) and perpendicular (┴) to the nanowire axis.
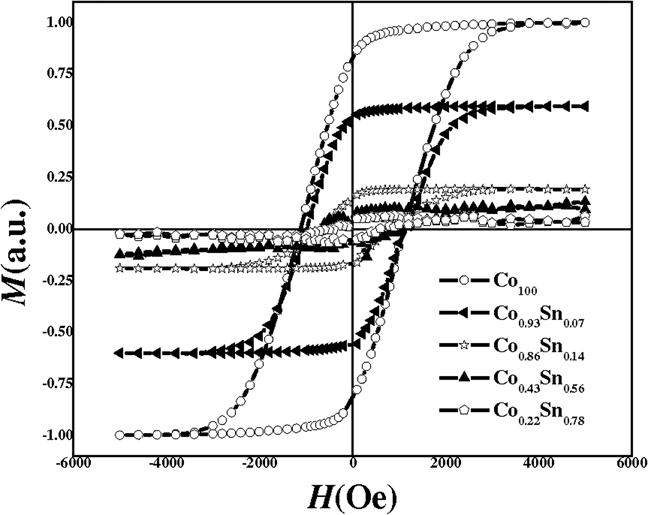
Figure 3 illustrated normalized hysteresis loops of Co1−xSnx (0 ≤ x ≤ 0.78) nanowires with external magnetic field parallel to nanowires. As Co0.43Sn0.57 and Co0.22Sn0.78 did not reveal considerable magnetic properties, these samples were eliminated from remaining investigations.
The normalized hysteresis loops of nanowires with different concentrations of Co1−xSnx nanowire arrays.
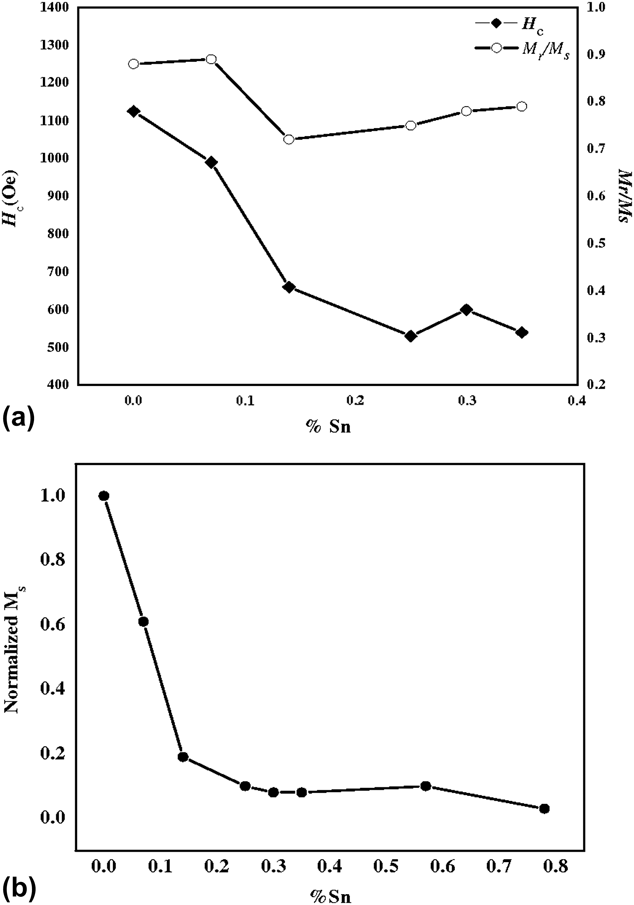
The coercivity (H c) and squareness ratio (M r/M s) of Co1−xSnx nanowires versus Sn content (x) were shown in Fig. 4(a). It can be seen that (H c) and (M r/M s) decreased significantly after increasing the percentage of nonmagnetic element of Sn in alloy nanowires from 1100 Oe and 0.9 at x = 0 to 500 Oe and 0.8 at (x = 0.35), respectively. The normalized saturation magnetization of Co1−xSnx nanowires is revealed in Fig. 4(b). As a result, replacement of the magnetic element (Co) with the nonmagnetic element (Sn) causes a reduction in the magnetic properties with a steep slope.
(a) The variation of H c and M r/M s; (b) normalized saturation magnetization of the Co1−xSnx of nanowire arrays versus Sn concentration in nanowires.
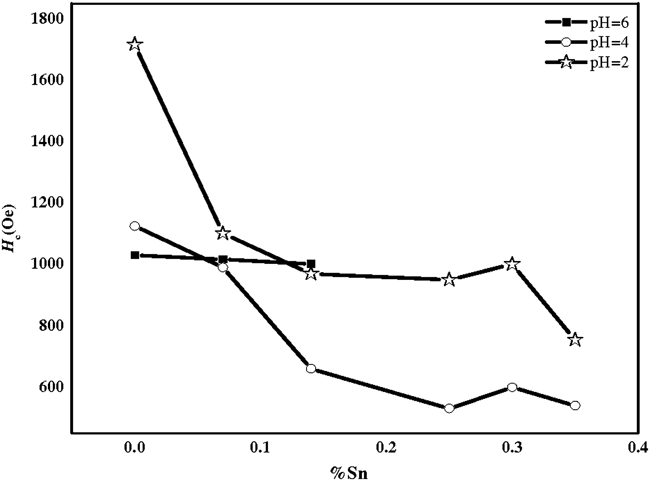
To investigate the influence of pH of the electrolyte on magnetic properties of the Co1−xSnx alloy nanowires, three sample groups at pH = 2, 4, and 6 were fabricated using different percentages of Sn2+. The coercivity of these alloy nanowires is shown in Fig. 5. As shown, H c of Co1−xSnx nanowires at pH = 2 is larger than that for pH = 4 at all Sn2+ concentrations. It can be seen that the deposition process to prepare Co1−xSnx nanowires in electrolyte solutions with pH = 6 was very weak for Co, Co0.93Sn0.07, and Co.86Sn0.14. At higher concentrations of Sn2+ions in the electrolyte with pH = 6, electrodeposition did not occur completely. It has been shown that pH can drastically change the composition of Co1−xSnx nanowires, leading to widely changed magnetic properties. The amount of Co(OH)2 and Sn(OH)2 that was formed at pH = 2 in the electrolyte solution and the surface of the AAO template was lower than that formed at pH = 4 and 6; therefore, the nanowires prepared in the electrolyte with pH = 2 have a greater tendency to precipitate in AAO pores leading to improved magnetic properties. On the other side, the H c values for nanowires prepared at pH = 6 relatively remain steadily without significant change. Because at pH = 6, significant amounts of Co and Sn elements were found as hydroxide. Consequently, a measurable change in magnetic properties of these samples cannot be obtained in different electrolyte solutions.
The variation of coercivity for nanowires was made with pH = 2, 4, and 6 versus Sn content.
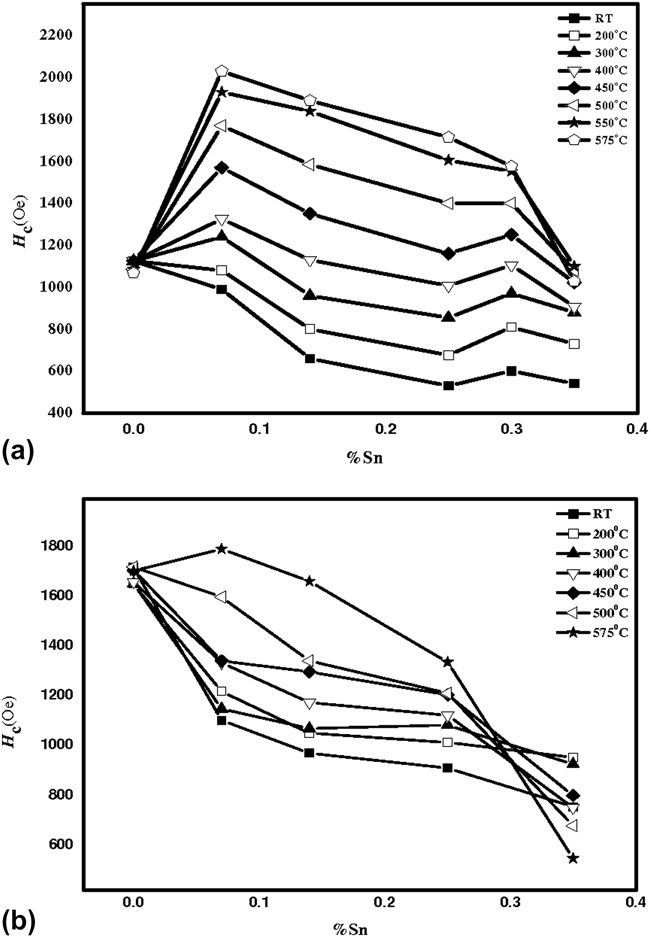
To investigate the annealing effect on magnetic properties of Co1−xSnx nanowires, samples were annealed at different temperatures. The effect of annealing temperature on H c measured at room temperature is shown in Figs. 6(a) and 6(b) for all as prepared Co1−xSnx nanowires at pH = 4 and 2, respectively. In all alloy samples, the H c increased by annealing, whereas it is negligibly increased for pure Co nanowires. The H c value as high as 2030 Oe can be obtained in Co0.93Sn0.07 nanowires (pH = 4) annealed at 575 °C compared to 1000 Oe for a nonannealed sample.
The effect of annealing temperature on the H c for (a) alloy nanowires fabricated in electrolyte solution with pH = 4 versus Sn content and (b) alloy nanowires fabricated in electrolyte solution with pH = 2 versus Sn2+ in electrolyte.
The H c value of Co0.93Sn0.07 alloy nanowires electrodeposited at pH = 2 was significantly increased from 1100 to 1800 Oe.
Figures 7(a) and 7(b) show the XRD pattern of the as-deposited Co and Co0.93Sn0.07 nanowires synthesized at pH = 2 and 4, respectively. Figure 7(a) demonstrated that the arrays of Co nanowires have a polycrystalline hcp structure with strong peaks of (100) and (110) and amorphous phase for alloy nanowires. The XRD pattern of the Co, Co0.93Sn0.07 alloy nanowires prepared at pH = 2 [Fig. 7(b)] indicated that Co nanowires are mainly crystallized in the fcc structure with orientation of (111) and the amorphous phase of Co0.93Sn0.07 nanowires.
The XRD pattern of the Co and Co0.93Sn0.07 nanowire arrays synthesized at (a) pH = 2 and (b) pH = 4.
Comparing the H c values of Co1−xSnx nanowires fabricated at pH = 2 and 4, the former had a higher H c value. But after the annealing process, the latter had an increased H c value.
The XRD pattern of annealed Co–Sn alloy nanowires at pH = 2 and 4 (not shown) indicated the change in amorphous structures. No obvious diffraction peak in the XRD pattern in alloy nanowires indicated the crystallization of the nanowires except relaxation of the amorphous structure. As a result, the improvement in H c values of alloy nanowires could be explained with the release of internal stress. Also, the crystal structure of Co nanowires at pH = 2 and 4 has no explicit phase change after annealing.
It is well known that the magnetic anisotropy originates from several factors: magnetocrystalline, shape, and stress anisotropies. Shape anisotropy is larger than magnetocrystalline and stress anisotropies in all nanowires. In comparison with Co nanowires, stress anisotropy was significantly increased by annealing for all alloy nanowires, that is why the Sn melting point temperature is low, about 232 °C. Thus, by using the annealing process, the Sn melted, then it cooled slowly down to room temperature that helps nanowires to relieve the internal stress and defect in their structure. Consequently, the stress anisotropy improved significantly leading to an increase in H c values of Co1−xSnx alloy nanowires.
The magnetocrystalline anisotropy is near zero for alloy nanowires with amorphous structure. But according to the results of the XRD [Fig. 7(b)] for the pure Co nanowires in hcp structure synthesized at pH = 4, magnetocrystalline anisotropy, that is comparable with shape anisotropy, is perpendicular to the wire axis. The competition between shape and magnetocrystalline anisotropy results in a lower effective anisotropy along the nanowire axis, leading to a decrease in the coercivity of Co along the wire axis, but this is not the case with the amorphous structure of Co–Sn. So, the small coercivity of Co (1150 Oe) increased to 2030 Oe for Co0.93Sn0.07 nanowires.
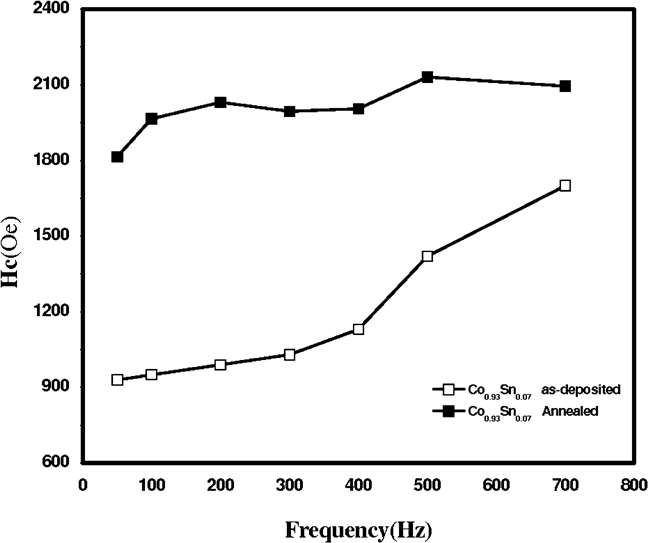
The effect of the electrodeposition frequency and wave form on magnetic properties of nanowires investigated for Co0.93Sn0.07 alloy nanowires with the annealing process. Figure 8 showed the H c value for fabricated samples at various electrodeposition frequencies including 50, 100, 200, 300, 400, 500, and 700 Hz with sine wave form at pH = 4 before and after annealing up to 575 °C.
The variation of the H c value of Co0.93Sn0.07 fabricated in varied electrodeposition frequency before and after annealing up to 575 °C.
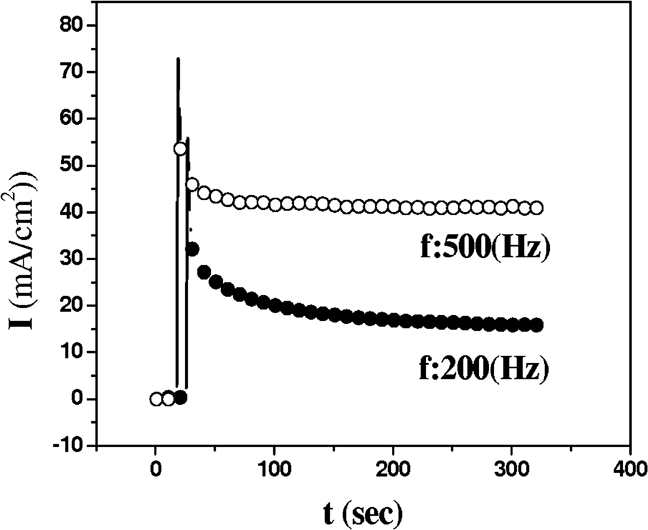
Figure 9 showed the hysteresis loops for Co0.93Sn0.07 nanowires with electrodeposition frequencies of 200 and 500 Hz. The sample fabricated at 500 Hz has a smaller hysteresis loop and bigger coercivity. This curve demonstrated that the amount of electrodeposited metals decreased due to the increase in the electrodeposition frequency leading to embedment of Co2+ and Sn2+ in AAO pores with less stress in nanowire structures. The electrodeposition frequencies higher than 700 Hz cause a decrease in the amount of metal reduction to a great extent in porous AAO, which has not shown considerable magnetic properties. Figure 10 illustrates the electrodeposition current density (I rms) versus the time for Co0.93Sn0.07 alloy nanowires fabricated at 200 and 700 Hz.
The normalized hysteresis loops for Co0.93Sn0.07 nanowires which electrodeposited in frequencies of about 200 and 500 Hz.
The electrodeposition current density for Co0.93Sn0.07 alloy nanowires fabricated in f = 200 and 500 Hz with respect to time.
As seen, I rms increased with increasing frequency, but it should be pointed out that I rms measured is incompatible with the amount of electrodeposited material. The AC deposition current consists of cathodic and anodic half cycles. The difference between these two half cycles corresponds to the real amount of electrodeposited material, and this effective current is independent of I rms that is measured with a multimeter.Reference Najafi, Soltanian, Danyali, Hallaj, Salimi, Elahi and Servati36
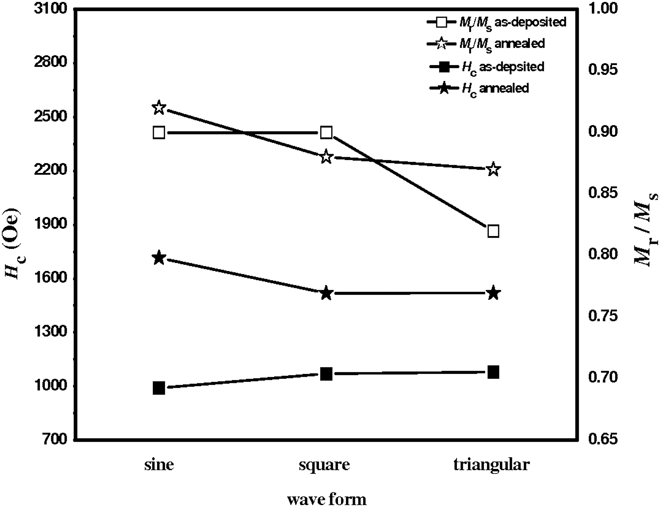
To investigate the effect of wave forms on magnetic properties of nanowires, the Co0.93Sn0.07 alloy nanowires were fabricated in different wave forms including sine, square, and triangular wave forms. For all samples, f = 200 Hz, V p–p = 30 V, and pH = 4 were fixed. Figure 11 illustrated the amount of H c and M r/M s values for all samples before the annealing process and after annealing up to 575 °C.
The effect of wave form on the H c and M r/M s values for the Co0.93Sn0.07 nanowire arrays before and after annealing at 575 °C.
The H c and M r/M s in these three samples did not have significant variation, but after annealing, the amount of H c value rose for the sample fabricated in the sine wave form.
IV. CONCLUSION
All put together, Co1−xSnx nanowires were obtained by the electrodeposition process in which a homemade AAO was used as an ordered porous template for producing highly ordered nanowires. The AAO template has a hexagonally ordered pore array with an average pore diameter of about 30 nm and interspaces of about 50 nm. The linear reduction in voltage was used for reducing the thickness of the barrier layer at the bottom of the AAO template. The effect of Sn2+ concentration on the electrolyte solutions, annealing temperature, pH, electrodeposition frequency, and wave form was investigated for Co1−xSnx alloy nanowires. The EDX analysis revealed that co-electrodeposition of Co and Sn was anomalous. Increasing the Sn concentration in the electrolyte solution (pH = 4) changes the crystal structure from polycrystalline hcp structure of Co nanowires to amorphous phase for Co1−xSnx alloy nanowires. The Co and alloy nanowires produced in the electrolyte solution with pH = 2 had fcc and amorphous phase, respectively. Due to the annealing process, the stress anisotropy improved significantly causing the H c values to increase steadily after the annealing process. In alloy nanowires, the electrodeposition frequency influenced the H c values via improving the rate of the reducing process of Co2+ and Sn2+ in the AAO template at higher frequency and consequently stress in the structure.
ACKNOWLEDGMENT
The authors are grateful for the financial support from the Grant Research Councils of Bu-Ali Sina University as well as HUT.