I. INTRODUCTION
Nowadays, the development of mobile communication and the miniaturization of radio frequency transceivers are experiencing an exponential growth, hence increasing the need for compact antennas. As a result, new antenna prototypes have been developed to provide a larger bandwidth as well as a small dimension. The PIFA antenna is one of the most potential models.
The PIFA antenna has found widespread internal utilization within wireless terminals, thanks to its compact size for both single- and dual-band applications as well as single and dual polarizations. The PIFA antenna has several advantages such as the ease of fabrication, low implementation cost, a compatibility and conformity of ground plane with complex geometries [Reference Taga, Hirasiwa and Haneishi1, Reference Do-Gu and Sung2]. However, in this antenna, the length of microstrip patch, the thickness of the air layer between the patch and the ground plane as well as the shorting pin position strongly influence the antenna reflection coefficient and operating frequency [Reference Chia3, Reference Wong4]. It is difficult to have operating frequency with an optimal antenna input reflection coefficient in each frequency band. Therefore, antenna parameter optimization is a critical issue. Many algorithms have been developed for this purpose, one of which is genetic algorithm (GA) [Reference Holland5, Reference Haupt6]. GA is a stochastic searching algorithm that acts on a population of possible solutions. They are based on the mechanisms of population genetics and selection [Reference Holland5]. A lot of applications used GA to optimize the parameters of antenna. In [Reference Altshuler and Linden7], a GA is used to design and optimize a monopole antenna by selecting the best configuration of the antenna when the length of the monopole changes. In [Reference Schlub, Junwei and Ohira8], a combination of GA and Finite Difference Time Domain (FDTD) based on cost function is used to optimize the antenna's structure and loading conditions for maximal main lobe gain in a single azimuth direction. In [Reference Schlub, Junwei and Ohira8], a GA is used to adaptively alter the polarization and directivity of a crossed dipole antenna.
In this paper, two new designs of the L-shape PIFA antennas with single and dual polarization are proposed. These two antennas operate at the frequency band for IEEE 802.11b/g standard with satisfactory radiation characteristics. The simulation and measurement parameters achieved show that our proposed dual-polarization antenna is suitable for indoor MIMO wireless environment applications. A specific GA auto-embedded in CST Microwave Studio software has been developed to optimize the proposed designs in terms of performance and dimension. This paper presents several relevant novelties in comparison with our recent work [Reference Trong Duc9]. In particular, more parameters of the antenna are optimized and the simulations are carried out on much more individuals. In Section II, we first describe the structure of the designed antennas and then present how to use GA for optimizing our antennas. In Sections III and IV, the two PIFA antennas are, respectively, detailed with respect to the design, simulation, optimization and measurement. Conclusions are finally given in Section V.
II. L-SHAPED PIFA ANTENNA AND OPTIMIZATION PROBLEM
A) PIFA antenna
The Inverted-F Antenna (IFA) typically consists of an element radiation plate located above a ground plane, a short circuit or shorting pin and a feeding mechanism for element radiation [Reference Taga, Hirasiwa and Haneishi1, 10]. IFA is a variant of the monopole antenna in which the first part of the monopole is folded parallel to the ground plane in order to reduce the height of the antenna, while the resonance is still maintained. With this type of antenna, the ground plane plays a major role in the operation of the antenna. The current on the ground plane is bent by the excitation of the current on the surface of the radiation patch and the resulting electromagnetic field is formed by the interaction of the IFA and an image of itself below the ground plane. The capacitance and the input impedance of the antenna are replaced by a shorting pin that connects between the radiation elements to the ground plane. IFA is able to receive both vertically and horizontally polarized electromagnetic waves.
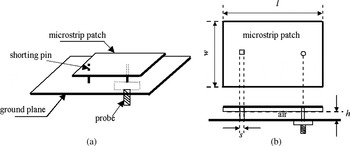
PIFA is considered to be a kind of linear IFA in which the radiation element is replaced by a radiation patch in order to expand the bandwidth as well as minimize the power of electromagnetic wave and reduce its absorption. PIFA is suitable for indoor wireless environment since it is of high-gain in both vertical and horizontal states of polarization. Figure 1 shows the geometry of a PIFA antenna.
Geometry and parameters of PIFA antenna.

B) L-shaped PIFA antenna
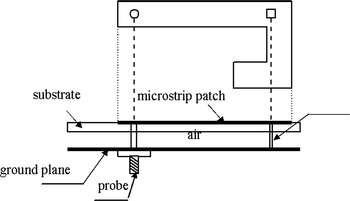
The L-shaped microstrip patch is illustrated in Fig. 2. The antenna is fed through a discrete port on the ground plane. The shorting pin connects the microstrip patch to the ground plane mounted on a dielectric substrate.
Architecture of PIFA antenna L-shape.

The radiation patch length of an L-shape PIFA antenna is easily varied. Therefore, the reflection coefficient and operating frequency of antenna are both easily turned variable without changing antenna size. Thus, the antenna can be minimized as well as the space can be saved.
C) Optimization of the L-shaped PIFA antenna by using GA
The application of GA to antenna parameter optimizations is not novel. The recent versions of CST Microwave Studio have their own embedded GA [11]. However, optimizing antenna parameters can only be done with the tools of the CST software. Consequently, users are restricted by only available CST tools. Using our method, the users can optimize the antenna parameters in such a way they need and they can use their own data format for example. In other words, the proposed method allows being independent of the CST tools. This approach also allows the GA algorithm to be embedded in other simulation softwares.
In this application, we use GA to optimize multiple simultaneously parameters of the antenna in order to simplify the procedure (the principle and activity of GA for PIFA antenna optimization will be detailed further below). The GA is embedded in the CST tool Macro. Thus, the construction, simulation, and optimization of the antenna can be fully implemented through the available functions of CST and programming language Visual Studio in file*. BAS (the interface and example of source codes are shown in Fig. 3). The FDTD method is used to calculate electromagnetic characteristics of antennas.
The interfaces and example of source code in CST Macro.

The most important factor in the GA algorithm is the selection of individuals and fitness function.
For the PIFA antenna structures presented previously, as illustrated in Fig. 1, the resonant frequency f r is calculated using the following formulas [Reference Taga, Hirasiwa and Haneishi1, Reference Chia3].

where
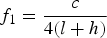
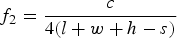


where c is the speed of light, s is the width or radius of the shorting pin, l and w are the length and width of the microstrip patch, respectively, h is the thickness of the air layer between the patch and the ground plane.
These antennas operate in the frequency band ranging from 2.41 to 2.47 GHz. The dielectric substrate proposed is FR4 with thickness of 1.6 mm (a relative permittivity of 4.4 and a loss tangent of 0.02). Then by applying equations (1), (3), (4) and (6), we obtain the dimensions of antenna: l = w ≈ 40 mm.
To optimize this antenna, we used the following individuals: the length of microstrip is represented by a 13-bit binary string (the maximum length of the antenna's patch is 40 mm); the thickness of the air layer between the patch and ground plane is represented by a 10-bit binary string; the discrete position and shorting pin position are represented by the 13-bit binary string.
The number of individuals used to optimize the antenna is 4 and each individual is encoded by the binary string with minimum length of 10. Therefore, the number of calculations done in the optimization process is very large and the memory can be overload. To avoid huge calculations and memory overload, we performed the GA algorithm on antennas with only two or three variable parameters. In addition, for simplify, the value of the binary the string bit encoding these populations is converted and displayed in decimal form.
As a requirement, the frequency band must be between 2.41 and 2.47 GHz. Otherwise, the fitness functions are selected as follows:
(1) For adaptation of antenna: fitness = min (S 11 < −15 dB).
(2) For coupling between two antennas: fitness = (S 12 < −15 dB).
In the case of single polarization antenna, only the first function is considered. In the case of dual polarization, both the functions are taken into account to traduce the effect of one resonant element on the other (i.e. isolation characteristic). Detailed forms of the final fitness function for each antenna are described in the below Step 3.
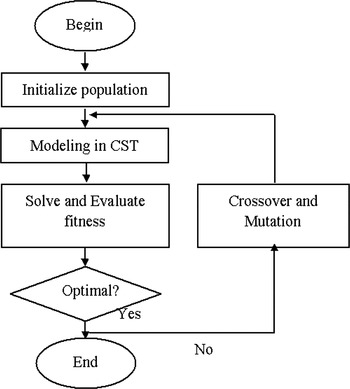
The principle of GA for optimization of PIFA antennas is shown in Fig. 4.
Principle of GA for optimization of PIFA antennas.

GA's activity consists of:
Step 1: Initializing a population. There are six components: ground plane, substrate, air, microstrip patch, discrete port and shorting pin. Random generation of initial population includes the length of microstrip, the thickness of the air layer, the position of discrete port and the position of shorting pin.
Step 2: Creating the antenna and solving the model in CST software. In this step, the frequency and the S-parameters (S 11 for single-polarization antenna, and S 11 and S 12 for dual-polarization antenna) are calculated.
Step 3: Selecting the candidate individuals for GA. For each individual in the population, its output is evaluated based on the fitness function in order to select the candidate for GA. More precisely, when the microstrip length and the port value vary, only those yielding the suitable frequency band (i.e. range from 2.412 to 2.472 GHz) are considered. Then, for each value of microstrip length, the maximum value S 11 (S 11_max) is sought. In the case of single polarization antenna, only pair values (microstrip length and port) with S 11_max < −15 dB are kept. In the case of dual-polarization antenna, only pairs with S 11_max < −15 dB and S 12 < −15 dB are kept. The choice of candidate of shorting pin position and the air layer thickness is carried out similarly.
Step 4: Optimizing. Based on the candidates obtained from Step 3, making a crossover and mutation until the most optimal configuration possible is found.
In fact, there are iterations consisting of Steps 2, 3, and 4 for searching the best configuration (see Fig. 4).
III. SINGLE-POLARIZATION PIFA ANTENNA
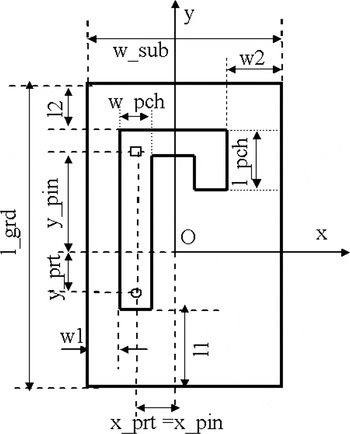
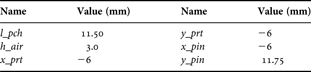
The geometric parameter of the antenna is illustrated in Fig. 5. The microstrip patch has a dimension of l_pch × w_pch × h_pch mm3. The thickness of the layer of air between the patch and ground plane is h_air. The discrete ports are located at (x_prt, y_prt) on the ground plane. The shorting is located on the dielectric substrate at (x_pin, y_pin). The values of those mentioned parameters are turned variable during the optimization step in order to find the best ones.
L-shape microstrip patch.

A) Simulation
In this part, we carry out several simulations of antenna with FR4 dielectric substrate having a dimension of 40 × 40 × 0.8 mm3 in order to show the requirement of parameter optimization.
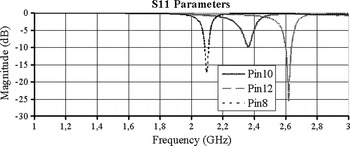
We first vary the value of y_pin while fixing other parameters. More precisely, l_pch = 10 mm, w_pch = 4 mm, h_air = 3 mm, x_prt = x_pin = −6 mm, y_prt = 0 mm when y_pin takes one of the three following values {8, 10, and 12 mm}, meaning that three antennas are considered. The reflection coefficient and the operating frequency of those antennas are, respectively, shown in Fig. 6 from which it is clear that when finding manually the position of pin which yields an optimal antenna configuration is difficult.
Reflection coefficient, S 11, of the single PIFA antenna (without GA).

Similar simulations are carried out by varying l_pch, h_air and y_prt and fixing the rest parameters, and we observe the same problem.
Automatic parameter optimization is therefore a critical issue.
B) GA for single-polarization antenna optimizing
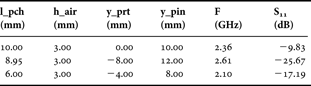
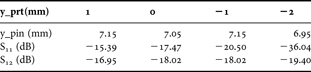
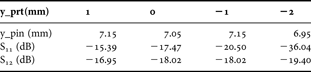
Table 1 presents an example of the input and output parameters when the populations are generated randomly, and Table 2 shows parameters (input and output) when fixing the length of microstrip patch (l_pch = 9.10 mm) and the thickness of the air layer (h_air = 3.0 mm), while changing the shorting pin.
Parameters of the input and the output of the antenna design.
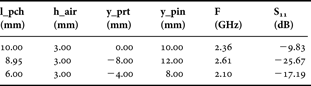
S 11 parameter according to the position of the discrete port and the shorting pin.

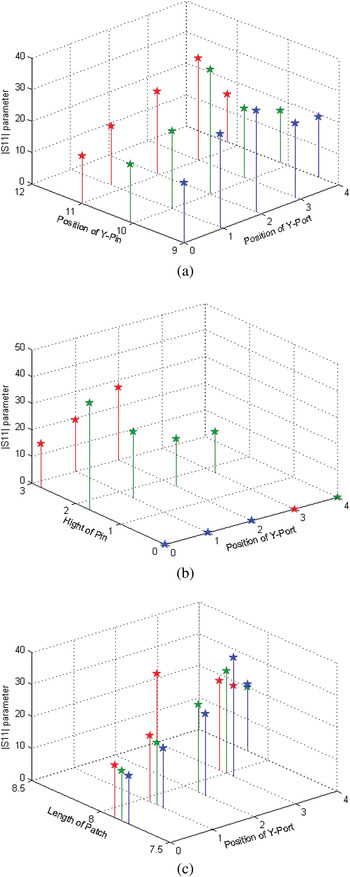
As mentioned in the previous section, three antenna parameters, including the shorting pin position, the length of microstrip patch and the thickness of the air layer, are optimized simultaneously, while the port position y_prt is selected as one of the following values y_prt = {0, 1, 2, 3, and 4 mm}. For intuitiveness, the obtained values S 11 when fixing one of three considered values while varying the others are shown in Fig. 7. There are therefore in total 3 cases: h_air is fixed (Fig. 7(a)), l_pch is fixed (Fig. 7(b)) and y_pin is fixed (Fig. 7(c)).
Modulus of S 11 parameter [dB]. (a) When h_air = 3 mm, positions of y_pin and y_port for: l_pch = 11.55 mm (red), 10.10 mm (green), and 9.10 mm (blue). (b) When l_pch = 10.10 mm, thickness of the layer of air h_air and position of y_port for: y_pin = 10.0 mm (red), 11.0 mm (green), and 9.0 mm (blue). (c) When y_pin = 10 mm, length of patch l_pch and position of y_port 2for: h_air = 3.0 mm (red), 2.8 mm (green), and 3.2 mm (blue).

Figure 7(a) presents the results obtained when the thickness of the air layer is fixed (h_air = 3.0 mm). The shorting pin position takes one of the following values y_pin = {9.40, 9.10, 9.10, 9.05, 9.00 mm}. In this figure, the blue, green and red markers present, respectively, the S 11 obtained with l_pch = 9.10, 10.10, 11.55 mm (the results represented by the blue markers correspond to those shown in Table 2 with the values S 11 of {−19.16, −23.62, −32.23, −29.62 and −19.12 dB}).
Figure 7(b) shows the results when the length of microstrip patch equal to 10.10 mm (l_pch = 10.10 mm). The thickness of the air layer takes one of the following values h_air = (3.0, 2.8, 3.2, 2.9, and 3.1 mm). The blue, green and red markers present, respectively, the S 11 obtained with y_pin = 9.0, 11.0, and 10.0 mm.
Figure 7(c) presents the results when the shorting pin position is fixed (y_pin = 10 mm). The length of patch takes one of the following values l_pch = {9.10, 10.10, and 11.55 mm}. The blue, green and red markers present, respectively, the S 11 obtained with h_air = 3.0, 2.8, and 3.2 mm.
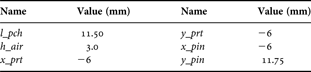
Using crossover and mutation on the samples (maximizing the value of S 11 in this particular case), the optimal configuration is depicted in Table 3.
The parameters of the optimal antenna configuration (using GA).
As computational time, with 213 × 213 × 210 × 210 iterations, this algorithm requires a computational time of 4.5 days with a PC of 3.0 GHz, 3.25 Gb Ram and implemented on Visual Basic. It may be worth noting that the implementation on Visual Basic is about four times faster than that on Matlab.
C) Measurement result
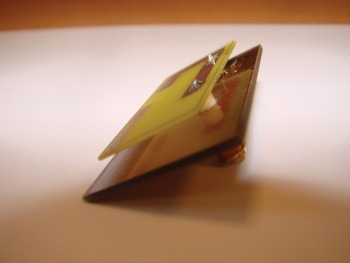
The antenna is fabricated on FR4 dielectric substrate with a dimension of 40 × 40 × 0.8 mm3. The dimension of the ground plane is 40 × 40 × 0.035 mm3. The thickness of the air layer between the patch and the ground plane is 3 mm. The microstrip patch (made from Perfect Electrical Conductor (PEC)) has a dimension of 11.50 × 4 × 0.035 mm3. The discrete port is located at (−6 mm; −6 mm) and the shorting pins are located on the dielectric substrate at (−6 mm; 11.75 mm). Figure 8 shows a photo of the realized antenna.
Photo of the realized 2.40 GHz single-polarization PIFA antenna.

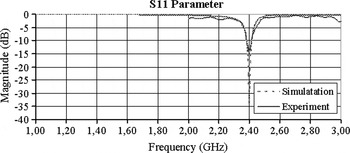
The simulation and measurement results of the input reflection coefficient are shown in Fig. 9. The resonant frequency of the antenna is 2.43 GHz with a bandwidth equal to 300 Hz at S 11 = −10 dB. When compared with the bandwidth of 400 Hz in simulation, there is a slight difference simulation and measurement results, which is due to the realization accuracy as well as the substrate, but it is clearly seen from Fig. 9 that a good agreement between simulation and measurement results is achieved.
Simulation and measurement results of S 11 parameter (using GA).

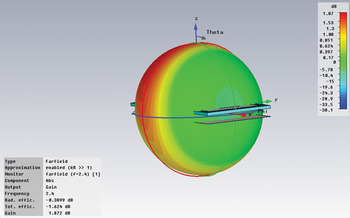
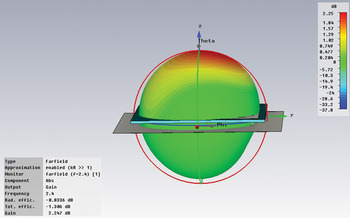
Finally, the 3D radiation pattern at 2.43 GHz of the single polarization PIFA is shown in Fig. 10. It can be noted that the antenna has a smooth radiation pattern such as a dipole: more precisely at 2.43 GHz the gain is 1.85 dBi.
Simulated radiation pattern of the single-polarization antenna.

IV. DUAL-POLARIZATION PIFA ANTENNA
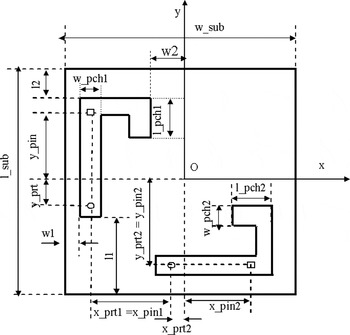
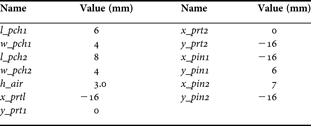
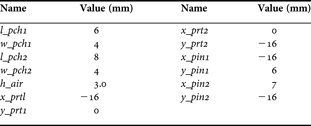
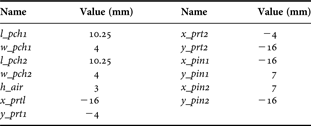
The geometric antenna parameters, illustrated in Fig. 11, are: the microstrip patch with a dimension of l_pch1 × w_pch1 × h_pch1 mm3 for antenna 1 and of l_pch2 × w_pch2 × h_pch2 mm3 for antenna 2. The thickness of the air layer between the patch and ground plane is h_air. The discrete ports are located at (x_prt1, y_prt1) for antenna 1 and at (x_prt2, y_prt2) for antenna 2 on the ground plane. The shorting is located on the dielectric substrate at (x_pin1, y_pin1) for antenna 1 and at (x_pin2, y_pin2) for antenna 2.
Dual-polarization antenna.

A) Simulation
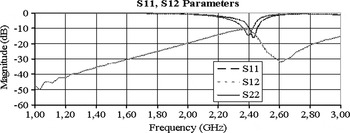
With a configuration of antenna as shown in Table 4, the results of simulation are shown in Fig. 12. For the antenna 1, the operating frequency is 2.38 GHz and the corresponding value S 11 is −14.83 dB. For the antenna 2, the operating frequency is 2.48 GHz and the corresponding value S 11 is −12.66 dB.
S 11, S 22 and S 12 parameters of dual-polarization antenna (without GA). (a) When h_air = 3 mm, positions of y_pin and y_port for: l_pch = 9.25 mm (red), 7.75 mm (green), and 6.50 mm (blue). (b) When y_pin = 7 mm, thickness of the layer of air h_air and position of y_port for: l_pch = 7.75 mm (red), 6.50 mm (green), and 9.25 mm (blue). (c) When l_pch = 7.75 mm, thickness of the layer of air h_air and position of y_port for: y_pin = 8.0 mm (red), 7.0 mm (green), and 6.0 mm (blue).

The parameters of random antenna configuration.
It is clear that automatic parameter optimization is a critical issue.
B) GA for dual-polarization antenna optimizing
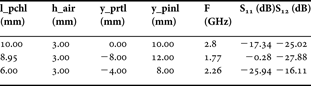
Table 5 presents an example of the input and output parameters when the populations are generated randomly, and Table 6 shows parameters (input and output) when fixing the length of microstrip patch (l_pch = 7.75 mm) and the thickness of the air layer (h_air = 3.0 mm) while changing the shorting pin.
Parameters of the input and the output of the antenna design.
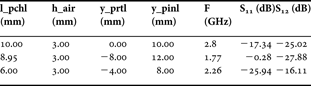
S 11 and S 12 parameters according to the position of the discrete port and the shorting pin.
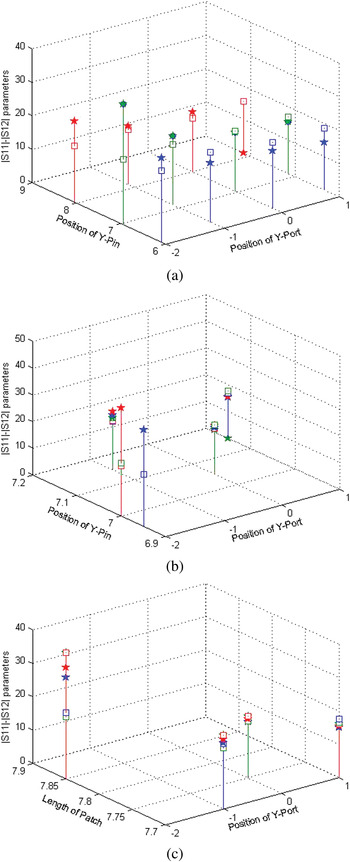
Similar to Fig. 7, Fig. 13 proposes a synthetic and graphic presentation of the obtained results. In this figure, star markers correspond to values of S 11, while rectangle markers represent the values of S 12 (Fig. 13(a) correspond to the results presented in Table 6).
Modulus of S 11 (“star” symbol) and S 21 (“rectangular symbol”) parameters (dB).

Using crossover and mutation on the samples (maximizing the value of S 11 and S 12 in this particular case) the optimal configuration is shown in Table 7.
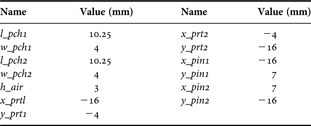
The parameters of the optimal antenna configuration (using GA).
C) Measurement result
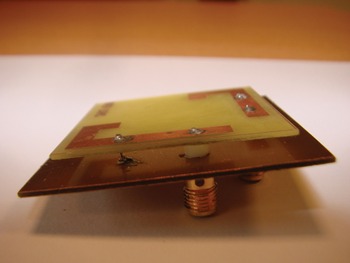
The antenna is fabricated on an FR4 dielectric substrate with a dimension of 40 × 40 × 0.8 mm3. The ground plane has a dimension of 40 × 40 × 0.035 mm3. The thickness of the air layer between the patch and the ground plane is 3 mm. The microstrip patch (made from PEC) has a dimension of 10.25 × 4 × 0.035 mm3. The discrete port is located at (−16 mm; −4 mm) for antenna 1 and at (−4 mm; −16 mm) for antenna 2; the shorting pins are located on the dielectric substrate at (−16 mm; 7 mm) for antenna 1 and at (7 mm; −16 mm) for antenna 2. Figure 14 shows a photo of the realized antenna.
Photo of the realized 2.4 GHz orthogonal polarization PIFA antenna.

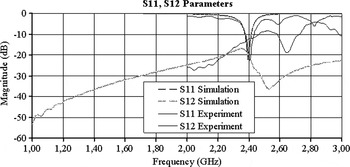
The simulation and measurement results of the input reflection and transmission coefficients are shown in Figure 15. The antenna resonant frequency is 2.43 GHz with a bandwidth equal to 500 Hz at S 11 = −10 dB. It should be noted that this bandwidth is equal to 400 Hz in simulation. In fact, a small error appeared when fabricating the antenna can result in a large difference between the results of the process of simulation (the accuracy in our simulation is 0.05 mm) and that in reality. But it is clearly seen that there is a good agreement between simulation and measurement results. Consequently, we are able to confirm that the obtained parameters of the antenna with the developed GA are optimal.
Simulation and measurement results of S 11 and S 12 parameter (using GA). Since S 11 = S 22, S 12 = S 21, for clarification, only S 11 and S 12 are plotted here.

Finally, Fig. 16 illustrates the radiation pattern at 2.43 GHz of the proposed PIFA antenna system. It can be clearly seen from this figure that the antenna has a smooth radiation pattern at 2.43 GHz, which is like the radiation pattern of a half-wavelength dipole with a gain of 2.15 dBi.
Simulated radiation pattern of the dual-polarization antenna.

V. CONCLUSION
GAs are very useful for various radio electronic optimization problems, especially for optimization of antenna problem. For PIFA antenna, due to the sensitivity of the components on operating frequency and antenna efficiency, the optimization is absolutely necessary and GA is one relevant solution.
Two PIFA antennas are designed and optimized at 2.43 GHz based on GA. The GA is used to optimize antenna parameters such as operating frequency, bandwidth, and radiation pattern. The two proposed antennas are fabricated and measured. They can completely cover the required bandwidths of IEEE 802.11b/g with satisfactory radiation characteristics. The agreement of simulation and measurement results shows the performance of our joint model. The embedded GA can be further applied to other antenna configurations.
 Trong Duc Nguyen received the engineer degree and Master of Science in Information Technology from Hanoi University of Technology, Vietnam in 1998 and in 2002, respectively. From 2002 to 2008, he conducted courses and did research on Artificial Intelligence, Computer Architecture and Embedded system at the Faculty of Information Technology, Vietnam Maritime University. In 2007, he joined a research team at the Centre for Development of Advanced Computing (C-DAC), Noida, India, where his research involved embedded systems. Currently, he is a Ph.D. candidate in electronics at IMEP-LAHC laboratory, Grenoble Institute of Technology (Grenoble INP), France. His current research interests include embedded, intelligent control systems, and smart antenna systems.
 Yvan Duroc received the teaching degree “Agregation” (French national degree) in Applied Physics in 1995 and the Ph.D. degree in Electrical Engineering, from the Grenoble Institute of Technology (Grenoble INP), France, in 2007. From 1997 to 2009, he worked as teaching assistant at The Engineering School Grenoble INP – ESISAR, France. Since 2009, he has been an Associate Professor of microwave and wireless systems at the Grenoble INP – ESISAR. He is in charge of lectures in applied physics, radiofrequency, signal processing, and digital communications for undergraduate and graduate students. His actual research interest concerns RF wireless systems with special attention to ultra-wideband technology and multiple antenna systems.
 Van Yem Vu (associate professor) received the Ph.D. degree in communications from the Department of Electronics and Communications, TELECOM ParisTech (formerly ENST Paris) France in 2005. From 2006 to 2007, he was a postdoctoral researcher at the Department of Hyper-frequencies and Semiconductor, Institute of Electronics, Microelectronics and Nanotechnology (IEMN), France. Currently, he is the Head of the Department of Telecommunication Systems, School of Electronics and Telecommunications, Hanoi University of Science and Technology, Vietnam. Dr Vu Van Yem is also the Vice Director of the Innovation Technology Center, Hanoi University of Science and Technology, Vietnam. Dr Vu Van Yem's areas of expertise are multi-antenna communication and localization systems, microstrip antennas, and antenna array signal processing. He is member of the IEEE, REV (The Radio Electronics Association of Vietnam).
 Tan Phu Vuong (senior member IEEE) was born in Vietnam. He received a Ph.D. degree in Microwaves from Toulouse Institute of Technology, France, in 1999 and HDR (Habilitation à Diriger des Recherches) degree in Microwave and Electronic from Grenoble Institute of Technology (Grenoble INP), France, in 2007. From 2001 to 2008, he was an associate professor in microwave and wireless systems at ESISAR High School of Engineer of Grenoble INP. Since 2008, he is professor at the Phelma High School of Engineer of Grenoble INP. His research interests include modeling of passive microwave and millimeter-wave-integrated circuits. His current research interests include design of small antennas and printed antennas for mobile, RFID, design of passive and active millimeter-wave components.