NOMENCLATURE
- LPP
-
Lean Premixed Prevaporised
- PIV
-
Particle Image Velocimetry
- LDV
-
Laser Doppler Velocimetry
- PRZ
-
Primary Recirculation Zone
- CRZ
-
Corner Recirculation Zone
- LRZ
-
Lip Recirculation Zone
- RQL
-
Rich burn, Quick quench, Lean burn
- LDI
-
Lean Direct Injection
- CAEP
-
Committee on Aviation Environment Protection
- ICAO
-
International Civil Aviation
- CFD
-
Computational Fluid Dynamics
- LES
-
Large Eddy Simulation
1.0 INTRODUCTION
Because it involves fossil fuel, combustion in aircraft engines produce emissions. The emissions from a jet engine give rise to some important environmental concerns regarding their global impact and their effect on local air quality at ground level(Reference Barrett, Britter and Waitz1). Typically, these emissions include oxides of nitrogen (NOx), carbon monoxide (CO) and Unburned Hydrocarbons (UHC). Some of the emissions are classified as hazardous air pollutants (HAPs), and particulate matter (PM) is of concern in the vicinity of airports. NOx, CO and UHC emissions from aircraft and other ground-based sources lead to local and regional production of ozone in photochemical smog reactions, while secondary PM precursor gases (NOx, SOx and UHC) can also react in the atmosphere to form PM. Airborne PM in turn can cause respiratory illnesses and aggravate cardiovascular disease; in addition, sulphur causes acid rain that damages infrastructure. Hence, it is highly desirable to control these emissions through a novel system and components design.
Standards concerned with the emissions of smoke, UHC, CO and NOx from turbojet and turbofan aircraft engines can be found in Annex 16 Volume II by the International Civil Aviation (ICAO)’s Committee on Aviation Environment Protection (CAEP)(2). NOx stringency has subsequently been adopted by CAEP1, CAEP2, CAEP4 and CAEP6 in 1988, 1993, 1999 and 2004 respectively.
In order to reduce the pollutant emissions, many countries have launched a variety of high-efficiency and low-emission combustor development programs with many different approaches, including a Rich burn/Quick mix/Lean burn (RQL) combustor(Reference Rizk and Mongia3,Reference McKinney, Sepulveda, Sowa and Cheung4) , a Lean Premixed Prevaporised (LPP) combustor(Reference Lefebvre5,Reference Mularz6) , a Lean Direct Injection (LDI) combustor(Reference Fu, Jeng and Tacina7,Reference Yi and Santavicca8) and so on. In the development of these low-emission combustors, the emission performance of these combustors is directly related to the flow field, evaporation characteristics of fuel spray and fuel/air mixing that affect the temperature distribution.
Flow dynamics is foundational for researching fuel spray and combustion in low-emission combustors. Aerodynamic characteristics of the non-reacting, swirling flow field in an LDI combustor were investigated by using Particle Image Velocimetry (PIV)(Reference Fu, Jeng and Tacina7) and Computational Fluid Dynamics (CFD) code,(Reference Teo, Siow and Yang9) respectively. The turbulent flow and flame dynamics within an LDI multi-swirler gas turbine combustor were studied by using LASER DOPPLER VELOCIMETRY (LDV), Particle Imaging Velocimetry (PIV) and Large Eddy Simulation (LES)(Reference Fureby, Grinstein, Li and Gutmark10). The flow structure in an RQL combustor were observed by both PIV(Reference Endo, Yarita, Ide, Hiromitu, Kawashima and Ishima11) and a hybrid LES/RANS(Reference Jakirlic, Kniesner, Kadavelil, Gnirb and Tropea12).
LPP combustors offer one of the best methods to meet the goals of reducing NOx emissions. However, LPP combustors are prone to generate combustion driven oscillations and unsteadiness. These instabilities severely limit the operating envelope of such combustors. To better quantify and qualify these instability problems, an in-depth understanding of the flow dynamics inside the combustor is of significant importance. Instantaneous vortex and shear layer vortex shedding in a LPP combustor were studied by using PIV, and both non-reacting and reacting conditions were investigated to assess the effects of the flame on the flow(Reference Dhanuka, Driscoll and Mongia13–Reference Temme, Allison and Driscoll15). The structural characteristics in a lean premixed swirl-stabilised combustor, including the formation of recirculation zones and vortex interaction on the combustion instability, were experimentally investigated by using PIV and OH measurements(Reference Kim, Yoon, Park, Lee and Yoon16–Reference Stopper, Aigner, Ax, Meier, Sadanandan, Stohr and Bonaldo18).
In this paper, a combustor with a staged lean combustion technology is proposed. Then the flow field characteristics of the LPP combustor are experimentally and numerically studied for the purpose of monitoring the fuel atomization and combustion process. The simulations are consistent with the experimental data, which provide a better understanding of the flow characteristics in the LPP combustor. In the following section, the experiment set-up using the PIV device will be introduced.
2.0 RESEARCH OBJECT
Emissions of NOX, UHC and CO from an aircraft are formed in the combustors and generally fall into two categories: those formed as a result of high flame temperature and the other from low flame temperature. In order to minimise emissions, the reactants must be well mixed so that burning will occur evenly throughout the mixture without hot spots or cold spots. This is because the hot spots will increase NOX emissions while the cold spots tend to increase CO and UHC emissions. Thus, there is a need in the combustors to improve mixing and reduce emissions.
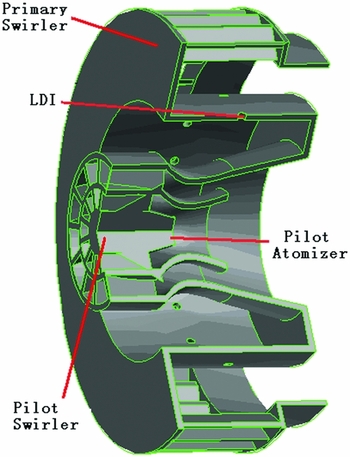
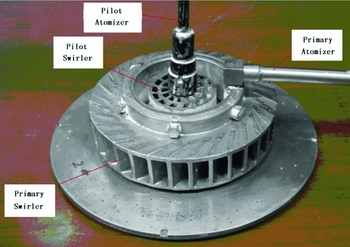
In this study, an LPP combustor with a staged lean combustion technology was proposed to reduce NOX emission (as shown in Figs. 1 and 2). The LPP combustor produces two co-annular swirling jets by pilot and main swirler, respectively. The pilot swirler includes an annular pilot housing with a hollow interior, a pilot fuel nozzle mounted in the housing adapted for dispensing droplets of fuel to the hollow interior of the pilot housing, and a concentrically mounted two-stage axial swirlers positioned upstream from the pilot fuel nozzle. Each of the axial swirlers has a plurality of vanes for swirling air. Swirling air then mixes with fuel from the pilot fuel nozzle. The pilot swirler facilitates to produce a fuel spray which is suitable for starting and low-power operations along with the flow field characteristics appropriate for meeting the design requirements for ignition, starting, lean flame stability, combustion efficiency, etc. The main swirler includes a main housing defined as an annular cavity surrounding the pilot housing, multipoint lean direct injection ports for introducing fuel into the cavity, and a swirler positioned upstream from the multipoint fuel injection ports. The swirler has a plurality of vanes for swirling air through the swirler to mix air and the droplets from the multipoint fuel injection ports. All of the combustor air except cooling air required for the dome and liners passes through the pilot and main swirler. These separated zones of pilot and main swirlers allow staging for high power and low-power duty to be achieved in order to optimise the combustion process.
Structure of the LPP low-emission combustor head.

Photograph of the LPP low-emission combustor head.

In order to study the cold flow fields in the LPP combustor, experimental and numerical studies were carried out. Velocity profiles of different cross sections and a longitudinal section cutting through the centre of the combustor (Z = 0) were measured by PIV. The cross plane (X = 0) is located at the exit of the LPP combustor head. The origin is located at the centre of swirler outlet. The inlet air pressure is 0.10895 MPa. Inlet air temperature is 301°K and inlet air flow rate is 0.129 kg/s.
3.0 EXPERIMENTAL METHOD
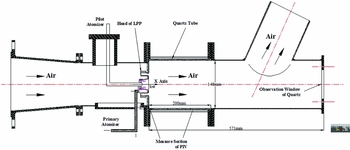
A sketch of the experimental set-up for studying the LPP combustor is shown in Fig. 3. The experimental set-up consists of an inlet section, test section and measuring section of the PIV. The air flows through the LPP combustor and exhaust pipe and into the atmosphere. During the experimental process, the inlet air pressure is kept at 0.11 MPa, the temperature is 301°K and the inlet air flow rate is 0.129 kg/s, so the inlet Reynolds number of the combustor is 6.7 × 10⁴. An orifice flow meter is utilised to measure the airflow rate. The LPP combustor flame tube is made of quartz glass with an observation window at the end of the measuring section.
Sketch of the experimental set-up with PIV.

In order to investigate the flow dynamics within the LPP combustor, a two-dimensional PIV system from TSI Inc. was utilised to record images of both time-averaged and instantaneous velocity patterns in the flow fields. This PIV system consists of a double-pulsed frequency-doubled Nd:YAG laser (200 mJ/pulse at 532 nm), a data acquisition computer, a TSI digital CCD camera and a laser-camera synchroniser. TSI Insight 6 software was used for image acquisition and post-processing. The YAG laser was used as the light source to illuminate the seeding particles within a short time period. A full resolution of 1,600 × 1,200 pixels interline transfer digital CCD camera was used for recording raw images. The tracing particle MgO was provided by a seeding generator with a size less than 8 μm. This tracing particle size ensures that the tracing characteristic and scattering area are optimal at the same time. The seeding particles were injected into the flows of the LPP combustor.
The CCD camera was placed perpendicular to the illuminated centre plane of the test section. The laser and camera were synchronized for a pre-programmed delay between a pair of laser pulses and the corresponding pair of shutter exposures of camera. When the displacement of the particle is relatively small, the motion trajectory of a tracing particle is approximated to be a straight line, and time-averaged velocity within the sampling time will be considered as the instantaneous velocity. Because the time interval is small, when the displacement is too small, this will increase the calculation error for the instantaneous velocity. Thus, the sampling time (or sampling frequency) is determined by the probable maximum velocity in the flow field and the maximum displacement pixel in the images. For the PIV equipment in this paper, 8 displacement pixels is appropriate for the maximum displacement. As above statement, the instantaneous velocity is calculated for every pair of images, and time-averaged velocity is calculated based on 200 pairs, 250 pairs and 300 pairs. It is shown that time-averaged velocity will be unchanged when there are more than 250 pairs, so 250 pairs of images are determined to calculate the time-averaged velocity. Sampling frequency and cutoff frequency are 15 Hz and 1,000 Hz, separately. The total time of measurement for 250 pairs of instantaneous images is 17 s.
The laser light sheet enters the LPP combustor from downstream along the axis of the combustor. The illuminated particles will be scattered in the flow of the test section, and the laser light sheet can pass through the quartz glass flame tube from the side of LPP combustor. The signal from the particles illuminated by the laser was captured by the CCD camera.
4.0 NUMERICAL METHOD
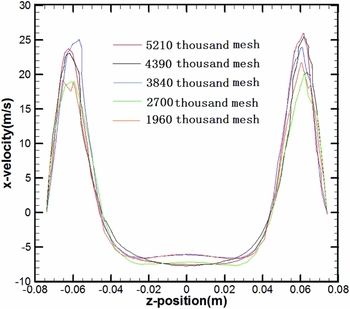
Due to the existence of the pilot swirler, main swirler and lots of cooling film holes, the configuration of the LPP combustor is very complicated. A sub-zone method was applied to generate mesh of the LPP combustor. In order to verify the mesh independence, five mesh sizes were generated to calculate the same cold flow field: 1.96 million, 2.7 million, 3.84 million, 4.39 million and 5.21 million grid cell. For each mesh, the velocity magnitude at the same line (X = 50 and Y = 0) across the combustor are compared, as shown in Fig. 4. The results show that the velocity magnitude curves for different mesh (1.96 million, 2.7 million, 3.84 million and 4.39 million) are different, but when the mesh sizes are 4.93 million and 5.21 million, the velocity magnitude curves almost overlap, so 4.39 million is chosen as the final mess.
Verification of mesh independence.

The simulation of flow dynamics in LPP combustor was achieved by using FLUENT software. The standard k-ε model was applied to simulate turbulent viscosity. The standard wall function was used to deal with the flow near the wall region and the adiabatic wall condition was applied for the simulation. The inlet conditions of simulation are the same as in the experiment setting. The pressure equation is discretised with second-order accuracy. The momentum equation, the turbulent kinetic energy equation and the turbulent kinetic energy dissipation rate equation was discretised by using QUICK scheme, and the discrete equations are iterated by using SIMPLE algorithm. The mass flow inlet boundary condition and the outflow outlet boundary condition were applied for the numerical simulations separately. The inlet airflow rate was 0.129 kg/s, inlet total pressure was 0.11 MPa and inlet total temperature was 301°K. The ideal gas law was used for the numerical simulations. The inlet turbulence intensity was 4%, which is calculated based on the experimental inlet condition. The definition of relative error is the ratio of velocity magnitude difference about two adjacent iteration steps at the same point. When a relative error of flow is less than 5% and all iterative residuals are less than 1.0 × 10⁻³, the numerical results were considered to be convergent in this paper.
5.0 RESULTS AND DISCUSSIONS
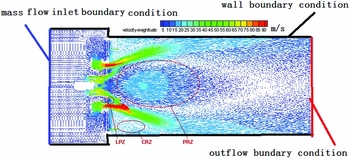
Figures 5 and 6 show the flow field in combustor by simulation. Figure 5 is the velocity vector distribution at the central plane (Z=0). There are three main recirculation zones within the combustor: the Primary Recirculation Zone (PRZ), Corner Recirculation Zone (CRZ) and Lip Recirculation Zone (LRZ). The formation of the CRZ and LRZ is due to the dump face in the front of the upstream; the PRZ is due to the pair vortex constructed by the swirling air flow. The PRZ is slightly long because there is no primary hole in the liner to cut off the recirculation. It can be seen that the air flows into combustor through pilot the swirler, primary swirler and mini cooling holes at the inlets of the LPP combustor head. Because the pilot swirler has two stage axial swirlers and the swirling direction is the same, two swirling jets from these two-stage axial swirlers finally form a swirling jet in the venture tube of the pilot swirler. Most of the air flows into the combustor from the primary swirler to form another swirling jet. These two swirling jets are co-annular, but the swirling directions are opposite, so the two co-annular swirling jets interact with each other and gradually become an annular swirling jet. The swirling jets have axial velocity, vertical velocity and horizontal velocity at the same time; therefore, the swirling jet will expand during the expansion process. Due to entrainment, the pressure at central zone decreases and the large radial pressure gradient is generated by the swirling flow. In other words, the pressure field is induced to balance the centrifugal forces of the swirling flow. A sub-atmospheric low-pressure region is caused and a PRZ is formed in the middle of the combustor head.
Velocity vector at the central section (Cal.).

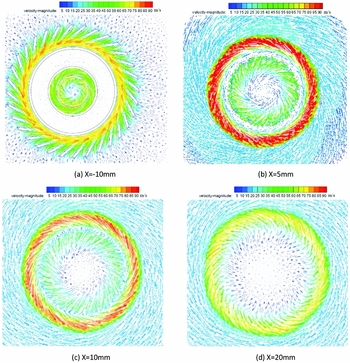
Velocity vector profiles at different cross sections (Cal.)

The PRZ plays an important role during flame stabilization. Firstly, it provides a hot zone due to recirculated back combustion products. The hot gas can ignite the combustible mixed gas. Secondly, it provides a reduced velocity region where the flame speed and flow velocity can be matched. Because of the three-dimensional structure of the swirling jet, the width of the primary recirculation zone increases with the increase in axial distance first, and then the width of PRZ starts to decrease. Due to the sudden expansion in the vicinity of the flame tube head, a CRZ is created as shown in Fig. 5. In addition, a smaller LRZ can also be observed near the lip of the mixer. This LRZ slows down pilot swirling jet before it merges with primary flow. The LRZ may aid in stabilizing the primary flame.
Figure 6 shows the velocity vector profiles at the y-z plane with different axial locations (X= –10, 5, 10 and 20 mm). Figure 6(a) shows the velocity vectors of a cross section at X = –10 mm. It is clear that the swirling directions of the rotary jet flows injected from the two stage axial pilot swirlers are the same, but are opposite to that of the jet flow from the main radial swirler. Figure 6(b) shows the velocity vectors of a cross section at X = 5 mm. In the pilot swirling jet, the first and the second swirling jets from the two-stage axial swirler have the same swirling direction, but the swirling speeds are different. They mix with each other in the venture tube and diffuse outward. Finally, they are mixed and turned into one pilot swirling jet, but the magnitude of speed decreases. Compared with Fig. 6(a), due to the reduced flow area of primary passage, Fig. 6(b) shows that the speed magnitude of primary swirling increases. It can contribute to avoid the presence of flame flashback at the exit of main swirler.
Figure 6(c) shows the two co-annular swirling jets produced by the pilot and primary swirler mixing with each other. Because the airflow rate of the primary swirling jet is much greater than that of the pilot swirling jet, the momentum of the primary swirling jet is far greater than that of the pilot swirling jet. Therefore, the rotating direction of the pilot swirling jet is finally turned into the rotating direction of the primary swirling jet, and the swirling intensity is obviously weakened. Due to the outspread of the annular swirling jet in the radial direction, the size of the primary recirculation zone increases gradually and the velocity decreases with the increase in the axial distance away from the swirler outlet (e.g. from 10 to 20 mm), as shown in Fig. 6(c) and Fig. 6(d).
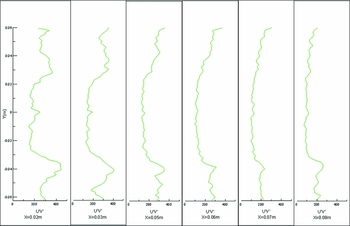
Figures 5 and 6 show the velocity vector characteristics within the combustor. Figure 7 shows the radial distribution of the Reynolds stresses at different axial positions obtained by the PIV. Figure 7 shows that the Reynolds stresses decrease gradually with the increase of the distance from the outlet of the swirler. The same conclusion has been obtained by Simon(Reference Simon, Deck and Guillen19)—the shear stress profiles are the main contributor to the turbulence production. The width of the Reynolds stresses peak increases gradually with the increase of the distance from the outlet of the swirler, which is in accordance with the time-averaged vector profile of the swirling flow shown in Fig. 5. The airs entering from the pilot swirler and the main swirler are mixed with each other, indicating that the shear flow is transformed into a mixing layer which exhibits the higher Reynolds stresses. Moreover, the positions of the Reynolds stresses peak have a good agreement with that of the time-averaged vector peak. Given the statements mentioned above, the mixing process is strictly affected by the Reynolds stresses. The analysis stated above show that there are exchanges of mass, momentum and energy between pilot swirling and primary swirling due to velocity gradients between these two swirling jets.
Radial distribution of Reynolds stresses at different axial positions (Exp.).

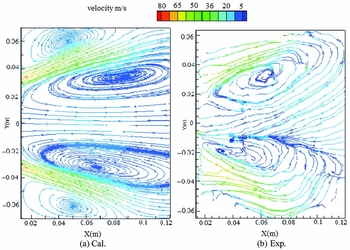
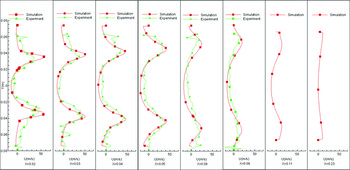
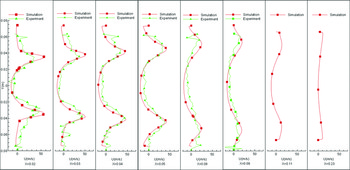
Figure 8 shows the partial enlarged plots of velocity streamlines at the central section (Z = 0) from the numerical simulation and the experiment. A time-averaged flow pattern is seen in Fig. 8(b). About 250 pairs of instantaneous images were captured by the camera. Instantaneous velocity fields of those images were calculated, in which some algorithms (including modification) were applied for the post-processing procedure, and then the time-averaged flow pattern was obtained for all 250 pairs of images. Because of the size of the optical window, the starting position for the PIV measurement is 12.5 mm from the outlet of the swirler. Therefore, the LRZ between the pilot swirler and the primary swirler cannot be caught by the PIV. Figures 9 and 10 show that the swirling jet enters the combustor from the swirlers and expands outward. Therefore, the width of the PRZ increases with the increase in axial distance, and the width of the central PRZ reaches maximum when the axial distance is near to 90 mm, when the width of the PRZ decreases.
Partial enlarged plot of velocity streamline at the central section.

Radial distribution of the axial velocity at different axial positions.

Radial distribution of radial velocity at different axial positions.

Figures 9 and 10 show the quantitative analysis of the numerical and experimental results. Figure 9 is the radial distribution of the axial velocity at different axial position. It shows that two co-annular swirling jets ejected from the primary swirler and the pilot swirler merge into just one swirling jet when the axial distance is greater than 20 mm as shown in the Fig. 6(d). The swirling jet then spreads outside and forms a central PRZ at the central zone of the combustor. There are two peaks whose radial positions are around –30 mm and 30 mm when the axial position is 20 mm. These peaks are symmetrical with the centre line. When the axial distance increases, the swirling jet spreads outside. The width of the PRZ increases first and causes the radial positions of two peaks to spread outward continuously. During the spreading process, the intensity of swirling weakens gradually, so the value of the peak decreases. When the swirling jet gets close to the wall of the combustor, the PRZ width reaches its maximum. When the axial distance further increases, the PRZ width decreases gradually until it disappears. It also can be seen that, as the axial distance increases, the swirling intensity is weakened and the radial velocity is decreased, but the radial distributions of velocities become relatively uniform. A quantitative analysis shows that the numerical results are in good agreement with PIV measurements.
Figure 10 shows the radial distribution of radial velocity at different axial positions. The swirling jet spreads outside, so there is one positive radial velocity peak when the radial position Y is greater than zero and one negative radial velocity peak when the radial position Y is less than zero. As the axial distance increases, the position of radial velocity peak increases but the magnitude of the peak decreases. However, the radial distributions of radial velocities become relatively uniform. Through a quantitative analysis, the numerical results are also in good agreement with PIV measurements.
6.0 CONCLUSIONS
The flow dynamics in a LPP combustor with a staged lean combustion technology were investigated using both experimental and numerical methods. The main results are summarised as follows:
-
1. A PRZ, CRZ and LRZ are obviously revealed in the cold flow fields of the LPP combustor. This is because the two co-annular swirling jets produced by the pilot and primary swirler interact with each other and generate a large radial pressure gradient near the primary swirler exit.
-
2. With the increase of the axial distance from the exit of swirler, the PRZ width increases at first and then decreases. It is noted that the PRZ and LRZ play an important role in flame stabilization, and they may aid in fuel spray and atomization.
-
3. The velocity gradients caused by the pilot swirling flow and primary swirling flow can be clearly observed in the LPP combustor. The velocity gradients benefit the exchange of mass, momentum and energy between the pilot swirling flow and primary swirling flow, and also contribute to the atomization of the fuel and the heat transfer when burning. Moreover, the shear stress is the main contributor to the turbulence production; the shear flow is transformed into a mixing layer which exhibits higher Reynolds stresses, and the mixing process is strictly affected by the Reynolds stresses.
ACKNOWLEDGEMENTS
This work received funding from National Natural Science Foundation of China (No. 51676097) and the Fundamental Research Funds for the Central Universities (NS2016023). The authors are also grateful to Dr Wang Xionghui and Dr Sun Guohua of the University of Cincinnati for the English editing of this paper.