Introduction
Tin is a key metal widely used in the electronic, manufacturing, and maintenance industries, owing to its good properties of low melting point, nontoxicity, high atmospheric corrosion resistance, good ductility, and wettability [Reference Li, Shi, Hao, Xia, Lei, Guo and Li1, Reference Wang, Li, Yang, Xu, Kong and Liu2, Reference Yang, Kong, Bao-Qiang, Liu and Dai3, Reference Garner, Gupta, Bissessur, Kumar and Aspandiar4]. Because of their low melting point and good wettability to the welding matrix, tin–lead-based solders have been the most popular material in electronic packaging [Reference Kaygısız, Ocak, Aksöz, Keşlioğlu and Maraşlı5, Reference Mathew, Yang, Movva and Murty6, Reference Geranmayeh, Nayyeri and Mahmudi7, Reference Zhang8, Reference Yang, Xin and Dong9]. However, in recent years, concerns about the lead toxicity and potential lead pollution have made the development of lead-free solders inevitable [Reference Awe and Oshakuade10, Reference Gain, Fouzder, Chan, Sharif, Wong and Yung11]. The alloys to replace lead-based solder mainly contain Sn and small amounts of Sb, Cu, Ag, Bi, etc. [Reference Novakovic, Giuranno, Ricci, Delsante, Li and Borzone12, Reference Yuan, Borzone, Zanicchi and Delsante13]. In general, the addition of the latter metals to Sn can lower the melting point [Reference Chen, Chen and Wang14] and enhance the mechanical and thermal properties [Reference Awe and Oshakuade10, Reference Pourmajidian, Mahmudi, Geranmayeh, Hashemizadeh and Gorgannejad15, Reference Manasijevic, Vrest’Al, Minic, Kroupa, Zivkovic and Zivkovic16, Reference Zhai, Zhou, Hu and Wei17, Reference Chen, Zi, Gierlotka, Yang, Wang, Lin and Hsu18]. Among them, Sn–Sb alloy solder is the most promising because it resembles the Sn–Pb solder in many properties, because of the diagonal relationship between Sn and Pb in the periodic table [Reference El-Daly, Fawzy, Mohamad and El-Taher19, Reference Chen20].
However, the properties of Sn–Sb solder remain poor compared to the Sn–Pb alloy. For example, the contact angle of Sn–37 wt% Pb solder on Cu ranges from 10° to 15° at the melting point of 473 K [Reference Lin and Lin21], whereas that of Sn–5% Sb solder on Cu plating is between 30° and 40° with an important melting point of 533 K [Reference Yuan, Borzone, Zanicchi and Delsante13, Reference Lin and Lin21, Reference Jang, Kim, Tu and Lee22]. Dong et al. [Reference Dong23] found that the content of Sb affects the property of lead-free Sn–Sb solder. When the content of Sb was less than 6 wt%, the Sn–Sb alloy was a single-phase solid solution. At higher Sn contents, cubic solder is formed during solidification. The brittle intermetallic compound SnSb in the lattice reduces the solder weldability and liquidity. To improve the wettability of Sn–Sb solder, it is necessary to add appropriate elements into the Sn–Sb alloy [Reference Šebo, Švec, Janičkovič, Illeková and Plevachuk24, Reference Meng25, Reference Zhai, Zhou, Wang and Wei26]. Li et al. [Reference Li27] added Cu into the Sn–Sb binary alloy system and calculated the phase diagram of the Sn–Sb–Cu alloy series using the CALPHAD method. They also analyzed the melting point, wettability, conductivity, and other properties of these alloys. The wetting angle of the Sn–36 wt% Sb–xwt% Cu alloy decreased with increasing Cu content (x), reaching a minimum at x = 15. Esfandyarpour and Mahmudi [Reference Esfandyarpour and Mahmudi28] compared the tensile deformation and fracture behavior of Sn–5 wt% Sb–1.5 wt% Bi, and Sn–5 wt % Sb–1.5 wt% Cu solders in a wide temperature range of 298–400 K, and studied the effects of adding Bi and Cu on the tensile properties of the Sn–5 wt% Sb forging alloy. The result showed that ductility of the Sn–Sb alloy was improved by the addition of these two elements. EI-Daly et al. [Reference El-Daly, Mohamad, Fawzy and El-Taher29] investigated the thermal and mechanical properties of Sn–5 wt% Sb solder alloy by adding 0.7 wt% Cu and 0.7 wt% Ag into it. Using OM, SEM, EDS, and tensile tests, they found that both Ag and Cu can refine the microstructure.
Despite the many experiments investigating the influence of alloy elements on the properties of lead-free solders, the behavior mechanism of alloy elements in lead-free solders are not sufficiently studied, and there is no comprehensive understanding on the microscopic behavior of alloy elements. To improve the properties of solders and to develop new ones, it is very important to unveil the interaction between the alloy elements in lead-free solders on the level of electronic structure. The density functional theory (DFT) has proven to be an efficient and powerful tool to investigate the physical and chemical properties of alloys, with the calculated results in good agreement with experimental ones [Reference Lin, Hui, Lu, Wang, Wang and Lee30, Reference Sun, Xiao, Deng and Hu31].
In this work, the electronic structures of Sn–Sb, Sn–Sb–Cu, and Sn–Sb–Ag–Cu alloys are studied systematically using DFT [Reference Chen and Li32] to investigate the interaction between alloy components in lead-free solders with different compositions. The results show that suitable alloying elements can weaken the covalent bond in Sn-based alloys and improve the wettability, which could significantly help the further development of new solder alloys.
Results and discussion
Sn–Sb systems
Based on the work by Dong et al. [Reference Dong23], we calculated the electronic structure of Sn–Sb alloys containing 4.8 wt%, 6.4 wt%, and 8 wt% Sb after the initial optimization and the dynamic simulations at 673 K, to understand the observed effect of Sb component on the properties of lead-free Sn–Sb solder.
Structures of Sn–Sb alloys
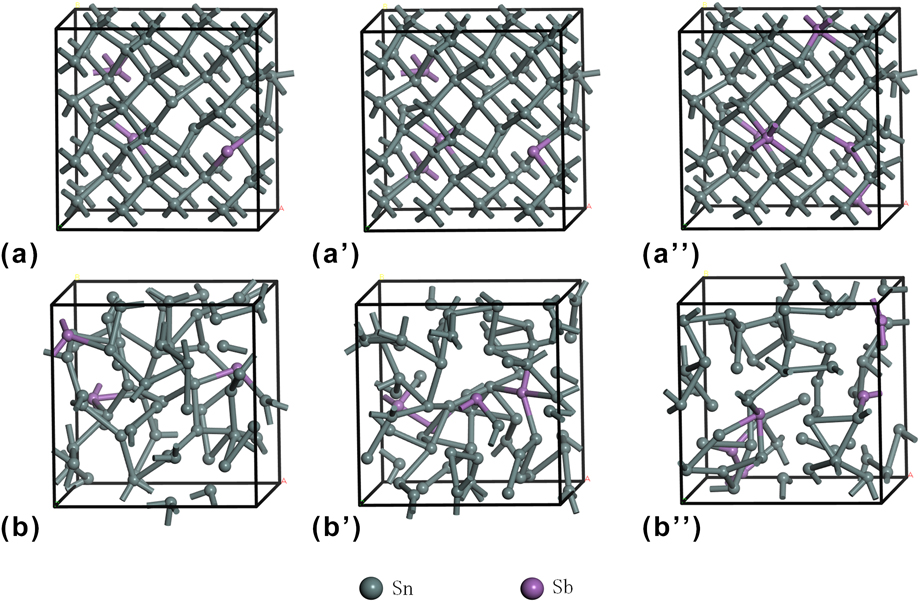
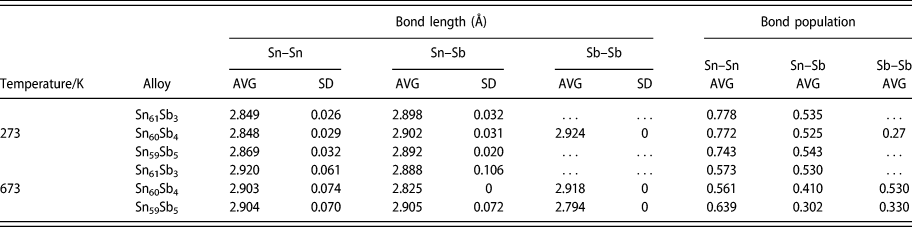
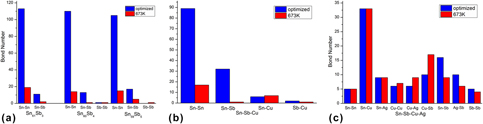
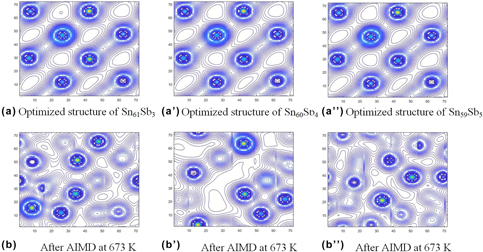
Figure 1 shows the structures of the Sn61Sb3, Sn60Sb4, and Sn59Sb5 alloy supercells after optimization and dynamic simulation, and Table I shows the corresponding bond lengths. Figure 2(a) indicates that the bond numbers also changed after optimization and ab initio molecular dynamics (AIMD) at 673 K. Taken together, these data reveal that Sn–Sn and Sn–Sb bonds are the main types of bonds in all three Sn–Sb alloys, whether in the initial optimized structures or after AIMD simulation.
The structures of Sn–Sb alloys after optimization and AIMD at 673 K. (a) Optimized structure of Sn61Sb3. (a′) Optimized structure of Sn60Sb4. (a″) Optimized structure of Sn59Sb5. (b) After AIMD at 673 K. (b′) After AIMD at 673 K. (b″) After AIMD at 673 K.

Bond lengths and bond population of Sn–Sb alloys after optimization and AIMD at 673 K.

Note: average (AVG), standard deviation (SD).
(a) The bond number of Sn–Sb alloys after optimization and AIMD at 673 K. (b) The bond number of Sn–Sb–Cu alloys after optimization and AIMD at 673 K. (c) The bond number of Sn–Sb–Cu–Ag alloys after optimization and AIMD at 673 K.
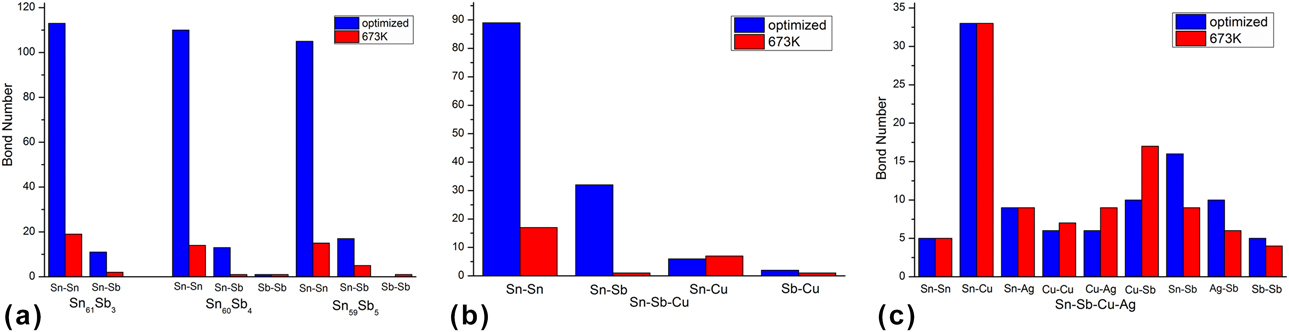
With increasing Sb content in the alloys, the number of Sn–Sn bond decreases, from 113 to 110 and 105 in the optimized Sn61Sb3, Sn60Sb4, and Sn59Sb5 systems, respectively. The average Sn–Sn bond length is the shortest, in Sn60Sb4 (2.848 Å with standard deviation of 0.029 Å), although the difference is not so obvious (2.849 Å for Sn61Sb3 with standard deviation of 0.026 Å and 2.869 Å for Sn59Sb5 with standard deviation of 0.03 Å). The number of Sn–Sb bond after structural optimization increases with increasing Sb content, and the average Sn–Sb bond length changes in the same way. However, only the Sn60Sb4 system contains one Sb–Sb bond with the bond length of 2.924 Å.
After dynamic simulation at 673 K, the number of Sn–Sn bonds in the different Sn–Sb systems is significantly reduced. In Sn61Sb3, it decreases from 113 to 19, whereas the average bond length increases to 2.920 Å with a standard deviation of 0.061 Å; in the Sn60Sb4 system, these values are 14, 2.903 Å, and 0.074 Å; and in the Sn59Sb5 alloy, they are 15, 2.904 Å, and 0.070 Å, respectively. It indicates that the interactions between Sn–Sn in different Sn–Sb alloy systems are obviously weakened when heated to 673 K. Compared to Sn61Sb3 and Sn59Sb5, Sn60Sn4 has the fewest Sn–Sn bonds. At 673 K, the number of Sn–Sb bond in the Sn61Sb3 alloy system is 2, the average bond length is 2.888 Å with the standard deviation of 0.106 Å; for the Sn59Sb5 system, these values were 5, 2.905 Å, and 0.072 Å, respectively. The number of Sn–Sb bond in the Sn60Sb4 system is 1, and the average bond length is 2.825 Å. It is easy to find that the number of Sn–Sb bond in Sn60Sb4 system is the lowest. When the temperature is 673 K, there is one Sn–Sb bond in both Sn60Sb4 and Sn59Sb5 systems, with the respective lengths of 2.918 and 2.794 Å.
The structural calculation results suggest that the bonding in Sn60Sb4 alloy changes significantly after heating, and the interactions between Sn–Sn and Sn–Sb in this system are weaker than those in Sn61Sb3 and Sn59Sb5. Therefore, a Sn–Sb alloy with 6.4 wt% Sb would have better wettability compared to both Sn61Sb3 and Sn59Sb5, which is consistent with the works of Dong et al. [Reference Dong23].
Electron density distribution and average population
The Mulliken bond populations were calculated according to the formalism described by Segall et al. [Reference Segall, Pickard, Shah and Payne33, Reference Segall, Shah, Pickard and Payne34]. In addition to objectively evaluating the bonding between atoms, the overlap population may be used to assess the covalent or ionic nature of a bond: a high bond population indicates a covalent bond, whereas a low value indicates an ionic interaction. A further measure of the ionic character is the effective ionic valence, which is defined as the difference between the formal ionic charge and the Mulliken charge on the anion species. A value of zero indicates a perfectly ionic bond, whereas values greater than zero indicate increasing levels of covalency [Reference Segall, Shah, Pickard and Payne34].
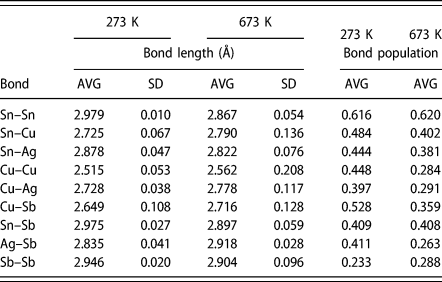
The average bond populations of different Sn–Sb alloys after optimization and dynamic simulation at 673 K are shown in Table I. The populations of Sn–Sn and Sn–Sb bonds are greater than zero. Combining the data in Table I with the electron density distribution in Fig. S1, we can easily find that the bonds of Sn–Sn and Sn–Sb are a mixture of nonlocalized metal bond and localized covalent bond. After optimization, the average population of Sn–Sn bond in Sn61Sb3 system is 0.778, whereas those in Sn60Sb4 and Sn59Sb5 are 0.772 and 0.743, respectively. It indicates that the average population number of Sn–Sn bond decreases with the increase of Sb content, and so the addition of Sb would reduce the localized covalent component of the Sn–Sn bond. The average population of Sn–Sb bonds are 0.535, 0.525, and 0.543 in Sn61Sb3, Sn60Sb4, and Sn59Sb5 systems after the optimization, respectively. Sn60Sb4 has the lowest covalent composition for the Sn–Sb bond. Considering that there is only one Sb–Sb bond in this system, the population is 0.27. The reason for the lowest bond population in Sn60Sb4 should be related to the formation of Sb–Sb bond.
When the temperature increases to 673 K, the average population of Sn–Sn bond in the Sn61Sb3, Sn60Sb4, and Sn59Sb5 systems is 0.573, 0.561, and 0.639, respectively. The average population in Sn60Sb4 is the minimum, suggesting that the Sn–Sn bond in this system has a lower localized covalent composition than in the other systems. After dynamic simulation at 673 K, the average population of Sn–Sb decreases to 0.530, 0.410, and 0.302 in the Sn61Sb3, Sn60Sb4, and Sn59Sb5 systems, respectively. At 673 K, the Sb–Sb bond exists in both Sn60Sb4 and Sn59Sb5 systems, with the average bond populations of 0.530 and 0.330, respectively. It illustrates that temperature has a great influence on the covalent component of the Sn–Sn and Sn–Sb bonds, because the covalent bond itself has the characteristics of directionality and saturation. The weakening of covalent bond with temperature can improve the fluidity of the Sn–Sb alloys. For the three Sn–Sb alloy systems, the covalent bond in the Sn60Sb4 system weakened the most with the increase of temperature, and so this alloy has the best fluidity, which is consistent with the literature results [Reference Dong23].
Partial density of states (PDOSs)
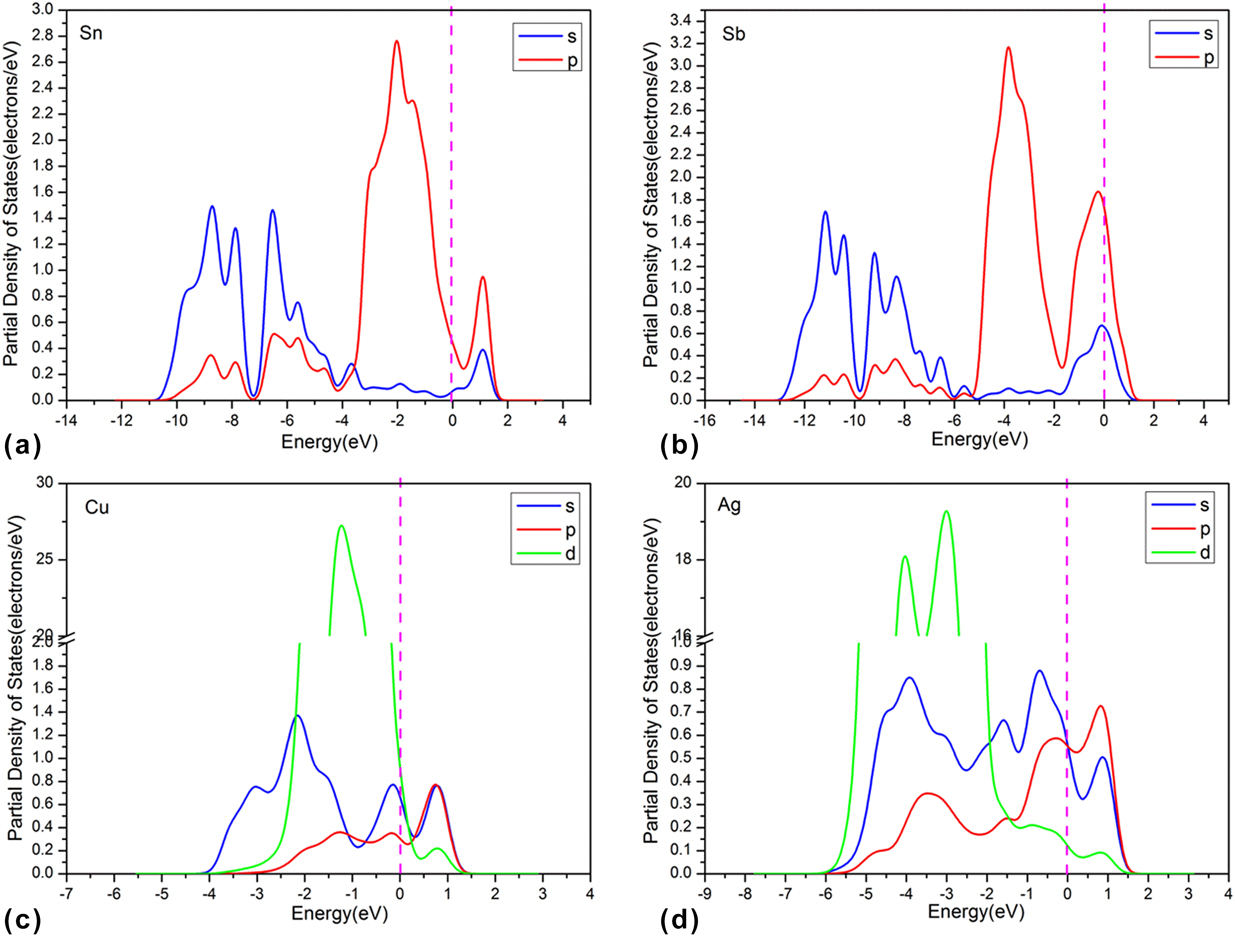
Figure 3(a) shows that the PDOS of Sn64 are continuous at the Fermi level, suggesting that the system is in a metallic state. For this system, the PDOS from −11 to 1.7 eV can be divided into two regions above and below −4.2 eV. There is a wide energy band near the Fermi energy level between −4.2 and 1.7 eV, and its occupied energy width is about 5.9 eV. Despite the continuous PDOS (i.e., metallicity) of pure Sn, the splitting of PDOS also shows the obvious feature of covalent bonding when the Sn atoms bond with each other.
The PDOS of Sn Sb Cu and Ag after optimization. (a) PDOS of optimized Sn. (b) PDOS of optimized Sb. (c) PDOS of optimized Cu. (d) PDOS of optimized Ag.
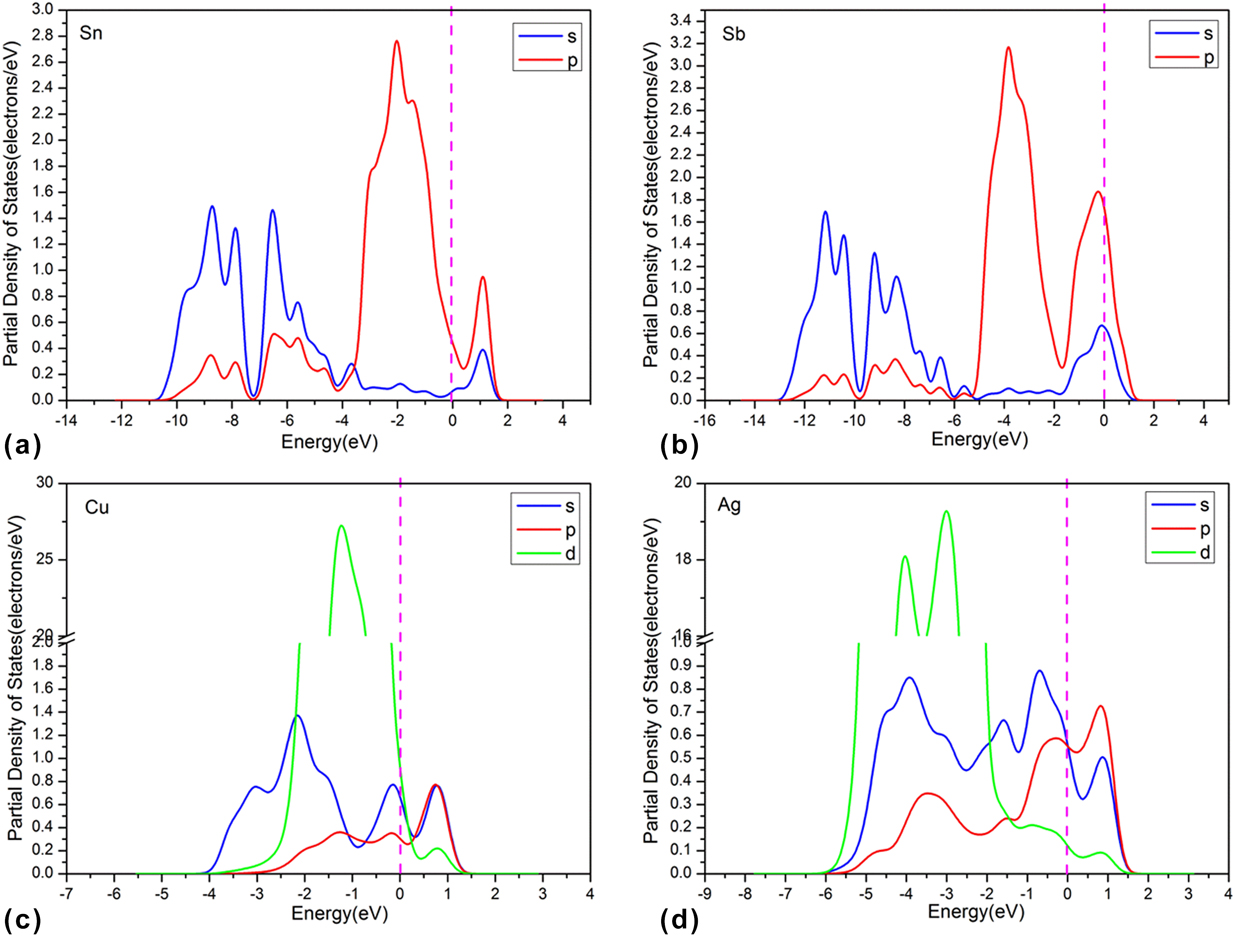
In Fig. 3(b), the energy space for pure Sb from −13 to 1.6 eV can be divided into two regions: −13 to −5.2 and −5.2 to 1.2 eV. There is a wide energy band near the Fermi energy level (−5.2 to 1.2 eV) and its occupied energy width is about 6.4 eV. As mentioned above for the pure Sn system, the continuity of PDOS and its splitting of pure Sb also indicates both metallicity and feature of covalent bonding.
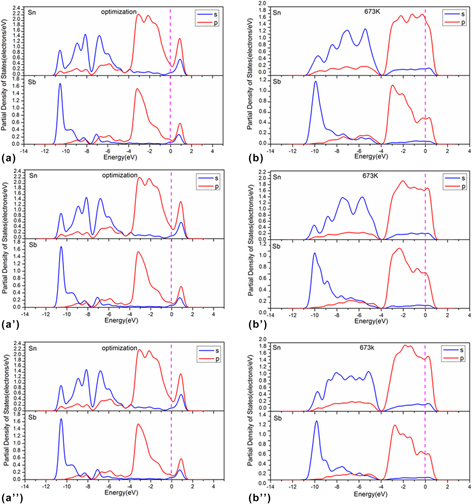
Further, the calculated PDOS of Sn–Sb alloys are shown in Fig. 4. The obtained PDOS, which range from 0.5 to 1.2 eV in Figs. 4(a), 4(a′), and (a″) and located at the valence band of Sn and Sb, are both continuous and show features of covalent bonding. There is clear electron transfer between Sn and Sb, because the valence band of Sn–Sb changed greatly compared with those of pure Sn and Sb.
PDOS of Sn–Sb alloys at different temperatures. (a) Optimized structure of Sn61Sb3. (a′) Optimized structure of Sn60Sb4. (a″) Optimized structure of Sn59Sb5. (b) Sn61Sb3 after AIMD at 673 K. (b′) Sn60Sb4 after AIMD at 673 K. (b″) Sn59Sb5 after AIMD at 673 K.
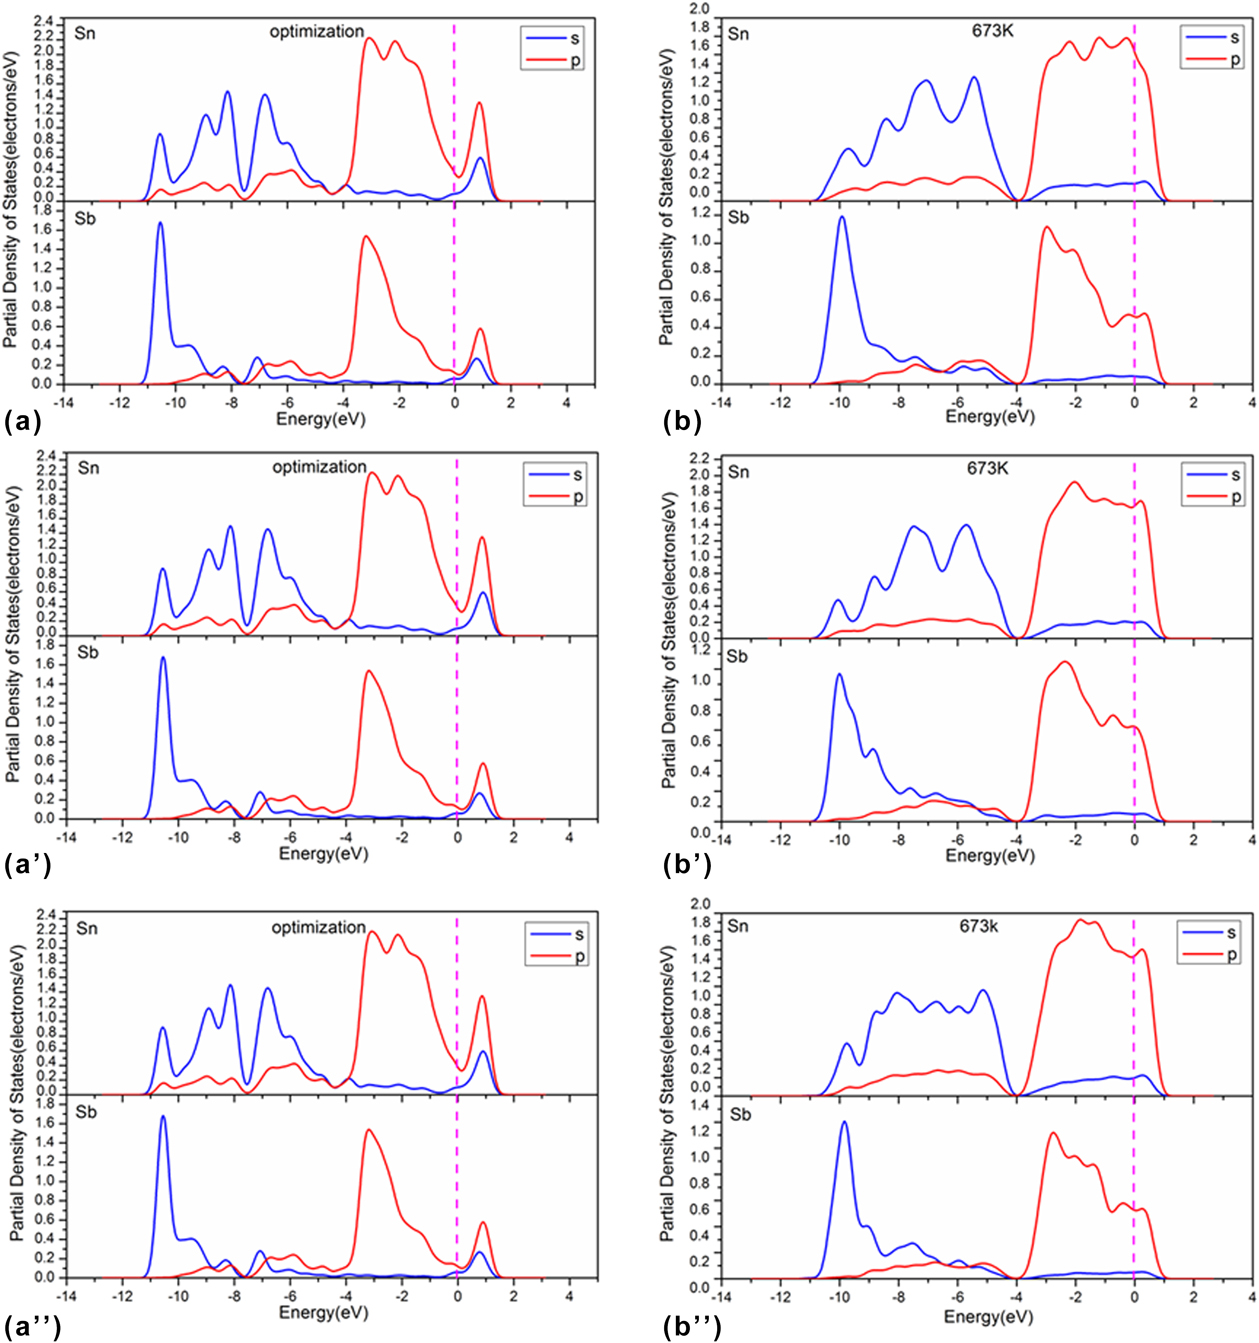
When the temperature is raised to 673 K, Figs. 4(b), 4(b′), and 4(b″) show that the energy space between −11 and 1.2 eV can be divided into two regions above and below −4 eV. The energy band near the Fermi energy level is from −4 to 1.2 eV, and the width is about 5.2 eV, mainly contributed by the 5p orbits of Sn and Sb atoms. The energy band between −11 and −4 eV is mainly composed of the 5s orbit of Sn and Sb, and the energy width is 7 eV. On the other hand, the Sn-5s and Sn-5p orbits are shifted negatively, and the Sb-5p orbit expands near the Fermi level. In this case, the valence bands show better continuity, and the PDOS of Sn and Sb exhibit more obvious metallicity. However, the covalent features of Sn–Sn and Sn–Sb bonds are not obvious. Compared with the other two systems, Sn60Sb4 shows better continuity near the Fermi level within the temperature range from 273 to 673 K, indicating that this system has the weakest covalent bond and the best fluidity. These analyses are consistent with the previous reports.
Sn56Sb6Cu2 system
Li et al. [Reference Li27] calculated the phase diagram of Sn–Sb–Cu system longitudinal fracture plane with 2 wt% Cu, to explore the wettability of Sn–10 wt% Sb–2 wt% Cu alloys. Other experimental studies also showed that the addition of Cu can refine the microstructure and improve the wettability of Sn–Sb alloy [Reference Yuan, Borzone, Zanicchi and Delsante13, Reference Šebo, Švec, Janičkovič, Illeková and Plevachuk24, Reference Lapsa, Onderka, Schmetterer, Ipser, Yuan and Borzone35]. To elucidate the role of Cu, the Sn–Sb–Cu alloy system was examined in our study and discussed below.
Structures of Sn–Sb–Cu alloys
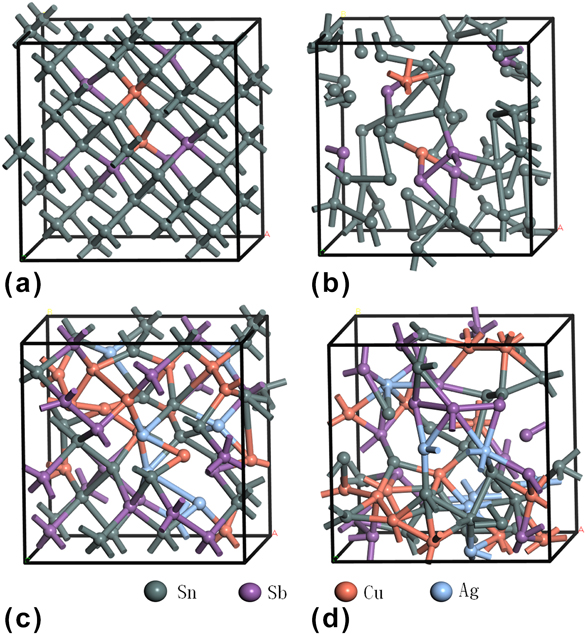
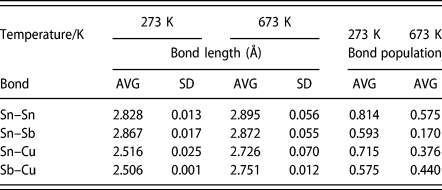
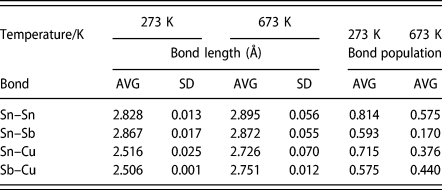
Figures 5(a) and 5(b) show the structures of the Sn56Sb6Cu2 supercell after optimization and dynamic simulation at 673 K, and the corresponding bond lengths after optimization and AIMD at 673 K are shown in Table II. Combining Table II with the structure in Figs. 5(a) and 5(b), the Sn–Sn, Sn–Sb, Sn–Cu, and Cu–Sb bonds were identified in this system. In the optimized structure, the number of Sn–Sn bond is 89 (average bond length: 2.828 Å with standard deviation of 0.013 Å), that of Sn–Sb bond is 32 (2.867 Å, 0.017 Å), that of Sn–Cu bond is 6 (2.516 Å, 0.025 Å), and that of Sb–Cu bond is 2 (2.506 Å, 0.001 Å). After AIMD at 673 K, the number of Sn–Sn bonds is decreased to 17 (2.895 Å, 0.056 Å), and the numbers of Sn–Sb and Sb–Cu bonds are both reduced to 1 (2.927 Å and 2.575 Å, respectively). Although the bonding of Sn–Sn, Sn–Sb, and Sb–Cu is weakened when the temperature rises to 673 K, the number of Sn–Cu bond increases to 7 (average bond length increases to 2.726 Å with standard deviation of 0.070 Å), indicating that temperature enhances the bond of Sn–Cu in tin-based alloys.
The structures of Sn56Sb6Cu2 and Sn26Sb17Cu14Ag7 alloys after optimization and AIMD at 673 K. (a) Optimized structure of Sn56Sb6Cu2. (b) Optimized structure of Sn26Sb17Cu14Ag7. (c) Sn56Sb6Cu2 after AIMD at 673 K. (d) Sn26Sb17Cu14Ag7 after AIMD at 673 K.

Bond length and bond population of Sn56Sb6Cu2 alloys after optimization and AIMD at 673 K.
Note: average (AVG), standard deviation (SD).
Comparing the optimized structures of Sn56Sb6Cu2 and Sn60Sb4, the Sn–Sn bond is longer in the former and the Sn–Cu bond length increases significantly. When the temperature rises to 673 K, the bond lengths in Sn56Sb6Cu2 system at 673 K change little from those in the optimized structure, whereas the Sn–Sb bond length increases due to the formation of Sn–Cu and Sb–Cu bonds. Therefore, the interactions between Sn–Sn and Sn–Sb decrease with the addition of Cu in Sn–Sb alloys.
Average population in Sn56Sb6Cu2
To further explore the bonding in Sn56Sb6Cu2 alloys, its Mulliken population was calculated and the results are shown in Table II. The data indicate that the average population of Sn–Sn bond in this system decreases obviously when the temperature rises, whereas the population of Sn–Sb bond is also greatly influenced by the temperature. The electron density distribution diagram shows that the Sn–Sn and Sn–Sb bonds are mixed metallic and covalent bonds. Combined with the change of bond length before and after heating, it can be inferred that an increase of temperature weakens the covalent component of Sn–Sn and Sn–Sb bonds. Table II also indicates that the average population of Sn–Cu and Sb–Cu bonds decreases with the increase of temperature. Compared to Sn60Sb4, the average populations of Sn–Sn and Sn–Sb bonds decrease significantly in the Sn56Sb6Cu2 system. So, adding Cu into the Sn60Sb4 system weakens the covalent interactions of Sn–Sn and Sn–Sb. As mentioned above, due to the directionality and saturation of the covalent bond, its weakening can improve the fluidity of Sn56Sb6Cu2 alloy compared to the Sn–Sb alloys.
PDOS
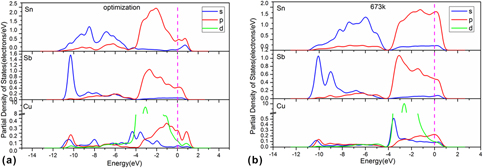
To further study the electronic structure of Sn–Sb–Cu alloys, the calculated PDOS for Sn56Sb6Cu2 are shown in Fig. 6. For comparison, the PDOS of pure Cu [Fig. 3(c)] show a wide energy band from −4.2 to 1.5 eV, of which the occupied energy width is about 5.7 eV. Therefore, the pure Cu has good continuity and metallicity.
PDOS of Sn56Sb6Cu2 alloys at different temperatures. (a) Optimized structure of Sn56Sb6Cu2. (b) Sn56Sb6Cu2 after AIMD at 673 K.
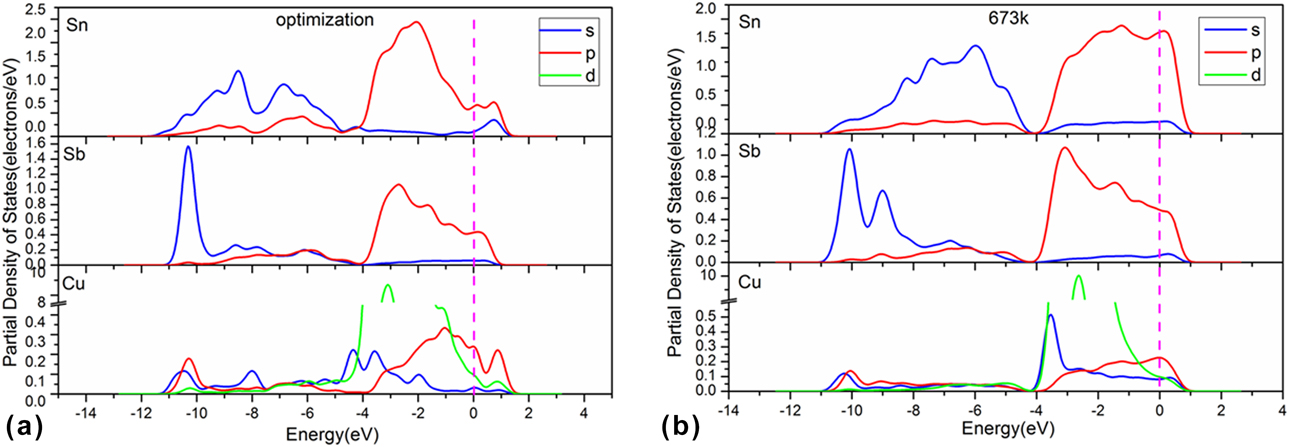
In Fig. 6, the energy space can be divided into two regions: −11 to −4 eV and −4 to 1.2 eV. The energy band near the Fermi energy level is from −4 to 1.2 eV, and the energy width is about 5.2 eV. The energy band is mainly determined by the orbits of Cu-4d, Sn-5p, and Sb-5p. The energy band between −11 and −4 eV is mainly composed of Sn-5s and Sb-5s orbits, and the width of occupied energy is 7 eV.
Earlier we mentioned that in pure Sn and Sb, the valence band in the range 0.5 to 1.5 eV in the PDOS indicates covalent bonding. When Cu is added into the Sn–Sb alloy, the PDOS of Sn and Sb in the optimized Sn–Sb–Cu alloy indicate an obvious increase in metallicity, compared with the optimized Sn–Sb alloys, because there are distinct interactions between the 4s, 4p, and 3d orbits of Cu and the 5s and 5p orbits of Sb. When the temperature rises to 673 K, the PDOS of both 5s and 5p orbits of Sb shift negatively, the interactions between 3d, 4s, and 4p of Cu and 5s and 5p of Sb remain obvious, and the continuity of the PDOS improves, which is consistent with the structure and population results and previous experimental findings [Reference Li27].
Yuan et al. [Reference Yuan, Borzone, Zanicchi and Delsante13] found that the wetting angle of Sn–Sb–Cu–Ag solder decreases by 3.75° compared to that of Sn–Sb–Cu under the same soldering conditions, and that adding 1% Ag can clearly improve the wettability of Sn–Sb–Cu solder alloy. In addition, the Sn–30 wt% Sb–13 wt% Cu–11 wt% Ag alloy was selected as a high-temperature lead-free alloy by calculating and predicting the phase diagram of a series of longitudinal sections of alloys and combining with the measured results [Reference Yuan, Borzone, Zanicchi and Delsante13, Reference Li27]. Therefore, theoretical calculation of the Sn–Sb–Cu–Ag system will be carried out next to elucidate the role of Ag in this alloy system.
Sn26Sb17Cu14Ag7
Structures of Sn–Sb–Cu–Ag alloy
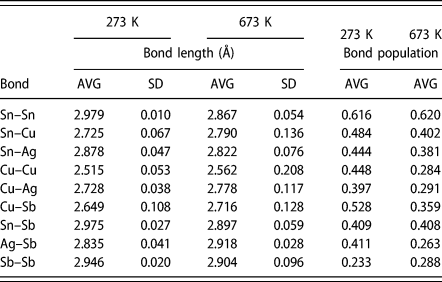
Figures 5(c) and 5(d) show the structures of Sn26Sb17Cu14Ag7 supercell after optimization and dynamic simulation at 673 K. The bond lengths and the bond numbers in these structures are shown in Table III and Fig. 2(c). This system contains the Sn–Sn, Sn–Sb, Sn–Cu, Sn–Ag, Cu–Cu, Cu–Ag, Cu–Sb, Ag–Sb, Ag–Ag, and Sb–Sb bonds. After optimization and dynamic simulation, the bond numbers of Sn–Sn, Sn–Cu, and Sn–Ag are not changed, but the corresponding bond lengths are all reduced. On the whole, increasing the temperature has little effect on the Sn–Sn, Sn–Cu, and Sn–Ag bonds.
Bond length and bond population of Sn26Sb17Cu14Ag7 alloy at different temperatures.
Note: average (AVG), standard deviation (SD).
In the optimized structure of Sn26Sb17Cu14Ag7, the number of Sn–Sb bonds, the average bond length, and standard deviation are 16, 2.975 Å, and 0.027 Å, respectively. After dynamic simulation at 673 K, the bond number and average bond length were reduced (9, 2.897 Å, and 0.059 Å, respectively). When the temperature rises to 673 K, the Sn–Sb bond in tin-based alloys is obviously affected. In the optimized structure of Sn26Sb17Cu14Ag7, the number of Sb–Sb bond is 5, and the average bond length is 2.976 Å with the standard deviation of 0.020 Å. At 673 K, these values changed to 4, 2.904 Å, and 0.096 Å. After optimization, the number of Ag–Sb bond, the average bond length, and standard deviation are 10, 2.935 Å, and 0.041 Å, respectively. After dynamic simulation at 673 K, the number of Ag–Sb bond is reduced to 6 (average bond length is 2.918 Å with standard deviation of 0.028 Å). An increased temperature weakens the Ag–Sb and Sn–Sb bonds.
After optimization, the number of Cu–Cu bond, the average bond length, and standard deviation are 6, 2.515 Å, and 0.053 Å, respectively. After dynamic simulation at 673 K, these values are 7, 2.562 Å, and 0.208 Å. For the Cu–Ag bond, these values changed from 6, 2.728 Å, and 0.038 Å after optimization to 9, 2.778 Å, and 0.117 Å after dynamical simulation. In the case of Cu–Sb bond, they changed from 10, 2.649 Å, and 0.108 Å to 17, 2.716 Å, and 0.128 Å. On the whole, the process of raising the temperature strengthens the bonding of Cu–Sb in the alloy.
The structural results of Sn26Sb17Cu14Ag7 suggest that the Cu–Sb bond in this system becomes more stable during the heating process, which will increase the fluidity to some extent because the Cu–Sb bonds have more features of metallicity when heated. At the same time, the Sn–Sb bonds are obviously weakened, which also promotes the mobility because these bonds have more features of covalent bonds. As a result, the mobility of the Sn26Sb17Cu14Ag7 system makes it a better lead-free solder, which is consistent with the test results [Reference Li27].
Average population
To further explore the bonding of Sn26Sb17Cu14Ag7 alloy, its Mulliken bond population was calculated and the results are shown in Table III. When temperature rises, bonds are formed between Sn–Cu, Sn–Ag, Cu–Cu, Cu–Ag, Cu–Sb, Sb–Ag, and Sb–Sb. The Sn–Sn bond evolves from metal bond to the mixed bond type that contains both nonlocalized metal bond and localized covalent bond.
When the temperature increases from 273 to 673 K, the average population of Sn–Sn bond increases from 0.616 to 0.620, whereas those of the Sn–Sb, Sn–Cu, Sn–Ag, Cu–Cu, Cu–Ag, Cu–Sb, and Sb–Ag bonds all decrease (0.409–0.408, 0.482–0.402, 0.444–0.381, 0.448–0.284, 0.397–0.291, 0.528–0.359, and 0.411–0.263, respectively). It shows that increasing the temperature to 673 K has a greater influence on the interactions between Sn–Ag, Cu–Cu, Cu–Ag, Cu–Sb, Sb–Ag, and Sn–Cu: the covalent interactions in these bonds tend to decrease at higher temperatures.
PDOS
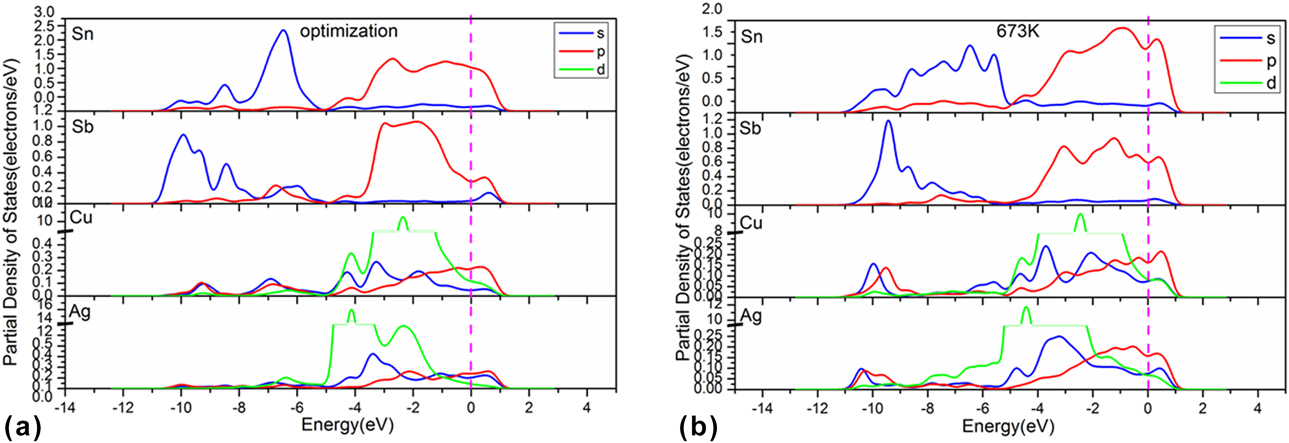
To further study the bonding of Sn–Sb–Cu–Ag alloys, its PDOS were calculated, and the results are shown in Fig. 7. As shown in Fig. 3(d), the PDOS of Ag64 are continuous at the Fermi level, suggesting a metallic state. There is a wide energy band from −6 to 1.6 eV, and its occupied energy width is about 7.6 eV. The PDOS of pure Ag have better continuity and metallicity than Cu.
The PDOS of Sn26Sb17Cu14Ag7 alloys at different temperatures. (a) Optimized structure of Sn26Sb17Cu14Ag7. (b) Sn26Sb17Cu14Ag7 after AIMD at 673 K.
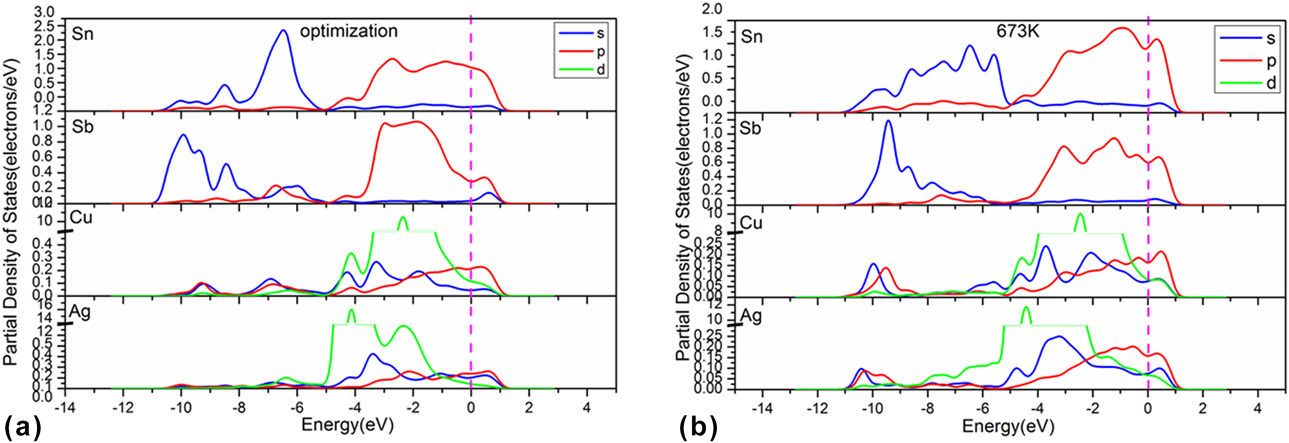
In Fig. 7, the energy space of the PDOS in Sn26Sb17Cu14Ag7 from −11 to 1.2 eV can be divided into two regions above and below −4 eV. There is a wide energy band near the Fermi level from −4 to 1.2 eV, and the width is about 5.2 eV. This energy band is mainly contributed by the Cu-4d orbit and the 5p orbits of Sn and Sb. The energy band between −11 and −4 eV is mainly composed of Sn-5s orbit and Sb-5s orbit, and the width of occupying energy is 7 eV. Comparing the PDOS of optimized Sn26Sb17Cu14Ag7 with Sn56Sb6Cu2, the metallic property in the former is more obvious.
The PDOS of Sn, Sb, Cu, and Ag in the Sn–Sb–Cu–Ag alloys show that this alloy system has more obvious metallic property when heated, because the s and p orbits of Sn and Sb tend to move to the left. The existence of Ag in Sn–Sb–Cu–Ag system decreases the strength of mainly covalent bonds like Sn–Sb and Sb–Ag, and stabilizes the mainly metallic bonds like Cu–Sb. So, adding Ag into the Sn–Sb–Cu system can improve the wettability of the alloy.
In addition, the addition of Cu and Ag will increase the melting point of the lead-free solder. The melting point of Sn–Sb alloys ranges from 508 to 533 K [Reference Li27], that of Sn–Sb–Cu system is raised to 510 to 543 K [Reference Li27], and that of Sn–Sb–Cu–Ag system is between 571 and 595 K [Reference Li27]. Among these three kinds of alloys, our calculation results show that the Sn–Sb alloy system possesses the strongest covalent interaction and the lowest melting point, whereas the Sn–Sb–Cu–Ag alloy system bears the weakest covalent interaction and the highest melting point. It seems the addition of Cu or Ag not only weakens the covalent bond of Sn–Sb to increase the fluidity of lead-free solder alloys, but also increases the melting point of these alloys. These changes are directly related to the change of covalent bonds in lead-free solder alloy systems with different compositions.
Conclusions
(1) Because the Sn–Sb bonds have mixed characters of nonlocalized metal bond and localized covalent bond, the bonding state of Sn–Sb alloy in the melted state is easily affected by the amount of Sb. When the content of Sb reaches 6.4%, the covalent bond between Sn and Sb is easy to break, so this alloy has better fluidity with increasing temperature than the other Sn–Sb alloys.
(2) After the addition of Cu, due to the interaction between the 3d, 4s, and 4p orbits of Cu and 5s and 5p orbits of Sn and Sb, the covalent bond between Sn–Sb is obviously weakened, which leads to higher fluidity of the Sn–Sb–Cu alloy after heating.
(3) Ag in the Sn–Sb–Cu–Ag system decreases the strength of mainly covalent bonds like Sn–Sb and Sb–Ag, and stabilizes the mainly metal bonds like Cu–Sb when the temperature increases. So, adding Ag into the Sn–Sb–Cu system can improve the wettability of the alloy.
(4) The low melting point of the Sn–Sb alloy is attributed to the easy destruction of the Sn–Sb covalent bond during heating, and the addition of elements such as Cu or Ag to the Sn–Sb alloy can not only improve the metallizing and wetting of the Sn–Sb-based alloy, but also can increase its melting point. These results are very consistent with existing experimental data.
Computational method
We used the Sn crystal (space group: Fd-3m, a = 6.489 Å, b = 6.489 Å, c = 6.489 Å; α = 90°, β = 90°, γ = 90°) [Reference Thewlis and Davey36] to build the supercell. Some Sn atoms in the supercell were replaced with Sb, Cu, or Ag to build the supercells of SnSb, SnSbCu, and SnSbCuAg. The DFT method was used to optimize the supercell to obtain the initial structure for AIMD calculation. The DFT calculations were performed using the program package CASTEP in the Materials Studio software [Reference Segall, Lindan, Probert, Pickard, Hasnip, Clark and Payne37]. The electronic exchange and correlation were described in the generalized gradient approximation (GGA) using the Perdew–Burke–Ernzerhof (PBE) functional [Reference Perdew, Burke and Ernzerhof38], and the plane wave basis cut off energy was set as 250 eV. Considering the computational cost and accuracy, the Brillouin sample mesh k-point was set at 2 × 2 × 2. The convergence criteria for geometry optimization and energy calculation were energy tolerance of 5.0 × 10⁻⁶ eV/atom, maximum force tolerance of 0.01 eV/Å, and maximum displacement tolerance of 0.005 Å. The AIMD simulations were conducted on the optimized supercell structures of SbSn, SbSnCu, and SbSnCuAg using the NVT ensemble at the temperature of 673 K, the time step of 1 femtosecond, and the simulation time of 2 ps. The Nosé thermostat was used to control temperature, with the Nosé Q ratio set to 1.0 and the wavefunction extrapolation scheme set 1st W. The energy calculations included the properties of the density of states, population, and electronic density.
Supplementary material
To view supplementary material for this article, please visit https://doi.org/10.1557/jmr.2019.137.
Acknowledgments
This work was supported by the National Key Research and Development Program of China (2016YFC0400404), Joint Foundation of the NSFC-Yunnan Province (U1502271), the Regional Foundation of the NSFC (51664032), the NSFC (51734006), the General Program of the NSFC (51474116), the Cultivating Plan Program for the Leader in Science and Technology of Yunnan Province (2014HA003), the Program for Nonferrous Metals Vacuum Metallurgy Innovation Team of Ministry of Science and Technology (2014RA4018), Science and Technology Talent Cultivation Plan of Yunnan Province, China (2017HB009), and the Program for Innovative Research Team in University from the Ministry of Education of China (IRT_17R4 8).