Since their beginning in the 1930s, election polls have remained a controversial topic. The inherent difficulties in evaluating the adequacy of survey designs combined with the media’s tendency to oversimplify complex matters can lead to highly problematic reporting of election polls—especially because polls published shortly before Election Day have been shown to influence voting behavior (Moy and Rinke Reference Moy, Rinke, Holtz-Bacha and Strömbäck2012).
A recent example of controversial election reporting was the 2016 US presidential election. After the election, forecasters were criticized harshly (Siegel Reference Siegel2016). In addition to methodological shortcomings, a major issue was that even FiveThirtyEight’s (2016) 71.4% winning chance of Hillary Clinton was widely perceived as (virtually) certain. This controversy can be attributed primarily to inadequate communication of the uncertainty behind opinion polls and forecasts catering to prevalent statistical (il)literacy.
In general, election-poll reports struggle with striking a balance between communicating the observed situation in simple terms while keeping the consumer aware of the underlying (un)certainty in its entire complexity. This issue is even more pronounced in multiparty systems with coalition governments such as Germany.
In general, election-poll reports struggle with striking a balance between communicating the observed situation in simple terms while keeping the consumer aware of the underlying (un)certainty in its entire complexity.
This article showcases the most common pitfalls when communicating election-poll results and presents alternative ways to approach them in a statistically adequate way. We recommend the use of Probabilities of Events (PoEs), which are particularly well suited to concisely describe complex situations, especially in multiparty systems. Selected visualizations are presented on koala.stat.uni-muenchen.de for German election polls. Similar providers in Germany include zweitstimme.org and www.wer-gewinnt-die-wahl.de.
The next section briefly introduces the basic concepts of election-poll reporting and potential sources of bias. The subsequent section shows current examples of how election polls are reported. Alternatives are proposed and discussed in the final two sections.
ELECTION-POLL REPORTING—UNCERTAINTIES AND BIASES
An ideal election poll would represent a simple random sample of all eligible voters in which each sampled person answers truthfully. In practice, this is never the case, and different strategies are used for handling nonresponse and incorrect answers. Different survey designs exist for opinion polling, the most prominent being telephone interviews, classical face-to-face interviews, and online surveys. Each design has benefits but also unique drawbacks that must be accounted for.
Election polling is shaped by diverse sources of error that transfer to subsequent analyses. In this context, it is important to differentiate between nowcasting (i.e., the description of the current electoral mood) and forecasting (i.e., the prediction of the next election result). Nowcasting is affected by errors in sampling design and/or individuals’ response behavior. (Sampling-based) forecasting underlies the same problems, with additional uncertainty about how the current situation will evolve until Election Day.
Nowcasting Errors
The issues with nowcasting are similar to those with survey sampling. Based on the concept of total survey error (Biemer Reference Biemer2010), we distinguish between sampling error and non-sampling error. When uncertainties are specified, it is common practice to provide ranges based only on sampling error. However, this neglects non-sampling errors, which in particular include non-specification errors, nonresponse, coverage errors, and measurement errors. Non-sampling errors are related structurally to the survey type and method. For example, in a landline-based telephone survey, people without a landline cannot be reached. If the accessibility of the interviewees is related to their voting decision, such problems inevitably lead to biases.
Extensive literature exists on correcting biases caused by nonresponse and the lack of coverage. The most common methods are poststratification and weighting methods. In the case of nowcasting, it is common practice (in Germany) to report weighted results instead of raw values (wahlrecht.de 2021). The main assumption behind these procedures is that sampling biases in the variables of interest can be attributed to biases in the characteristics used for weighting. If important characteristics were not recorded in the survey, biases can be corrected only inadequately. Moreover, the relationship among the weighting variables must be properly taken into account, including possible interactions. Another limitation is the potential lack of necessary information about the weighting variables in the population.
In addition to survey-design problems, other biases may arise from response behavior, given that most nowcasting surveys are interviews in which participants may (un)consciously make false statements or refuse to answer. The implication for data quality is difficult to assess because it relies on knowledge about the relationship between participation in the survey and the characteristic of interest. Undecided voters pose another problem, especially if the undecidedness is associated with party preference, which leads to an underrepresentation of voters with specific political preferences. Whereas weighting might be a possible way to cope with these issues, subsequent conceptual problems may lead to further errors if correction is inadequate.
Given the inherent limitations of election polling, it is apparent that every survey is affected by one or more of these problems. Assessing their magnitude is difficult because the “truth” is unknown at the time of the nowcast.
Forecasting Errors
Forecasting of election results is performed using different methods. Established methods include model-based forecasts that take economic developments or expert knowledge into account. We focus on survey-based forecasting, which can be seen as an extrapolation of a nowcast into the future—that is, for Election Day. Although all previously mentioned problems with nowcasting also apply to forecasts (with some restrictions), further problems arise from attempting to predict the future. In contrast to nowcasts, forecasts can be evaluated using previous elections.
The main issue with forecasting is the transferability of results from the present to the future (Gelman et al. Reference Gelman, Hullman, Wlezien and Morris2020). Individual polls may be shaped by events that affect the political mood only in the short term. Furthermore, it is impossible to account for potential future events that may (strongly) influence electoral behavior. A prominent example of this is the letter from James Comey (Silver Reference Silver2017), published shortly before the 2016 US presidential election. Most forecasters had already made their call and therefore could not include the letter’s impact in their predictions.
Whereas describing potential errors in a forecast is possible, quantifying the resulting uncertainty remains a major difficulty. Methods that account for uncertainty about future events comprise an area of active research.
PRESENTATION OF NOWCASTS AND FORECASTS
The current standard of reporting opinion-poll results in (German) media is shown in figure 1 (left pane), in which a bar chart depicts the reported party shares of one poll. This way of visualization inherently ignores uncertainty. Moreover, the underlying uncertainty often is communicated only in the accompanying text, separated from the visual presentation, which hinders its proper perception. These reports then frequently are accompanied by oversimplifying headlines such as, “No Majority for the Grand Coalition” (FAZ 2018, authors’ translation), which completely disregards uncertainty. Especially complex matters such as seat majorities in parliament often are inadequately visualized in the media. For example, the visualization in the right pane of figure 1 neglects relevant characteristics of the German election system (i.e., parties with less than 5% voter share are not represented in parliament).
Bar Plot of Reported Party Shares (Left Pane) and FAZ Visualization for Whether CDU/CSU and SPD Jointly Reach a Majority in Parliament (Right Pane; Source: FAZ 2018)

Additionally, reports on changes in current nowcasts tend to be problematic. Often, only very minor differences in party shares—clearly within the expected range of uncertainty—are overinterpreted. Statements such as “[the party] SPD fell by half a percentage point to 17 percent” (FAZ 2018) without simultaneously highlighting uncertainty are misleading. Moreover, such developments over time rarely are communicated visually (i.e., time-series visualization).
A general problem for the media is that the average voter is not well educated regarding the assessment of uncertainties. Graefe (Reference Graefe2021) provides empirical evidence indicating that German voters struggle to derive key information from election polls as they currently are presented. Providing the sampling error did not improve the participants’ assessment. Furthermore, the participants generally overestimated a party’s chance of being represented in parliament when it polled below the 5% threshold.
Additionally, media reports often fail to differentiate between nowcasting and forecasting, using similar verbalizations for both. The previously mentioned additional sources of uncertainty or biases regarding forecasts are especially rarely pointed out.
STATE-OF-THE-ART CONCEPTS FOR VISUAL PRESENTATION
This section presents several conceptual ideas for alternative communication of surveys. The central difficulty is to create visualizations that explicitly incorporate uncertainty but that also can be understood easily by a layperson.
Probabilities of Events and Uncertainties
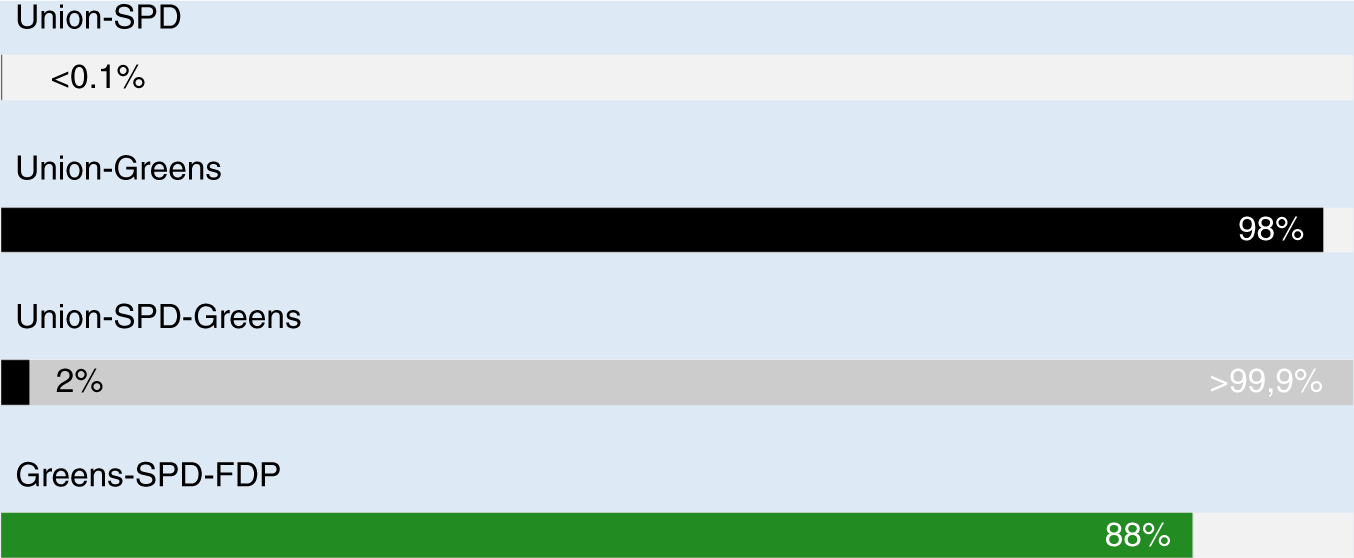
One approach for improving the presentation of survey results is to shift the focus away from party shares. In many multiparty systems, single-party governments are improbable and coalitions are of more interest. Also, specific regulations that complicate any direct evaluation are common. For example, the 5% threshold in Germany adds uncertainty about whether a party is even represented in parliament. Useful alternative metrics are so-called PoEs that can be estimated, for example, using Bayesian methods (Bauer et al. Reference Bauer, Bender, Klima and Küchenhoff2020; Bender and Bauer Reference Bender and Bauer2018). PoEs indicate the probability of a certain event of interest—for example, based on a current poll and its underlying uncertainty, that a specific coalition will obtain a majority. Whereas standard reporting of election polls ignores uncertainty and the complex relationships that lead to a majority (e.g., the number of redistributed votes and the closeness to the 5% threshold), PoEs contain information about both the likelihood and the uncertainty of an event and condense this information into single numbers.
PoEs contain information about both the likelihood and the uncertainty of an event and condense this information into single numbers.
Figure 2 shows an application of PoEs, each bar representing the probability for one specific coalition reaching a majority. Events for which the coalition is possible but not necessary (because a subset of the parties already reaches majority) are highlighted in light gray. In contrast, events for which the whole coalition is necessary to reach a majority are highlighted in the color of the party with the highest share.
PoEs (Nowcast) for Selected Coalitions in Germany Based on One Survey
Notes: The colors represent the strongest party within each coalition. The probability of a subset of parties already achieving a majority is represented in light gray.

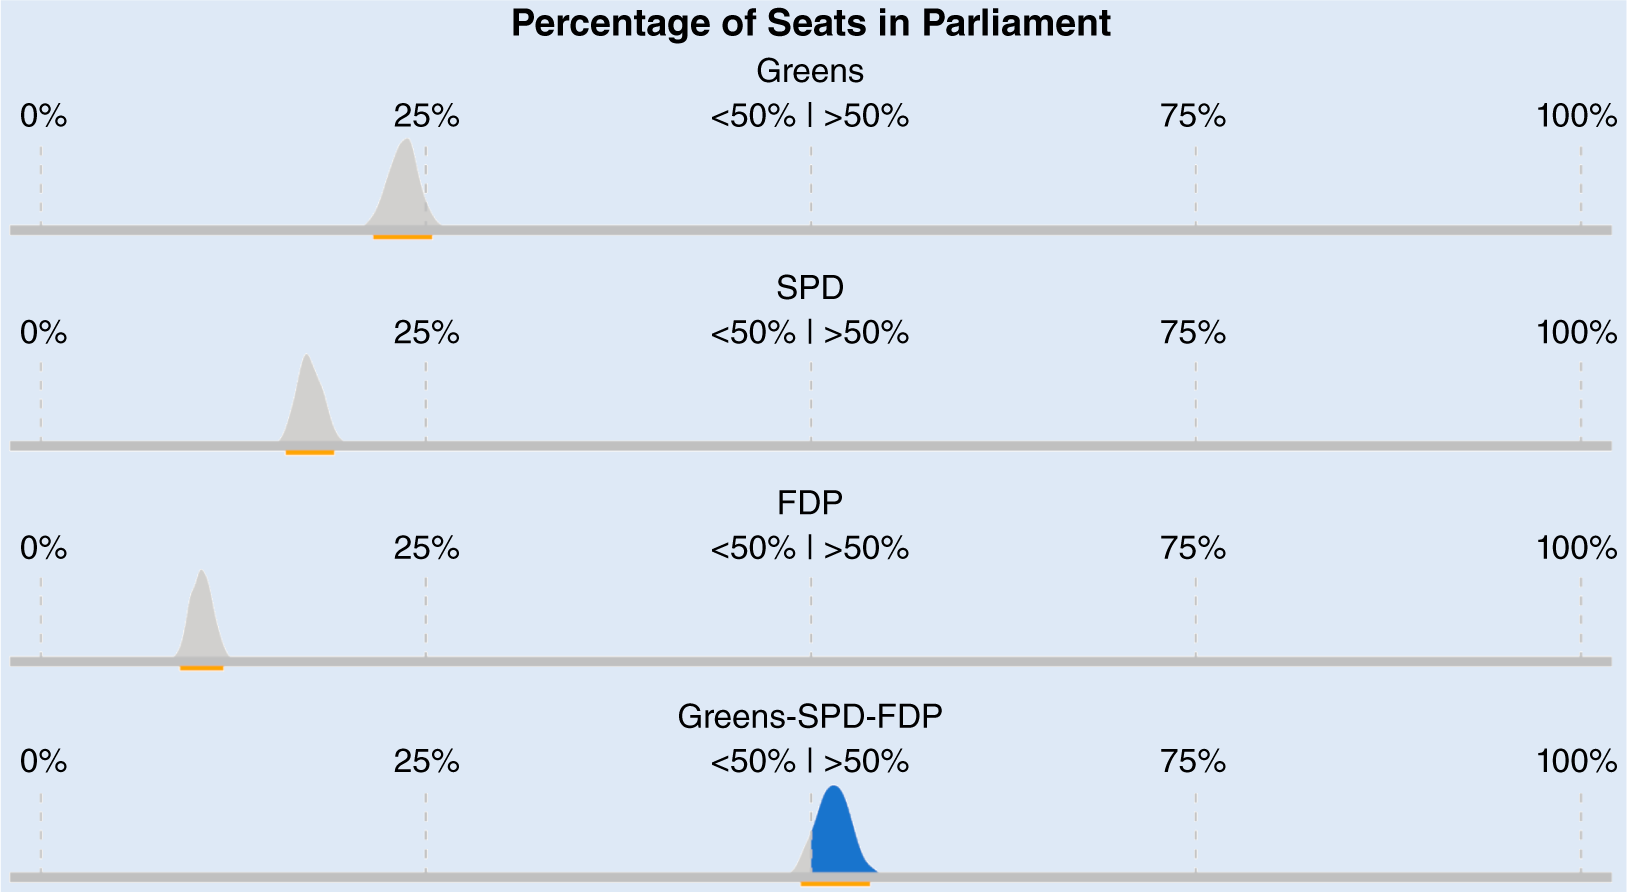
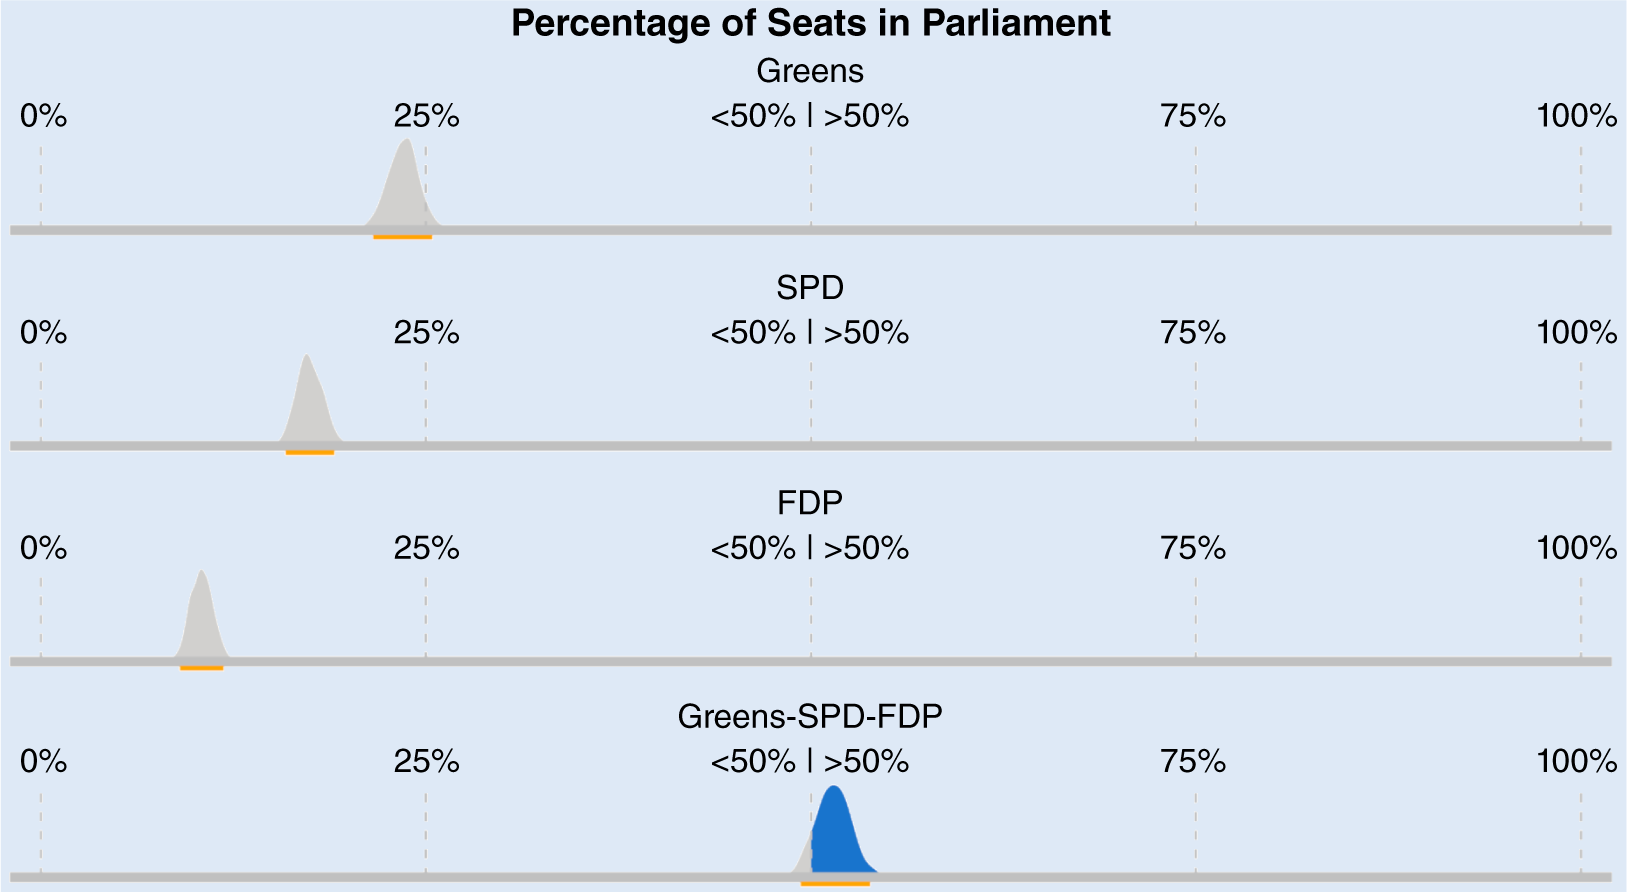
Figure 3 presents the uncertainty in a simpler manner by showing the distribution of expected (joint) seats for selected parties in parliament. Instead of PoEs, the concrete seat shares are shown for each event of interest. This properly visualizes the uncertainty in more complex situations—for example, when one of the considered parties is at risk of not passing the threshold. The area representing the occurrence of the event then can be color-coded, which enables the simultaneous representation of PoEs.
Distribution of the Expected Seat Shares (Nowcast) for a Selected Coalition in Germany
Note: The blue areas of the distributions represent a reached majority; the orange bar represents the 95% confidence region.
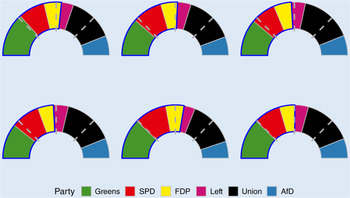
The most natural way to visualize uncertainty when communicating surveys is to show multiple possible outcomes. Figure 4 shows six realizations of seat shares in the German parliament, sampled based on one survey. The parties are arranged so that the coalition of interest and whether it could reach a majority can be inferred easily. The larger the number of realizations, the easier it is to grasp the overall uncertainty. Accordingly, a tradeoff must be made between accessibility and adequate uncertainty mapping.
Nowcast-Based Potential Parliaments in Germany
Notes: Parties are color-coded and grouped to ease the assessment of a joint Green Party–SPD–FDP majority. The gray dashed lines represent the quartiles.

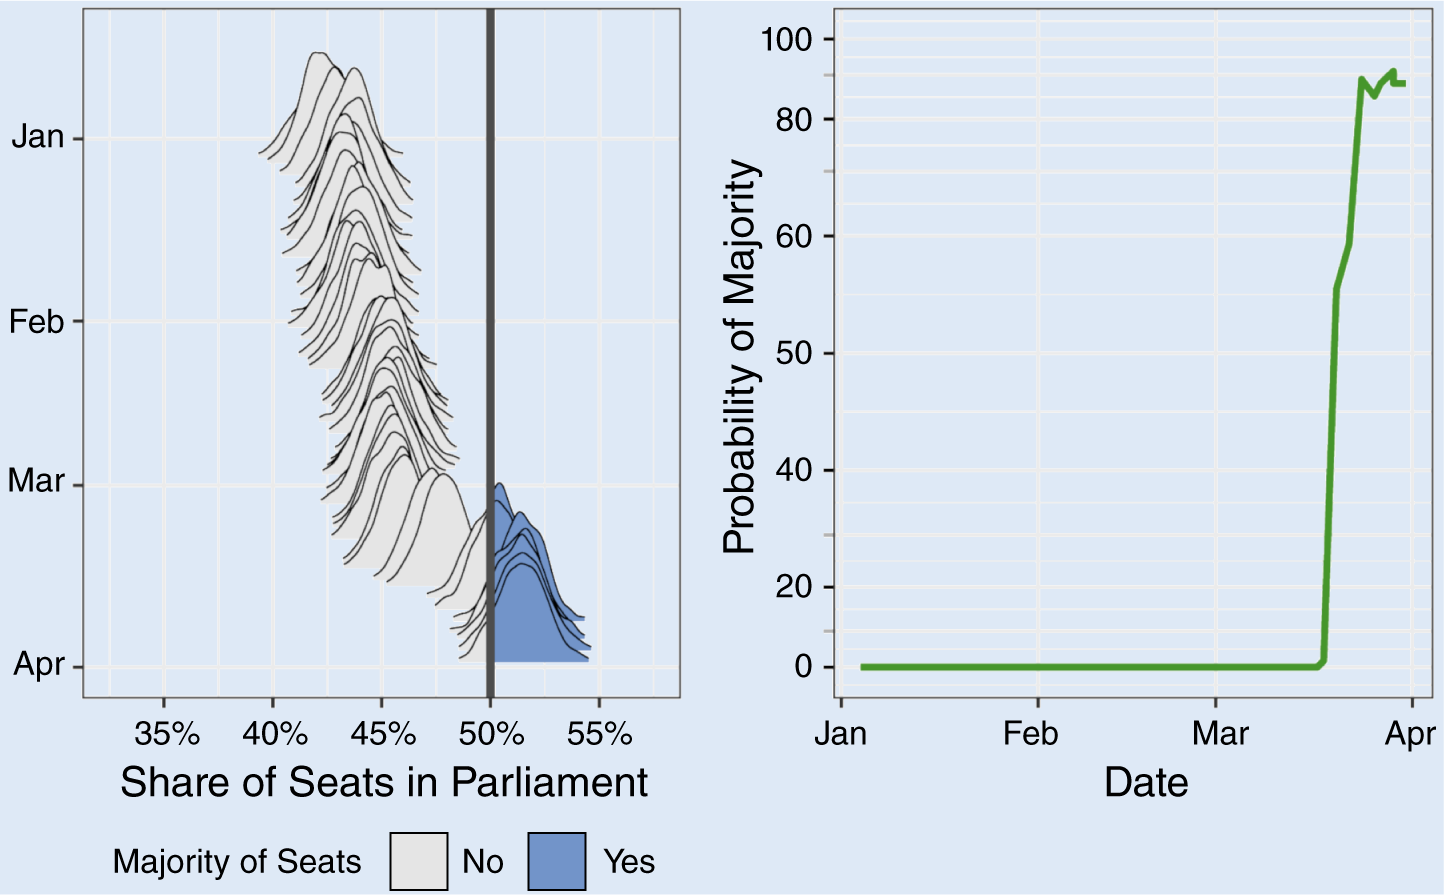
An extension of figure 3 are so-called ridgeline plots (Bauer et al. Reference Bauer, Bender, Klima and Küchenhoff2020), which simultaneously visualize the surveys’ uncertainties and the development over time (see figure 5, left pane). For each survey, the distribution of expected seats is shown. The y-axis represents time, with more recent polls positioned closer to the bottom. In addition to visualizing sampling uncertainty, ridgeline plots depict the variation over time with its implied uncertainty.
Nowcast of Expected Seat Shares for a Green Party–SPD–FDP Coalition (Ridgeline Plot, Left Pane) and PoEs over Time for the Coalition’s Majority (Right Pane, with a Nonlinear Y-Axis)
Note: Blue areas in the left pane mark reached majorities; the solid black line is 50%.

These ideas are a more adequate representation of uncertainty than the typical focus on party shares. Corresponding ideas are not new and were used, for example, by FiveThirtyEight (2016) in the context of the 2016 and 2020 US elections. We generally recommend multiple types of visualizations and using their different focal points as an active element of communication. For example, we use the right pane of figure 5 to highlight the PoEs over time as one key aspect of the ridgeline plot.
Forecast Visualizations
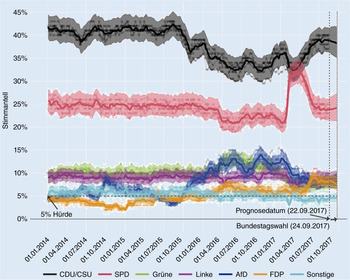
The focus of forecasts requires further adjustments to visualize the additional uncertainty (Gelman et al. Reference Gelman, Hullman, Wlezien and Morris2020). A possible extension of the classic survey presentation for a forecast model is shown in figure 6. The graph is similar to the typical survey presentation but also includes the surveys’ uncertainty in the form of an uncertainty area. The visualization also highlights the gap between the current day and Election Day. The increasing uncertainty about the outcome is visualized by a broadening uncertainty area. A comparable representation with a focus on PoEs, avoiding the limitation of focusing on the individual party shares, is easily possible.
INWT Statistics’ Forecast for the German Federal Election 2017 (Date of Forecast August 21, 2017)
Notes: The current day is marked by a vertical line and Election Day represents the end of the x-axis. Each party is color-coded; confidence regions are depicted by colored areas; and the dots represent individual surveys.
Source: Hendrich Reference Hendrich2017.

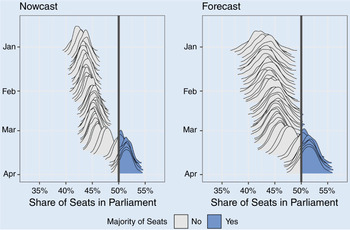
Another possibility for visualizing forecasts is shown schematically in figure 7. It is based on the previously presented ridgeline plot. The left pane depicts the nowcasts already presented in figure 5 and the right pane shows the forecasts based on the respective nowcasts. Here, larger uncertainty is expressed by a wider distribution, and the uncertainty increases with greater distance to Election Day. The direct comparison of nowcast and forecast then visualizes the increased uncertainty.
Nowcast (Left Pane) and Forecast (Right Pane) for a Majority of a Green Party–SPD–FDP Coalition in Germany Using Ridgeline Plots
Notes: The blue areas in the left pane indicate reached majorities; the solid black line is 50%. This is a schematic representation; the forecast is not based on an actual forecast model.

However, both approaches share a fundamental problem: the assumption that uncertainty can be estimated adequately. Unknown future events are especially a problem in determining this uncertainty. However, despite this limitation, both approaches are generally suitable to communicate an increase in uncertainty.
DISCUSSION
To summarize, many established ways of presenting opinion polls often reflect uncertainty only inadequately. Uncertainty is explained (if at all) in a rather technical way and often is separated from the main information. Whereas some providers in the United States are working actively on this communication problem (e.g., Gelman et al. Reference Gelman, Hullman, Wlezien and Morris2020), the same effort is not observed in Germany. This presentation issue is aggravated by the fact that the public’s understanding of probabilities is still insufficient.
In our opinion, the presentation of uncertainty too often focuses on sampling uncertainty alone. Whether for nowcasting or forecasting, an election survey is subject to multiple sources of uncertainty, and sampling uncertainty represents them only inadequately. A discussion of the sources of uncertainty and their implications is imperative because only then can they be properly considered in visual communication.
Although further research is needed on the perception of the discussed graphics and the associated probabilities to find ideal ways of communication, the difficulties observed in the current understanding of (event) probabilities cannot be an argument against their use.
One way to improve communication is to shift the focus from individual parties to relevant events. PoEs represent complex issues in one metric, with associated benefits in visual communication. We recommend not simultaneously reporting on all events. It often is reasonable to make a preselection based on the scope of a report and to consider only realistic events. Furthermore, because the general public struggles with understanding probabilities, PoEs should not be used exclusively but rather in conjunction with other representations. We suggest densities of seat distributions and ridgeline plots based on them. These graphical concepts also are usable when PoEs further account for non-sampling errors. Together, they enable better communication of uncertainties without being overly complex individually.
The established ways of communicating election surveys mostly do not do justice to the problem. Although further research is needed on the perception of the discussed graphics and the associated probabilities to find ideal ways of communication, the difficulties observed in the current understanding of (event) probabilities cannot be an argument against their use.
ACKNOWLEDGMENTS
We thank the reviewers for their constructive feedback.