INTRODUCTION
Attention deficit hyperactivity disorder (ADHD) is one of the most common disorders of childhood, affecting 3–10% of school-age children (Goldman et al. Reference Goldman, Genel, Bezman and Slanetz1998; Burd et al. Reference Burd, Klug, Coumbe and Kerbeshian2003; Faraone et al. Reference Faraone, Monuteaux, Biederman, Cohan and Mick2003; Ford et al. Reference Ford, Goodman and Meltzer2003). It is characterized by age-inappropriate levels of inattention, impulsivity and overactivity. Family studies demonstrate that ADHD runs in families (Cantwell, Reference Cantwell1975; Faraone et al. Reference Faraone, Biederman, Mennin, Russell and Tsuang1998) and twin studies indicate an average heritability around 76% (Faraone et al. Reference Faraone, Perlis, Doyle, Smoller, Goralnick, Holmgren and Sklar2005). Molecular genetic studies implicate several genes in ADHD, with the strongest evidence to date emerging for the dopamine D4 (DRD4) and D5 (DRD5) receptor genes (Li et al. Reference Li, Sham, Owen and He2006). Cognitive studies, as well as functional studies using electrophysiology and brain imaging, converge in suggesting that a deficit specific to a hypothesized ‘core’ cognitive function in ADHD has been difficult to demonstrate (Kuntsi et al. Reference Kuntsi, McLoughlin and Asherson2006a). In cognitive studies that have used careful control conditions, children with ADHD often perform poorly across both experimental and control conditions on tasks measuring abilities such as sustained attention, selective attention and inhibition (e.g. Mason et al. Reference Mason, Humphreys and Kent2003, Reference Nigg2005; Berwid et al. Reference Berwid, Curko Kera, Marks, Santra, Bender and Halperin2005; Drechsler et al. Reference Drechsler, Brandeis, Foldenyi, Imhof and Steinhausen2005).
However, one aspect of task performance emerges that is consistently and strongly associated with ADHD. Across a variety of tasks, individuals with ADHD show high intra-individual variability (IV), particularly reaction time (RT) variability (see Castellanos & Tannock, Reference Castellanos and Tannock2002; Nigg, Reference Nigg2005). Leth-Steensen et al. (Reference Leth-Steensen, King Elbaz and Douglas2000) demonstrated how a greater proportion of abnormally slow responses, mixed with fast responses on some trials, led to the inconsistent pattern of responding in ADHD. A recent psychometric analysis further indicated how, across several cognitive tasks, measures of IV best distinguished individuals with ADHD from a control group, with limited incremental validity of measures of central tendency and errors (Klein et al. Reference Klein, Wendling, Huetter and Peper2006). Principal components analyses suggested that IV might reflect a unitary construct (Klein et al. Reference Klein, Wendling, Huetter and Peper2006). The theoretical underpinnings of IV in ADHD continue to be debated: proposed underlying causes include a temporal processing deficit (Castellanos & Tannock, Reference Castellanos and Tannock2002), a deficit in the ability to appropriately modulate very low-frequency fluctuations in neuronal activity (Castellanos et al. Reference Castellanos, Sonuga-Barke, Scheres, Di Martino, Hyde and Walters2005), inefficiency in the deployment of attention by executive control processes (Bellgrove et al. Reference Bellgrove, Hawi, Kirley, Fitzgerald, Gill and Robertson2005b) or a deficit of sustained attention (Heinrich et al. Reference Heinrich, Moll, Dickhaus, Kolev, Yordanova and Rothenberger2001), and difficulties with the regulation of energetic state (Borger & van der Meere, Reference Borger and van der Meere2000; Kuntsi et al. Reference Kuntsi, Oosterlaan and Stevenson2001; Scheres et al. Reference Scheres, Oosterlaan and Sergeant2001; Banaschewski et al. Reference Banaschewski, Brandeis, Heinrich, Albrecht, Brunner and Rothenberger2003). The state regulation hypothesis is suggested by the finding that manipulations with factors such as event rate (the presentation rate of stimuli; for reviews see Sergeant, Reference Sergeant2000; van der Meere, Reference van der Meere and Sandberg2002; Sergeant, Reference Sergeant, Geurts, Huijbregts, Scheres and Oosterlaan2003) or rewards (Konrad et al. Reference Konrad, Gauggel, Manz and Scholl2000; Slusarek et al. Reference Slusarek, Velling, Bunk and Eggers2001) can substantially improve the performance of children with ADHD, in some cases to the level of controls; cognitive ‘deficits’ or excessive variability appear in tasks or conditions that fail to optimize the child's energetic (arousal/activation/effort) state. Focusing on ADHD symptom scores in a general population sample, an association similarly emerged between RT variability and teacher-rated ADHD symptom scores in the baseline condition, but not in the fast-incentive condition of the ‘Fast Task’ (although there was no association with parent ratings; Kuntsi et al. Reference Kuntsi, Andreou, Ma, Borger and van der Meere2005).
A recent population twin study demonstrated a moderate degree of heritability for mean RT (MRT) and RT variability on tasks used in ADHD research, including the ‘Fast Task’ (Kuntsi et al. Reference Kuntsi, McLoughlin and Asherson2006b). Preliminary evidence also suggests that RT variability may indicate an intermediate phenotype (‘endophenotype’) (Gottesman & Shields, Reference Gottesman and Shields1973; Gottesman & Gould, Reference Gottesman and Gould2003) between genes and the behavioural symptoms of ADHD. An initial twin study suggested shared genetic influences on RT variability and ADHD symptoms (Kuntsi & Stevenson, Reference Kuntsi and Stevenson2001) and a subsequent family study similarly indicated shared familial effects (Nigg et al. Reference Nigg, Blaskey, Stawicki and Sachek2004). Here we extend these preliminary investigations by examining speed and variability of RT performance under two experimental conditions in a large, international sample of ADHD and control sibling pairs. We tested the hypotheses that (1) ADHD is associated with slow and variable RTs, (2) a faster event rate and incentives lead to greater improvement in RT performance in children with ADHD compared to controls, and (3) there are shared familial effects on RT performance and ADHD.
METHOD
Samples
ADHD sample
As part of the International Multi-centre ADHD Gene (IMAGE) project (see Brookes et al. Reference Brookes, Xu, Chen, Zhou, Neale, Lowe, Anney, Franke, Gill, Ebstein, Buitelaar, Sham, Campbell, Knight, Andreou, Altink, Arnold, Boer, Buschgens, Butler, Christiansen, Feldman, Fleischman, Fliers, Howe-Forbes, Goldfarb, Heise, Gabriels, Korn-Lubetzki, Johansson, Marco, Medad, Minderaa, Mulas, Muller, Mulligan, Rabin, Rommelse, Sethna, Sorohan, Uebel, Psychogiou, Weeks, Barrett, Craig, Banaschewski, Sonuga-Barke, Eisenberg, Kuntsi, Manor, McGuffin, Miranda, Oades, Plomin, Roeyers, Rothenberger, Sergeant, Steinhausen, Taylor, Thompson, Faraone and Asherson2006), European Caucasian subjects were recruited from six specialist clinics in five countries: Belgium, Germany, Israel, Switzerland and the UK. Children entering the IMAGE project were invited to take part in further studies of cognitive performance. Ethical approval was obtained from National Institute of Health registered ethical review boards for each centre. Entry criteria for this study were a research diagnosis of DSM-IV combined-type ADHD (see below) and having one or more full siblings available for ascertainment of clinical information and DNA collection. Probands and siblings were aged 6–18 years at the time of entry into the study. Exclusion criteria applying to both probands and siblings included autism, epilepsy, IQ<70, brain disorders and any genetic or medical disorder that might mimic ADHD.
The Fast Task was administered to 147 ADHD probands and 125 of their nearest-age siblings who fulfilled the study criteria and agreed to take part. Three ADHD probands were excluded because of technical problems with the portable laptops during task administration, resulting in a final dataset of 144 DSM-IV ADHD combined-type probands and 125 of their nearest-age siblings. Fourteen siblings also received a research diagnosis of combined-type ADHD. Five sibling pairs included a third sibling and one included a fourth sibling so that the sample included 119 family clusters and 25 singletons.
Control sample
The control group was recruited from primary (ages 6–11 years) and secondary (ages 12–18 years) schools in London (UK) and Goettingen (Germany). Approval was obtained from local ethical review boards. The same exclusion criteria were applied as for the clinical sample. The Fast Task was administered to 68 children. One child did not provide IQ data and seven children were subsequently excluded because of technical problems with the portable laptops during task administration. The final control sample consisted of 60 children (22 family clusters and 15 singletons).
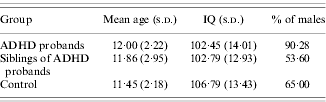
ADHD probands differed significantly from the control group on sex [χ2(1)=19·63, p<0·001] and IQ [t(201)=−2·00, p=0·05] but not on age [t(201)=1·66, p=0·10) (Table 1). Additional phenotypic analyses were carried out controlling for IQ and on a male-only subsample.
Mean age (in years), IQ and percentage of males in each group
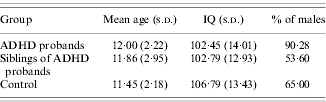
IQ, Intelligence quotient; ADHD, attention deficit hyperactivity disorder; s.d., standard deviation.
Procedure
Clinical families were invited to the research centre for the cognitive assessments and for the parent interview. A minimum of a 48-h medication-free period was required for cognitive testing. The assessments of the control families were carried out in separate rooms either at the research centre or in schools. The Fast Task was administered as part of an extended test battery and occurred in the middle of the session. Children were given short breaks as required and the total length of the test sessions, including breaks, was approximately 2·5–3 h.
Measures
Parental Account of Childhood Symptoms (PACS)
PACS is a semi-structured, standardized, investigator-based interview developed as an instrument to provide an objective measure of child behaviour (Taylor et al. Reference Taylor, Everitt, Thorley, Schachar, Rutter and Wieselberg1986a, Reference Taylor, Schachar, Thorley and Wieselbergb, Reference Taylor, Schachar, Thorley, Wieselberg, Everitt and Rutter1987). A trained interviewer administers PACS with parents, who are asked for detailed descriptions of the child's typical behaviour in a range of specified situations. Interviewers make ratings on the basis of formal training and written definitions of the behaviours to be rated, using a four-point scale of severity and frequency in the previous week and previous year. Inter-rater reliability is high with product–moment correlations for pairs of interviewers ranging from 0·79 to 0·96 (Taylor et al. Reference Taylor, Everitt, Thorley, Schachar, Rutter and Wieselberg1986b). PACS was administered to all probands from the clinical sample as well as siblings with known or suspected ADHD from parent descriptions of their behaviour.
Rating scales
Rating scales used to quantify ADHD symptoms included the Long Version of Conners' Parent Rating Scale (CPRS-R:L; Conners et al. Reference Conners, Sitarenios, Parker and Epstein1998a) and the Long Version of Conners' Teacher Rating Scale (CTRS-R:L; Conners et al. Reference Conners, Sitarenios, Parker and Epstein1998b).
To exclude autism spectrum disorder both probands and siblings were screened using the Social Communication Questionnaire (⩾15) in conjunction with the pro-social scale from the Strengths and Difficulties Questionnaire (⩽4) (SDQ) (Goodman, Reference Goodman1997; Rothenberger & Woerner, Reference Rothenberger and Woerner2004). Individuals falling above these thresholds were further evaluated using the autism spectrum disorder section of the PACS interview.
Research criteria for DSM-IV combined-type ADHD (APA, 1994)
A standardized algorithm was applied to PACS items to derive each of the 18 DSM-IV ADHD items, providing operational definitions for each behavioural symptom. These were combined with items that scored 2 or 3 from the teacher-rated Conners' ADHD subscale to generate the total number of items from the DSM-IV symptom checklist. Situational pervasiveness was defined as some symptoms occurring within two or more different situations from the PACS interview, or the presence of one or more symptoms scoring 2 or more from the ADHD subscale of the teacher-rated Conners'. Referrals were for combined-type ADHD. If the PACS diagnosis did not agree with this, the individual was removed from the analysis. This happened in approximately 10% of cases.
Wechsler Intelligence Scales for Children (WISC-III) (Wechsler, Reference Wechsler1991; Tewes et al. Reference Tewes, Rossmann and Schallenberger1999; Bleichrodt et al. Reference Bleichrodt, Bosmans, Compaan, Kort, Resing, Schittekatte, Verhaeghe and Vermeir2002) and Adults (WAIS-III) (Wechsler, Reference Wechsler1997)
The vocabulary, similarities, picture completion and block design subtests from the WISC/WAIS were used to obtain an estimate of the child's IQ (pro-rated following procedures described by Sattler, Reference Sattler1992).
The Fast Task (Kuntsi et al. Reference Kuntsi, Andreou, Ma, Borger and van der Meere2005)
The baseline condition followed a standard warned four-choice RT task, as outlined in Leth-Steensen et al. (Reference Leth-Steensen, King Elbaz and Douglas2000). A warning signal (four empty circles, arranged side by side) first appeared on the screen. At the end of the fore-period (presentation interval for the warning signal), the circle designated as the target signal for that trial was filled (coloured) in. The child was asked to make a compatible choice by pressing the response key that directly corresponded in position to the location of the target stimulus. Following a response, the stimuli disappeared from the screen and a fixed inter-trial interval of 2·5 s followed. Speed and accuracy were emphasized equally. If the child did not respond within 10 s, the trial terminated.
First, a practice session was administered, during which the child had to respond correctly to five consecutive trials. The baseline condition, with a fore-period of 8 s and consisting of 72 trials, then followed.
To investigate the extent to which a response style characterized by slow and variable speed of responding can be maximally reduced, the task includes a comparison condition that uses a fast event rate (fore-period of 1 s) and incentives. This condition started immediately after the baseline condition and consisted of 80 trials (following the faster event rate conditions in Leth-Steensen et al. Reference Leth-Steensen, King Elbaz and Douglas2000) and a fixed inter-trial interval of 2·5 s. Speed and accuracy were emphasized equally. The children were told to respond really quickly one after another, to win smiley faces and earn real prizes in the end. The children won a smiley face for responding faster than their own MRT during the baseline (first) condition consecutively for three trials. The baseline MRT was calculated here based on the middle 94% of responses (the exclusion of the top and bottom 3% of responses is only used when calculating a baseline mean RT for the set-up of the fast-incentive condition, and is not used for analyses), therefore excluding extremely fast and extremely slow responses. The smiley faces appeared below the circles in the middle of the screen and were updated continuously.
The response variables are MRT and standard deviation of the RTs (s.d. of RTs; RT variability), calculated for each condition based on correct responses only. We also calculated an additional index of IV, the coefficient of variation (CV: s.d. of RTs/MRT). Whereas the conceptual appropriateness of such ‘controlling’ for MRT differences when analysing IV in ADHD is questionable (see Discussion), it has nonetheless been suggested that the CV is considered as an additional measure (Klein et al. Reference Klein, Wendling, Huetter and Peper2006). For analyses that compare performance across the baseline and fast-incentive conditions, data from 30 trials of the baseline condition are used, to provide a match on length of time on task with the fast-incentive condition. The second set of 30 trials are used for this, as data from a twin project suggest greater reliability and heritability for the second than first set of 30 trials (Kuntsi & Asherson, unpublished data), which is likely to reflect an initial learning phase during the first part of the baseline condition. The fast-incentive condition is always administered after the baseline condition and, as such, does not involve a similar learning phase. The children earned small prizes (vouchers and stationery) after the task battery.
Analyses
Phenotypic analyses were conducted using Stata Statistical Software release 9.2 (Stata Corporation, College Station, TX, USA). All variables were significantly skewed and were transformed to normalize the distributions. The cluster command was used in phenotypic analyses of ADHD–control differences to remove any effects of familial clustering. All sibling correlations and their respective confidence intervals were calculated using Mx (Neale, Reference Neale1997). Bivariate sibling correlations were estimated using maximum likelihood procedures.
Phenotypic and bivariate sibling correlations
This approach was based on the DeFries–Fulker (DF) extremes analysis of twin data (DeFries & Fulker, Reference DeFries and Fulker1985, Reference DeFries and Fulker1988). Bivariate sibling correlations are estimated from group means and are sometimes referred to as ‘group correlations’. See Appendix 2 for more detailed discussion and Appendix 3 for a list of terms and definitions.
Equation (A1) (Appendix 1)
To generate a phenotypic correlation (bivariate group within-subject correlation) between our selection variable (ADHD) and a secondary variable (variable 2), we consider only the mean values of the two variables in ADHD probands and population controls. If we observe a deviation from the population mean on the secondary variable in the probands, this is evidence for a correlation. Equation (A1) estimates the magnitude of the correlation.
Equation (A2) (Appendix 1)
To estimate the bivariate sibling correlation (cross-sibling cross-trait correlation), which provides an index of the shared familiality between ADHD and a secondary variable, we consider the adjusted mean values of the two variables in probands and siblings. If we observe a deviation from the population mean on the secondary variable in siblings, this is evidence for a familial correlation. Equation (A2) estimates the magnitude of the correlation.
RESULTS
Phenotypic analyses on ADHD–control differences
For the ADHD–control comparisons we excluded individuals from the control group who obtained a T score of 63 or greater on the DSM-IV symptom scale on the parent and teacher Conners'. One such case was excluded.
Is ADHD associated with RT variability and slow responding?
A regression model was used, with the RT variables (MRT, s.d. of RTs, CV) entered as response variables and group status (ADHD/control) as the predictor variable. Effect sizes were calculated using Cohen's d with pooled standard deviations: d=M1−M2/σpooled; σpooled=√[(σ12+σ22)/2] (Cohen, Reference Cohen1998). In the baseline condition the ADHD group, compared to the control group, had slower MRT [all trials: t(176)=−4·65, p<0·001, d=0·71; 30 trials: t(179)=−4·51, p<0·001, d=0·76], greater s.d. of RTs [all trials: t(176)=−5·92, p<0·001, d=0·93; 30 trials: t(179)=−5·48, p<0·001, d=0·92] and CV [all trials: t(176)=−5·96, p<0·001, d=0·94; 30 trials: t(179)=−5·33, p<0·001, d=0·84]. ADHD probands also had slower MRT [t(173)=−3·55, p<0·001, d=0·54], greater s.d. of RTs [t(173)=−5·24, p<0·001, d=0·83] and CV [t(173)=−5·52, p<0·001, d=0·86] than the control group in the fast-incentive condition.
To examine whether the MRT effect (d=0·71, Table 2) could be secondary to the effect of s.d. of RTs (d=0·93, Table 2), we conducted additional ADHD–control comparisons on MRT, controlling for s.d. of RTs: the group difference on MRT did not remain significant [t(176)=1·41, p=0·16, d=0·22]. By contrast, the ADHD–control group difference on s.d. of RTs, when controlling for MRT, remained significant [t(176)=−3·93, p<0·001, d=0·67].
Shared familial effects on ADHD and performance on the Fast Task
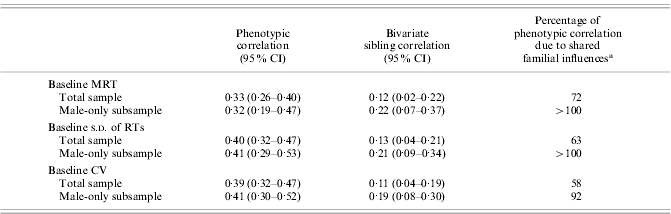
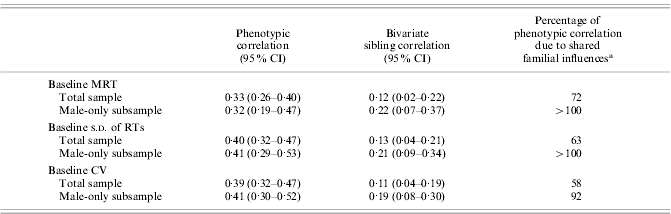
ADHD, Attention deficit hyperactivity disorder; CI, confidence interval; MRT, mean reaction time; s.d., standard deviation; RT, reaction time; CV, coefficient of variation.
a Under the assumption that familial effects are entirely due to genetic effects (see Discussion): percentage of phenotypic correlation due to shared familial influences=(2×bivariate sibling correlation)/phenotypic correlation.
Is there significant improvement in speed and RT variability from baseline to fast-incentive condition, with greater improvement within the ADHD group compared to the control group?
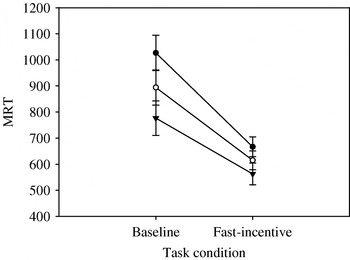
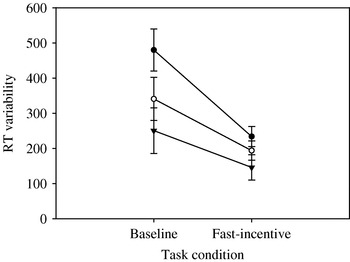
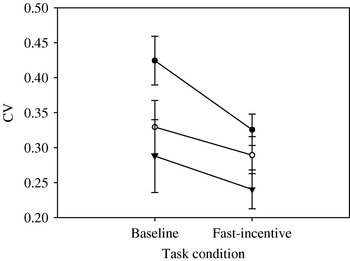
A regression model was used, with the difference score (baseline−fast-incentive) entered as the response variable and group (ADHD/control) as the predictor variable. Both groups improved significantly in MRT [ADHD: t(225)=20·27, p<0·001; controls: t(225)=13·30, p<0·001] and s.d. of RTs [ADHD: t(225)=11·96, p<0·001; controls: s.d. t(225)=5·16, p<0·001] from baseline to the fast-incentive condition. Significant improvement was found for CV in the ADHD group [t(225)=5·44, p<0·001] from baseline to the fast-incentive condition, but not for the control group [t(225)=1·48, p=0·14]. The ADHD group improved significantly more than the control group in MRT [t(225)=−3·57, p<0·001] and s.d. of RTs [t(225)=−2·50, p<0·02] from baseline to the fast-incentive condition. The group difference in the degree of improvement across conditions for CV did not reach significance [t(225)=−1·64, p=0·10]. Figs 1–3 show group means with 95% confidence intervals for the ADHD and control groups, as well as those of the siblings of the ADHD probands, on each of the RT variables in both conditions.
Mean reaction time (MRT) in baseline and fast-incentive conditions (with 95% confidence intervals): ADHD probands (–●–), siblings of probands (–○–) and control group (–▼–).

Reaction time (RT) variability in baseline and fast-incentive conditions (with 95% confidence intervals): ADHD probands (–●–), siblings of probands (–○–) and control group (–▼–).

Coefficient of variation (CV) in baseline and fast-incentive conditions (with 95% confidence intervals): ADHD probands (–●–), siblings of probands (–○–) and control group (–▼–).

We additionally carried out analyses on ADHD–control differences, (i) controlling for IQ and (ii) excluding girls, with the pattern of results staying the same (data not shown) with one exception. With girls excluded, the interaction effect for CV became significant, with the ADHD group improving significantly more than the control group from baseline to the fast-incentive condition [t(183)=−1·98, p<0·05]. RT variables correlated with IQ in the range of 0·00 to −0·30 for ADHD probands, −0·17 to −0·26 for siblings of ADHD probands, and −0·07 to −0·32 for the control group.
Phenotypic and bivariate sibling correlations
The RT variables used in these analyses are those from the baseline condition, which were strongly associated with ADHD.
To calculate bivariate sibling correlations, both RT variables and ADHD scores were standardized. For ADHD scores, we obtained a mean from both parent and teacher Conners' T scores for the DSM-IV total ADHD symptoms scale for the whole sample. As the Conners' scale has a mean of 50, we subtracted 50 from the combined parent and teacher scores and then divided this score by the standard deviation of 10. The Conners' scale has a ceiling score of 90, so we replaced the scores at the ceiling (2·66667) by the expected value of a normal variate above the ceiling (2·97515). We followed the same formula to standardize the RT variables: we subtracted the mean and divided this score by the standard deviation of the control sample.
Phenotypic correlations ranging from 0·33 to 0·40 (Table 2) confirmed the association between ADHD and RT performance. Bivariate sibling correlations on these variables ranged from 0·11 to 0·13 (Table 2), indicating shared familial effects on ADHD and RT performance. The position of the siblings' scores in between the scores for the ADHD and control groups is illustrated in Figs 1–3.
We also calculated the phenotypic correlations and sibling correlations for a male-only subsample (Table 2). Phenotypic correlations were similar in magnitude to the total sample. Bivariate sibling correlations were somewhat higher for the male-only subsample compared to the total sample.
Under the assumption of the familial effects representing genetic influences (see Discussion and Appendix 2), the proportion of the phenotypic correlation between ADHD and the RT variable due to shared familial influences was estimated as 58–72% for the entire sample and 92–100% for the male-only subsample (Table 2, column 3).
DISCUSSION
With a large, international sibling-pair sample we investigated the stability of impairment in RT performance in ADHD across task conditions and its potential as a candidate endophenotype. First, the data confirmed the previous finding of an association between ADHD and slow and highly variable RTs (Oosterlaan & Sergeant, Reference Oosterlaan and Sergeant1998; Kuntsi et al. Reference Kuntsi, Oosterlaan and Stevenson2001, Reference Kuntsi, Andreou, Ma, Borger and van der Meere2005; Scheres et al. Reference Scheres, Oosterlaan and Sergeant2001; Banaschewski et al. Reference Banaschewski, Brandeis, Heinrich, Albrecht, Brunner and Rothenberger2003; Bellgrove et al. Reference Bellgrove, Hawi, Kirley, Fitzgerald, Gill and Robertson2005b; Berwid et al. Reference Berwid, Curko Kera, Marks, Santra, Bender and Halperin2005; Drechsler et al. Reference Drechsler, Brandeis, Foldenyi, Imhof and Steinhausen2005; Klein et al. Reference Klein, Wendling, Huetter and Peper2006).
The meaning of this association has been under much debate recently (Bellgrove et al. Reference Bellgrove, Hawi, Kirley, Fitzgerald, Gill and Robertson2005b; Castellanos et al. Reference Castellanos, Sonuga-Barke, Scheres, Di Martino, Hyde and Walters2005), but the lack of explicit, testable predictions continues to impede efforts to prove or falsify the proposed models. An overall distinction can be made between models that predict stable cognitive impairments in ADHD and those that predict fluctuating cognitive performance that is dependent on state factors, such as motivation or arousal, and that is greater than the fluctuations in cognitive performance observed in non-ADHD populations. Following the latter approach, we examined the extent to which RT variability (s.d. of RTs) and speed improve in ADHD under a condition with fast presentation rate of stimuli and incentives. Confirming our second hypothesis, the ADHD group improved significantly more than the control group on both MRT and RT variability. This supports previous studies that have tested the effects of event rate (Scheres et al. Reference Scheres, Oosterlaan and Sergeant2001) and incentives (Slusarek et al. Reference Slusarek, Velling, Bunk and Eggers2001) separately. Whereas our study aimed to maximally optimize arousal/activation state by combining the event rate and incentive manipulation within a single condition, in future research these could be studied separately to examine the differential effects of presentation rate of stimuli and incentives.
Although the performance of the ADHD group in the fast-incentive condition exceeded the control group's baseline performance, differences between the groups remained in the fast-incentive condition because of further significant improvement across conditions for the control group. Previous studies have also reported that, although task manipulations improve performance of children with ADHD more than that of comparison groups, some differences can remain (Scheres et al. Reference Scheres, Oosterlaan and Sergeant2001; Wiersema et al. Reference Wiersema, van der Meere, Roeyers, Van Coster and Bayens2006). The state regulation account considers that any remaining group differences are due to the ADHD group not having reached a completely optimal arousal, activation or effort state (i.e. optimal manipulations can be difficult to achieve, especially as part of a lengthy testing session where fatigue effects may be involved). Alternatively, additional processes, such as aspects of executive function, may be involved (Nigg, Reference Nigg2005; reviewed in Kuntsi et al. Reference Kuntsi, McLoughlin and Asherson2006a). It is not clear, however, how some theoretical accounts, such as that of temporal processing deficit (Castellanos & Tannock, Reference Castellanos and Tannock2002) could explain greater improvement in children with ADHD in conditions with a fast event presentation rate or incentives.
We used the CV as an additional index of IV, demonstrating its association with ADHD. This index reflects RT variability while simultaneously ‘controlling’ for MRT differences. Yet the usefulness of this index in ADHD research is debatable, as ‘controlling’ for response slowing would not be appropriate if the same processes that cause variability also contribute to response slowing, as suggested, for example, by recent psychometric analyses (Klein et al. Reference Klein, Wendling, Huetter and Peper2006). In other words, if there is a single cause for both the slow and variable RTs in ADHD, controlling for one removes part of the real variance being studied.
Our third hypothesis focused on the RT indices as a potential endophenotype in ADHD. For endophenotypes to be useful in psychiatric genetic research, they need to be familial and show shared familial effects with those on the disorder (Gottesman & Shields, Reference Gottesman and Shields1973; Gottesman & Gould, Reference Gottesman and Gould2003). Having calculated phenotypic correlations that, at 0·3–0·4, confirmed the association between the ADHD and RT indices, we calculated bivariate sibling correlations using formulae that are presented here for the first time [based on the group heritability approach described by DeFries & Fulker (Reference DeFries and Fulker1985, Reference DeFries and Fulker1988)].
The bivariate correlations (Table 2; column 2) can be interpreted in relation to the phenotypic correlations under the assumption that the familial effects are due to genetic effects with no influence of shared environment. This is a reasonable assumption because previous twin studies indicate that familial influences on both ADHD (Faraone & Doyle, Reference Faraone and Doyle2000) and RT performance (Kuntsi et al. Reference Kuntsi, McLoughlin and Asherson2006b) are due largely to genetic effects with minimal effects of shared environment. Recent work on a population sample of 400 twin pairs (ages 7–9) shows heritabilities of 55% for MRT and 37% for RT variability for the baseline condition of the Fast Task, with no shared environmental contribution (Kuntsi et al. Reference Kuntsi, McLoughlin and Asherson2006b), and absence of shared environmental effects on ADHD has been reported in most twin studies to date (reviewed in Thapar et al. Reference Thapar, Holmes, Poulton and Harrington1999).
Under this assumption we can estimate that the percentage of the phenotypic correlation that is due to shared familial effects on ADHD and RT performance is around 60–70% for the whole sample and 90–100% for the male-only subsample (Table 2, column 3). The finding of shared familial influences on ADHD and RT performance confirms and extends the findings from the two initial studies (Kuntsi & Stevenson, Reference Kuntsi and Stevenson2001; Nigg et al. Reference Nigg, Blaskey, Stawicki and Sachek2004).
Although these findings suggest that the finding in this study of familiality between ADHD and RT performance is likely to be due to genetic influences, the study design using fraternal siblings does not enable us to be entirely confident in this conclusion. Further studies using twin designs are therefore needed to clarify the proportion of shared genetic and environmental influences involved in the familial effects observed in this study.
Another consideration is the use of the DF approach and our study design of using ADHD probands and siblings, which focuses on the tail of the distribution rather than necessarily being representative of the entire population. Barring any major variance–covariance differences, the evidence presented in this paper indicates that shared familial effects appear to be the major constituent component of the phenotypic correlations between ADHD and each of the variables investigated, and this is likely to generalize to quantitative genetic analyses within population twin samples.
An additional influence on estimates from quantitative genetic analyses is measurement error, which is inherent to cognitive testing (see Kuntsi et al. Reference Kuntsi, McLoughlin and Asherson2006b for further discussion). However, as measurement error will lead to underestimates of familial influences, the current estimates can be considered to be encouraging.
A limitation of the study is that we did not achieve a perfect match between the groups on gender. However, additional analyses on the male-only subsample indicated similar phenotypic results (with the exception of group interaction on CV improvement becoming significant). For the familial data the sibling correlations for most variables were somewhat higher for the male-only subsample compared to the total sample, but further investigation is required to determine the potential significance of this.
Whereas the findings were overall relatively similar for both MRT and RT variability, the association with ADHD in the baseline condition was slightly stronger for RT variability than MRT (phenotypic correlations of 0·4 and 0·3 respectively). When controlling for RT variability, the group difference in MRT disappeared. This supports the suggestion by Klein et al. (Reference Klein, Wendling, Huetter and Peper2006) that the processes that give rise to RT variability are also likely to contribute to response slowing (rather than vice versa).
The role of RT variability as an intermediate phenotype between genes and behaviour is supported by preliminary data, suggesting a potential association with genetic variation of the dopamine transporter gene DAT1 (Loo et al. Reference Loo, Specter, Smolen, Hopfer, Teale and Reite2003; Bellgrove et al. Reference Bellgrove, Hawi, Kirley, Fitzgerald, Gill and Robertson2005a). In our planned future analyses we intend to investigate more fully the relationship between cognitive endophenotypes, for which we have evidence of shared familial influences with ADHD, and genetic variants associated with the clinical disorder.
APPENDIX 1
Formulae used to calculate phenotypic [equation (A1)] and bivariate [equation (A2)] sibling correlations
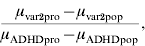
where μvar2pro is the mean of variable 2 in the probands, μvar2pop is the mean of variable 2 in the population, μADHDpro is the mean of ADHD in the probands, and μADHDpop is the mean of ADHD in the population. Both variables are measured in standard deviation units.
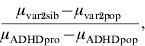
where μvar2sib is the mean of variable 2 in the siblings of probands (variances of the selection variable and the secondary variable have been equated).
APPENDIX 2
Conceptual underpinnings of bivariate DeFries–Fulker (DF) analysis: application to sibling data
As only siblings are present in our sample, we are restricted to estimating the sibling correlation, rather than the contribution of genes (A) and shared environment (C) to the variance. The sibling correlation, which we term familiality (F), is theorized to be half A plus C, as siblings on average share half their genome and share common environment completely. The extension of the DF extremes analysis to a secondary phenotype has a number of potential limitations explained in more detail below.
The aim of univariate DF extremes analysis (analysis of the selected phenotype) is to use selection and correlational structure to decompose the variance for siblings into familial and non-shared environment or measurement error. The heavy selection on the proband aims to ensure that for each effect on the phenotype (e.g. a genetic effect such as a specific risk allele), the proband carries the high-risk version. This extreme selection on the proband partially selects on the family members for anything that is shared between family members. However, as the correlation between siblings is less than 1, the mean of the sibling regresses back to the population mean. Furthermore, the weaker the familiality, the larger the regression of the sibling mean back to the population mean. For the example of a genetic effect on familiality, the sibling of a proband has a 50% chance of sharing the risk allele present in the proband ‘identical-by-descent’ (i.e. inheriting the same maternal or paternal chromosome). If no familial effects were present, then selection on one sibling would yield no change in the mean of the other siblings and the sibling mean would therefore equal the population mean.
In the same way that the extremes analysis works for siblings when considering the selection variable (ADHD in this study), there is selection on a secondary phenotype collected in the proband if the secondary phenotype correlates with the selection phenotype. The sources of this correlation are shared effects: this can be due to genetic effect implying pleiotropy (multiple phenotypic effects from a single variant) or some shared environmental effect between the two. However, rather than having a theoretical framework for the source of this correlation (such as F and E or A, C and E), we can only estimate its magnitude using the same metric of regression back to the mean. This correlation is the phenotypic correlation between the two traits.
Finally, this correlation can be decomposed into familial and environmental effects by examining the regression back to the population mean of the mean of the sibling of the proband. However, the magnitude of the phenotypic correlation has an effect on the power of the decompositions, with smaller correlations yielding less power for the analysis.
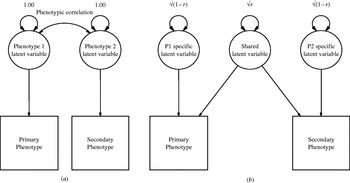
Fig. A1 shows two path diagrams that are equivalent and represent the relationship between the primary and secondary phenotypes. Fig. A1(a) represents the traditional drawing of a phenotypic correlation, with a correlation path on the latent variables. Fig. A1(b) decomposes the Phenotype 1 latent variable and Phenotype 2 latent variable into that which is shared and that which is specific to each phenotype. The shared variance in Fig. A1(b) is what is being decomposed in using DF extremes analysis for the secondary phenotype.
Path diagrams for the relationship between two phenotypes that correlate. r is the phenotypic correlation between the two latent variables.

What is important in this study, however, is what can be determined about the part of the phenotypic structure that does correlate, as we want to estimate the extent to which familial influences explain the phenotypic correlation between ADHD and the secondary variables; and this is the portion of variance in which we can be more confident of our estimates. In the proband–sibling design, common environmental effects are shared between the siblings completely, whereas genetic effects are on average shared 50% of the time because sibling pairs share on average half of their parental chromosomes. As we know from twin studies of ADHD (Thapar et al. Reference Thapar, Holmes, Poulton and Harrington1999; Biederman & Faraone, Reference Biederman and Faraone2002) that 60–90% of the variance in trait scores is due to genetic effects and there is little or no contribution from the shared environment (Faraone & Doyle, Reference Faraone and Doyle2000), we can say that any familial correlation between ADHD and a secondary phenotype (cross-sibling cross-trait correlation) is likely to be genetic in nature. In addition, the recent twin study using the same Fast Task protocol indicated a moderate degree of heritability for baseline RT performance, with no shared environmental contribution (Kuntsi et al. Reference Kuntsi, McLoughlin and Asherson2006b). As a result, we can estimate that the proportion of the phenotypic correlation is explained by shared familial influences. In this study we found that around 72% and 63% of the phenotypic correlation between baseline MRT and s.d. of RTs respectively were the result of shared familial influences.
APPENDIX 3
Definitions, methods of estimation and terminology

ACKNOWLEDGEMENTS
We thank the IMAGE teams from London, Essen, Ghent, Goettingen, Petach-Tikva and Zurich, and the families and schools for their participation. Sample recruitment of the ADHD sample was supported by NIMH Grant R01MH062873 to S. Faraone. The IMAGE-London cognitive endophenotype research is funded by UK Medical Research Council grant G0300189 to J. Kuntsi.
DECLARATION OF INTEREST
None.